
An IoT Assisted Real-Time High CMRR Wireless Ambulatory ECG Monitoring System with Arrhythmia Detection


Abstract
:1. Introduction
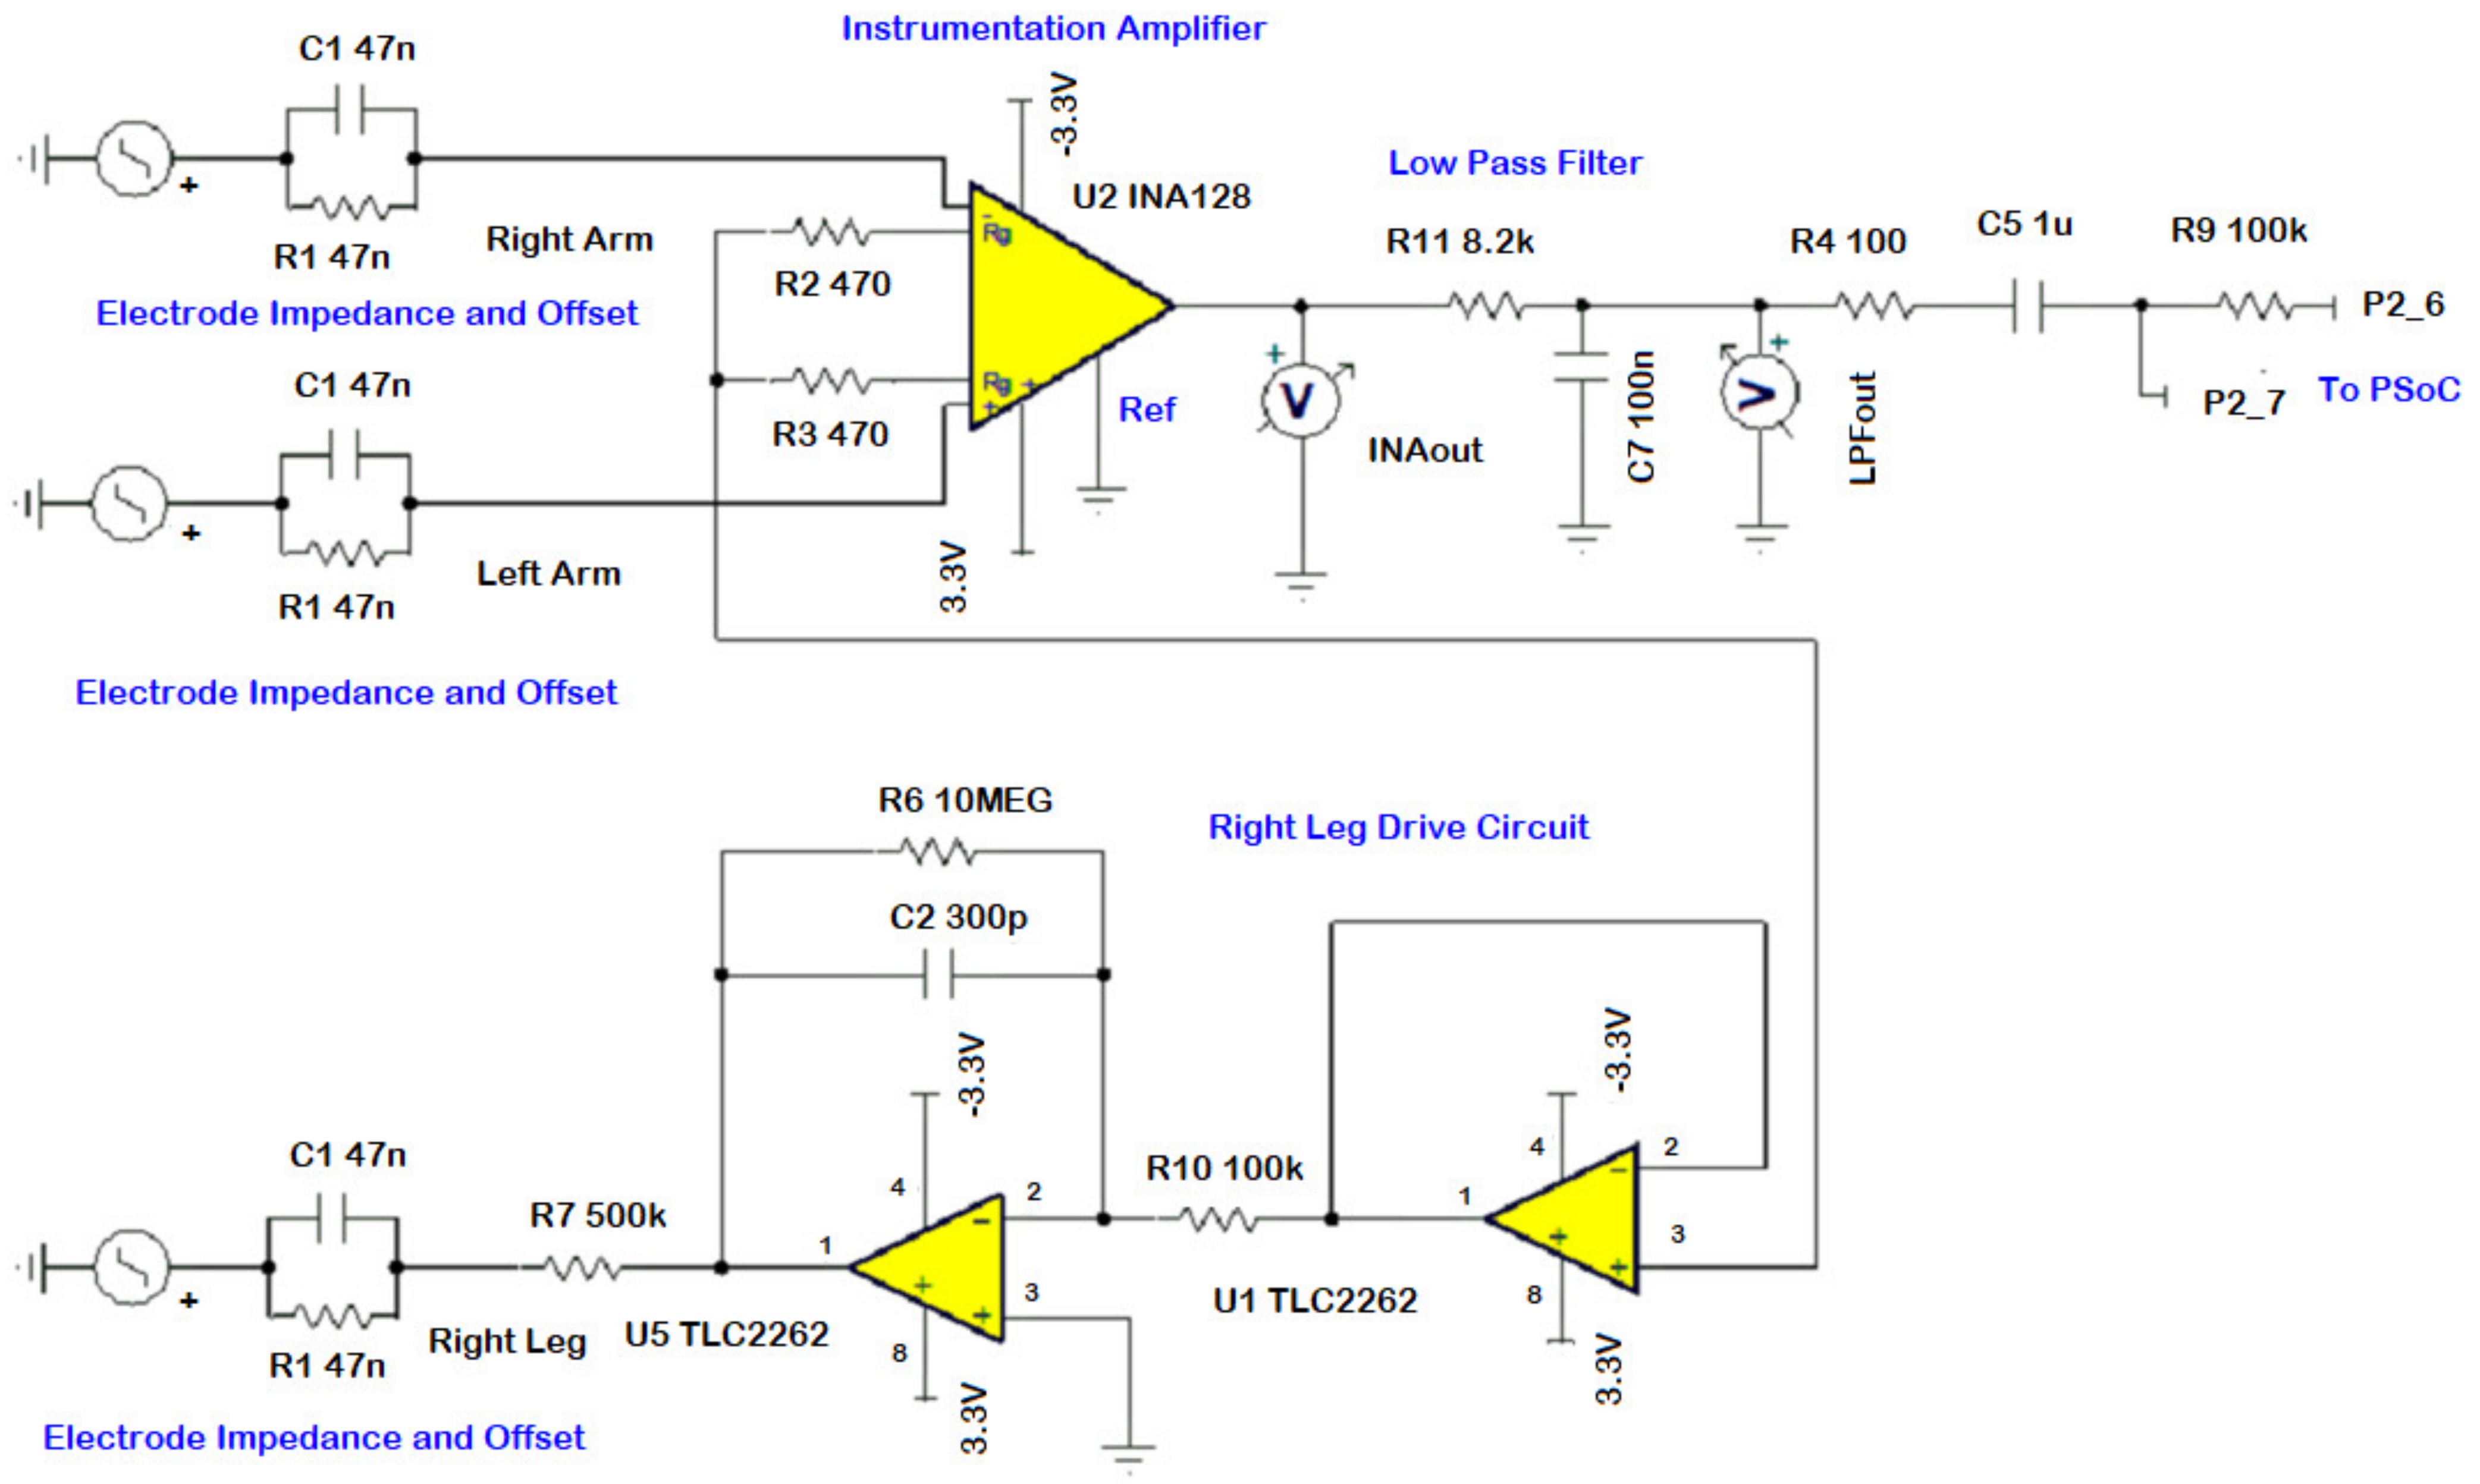
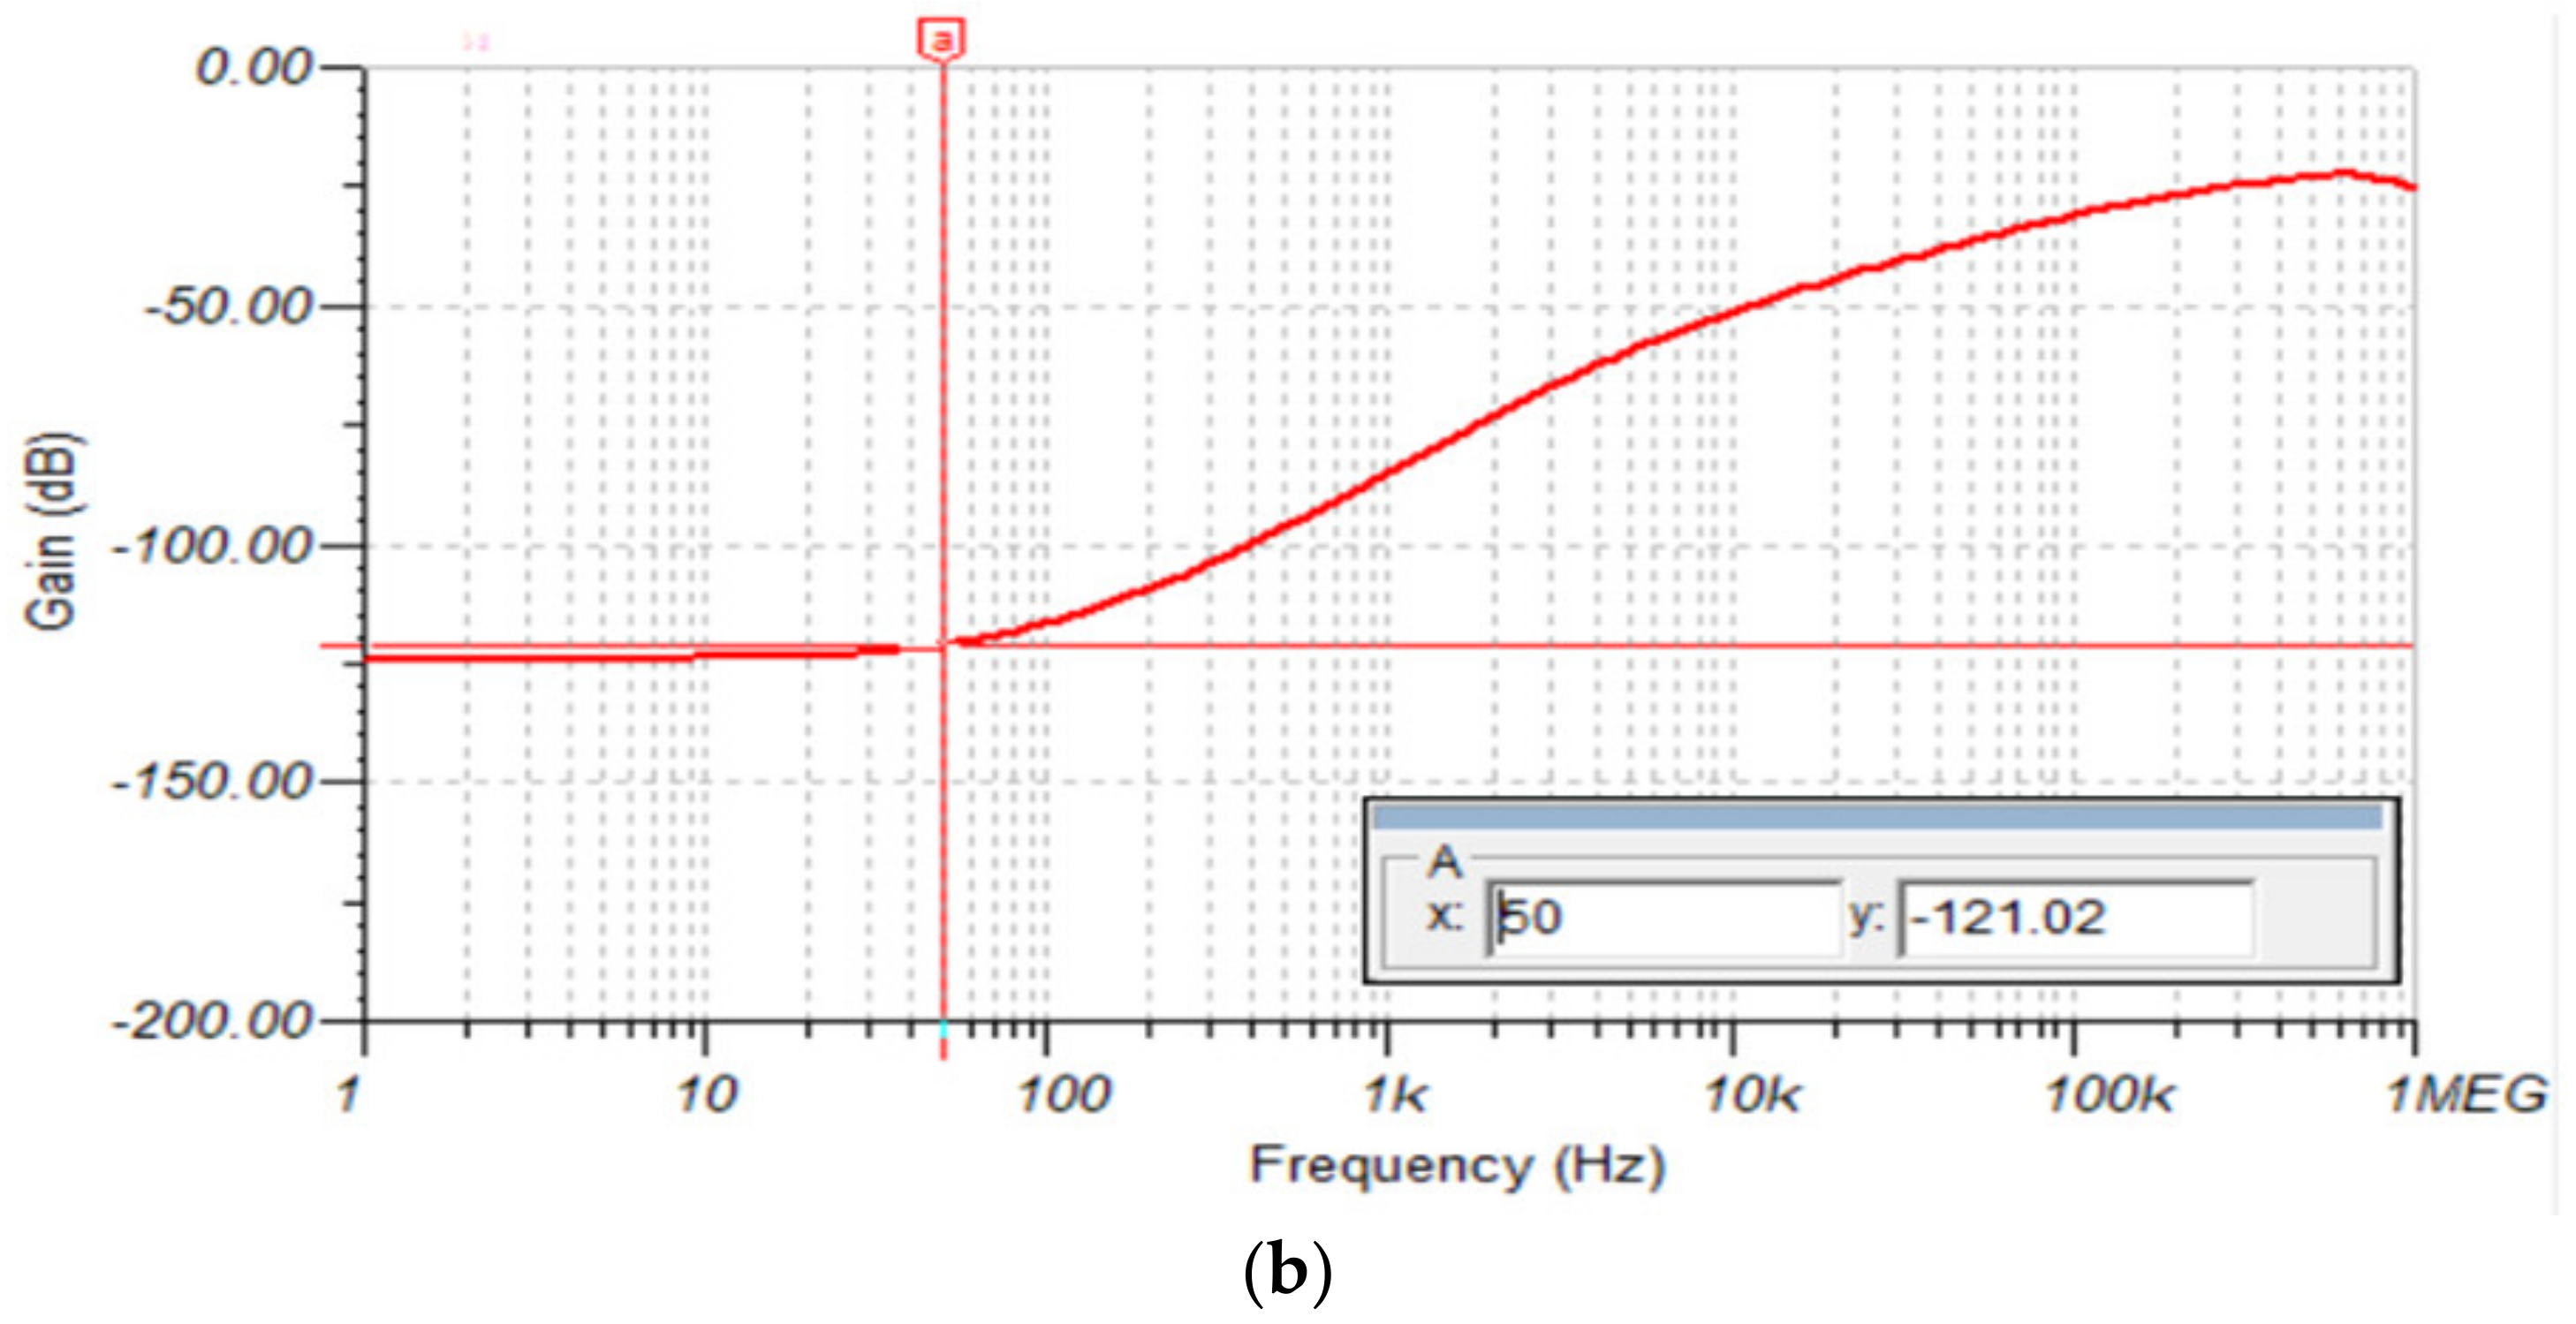
- A right leg drive (RLD) circuit based analog frontend (AFE) with a high CMRR of 121 dB and a digitally implemented notch filter to suppress the power-line frequency noise—for improved diagnostic performance.
- A programmable embedded system-on-chip (PSoC) for conditioning of ECG signals (with integrated digital filtering)—for power optimization of the hardware part, portability, and further noise and interference suppression in the data acquisition device.
- Heart rate calculations in the user’s smartphone (rather than in the wearable ECG device)—for power saving in the wearable device.
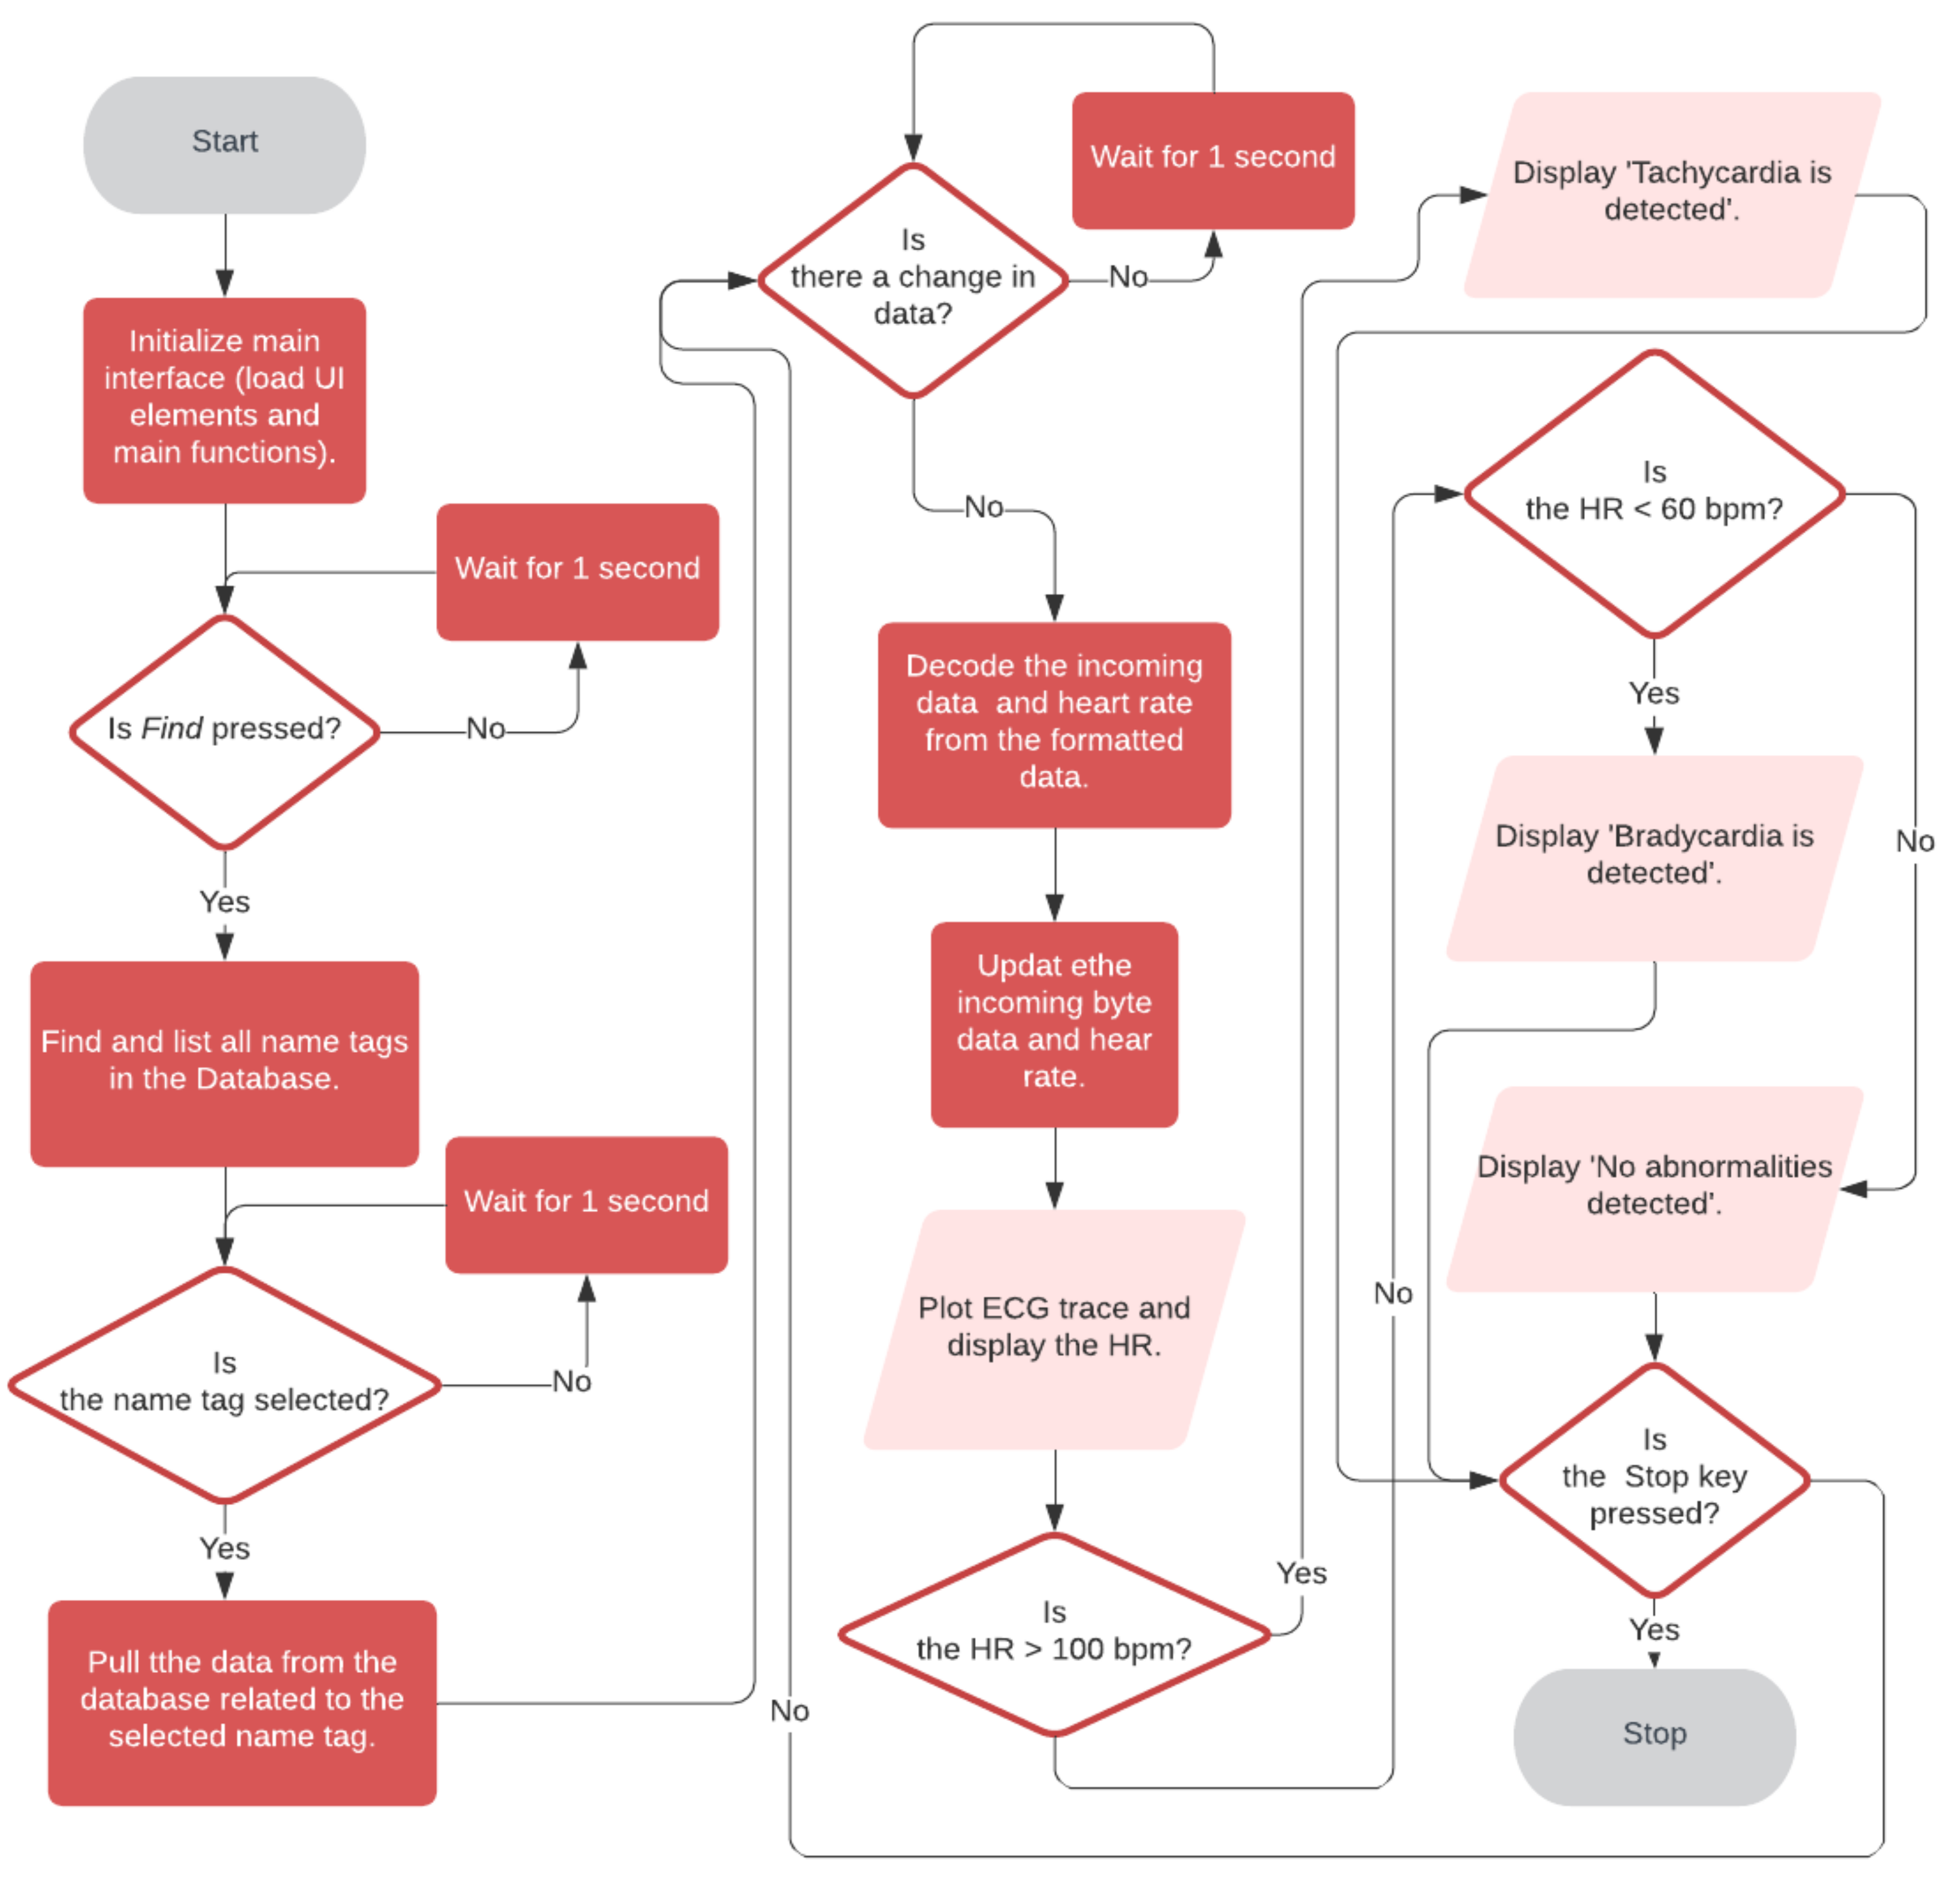
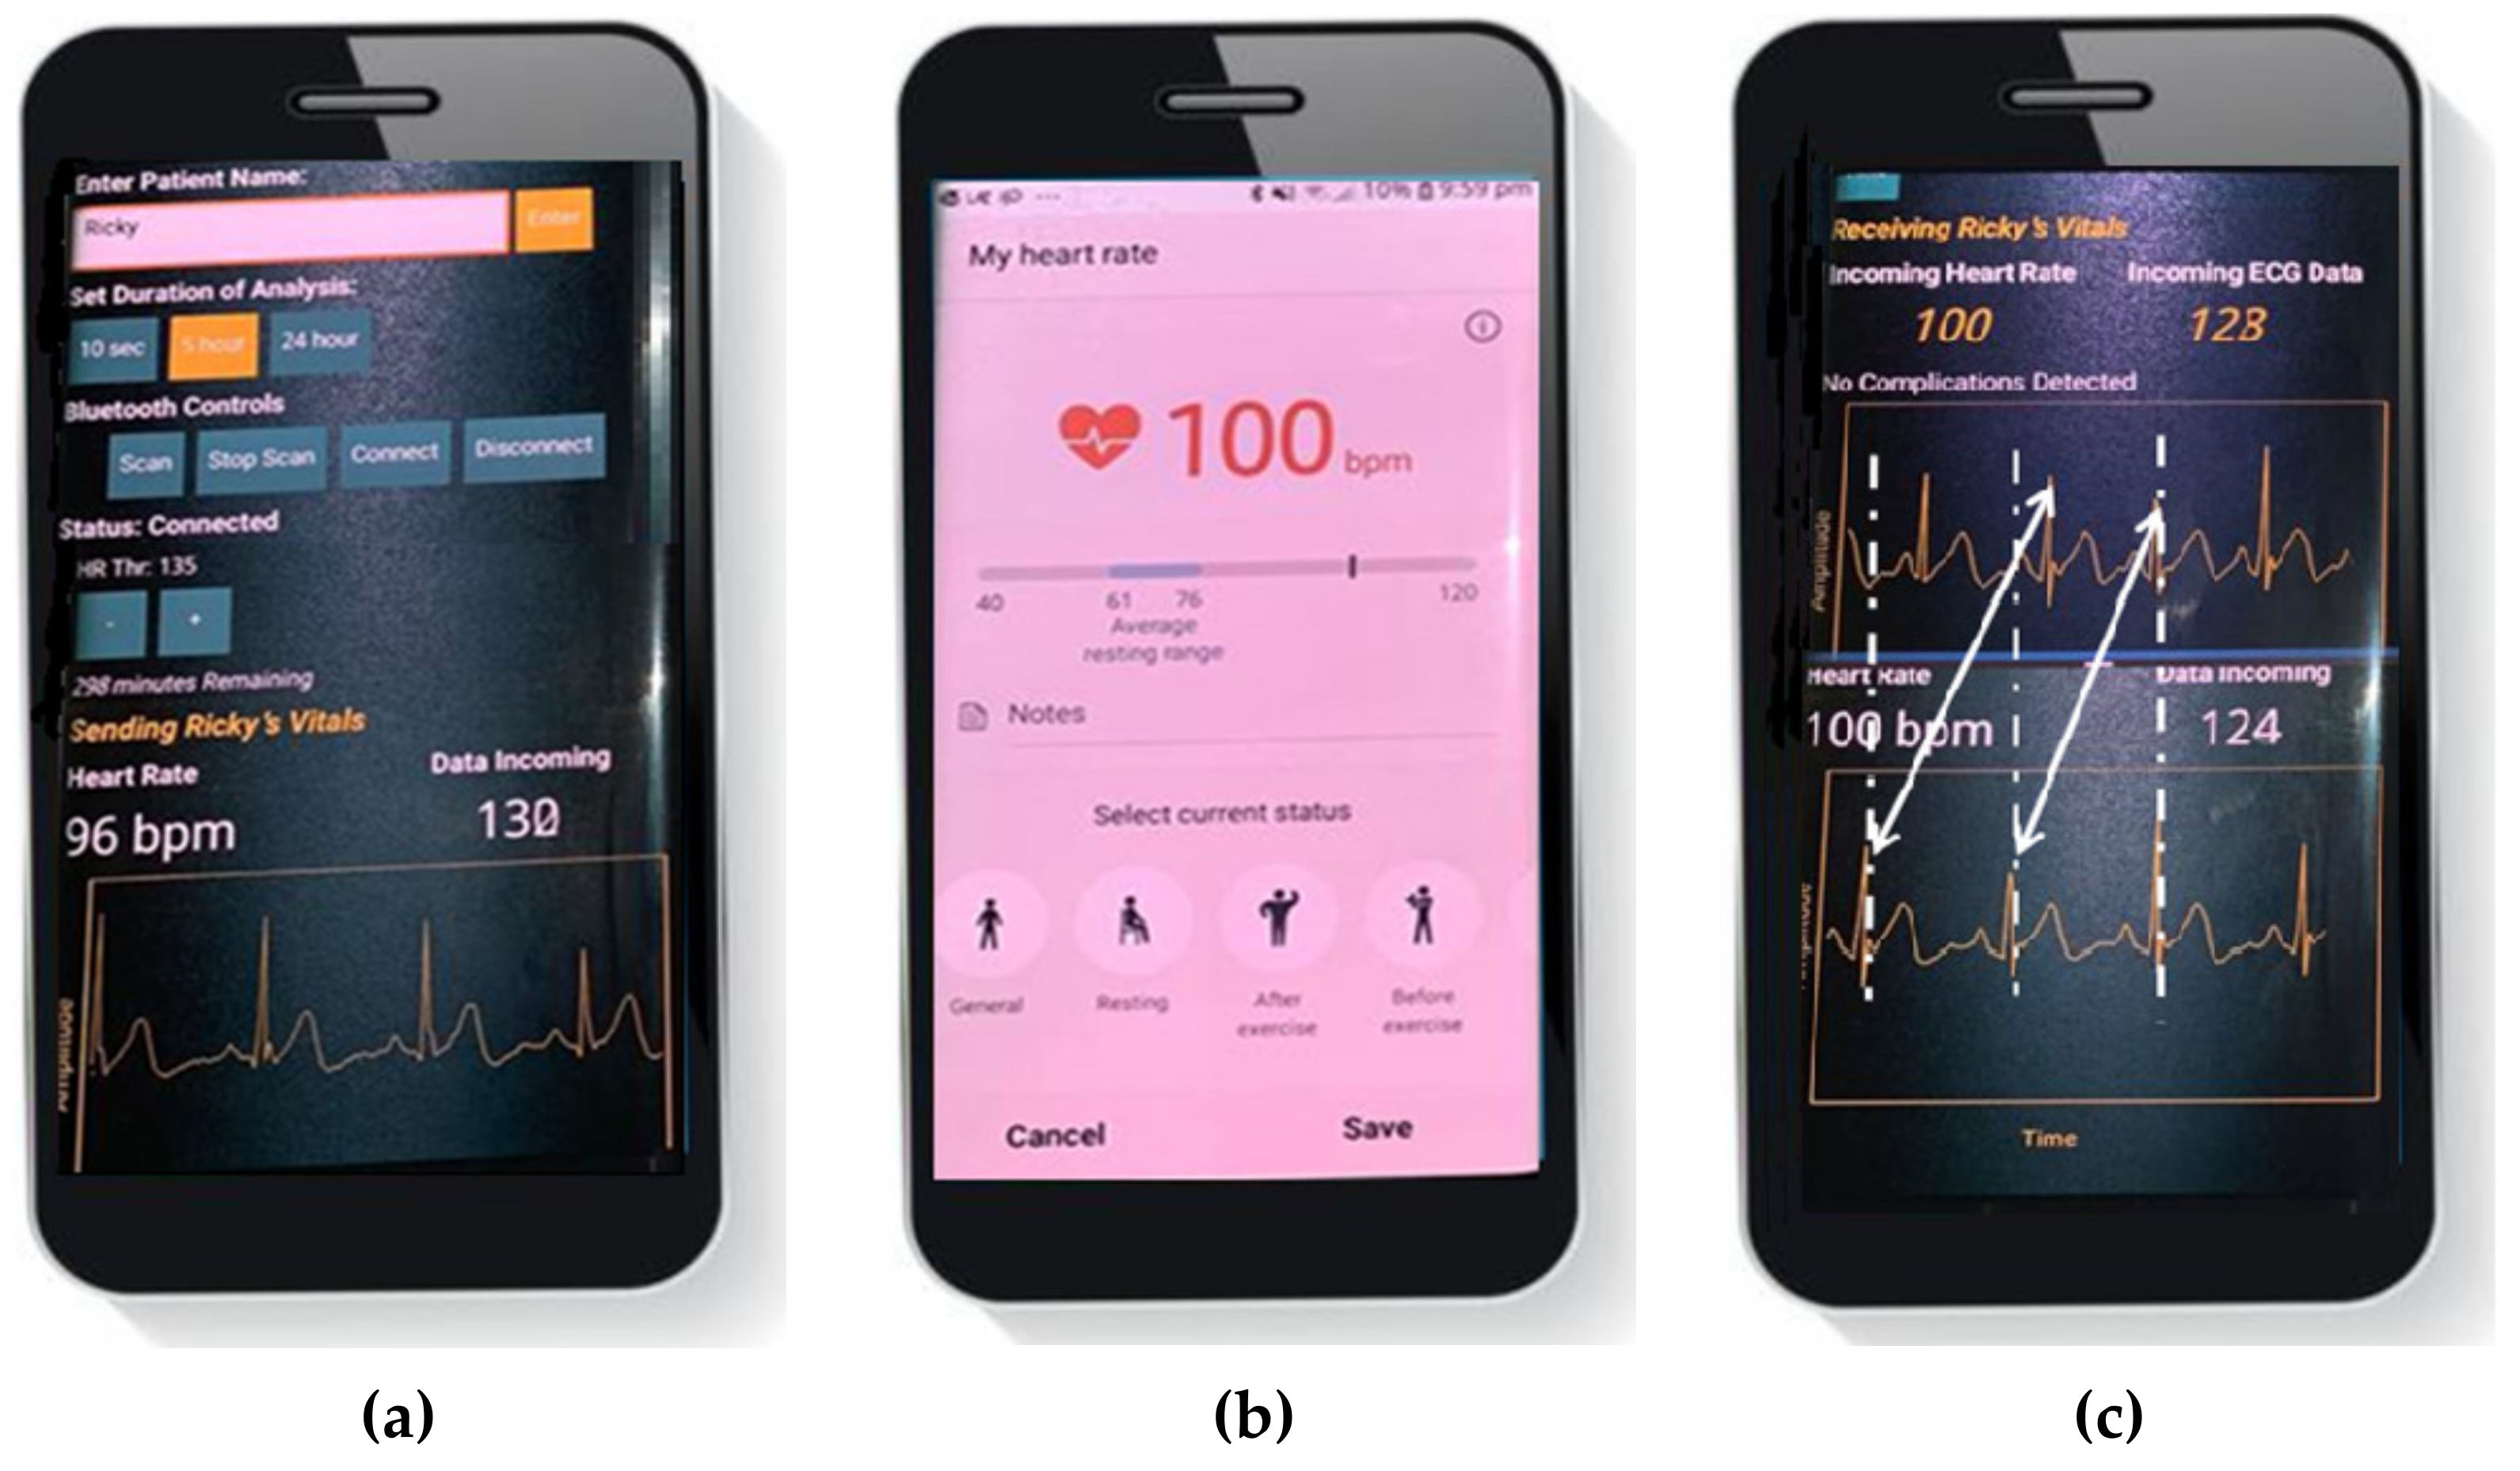
- A smartphone-based application for display of real-time ECG trace and heart rate, and detection of abnormal heart rhythms—for monitoring by the user.
- A smartphone-based application with real-time ECG trace visualization, heart rate detection, and arrhythmia detection capability—for monitoring, assessment, and diagnosis by the user’s doctor.
2. Materials and Methods
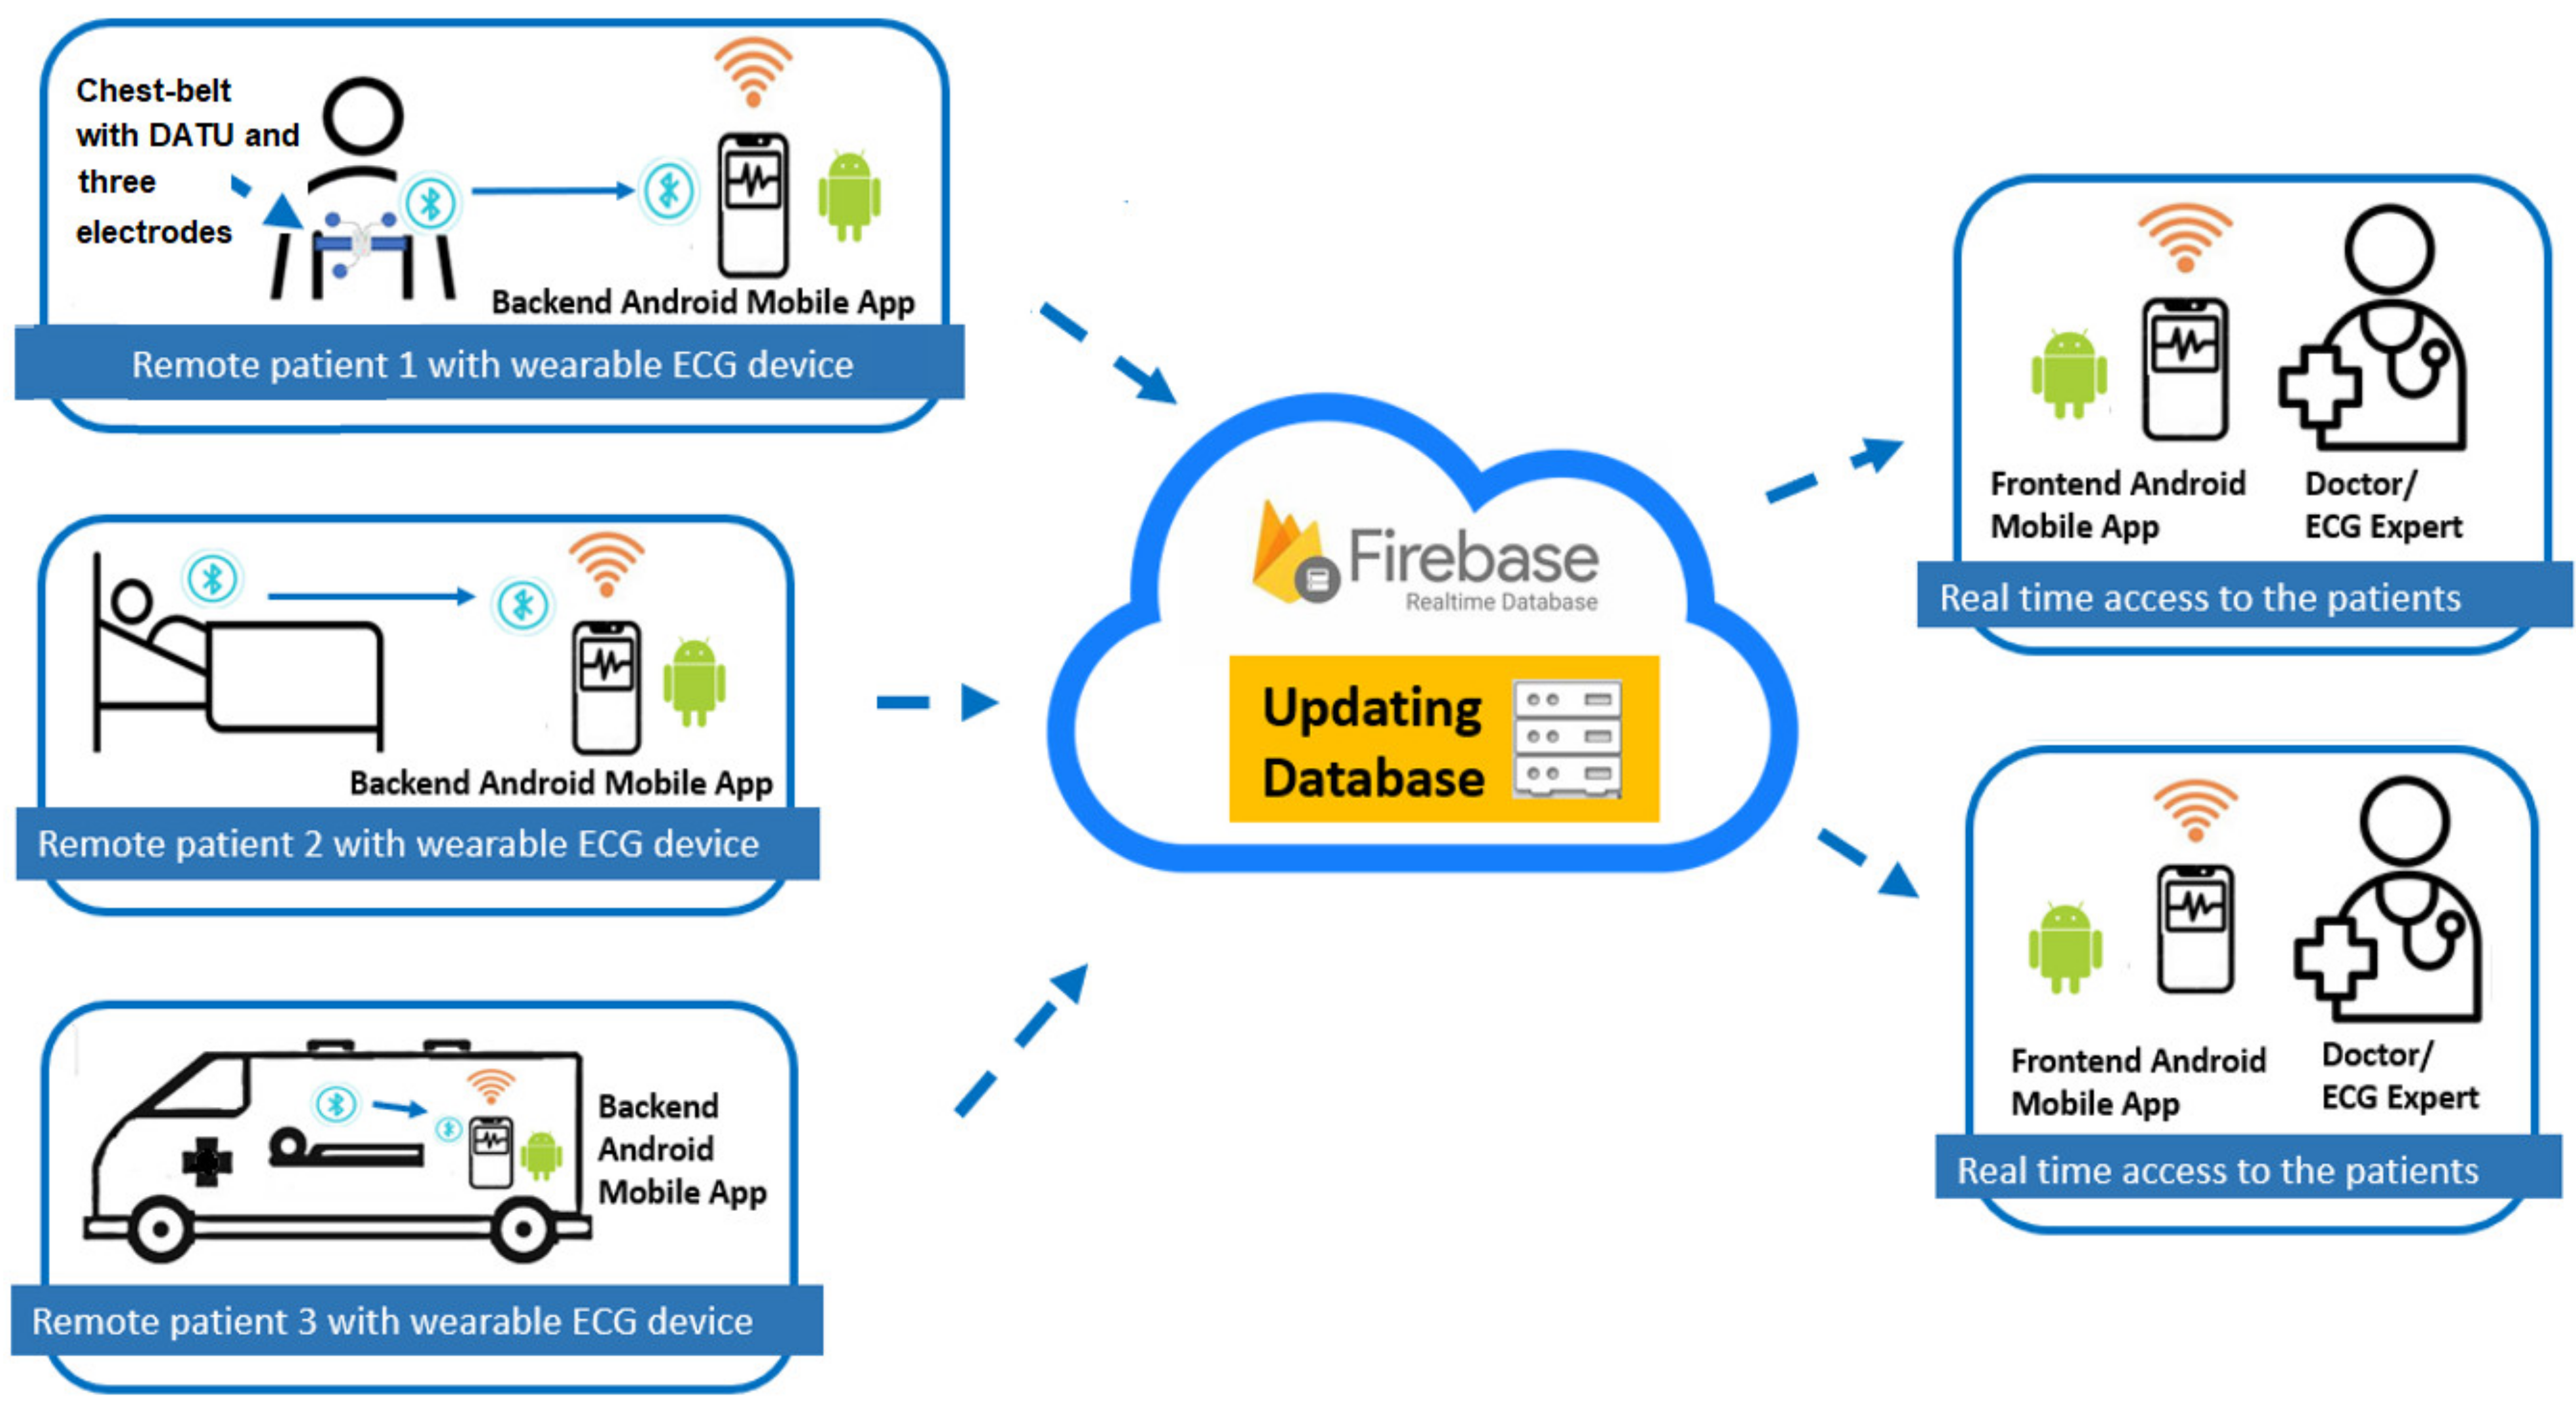
2.1. System Architecture
2.2. System Design and Implementation
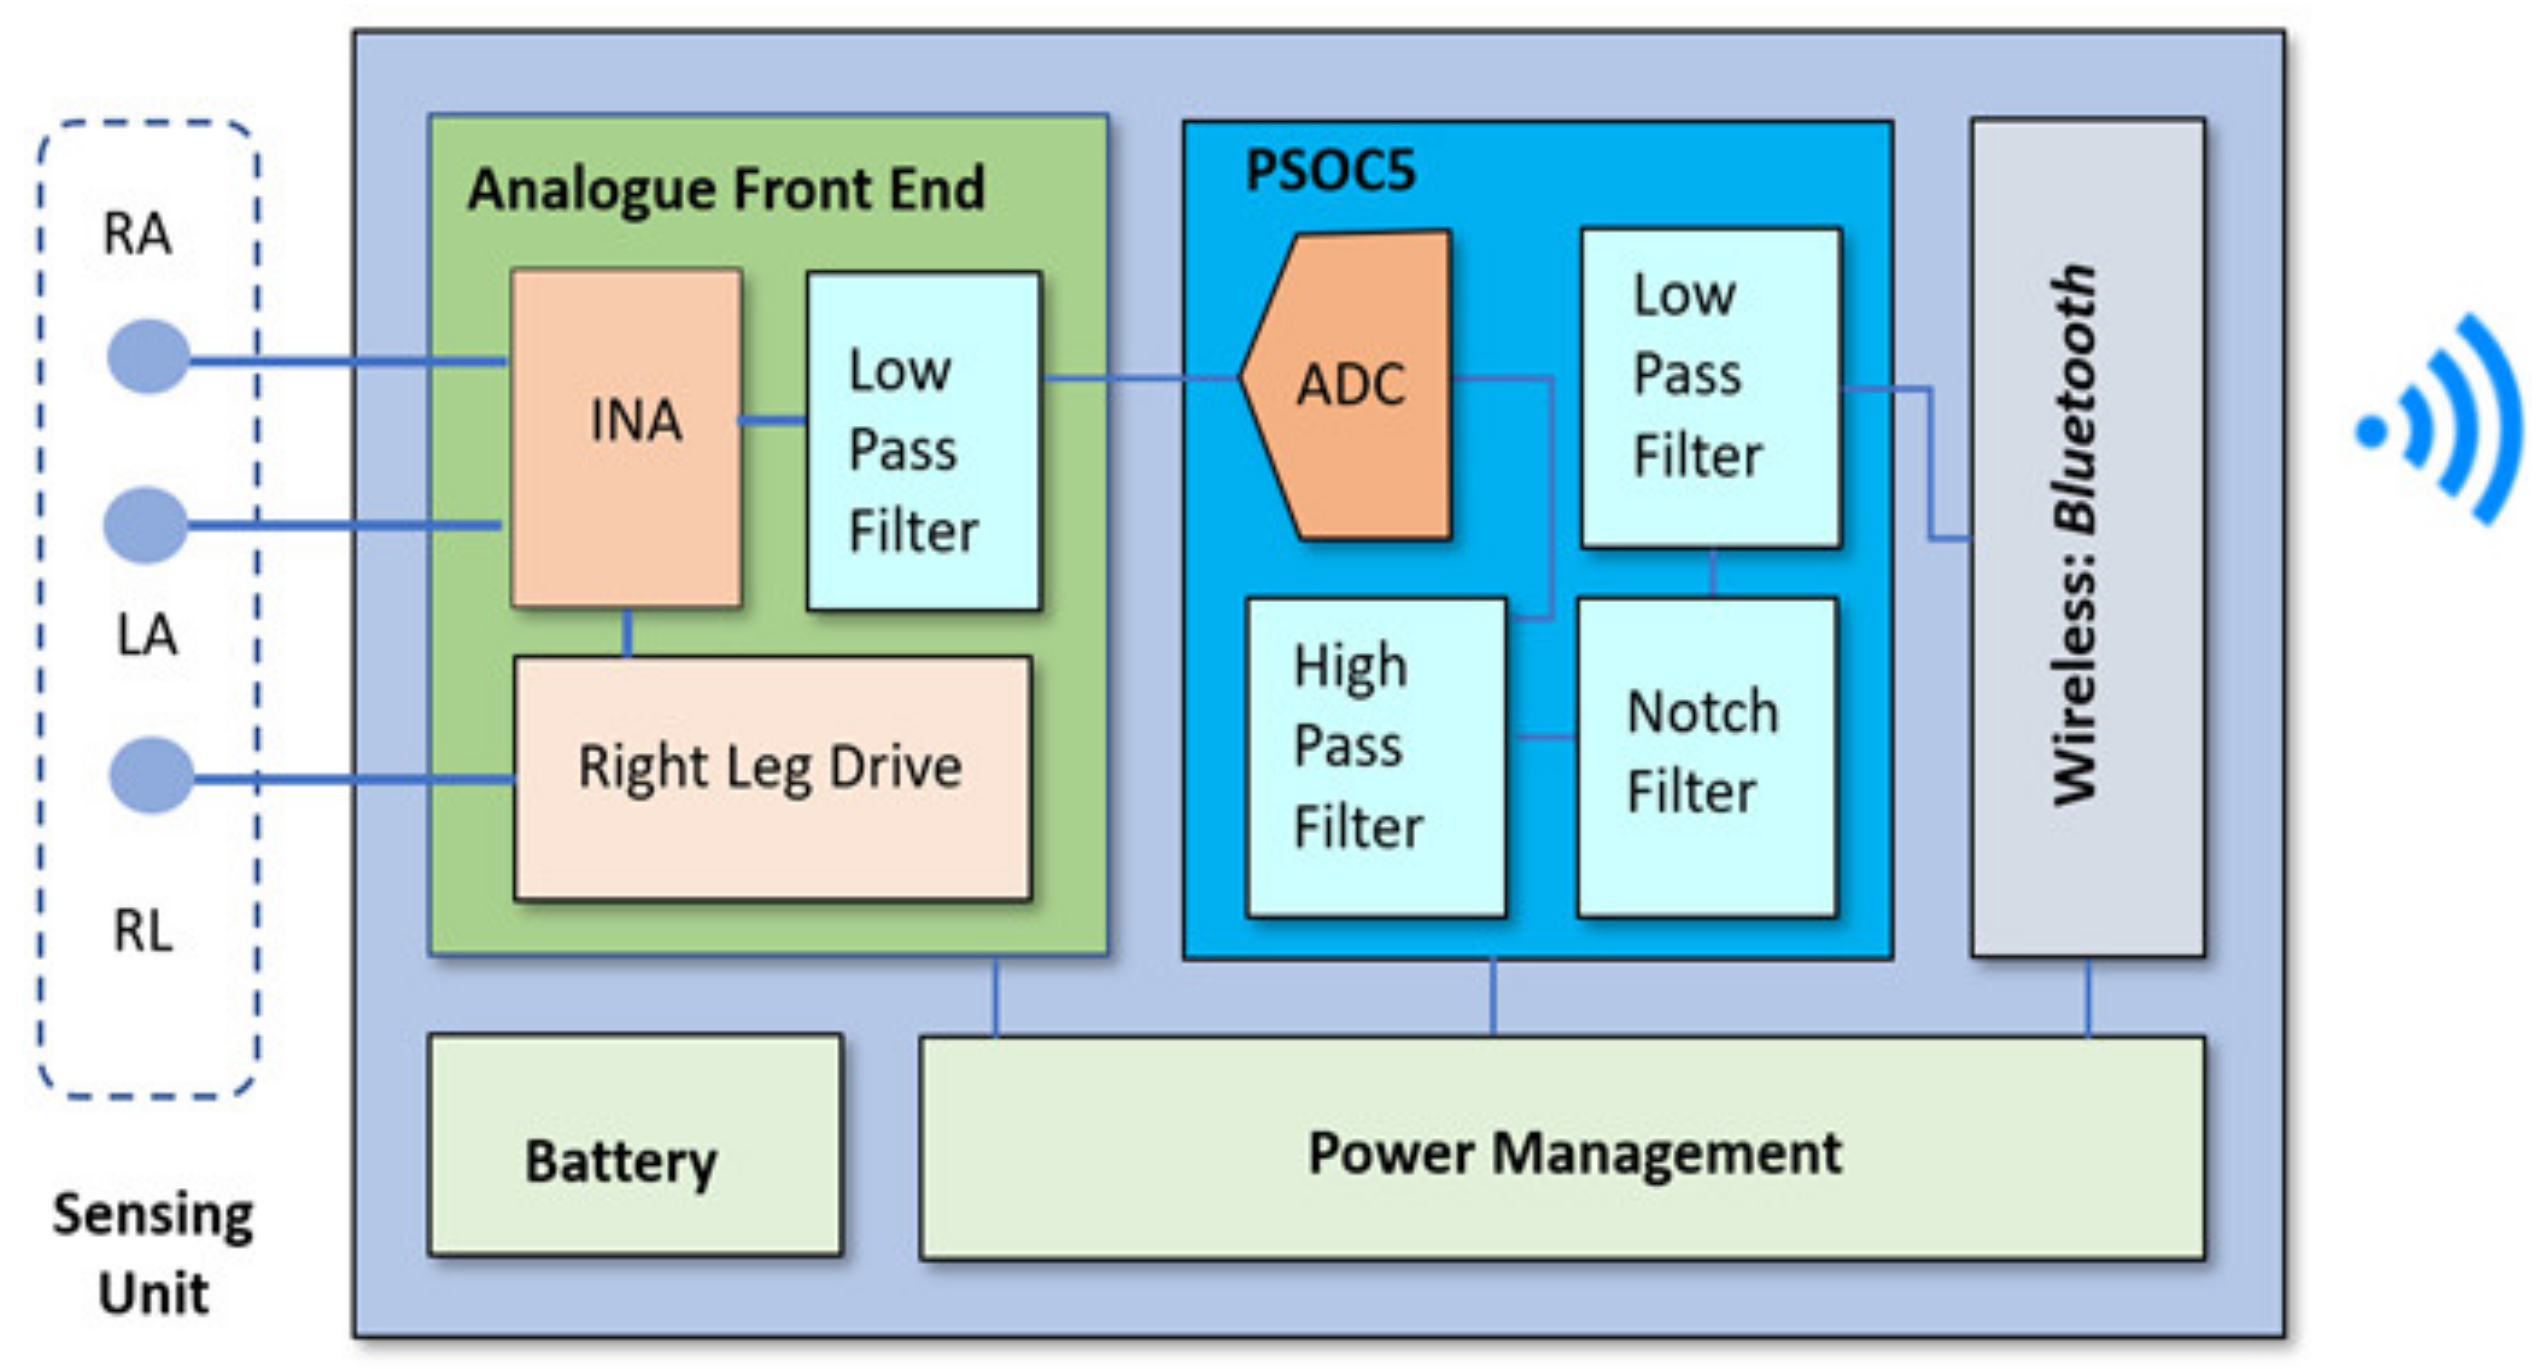
2.2.1. DATU
Sensing Unit
AFE
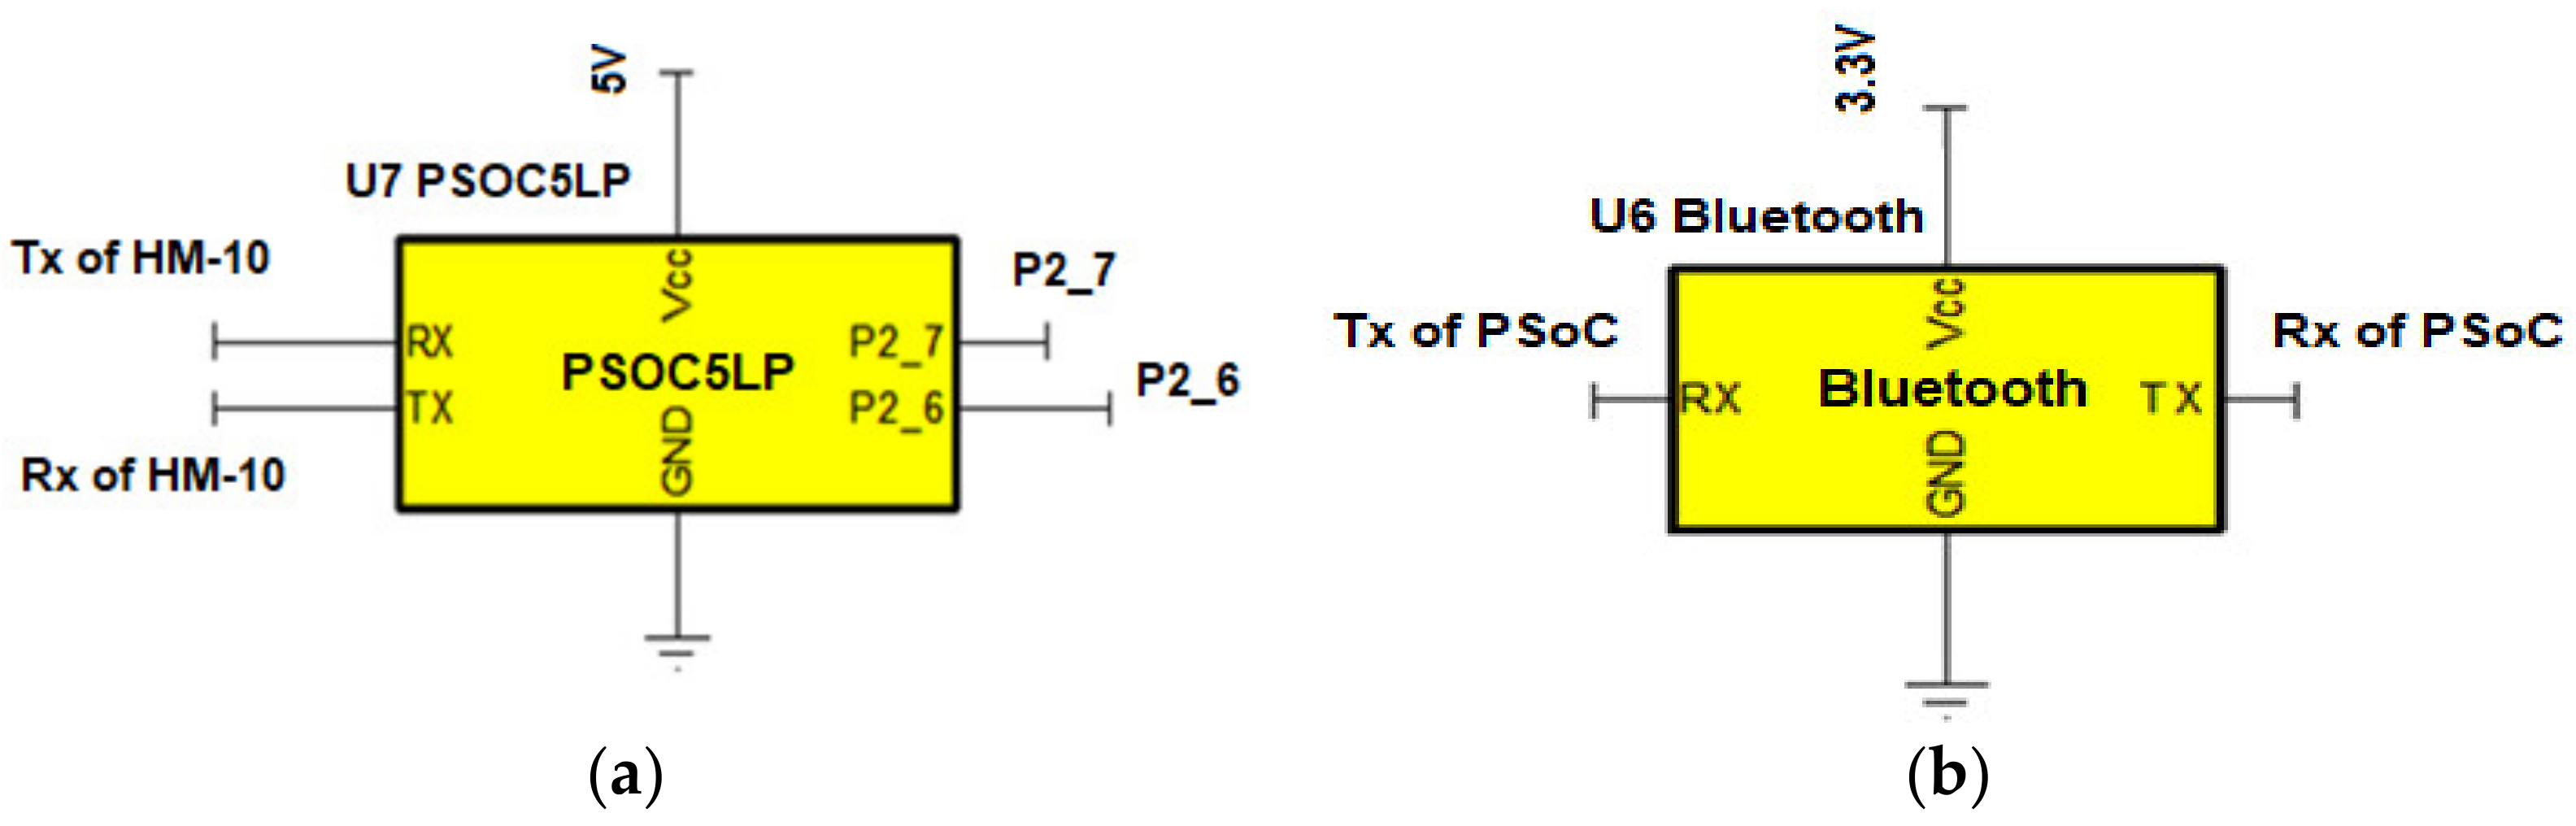
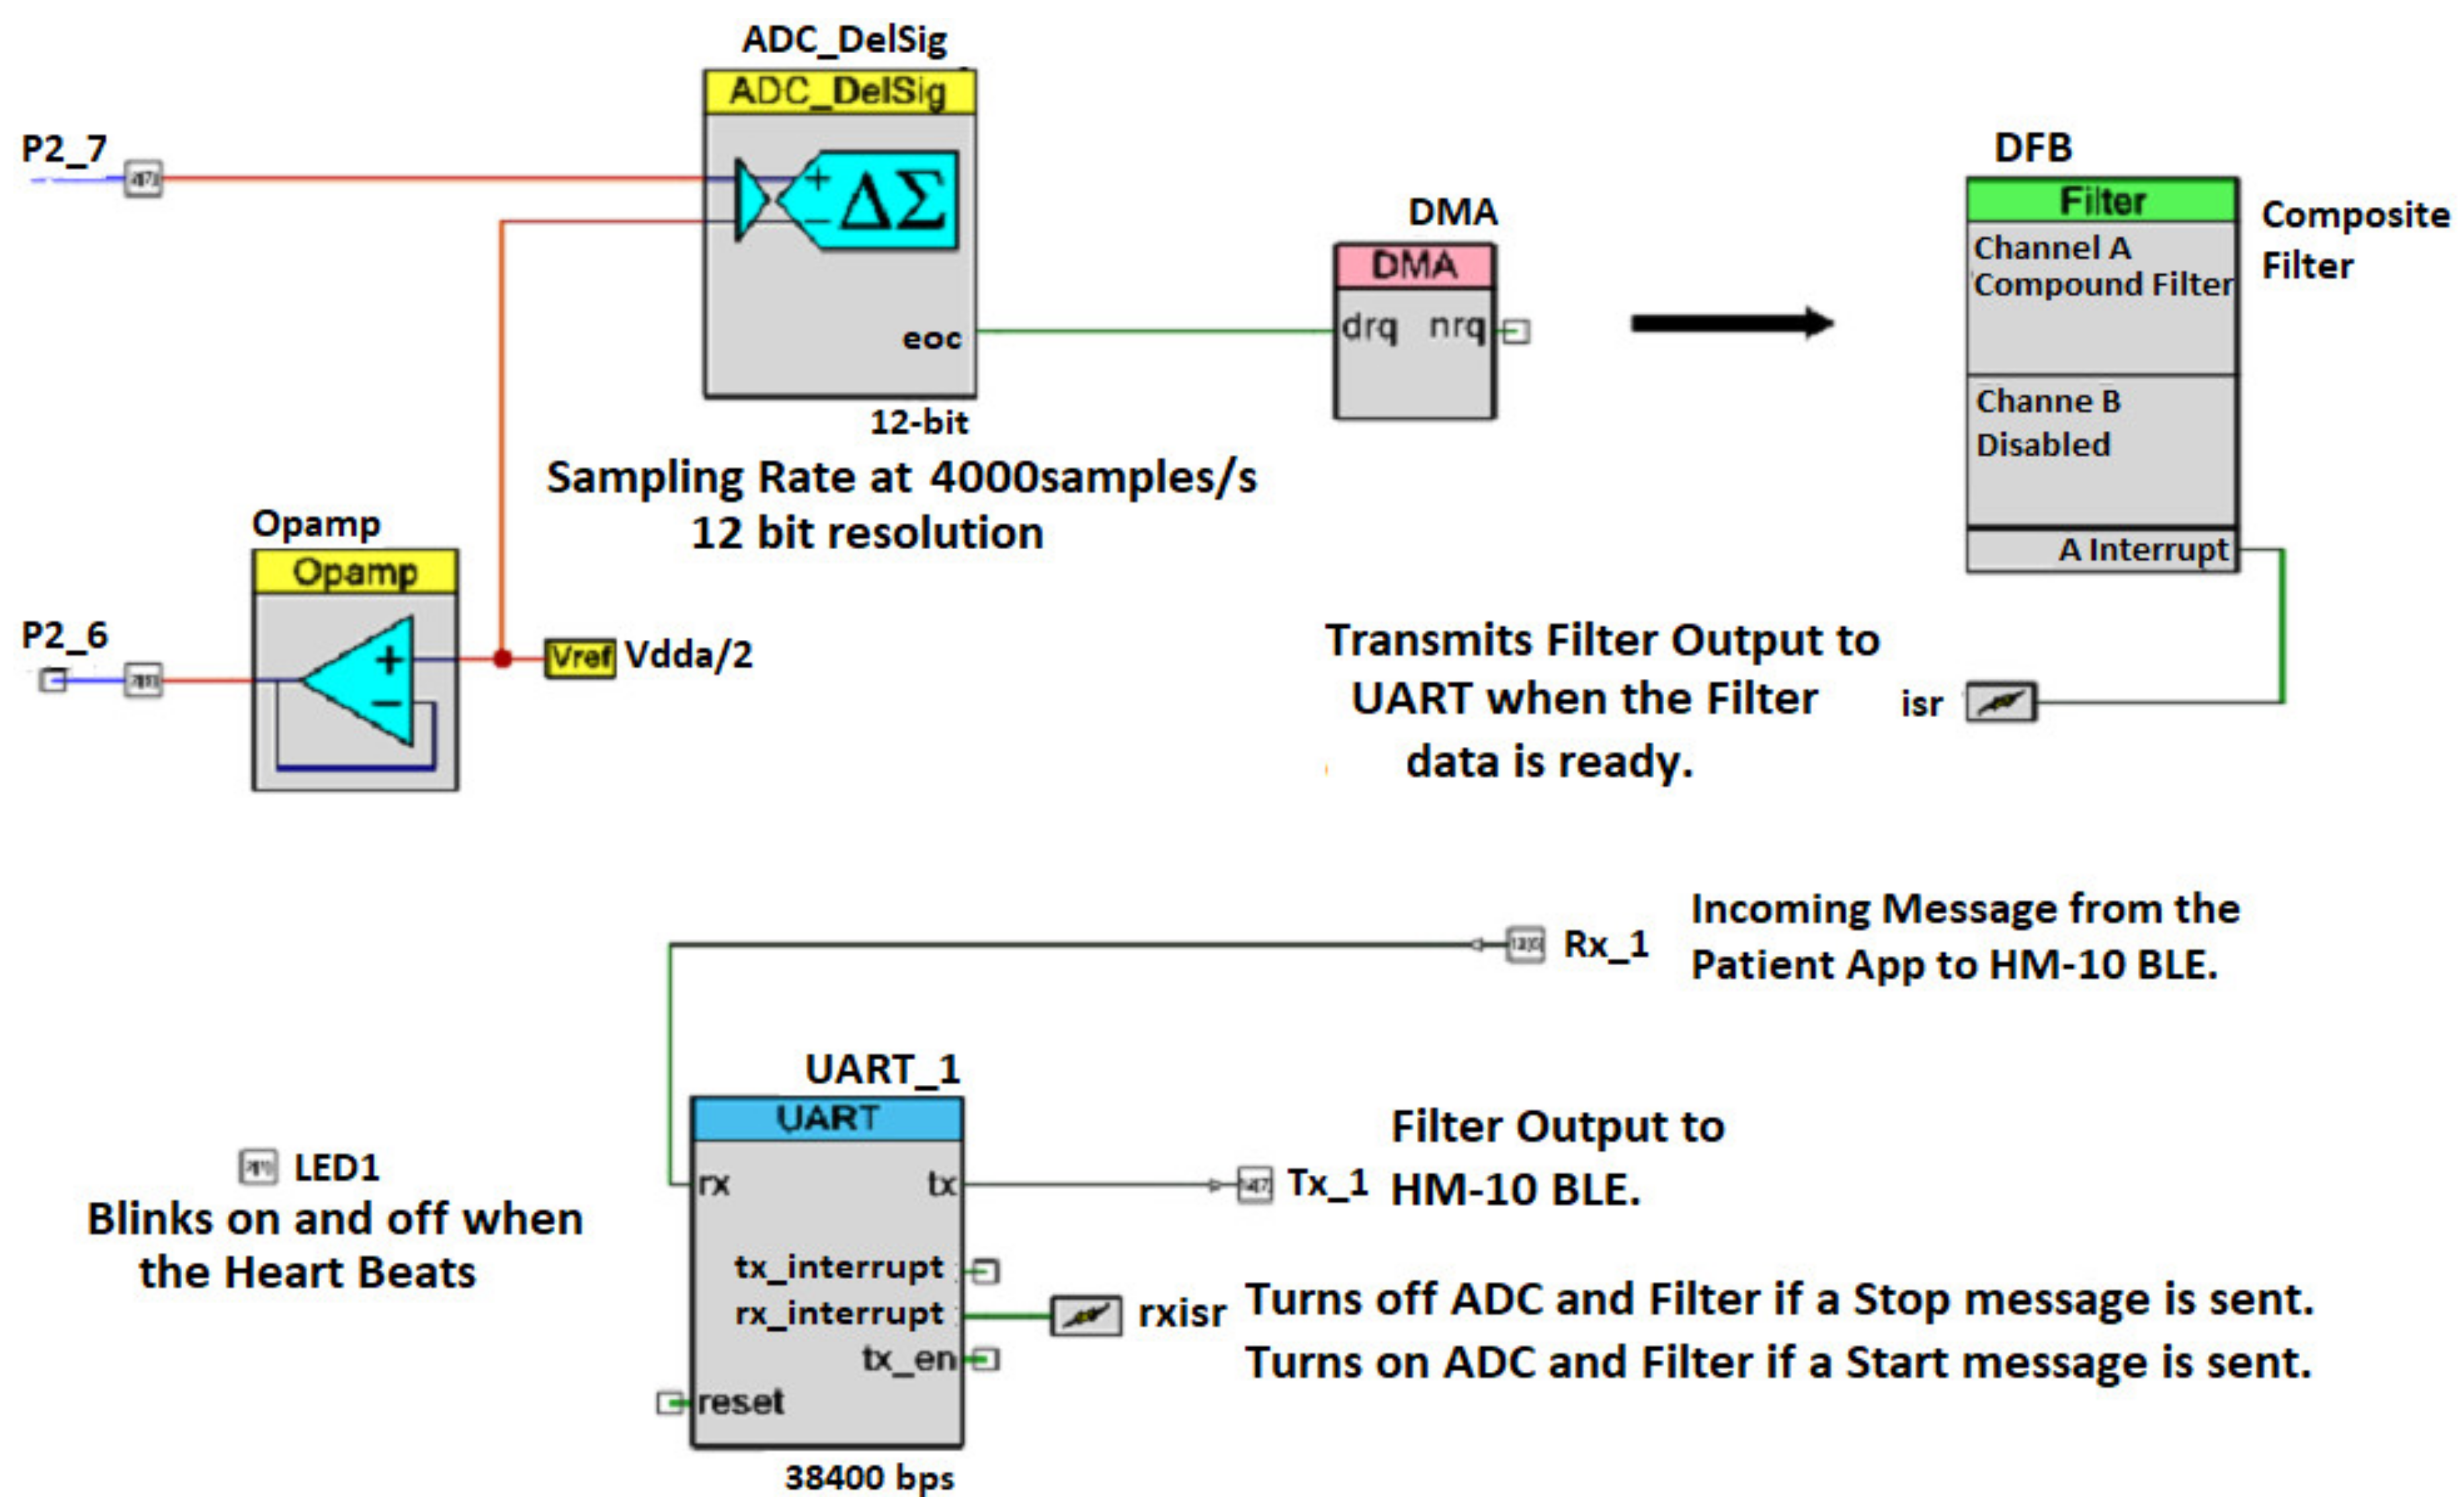
PSoC 5LP
Bluetooth Connectivity
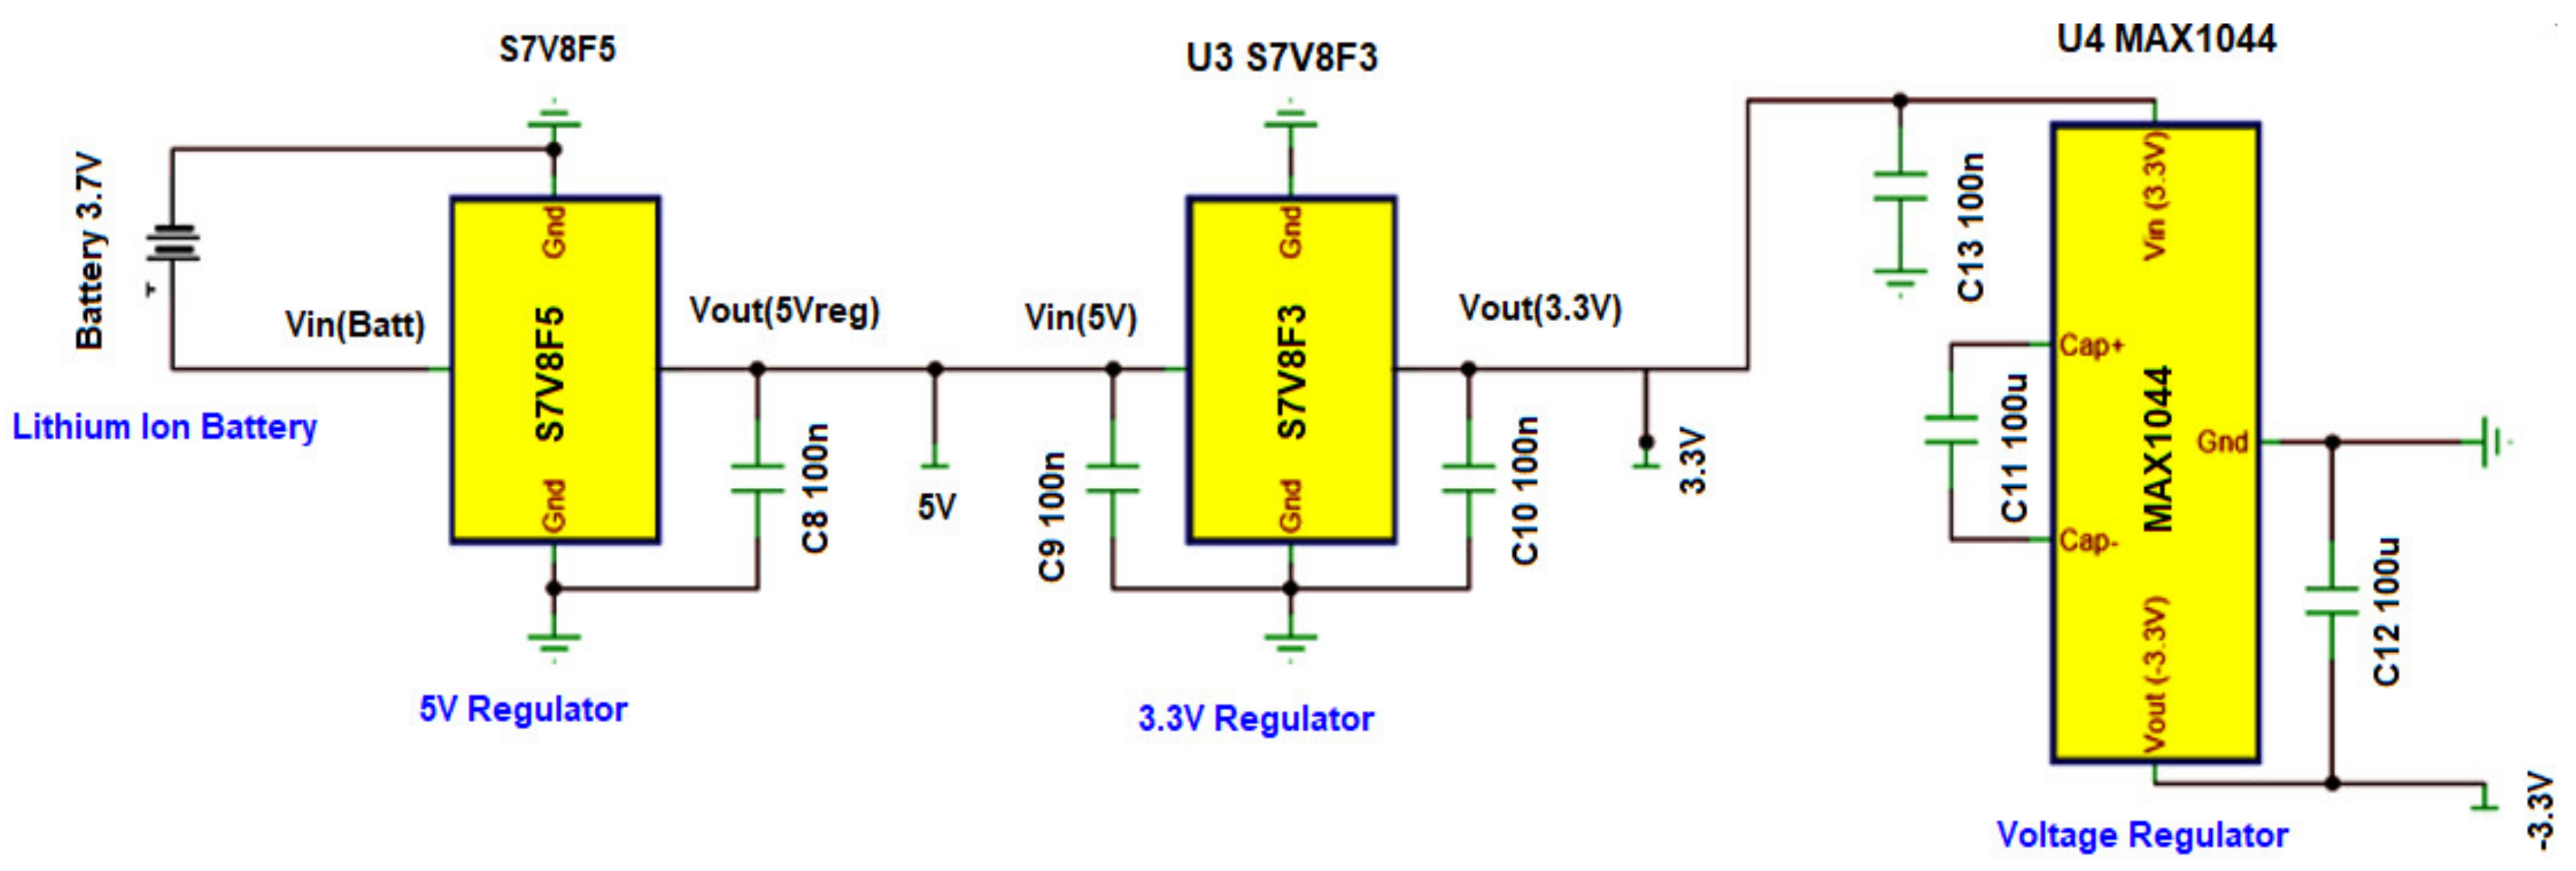
Power Management
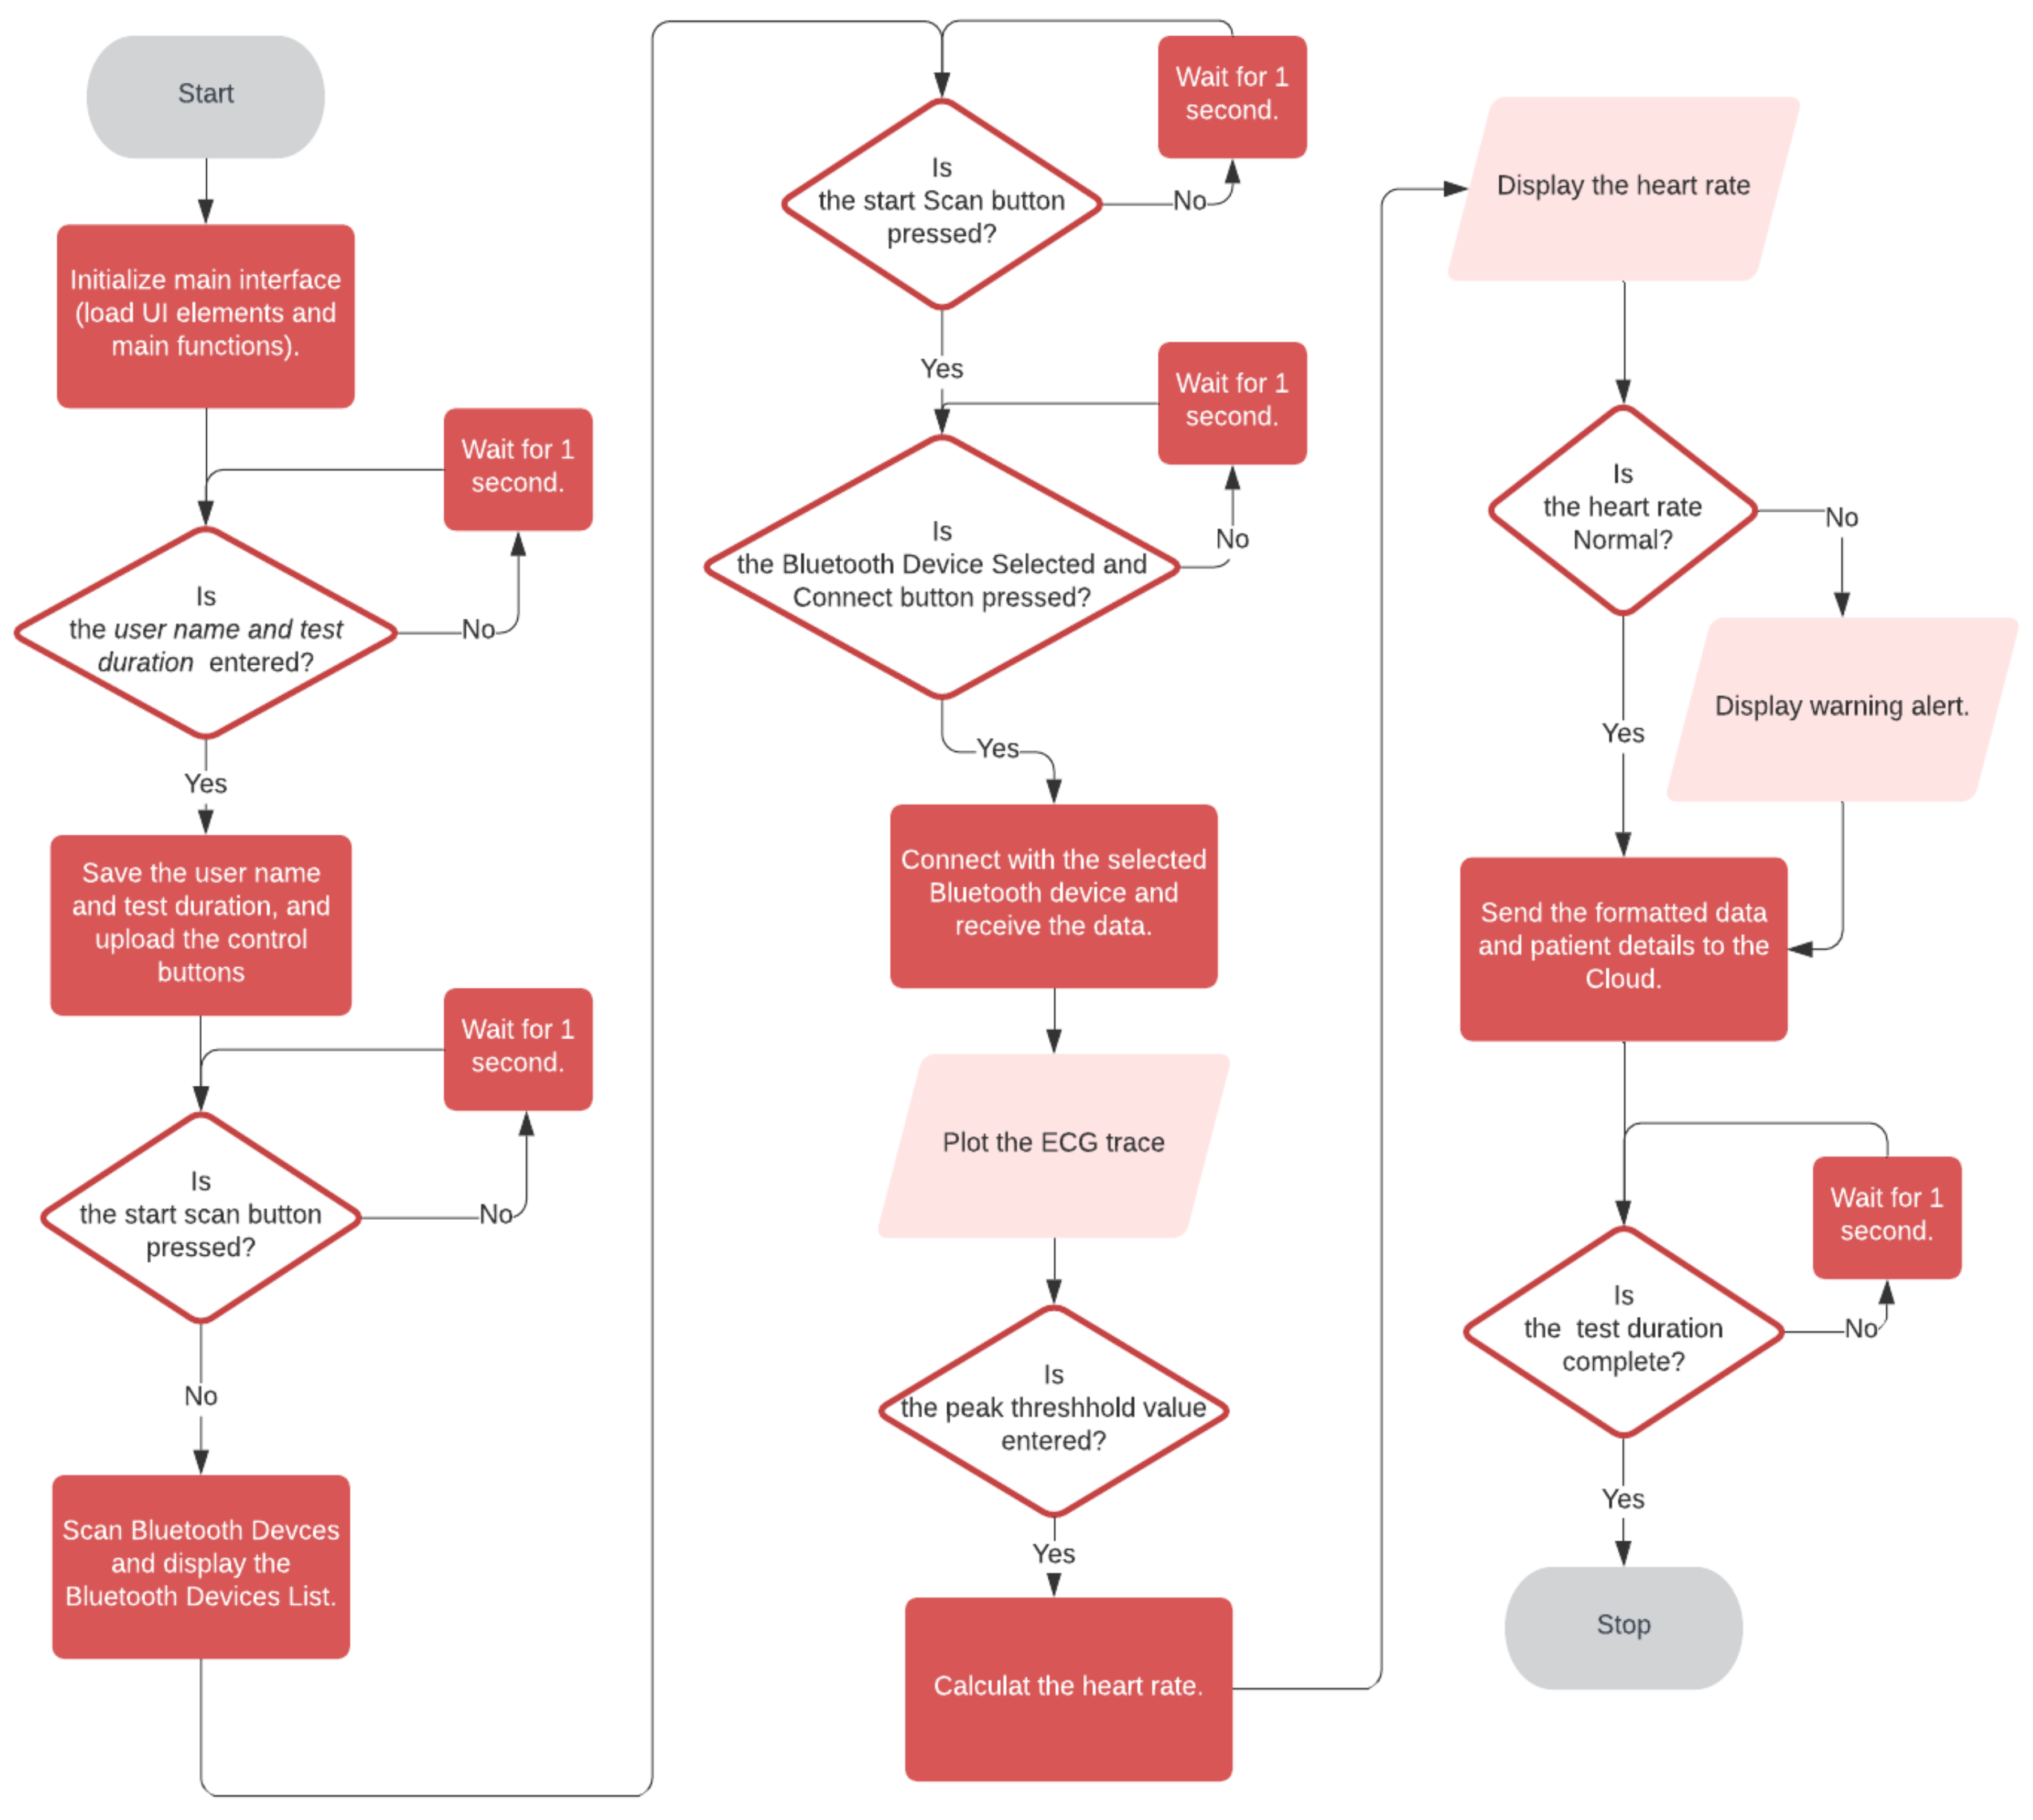
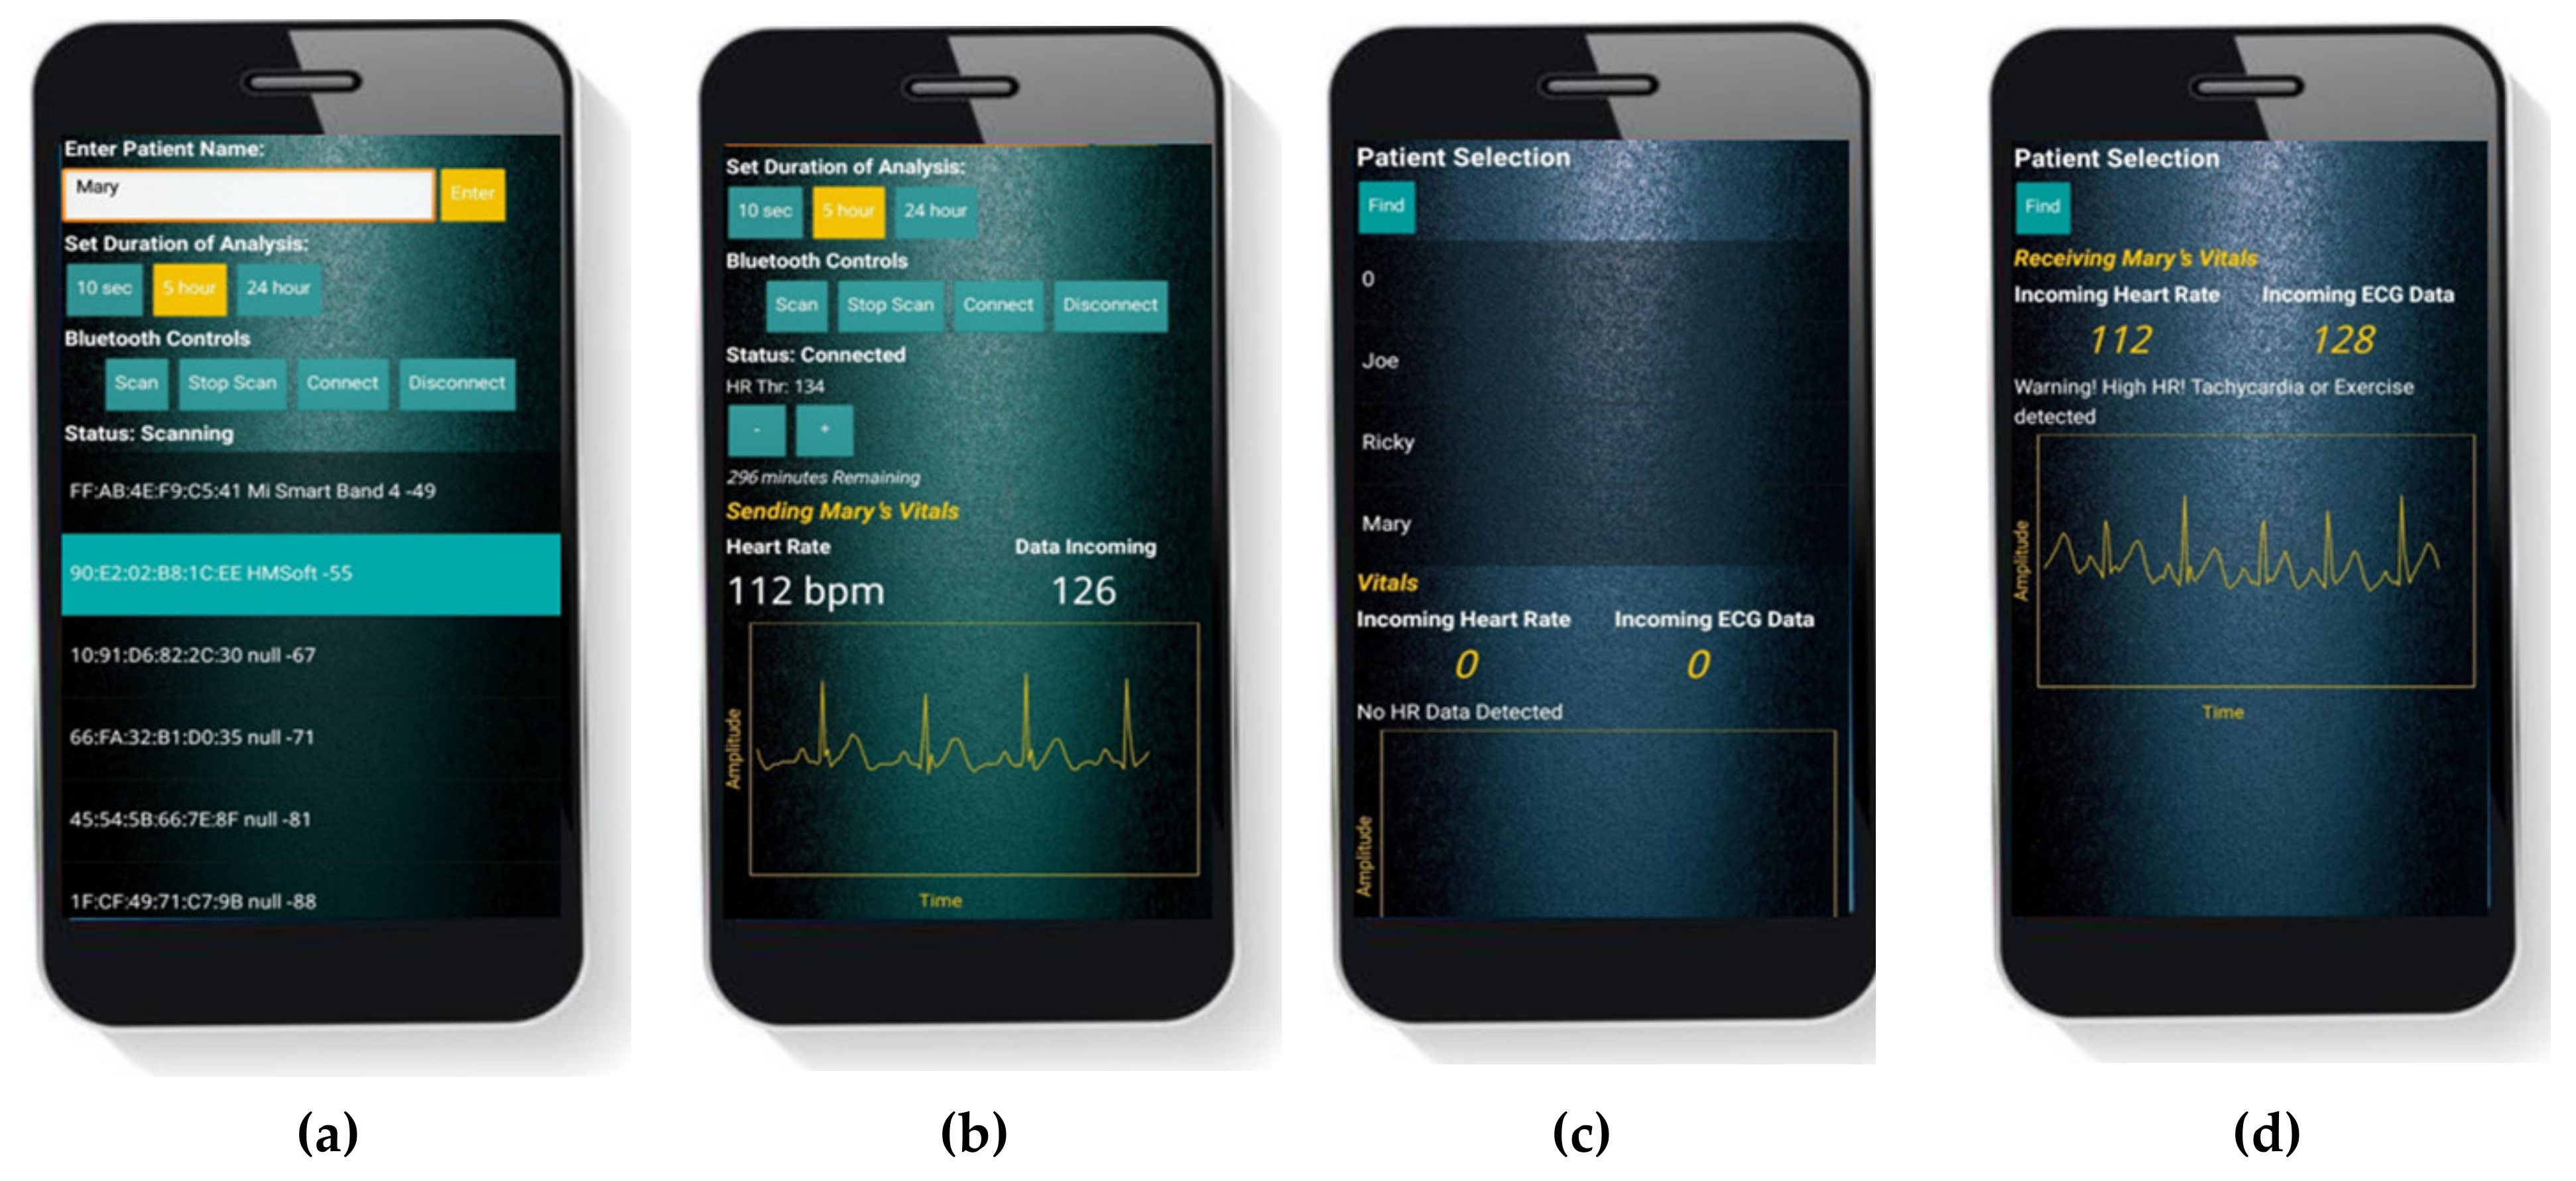
2.2.2. Patient’s End Android Application
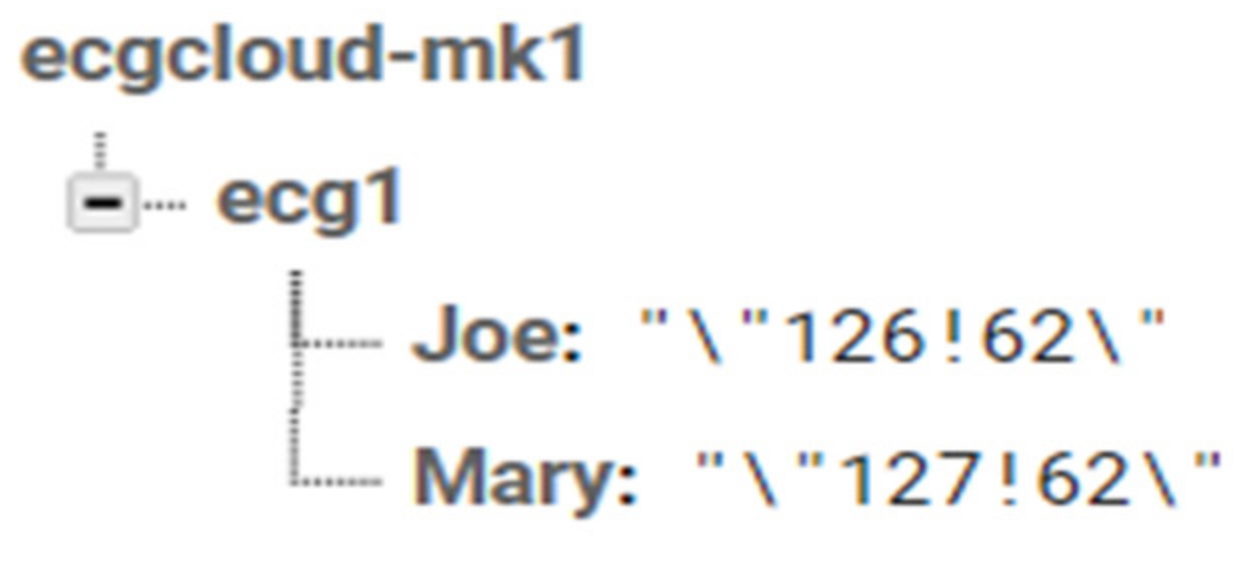
2.2.3. Google Firebase
2.2.4. The Android Application at Doctor’s End
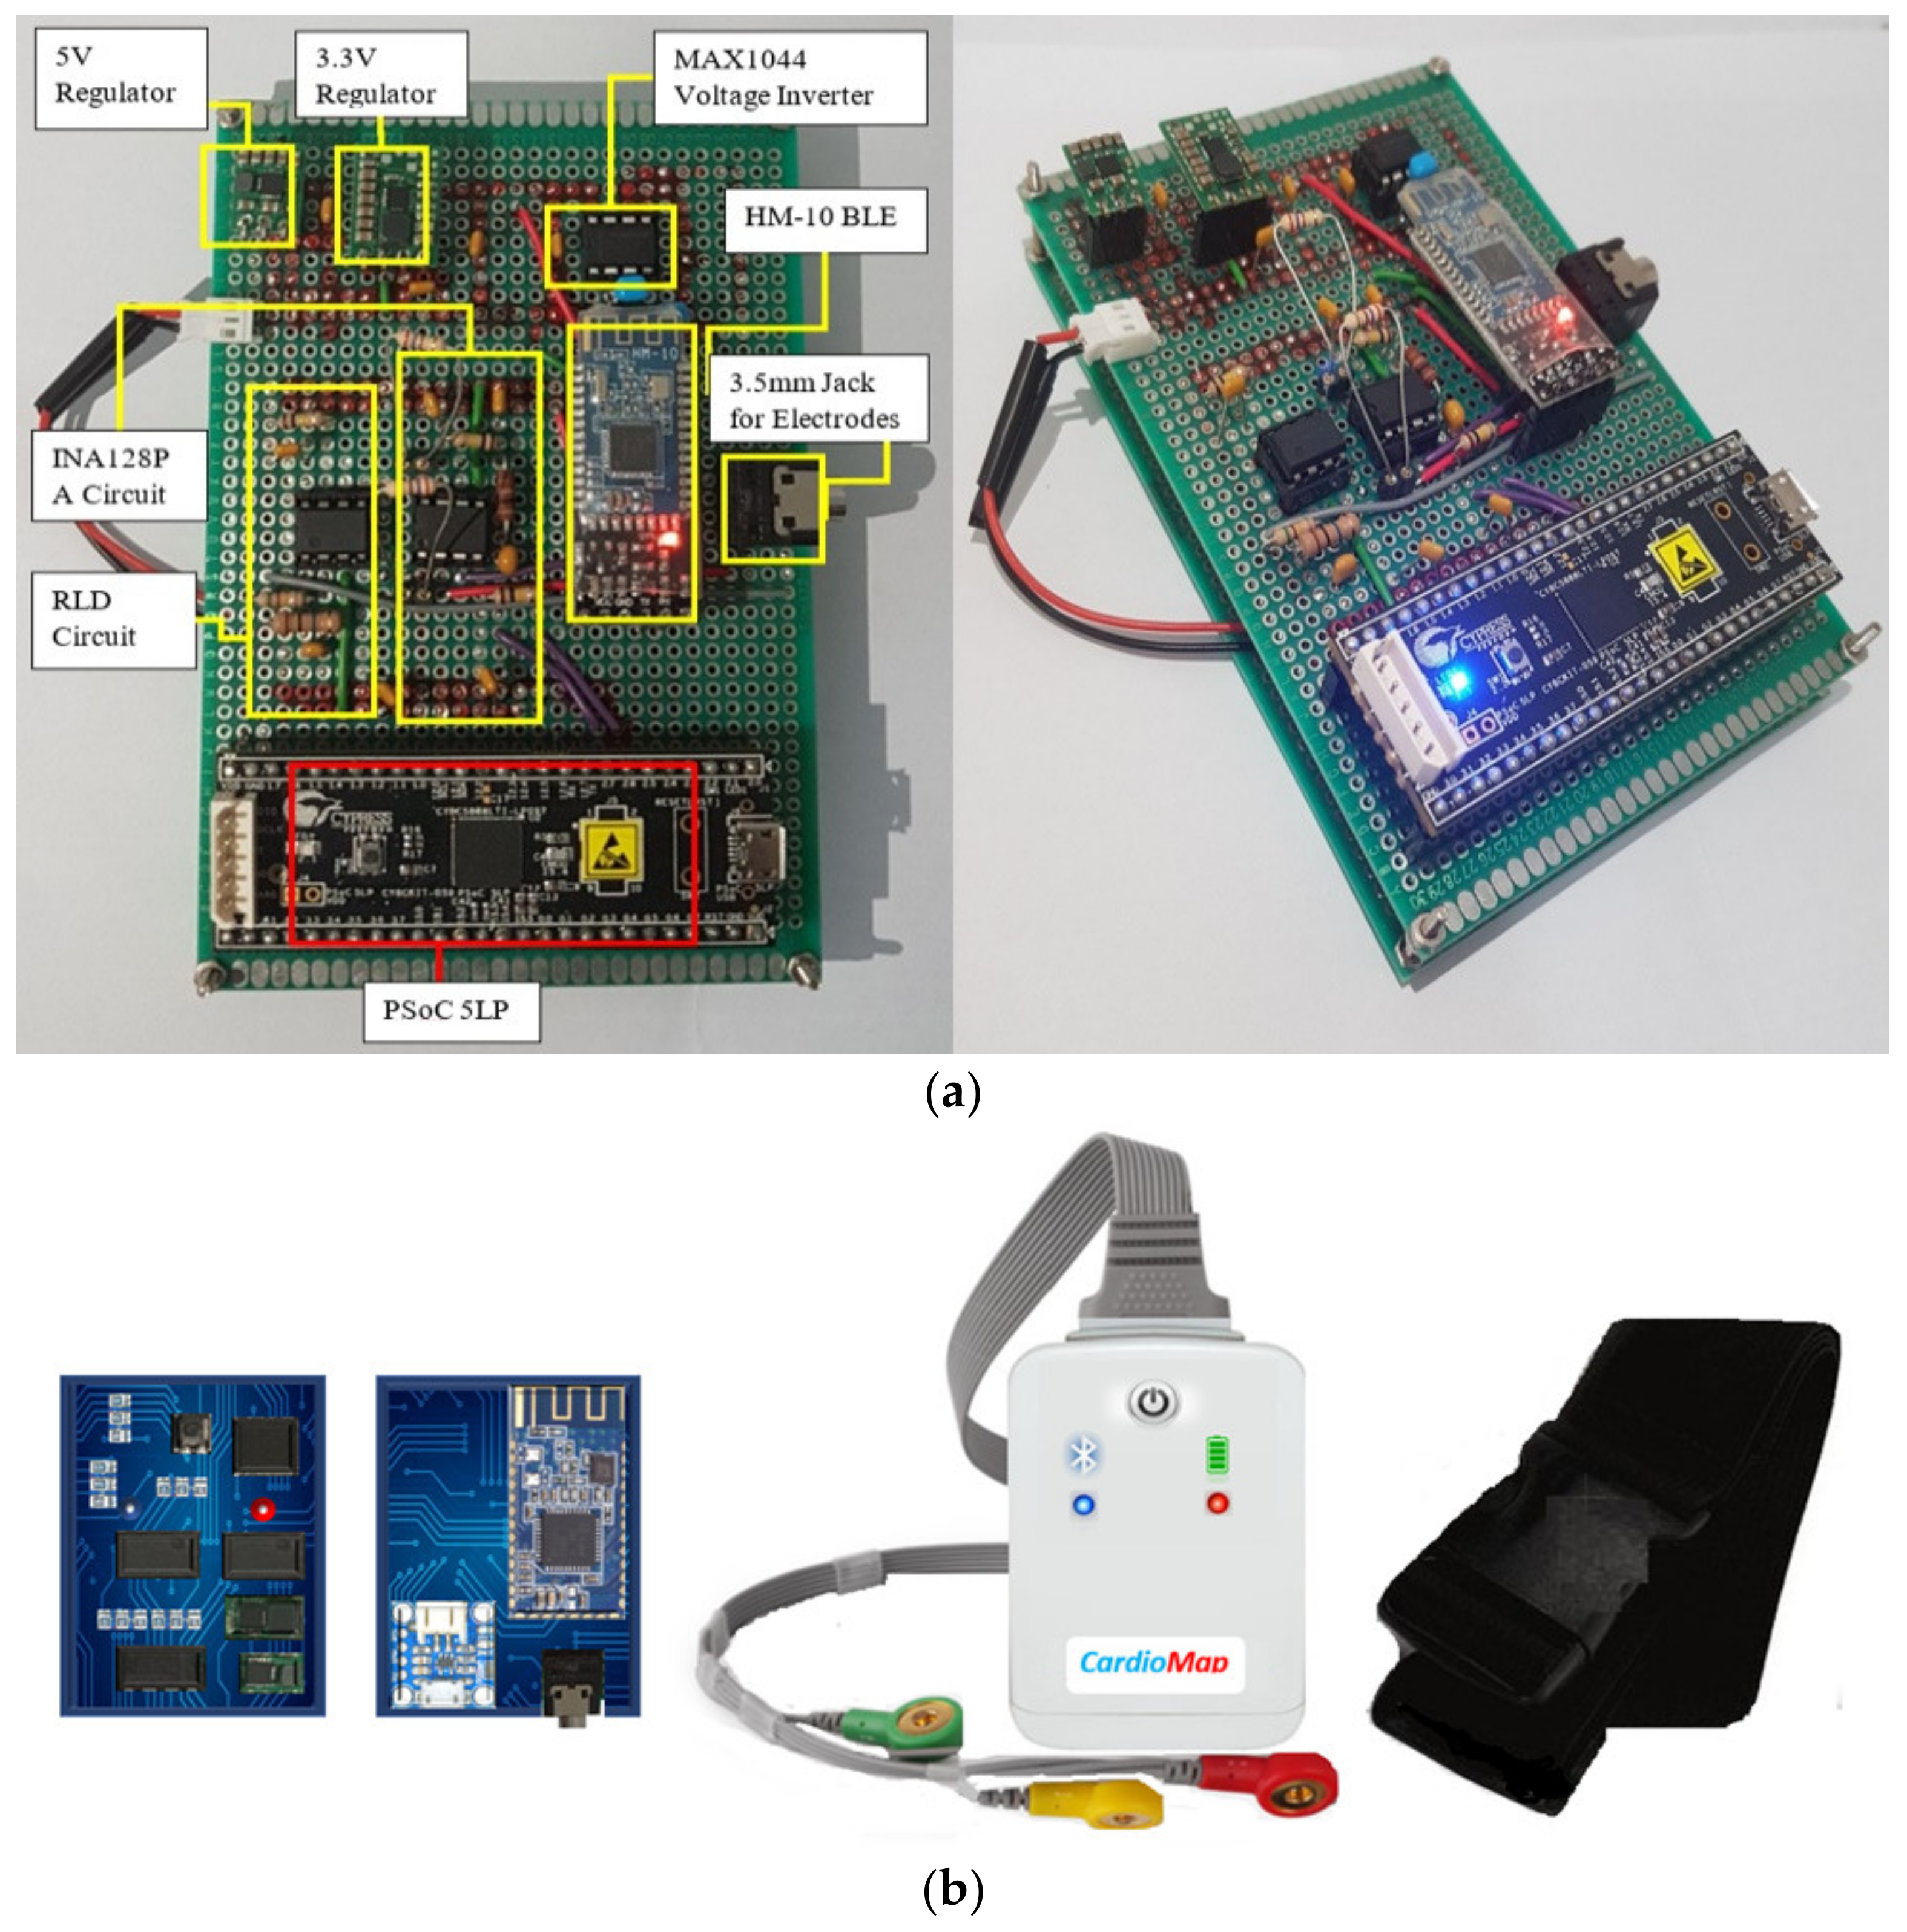
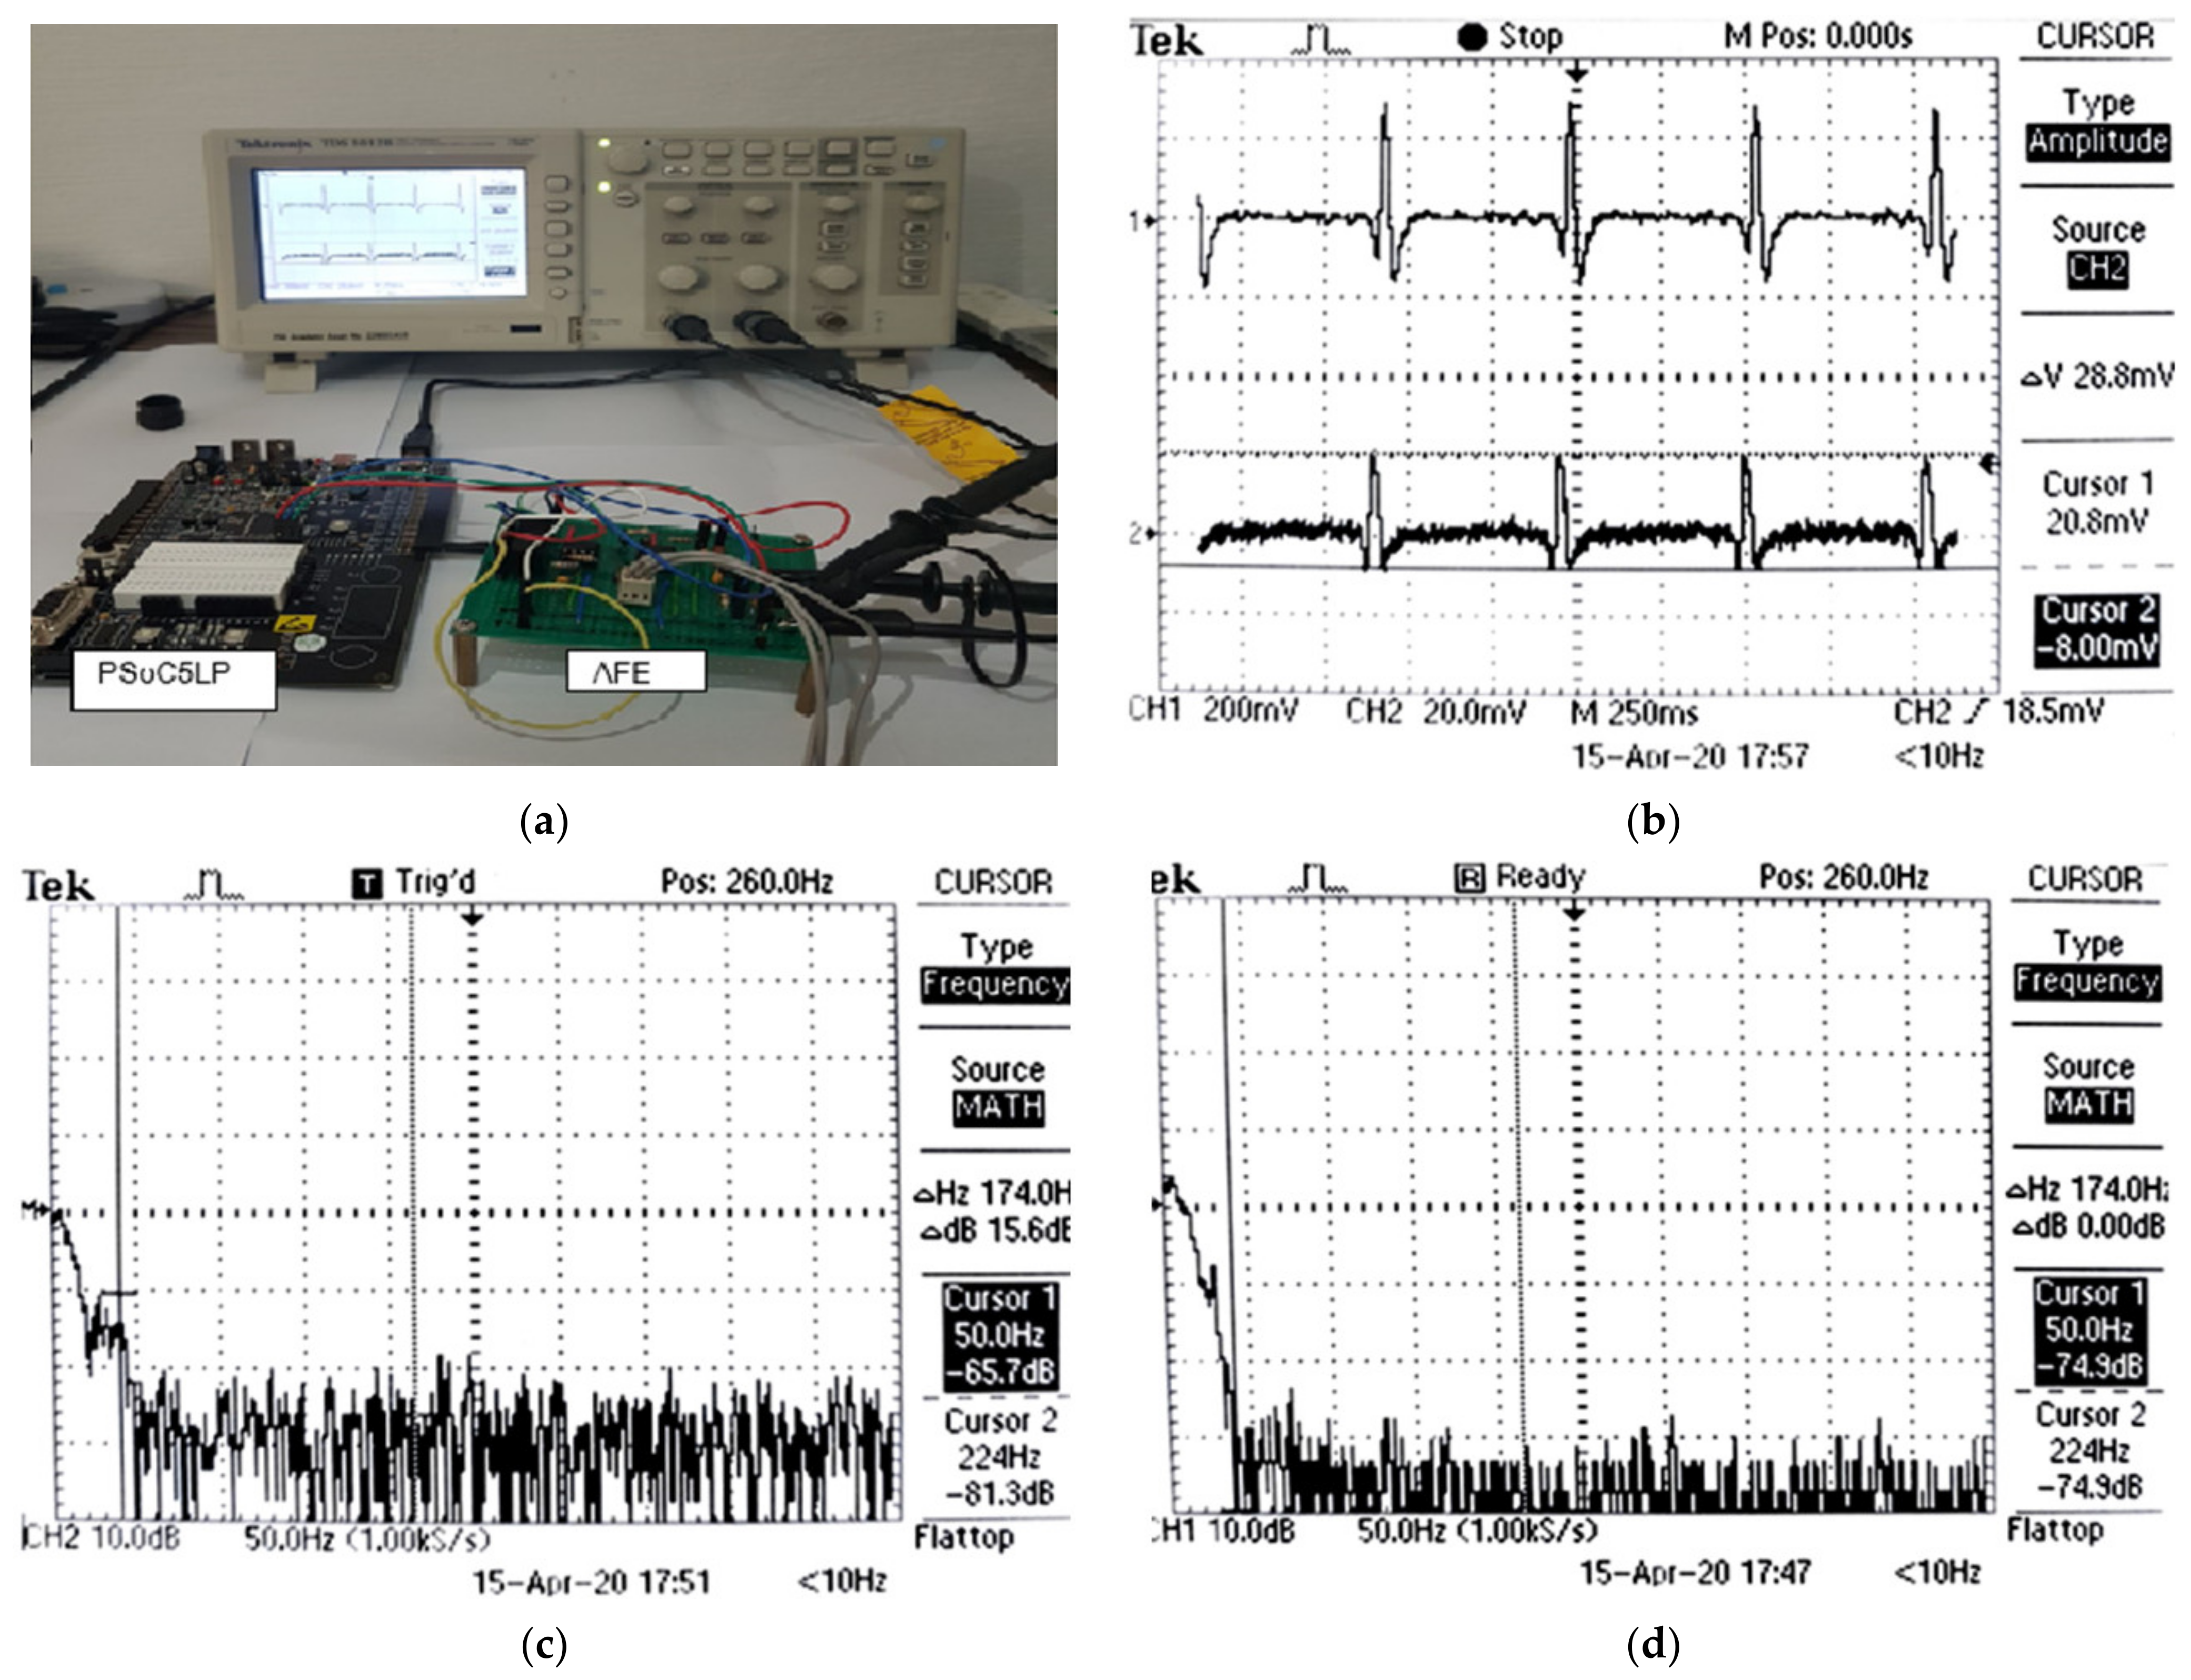
2.2.5. Hardware Implementation
3. Results
3.1. Simulation Results
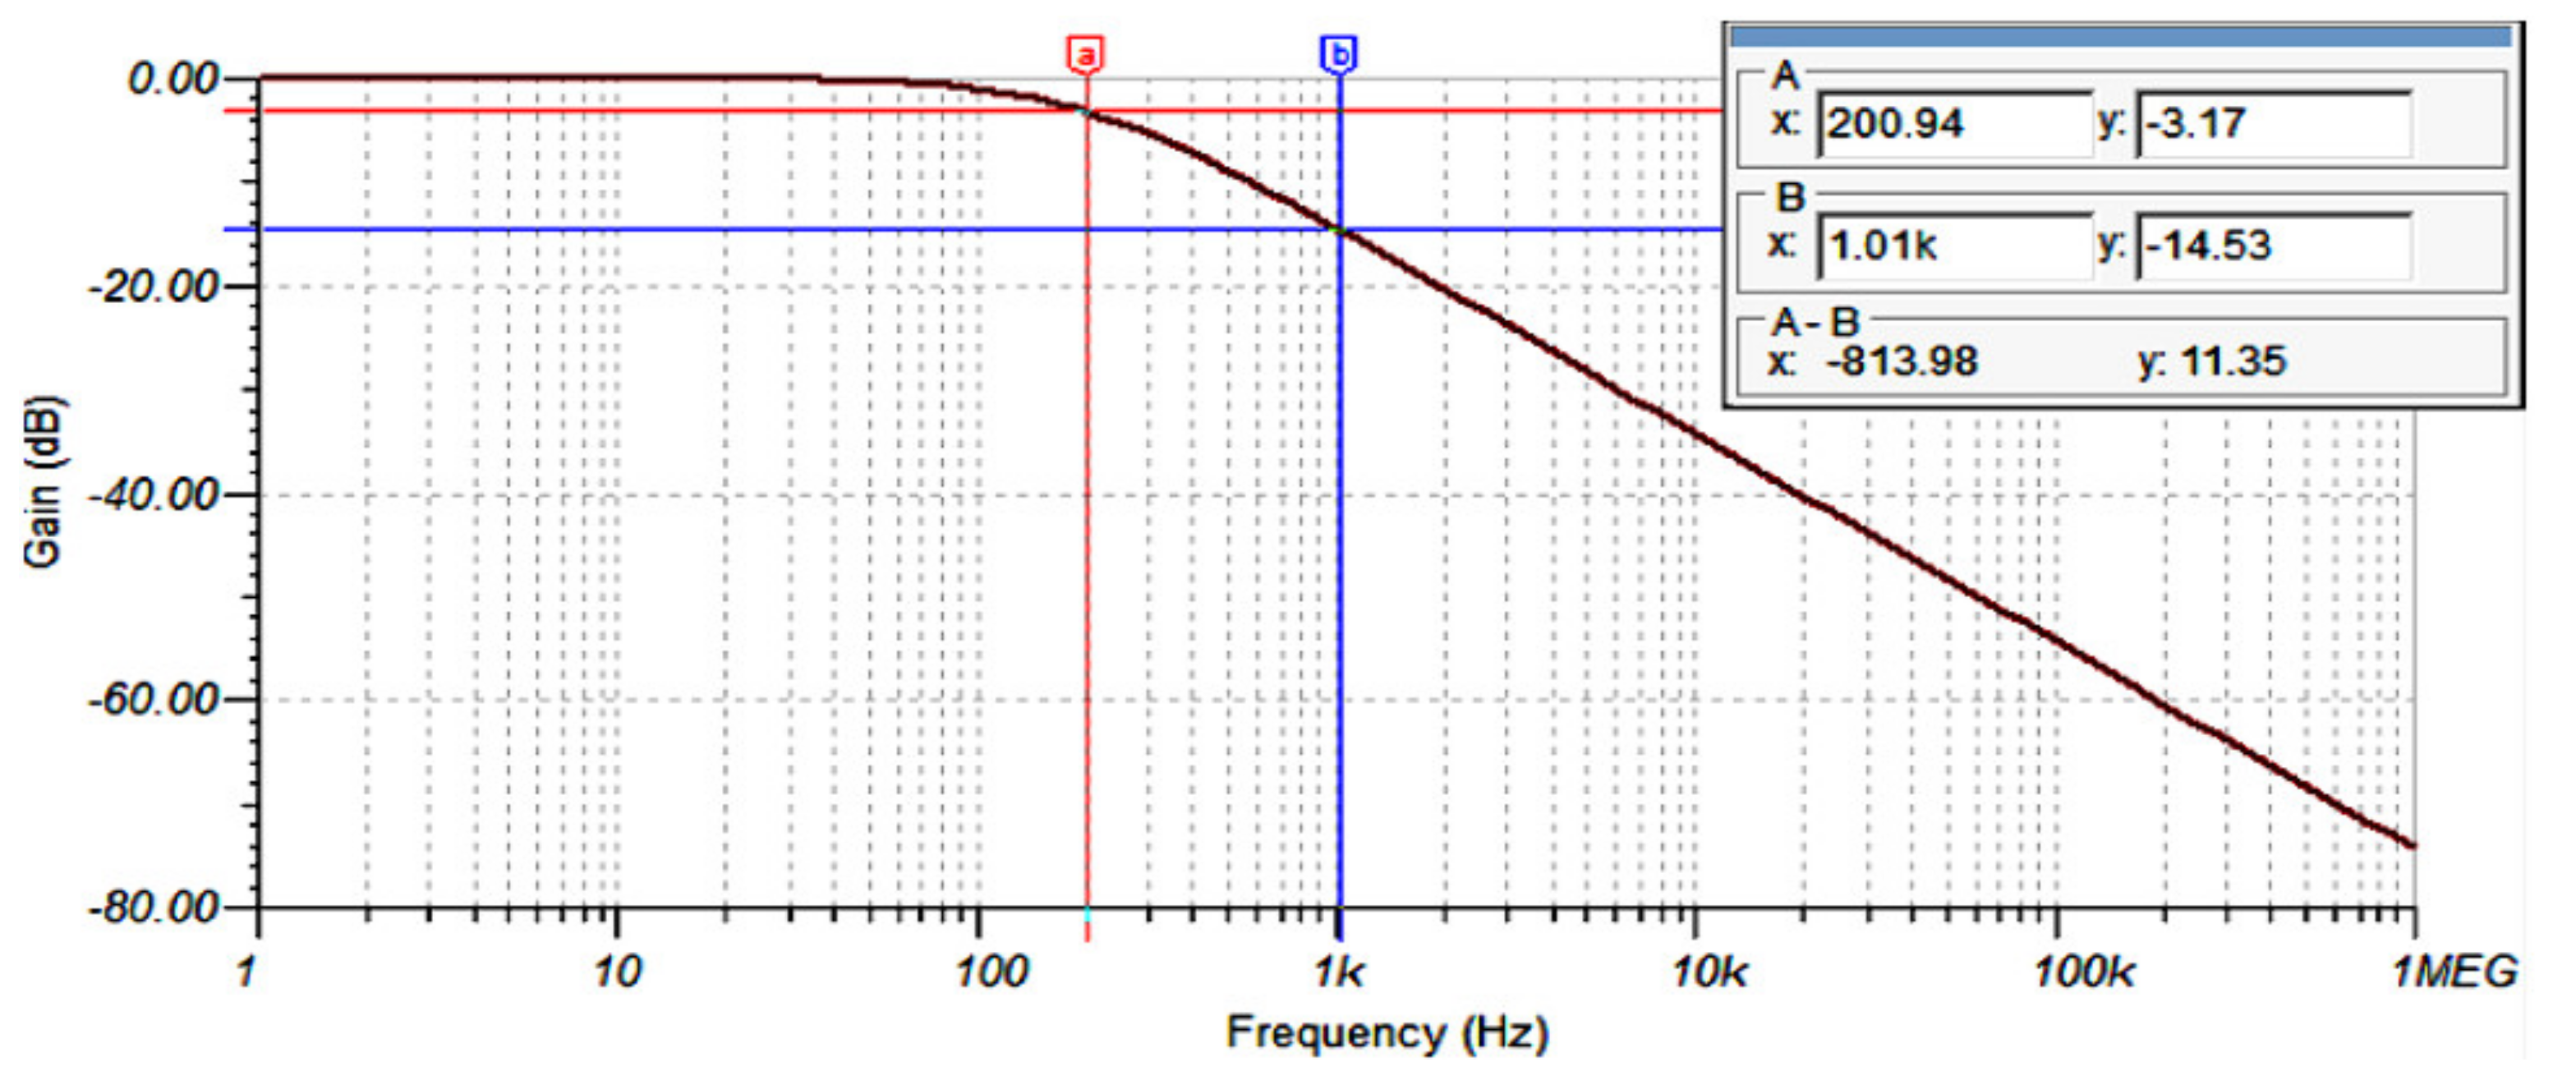
3.1.1. AFE Analogue Filtering
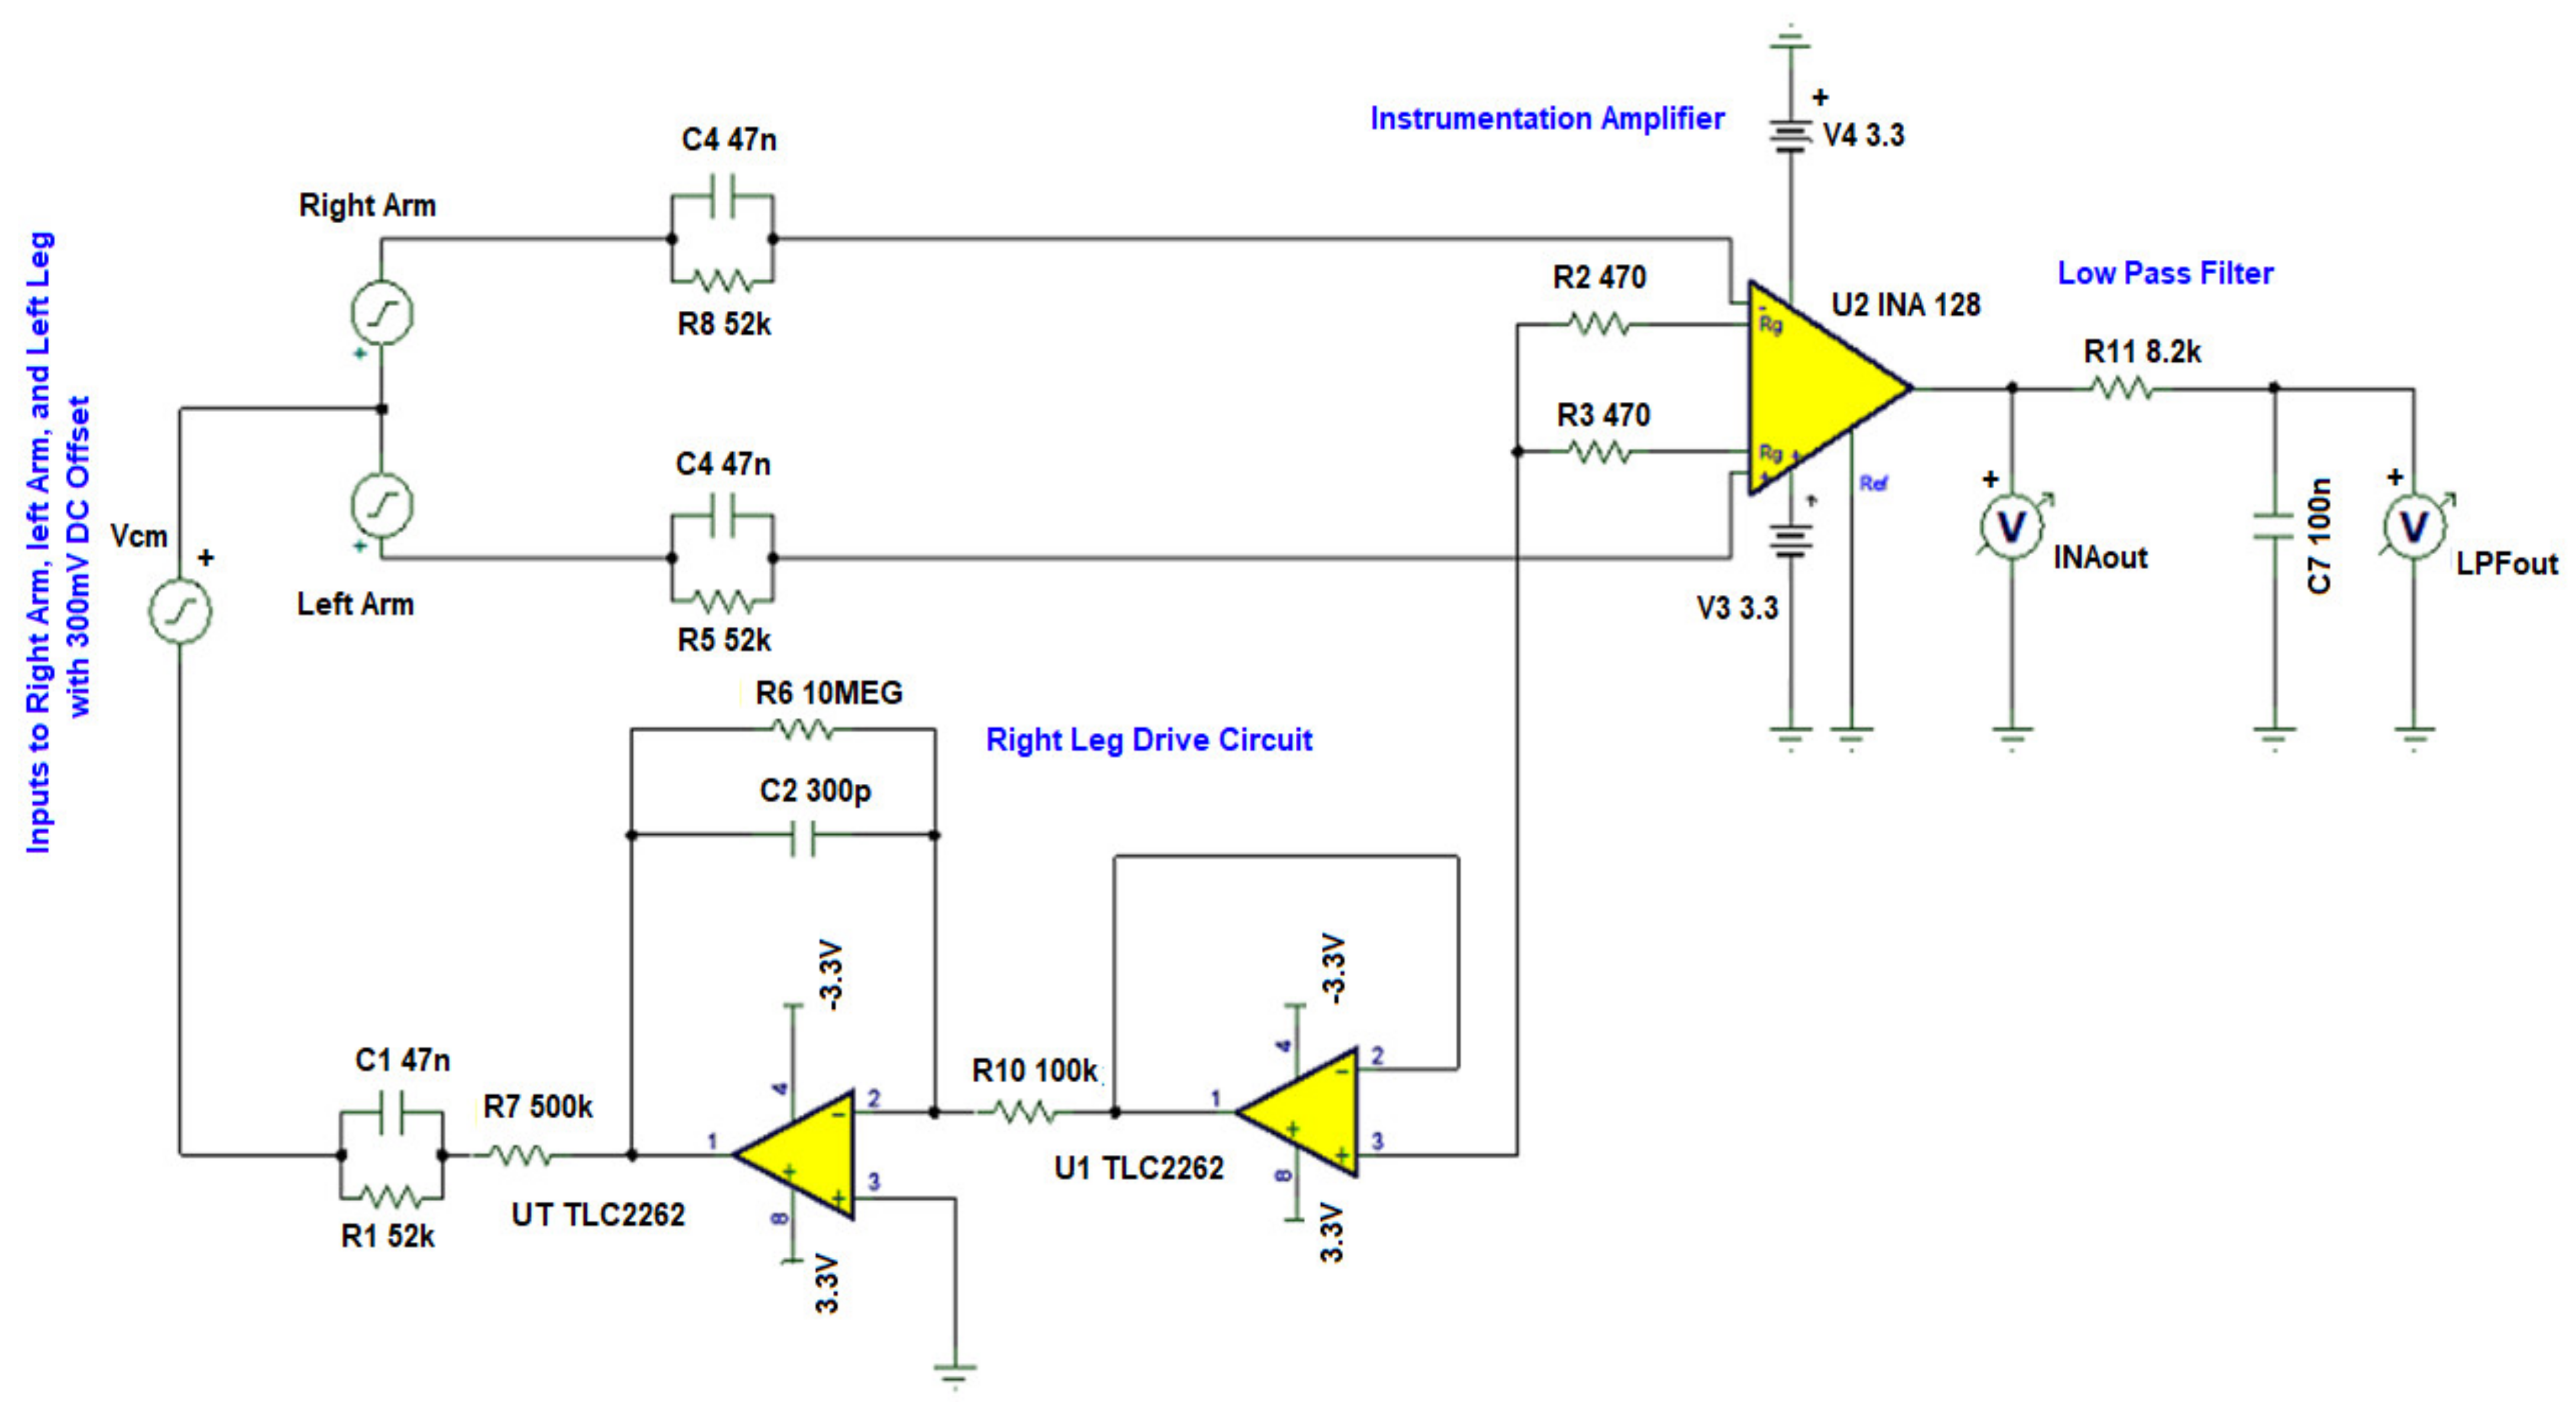
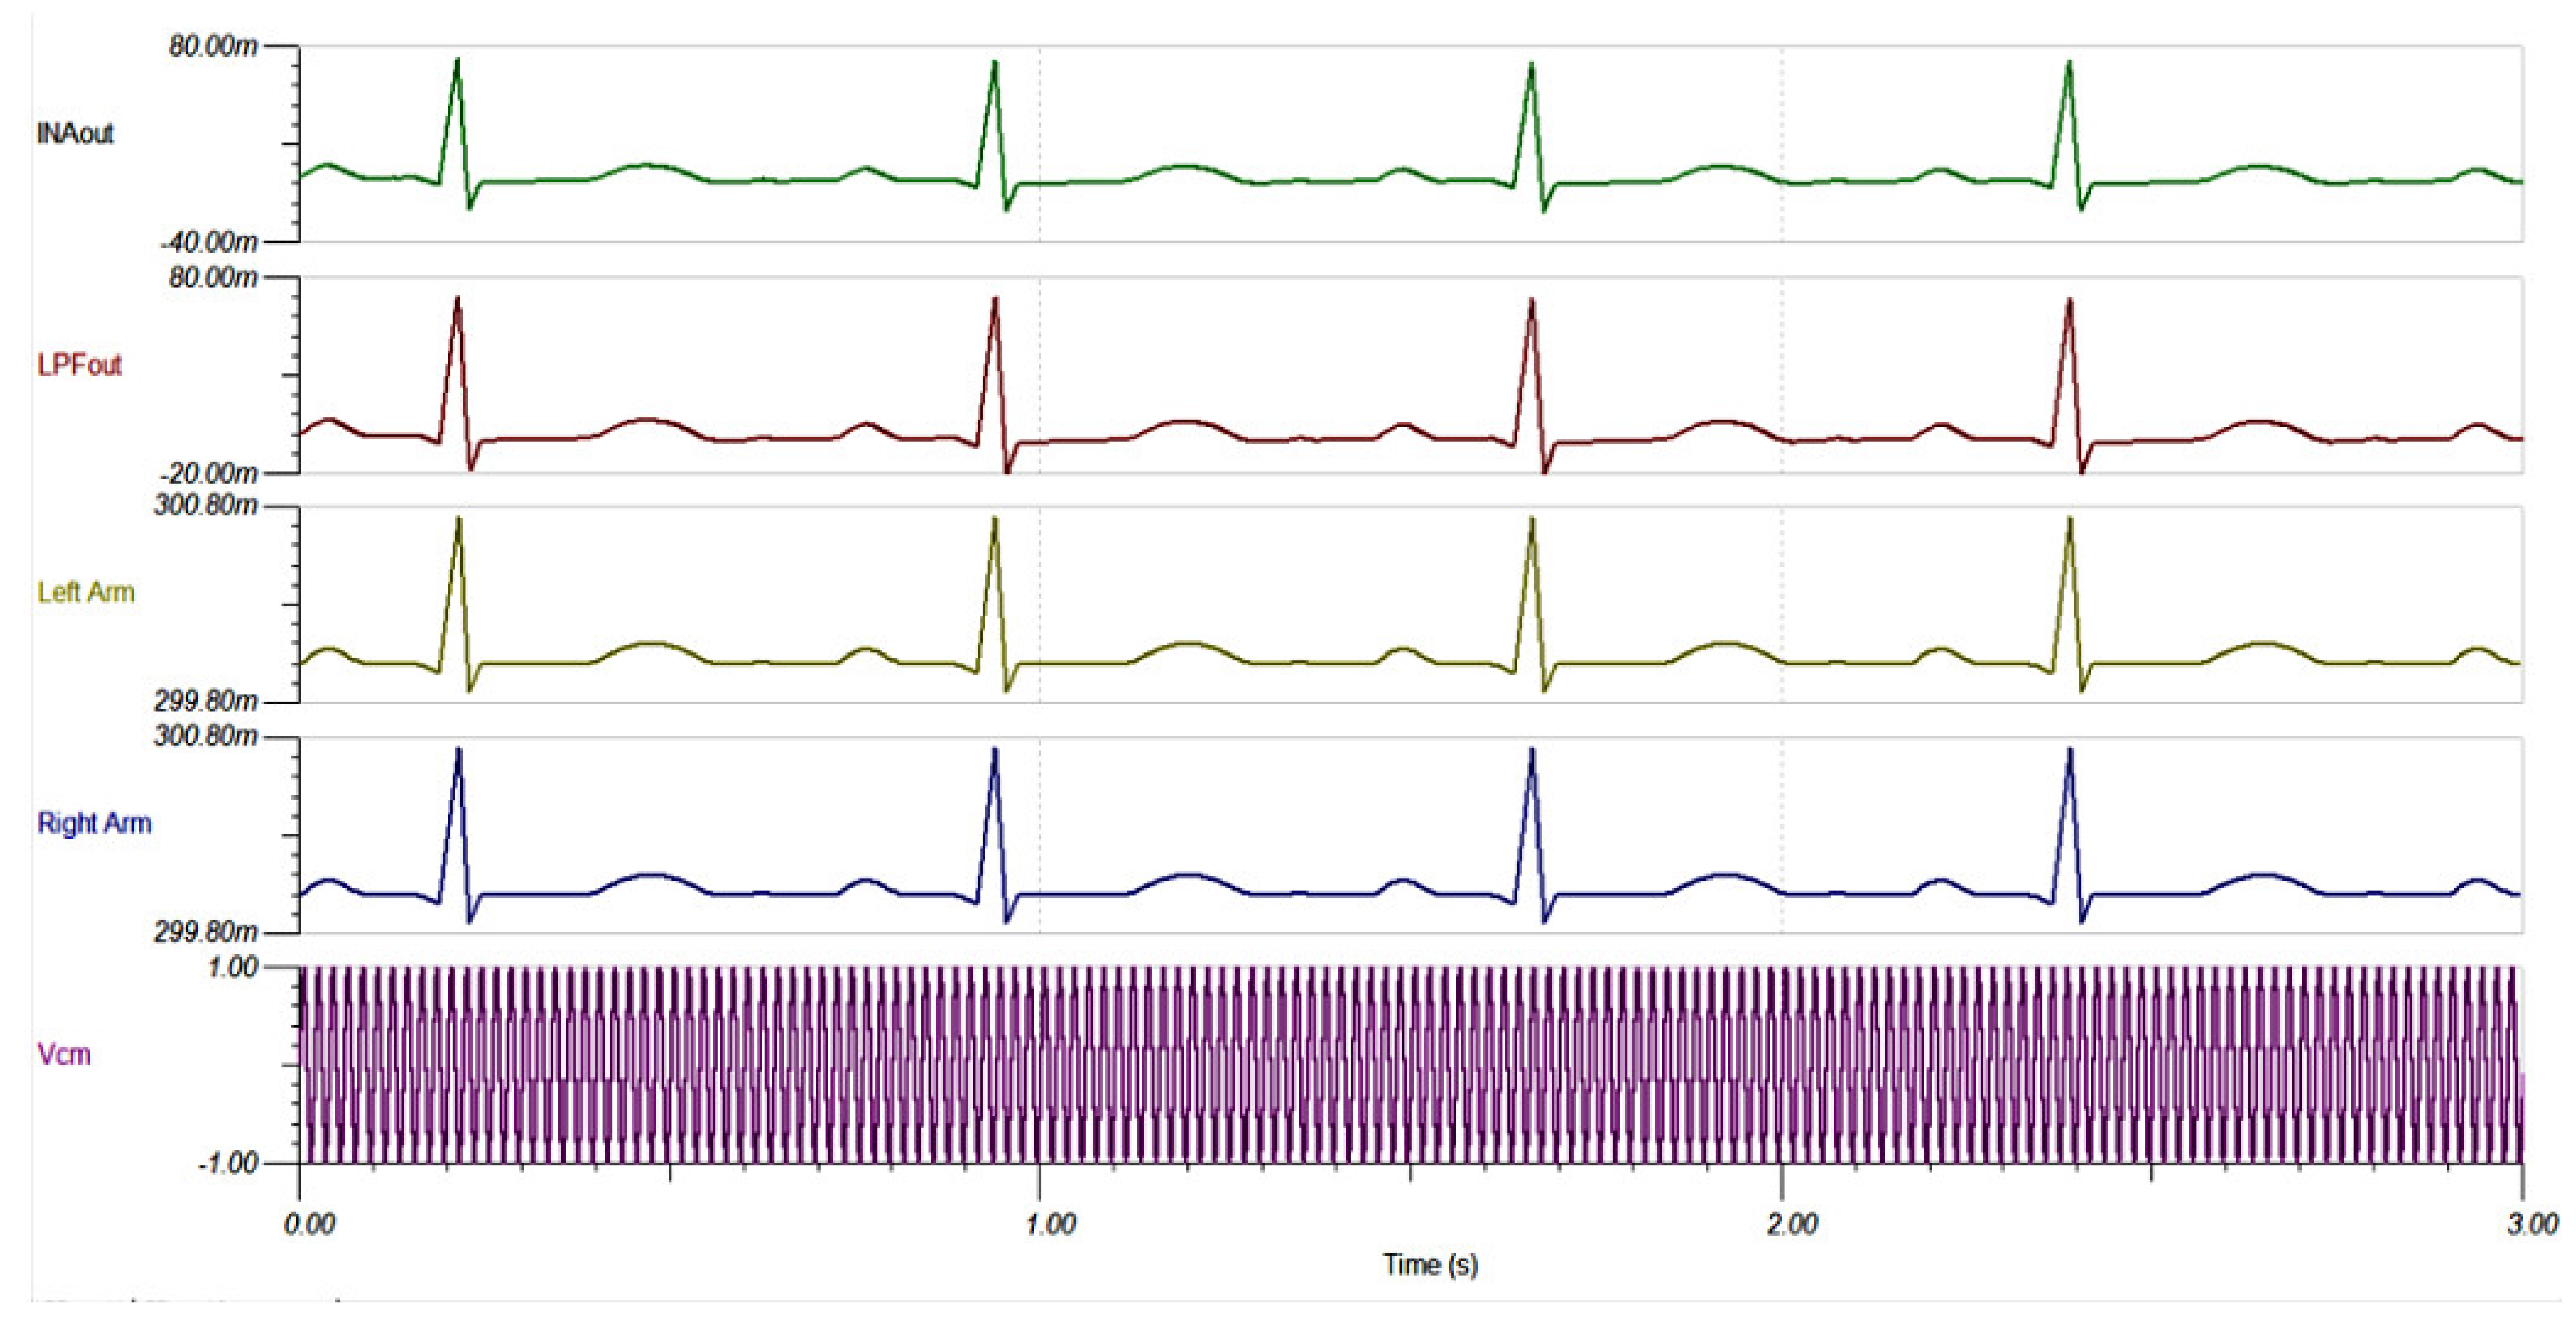
3.1.2. AFE Common Mode Noise Suppression
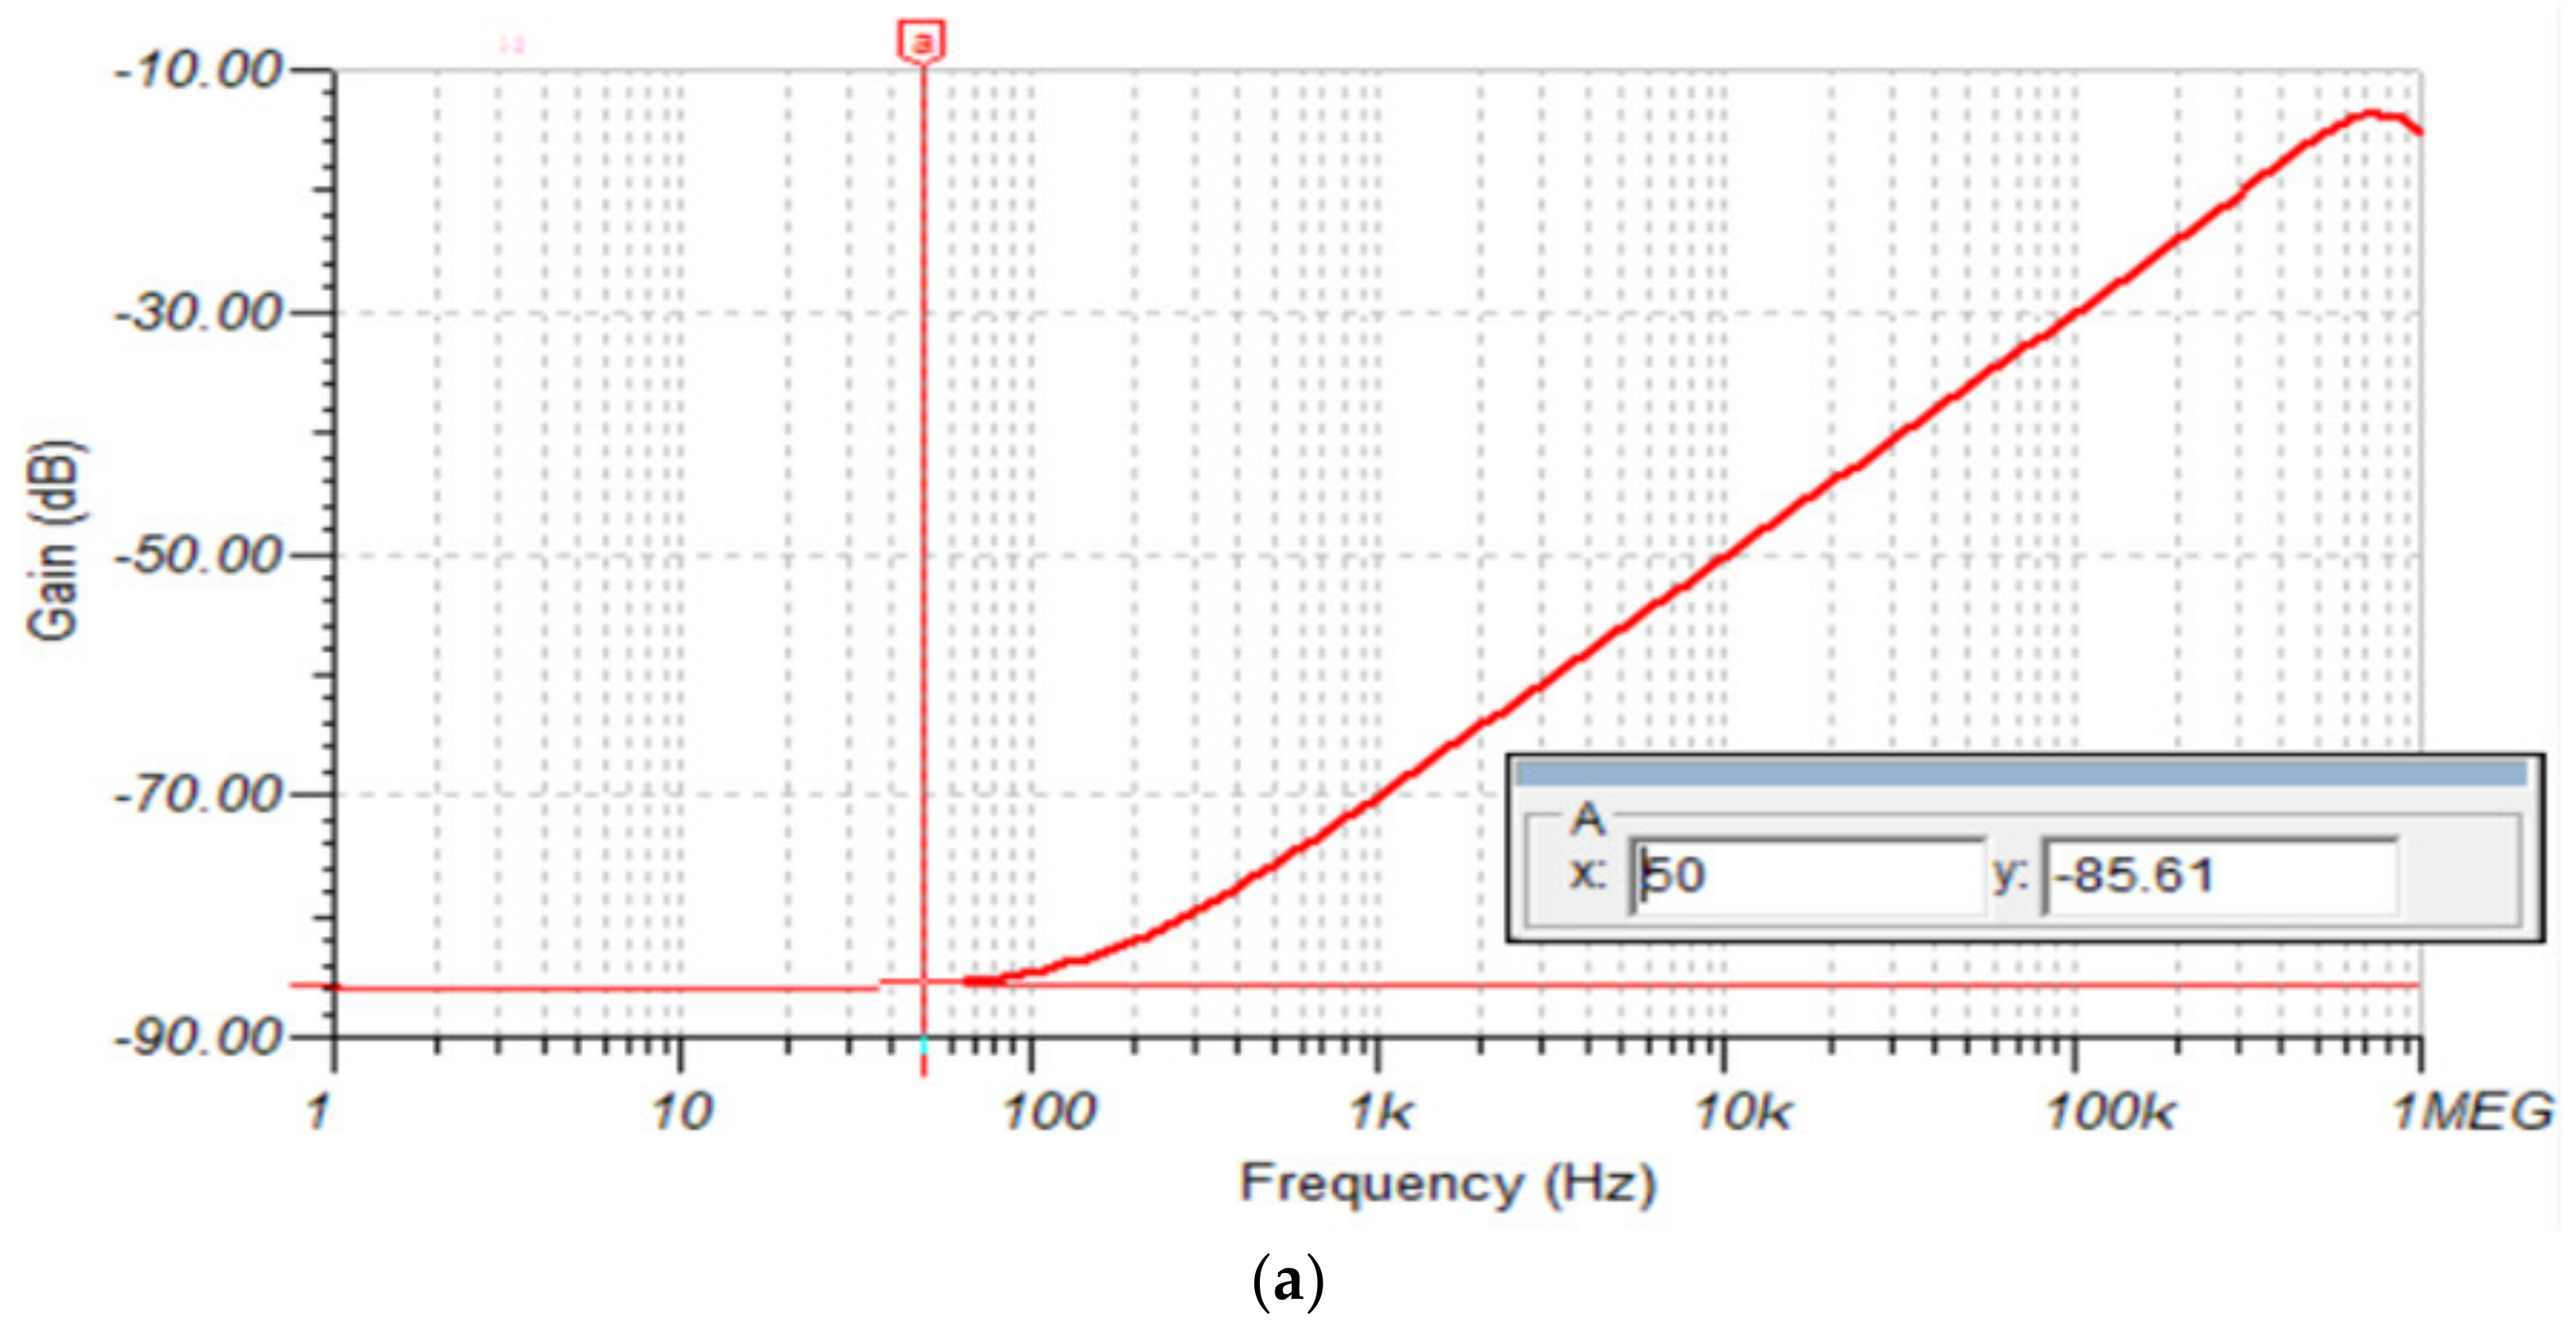
3.1.3. AFE CMRR vs. Frequency
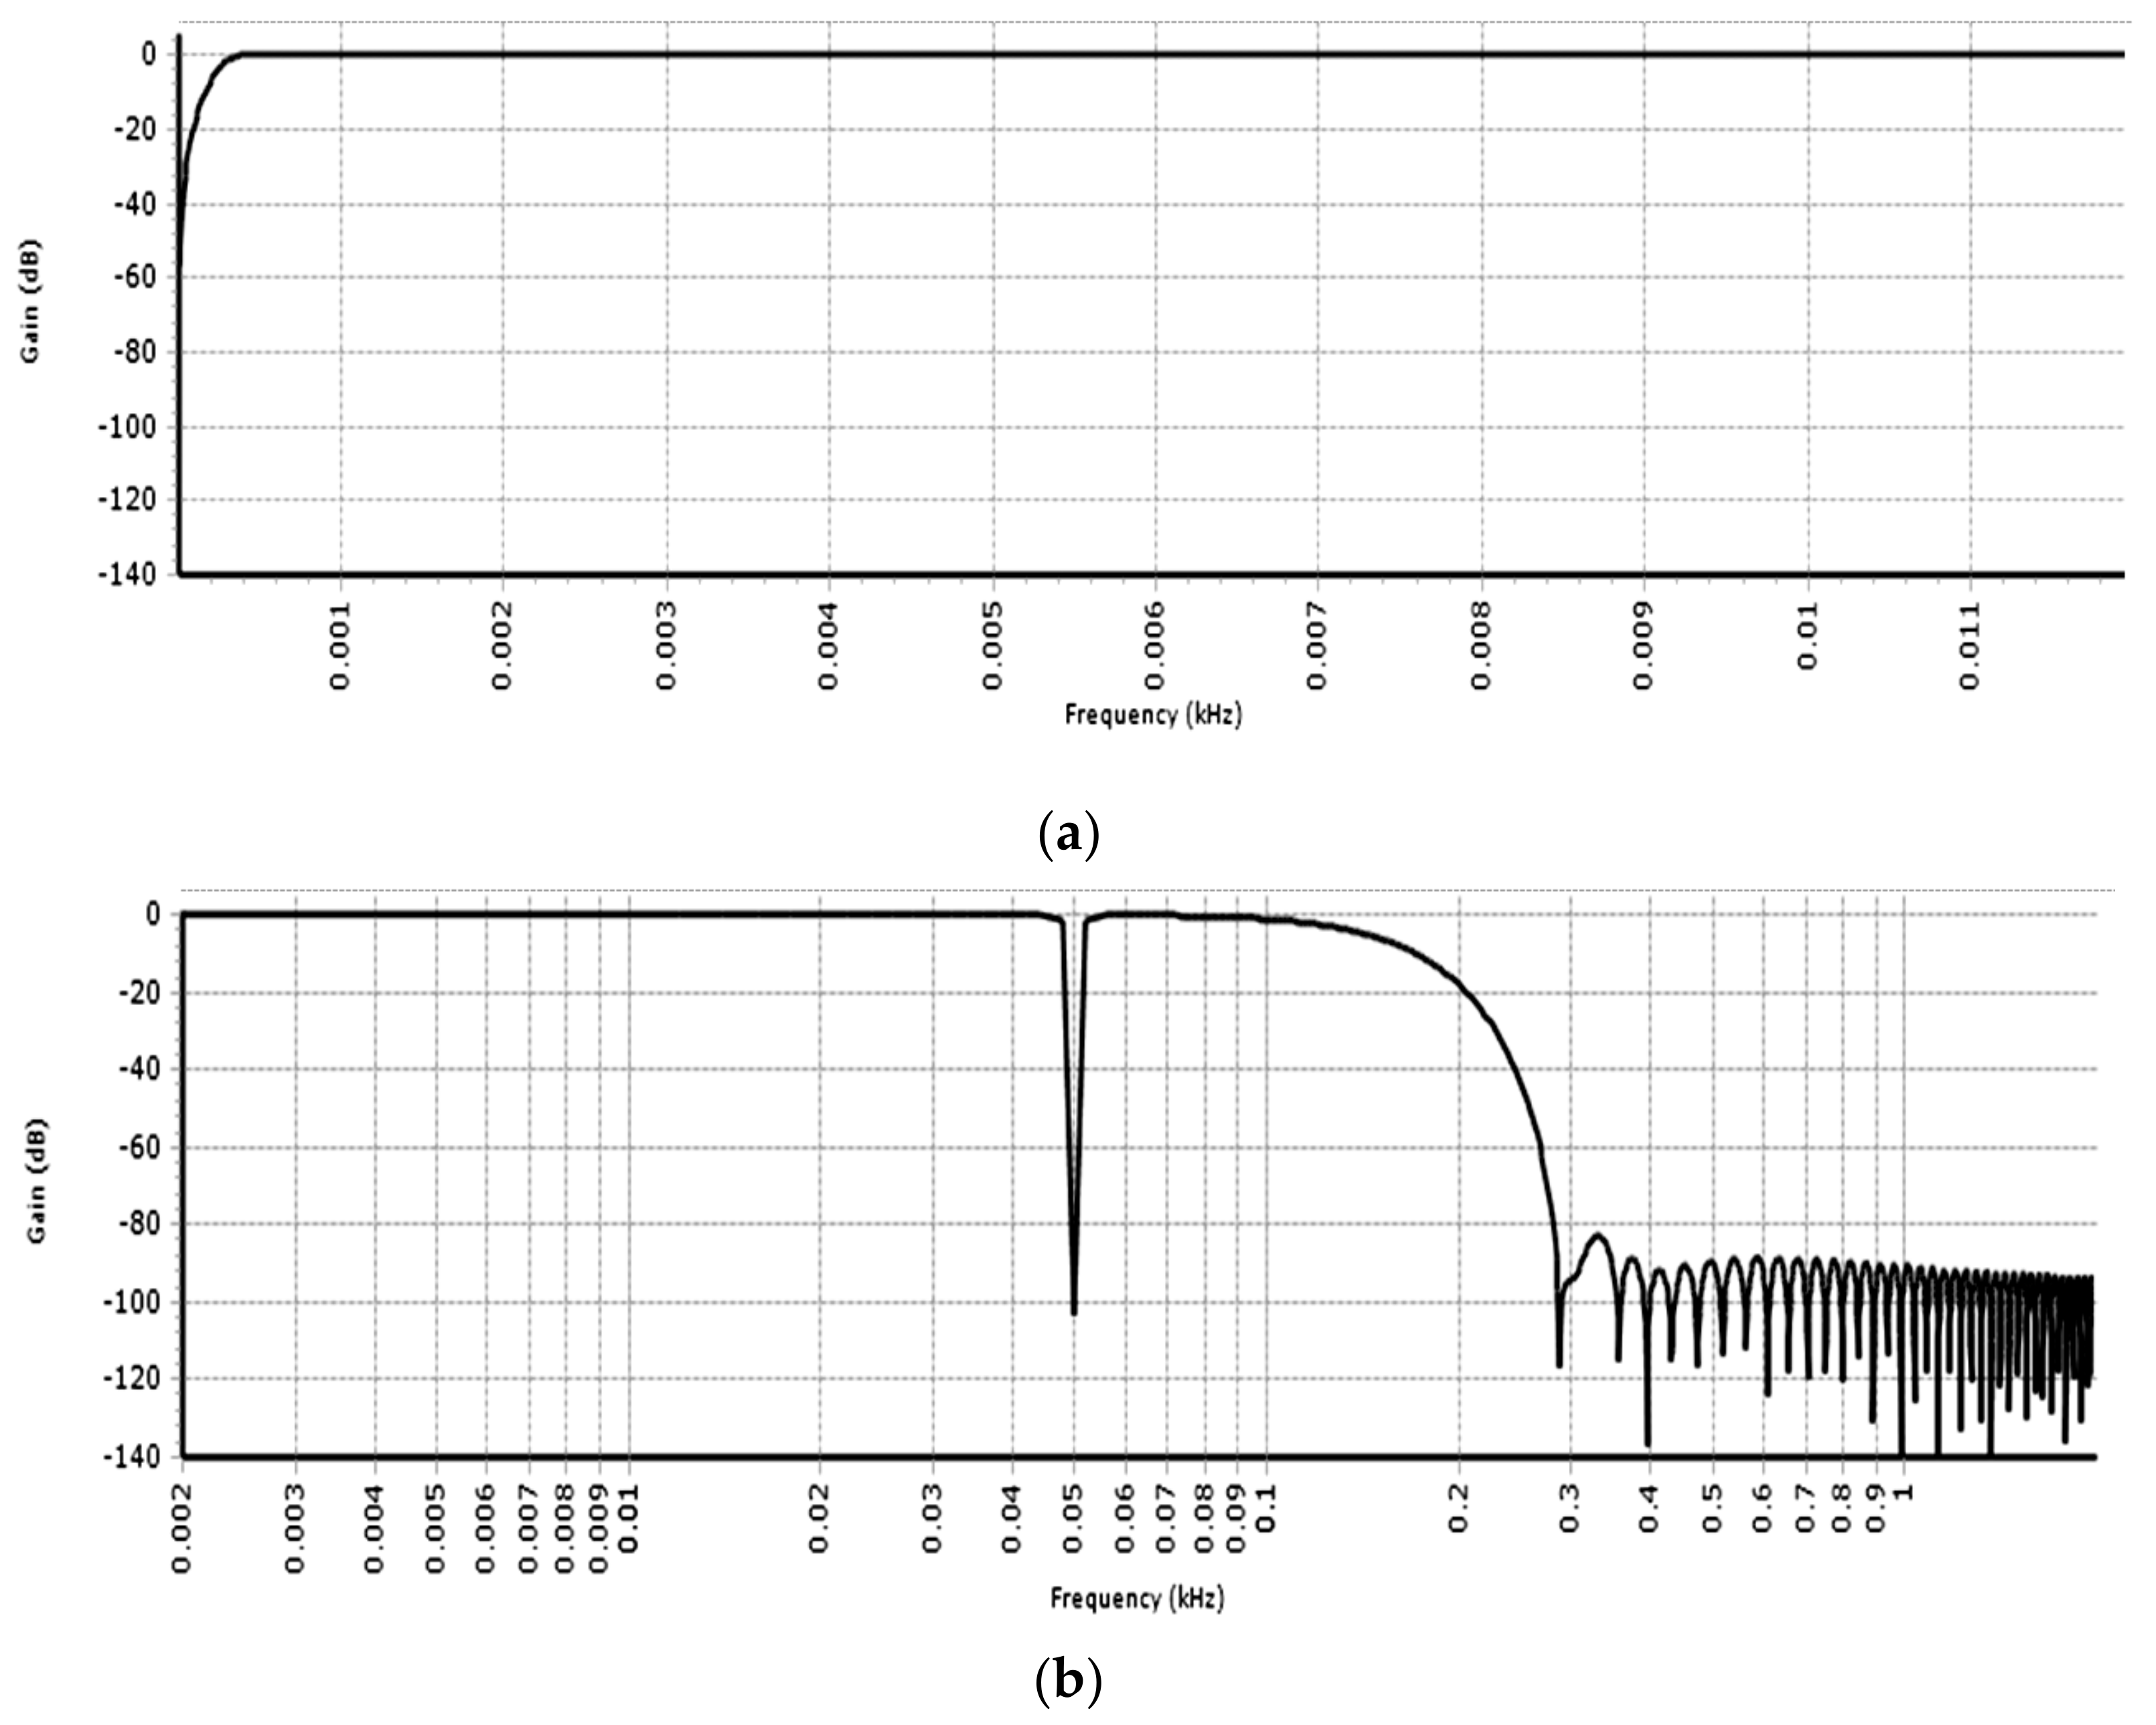
3.1.4. Digital Filtering
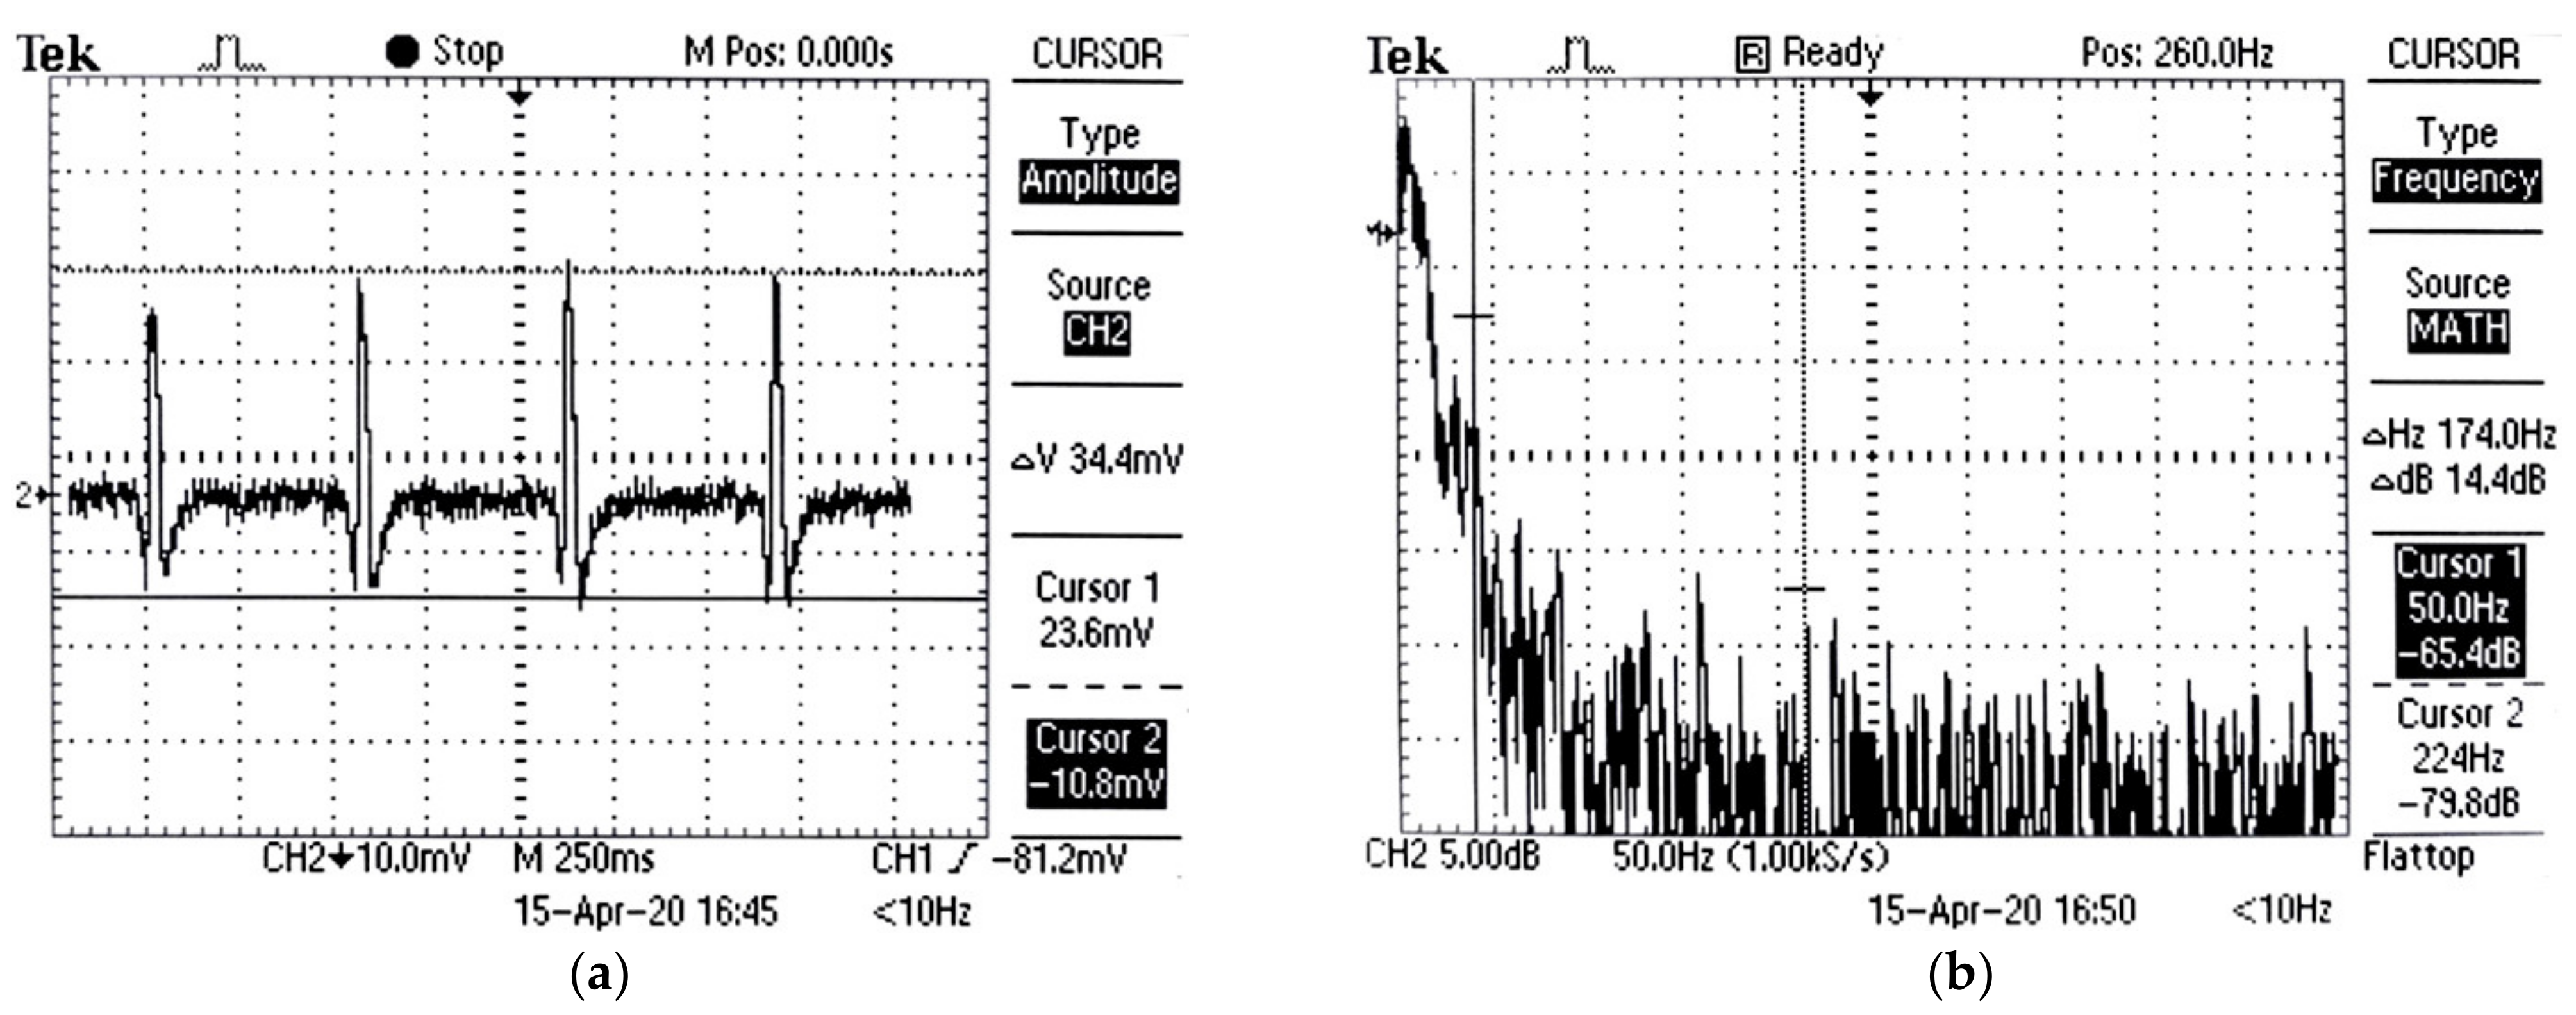
3.2. AFE and PSoC Test Results
3.3. Android Applications Test Results
4. Discussion
4.1. Comparison with RLD Circuit Based Wireless ECG Monitoring Systems
4.2. Comparison with Commercial Real-Time ECG Monitoring Systems
4.3. Limitations
- Like most of the wearable smartphone-based ECG systems, the proposed system allows recording of a single lead ECG signal which limits detection of arrhythmias. For detection of ischemia or other cardiac diseases, more leads are required. Though the proposed system does not allow simultaneous recording of multiple leads, serial recording of multiple leads by the proposed system is feasible. The device thus has the potential to play an important role in the detection of arrhythmias, allowing early screening of cardiac disorders. Due to the complexity of this process, relevant screening and diagnostic studies of the proposed device will be carried out in future studies.
- The DATU power consumption is high, and it supports only 25 h of operation before the next recharge. Continuous mode of operation, high sampling rate, and 12-bit ADC are responsible for the high-power consumption. PSoC 5LP consumes most of the power in active power mode and around 2 µA in deep sleep mode. It is, thus, if the DATU is run in the sleep wake-up mode then the device can be run for much longer periods of time before the next recharge. The duration and frequency of data recording depends on the doctor’s advice. It thus will necessitate the inclusion of a control feature in the doctor’s application to set the ECG test duration and frequency. In addition, significant power can be saved if the device is run at a low sampling rate and/or a reduced resolution ADC is used at the cost of sacrificing performance. Furthermore, the authors recommend using the Cypress Semiconductor CYBLE-416045–02 Ultra Low Power BLE Module [53]. The recommended BLE module offers a transmit power of +4 dBm against +6 dBm transmit power used in the HM-10 module.
- The rural residents are less likely to own a smartphone as compared to the urban or suburban residents. However, the use of smartphones in rural areas is on the rise recently due to their affordability. For example, a recent budget iVOOMi Android smartphone is priced at $55 [54]. The current cost can still present a problem for rural residents from low-income countries. Therefore, Government efforts are needed to provide subsidies on the purchase of smartphones and offer low-cost data plans to rural communities to support digitalization and use of telehealth technologies.
4.4. Improvements and Future Work
- Detection of detailed cardiac abnormalities in the home environment (for patients of different age groups) and the heart rate variability.
- Development of a three-lead wearable patch-type ECG device.
- Detection of motion artifacts through adaptive filtering methods and removal through denoising methods.
- Use of machine learning to identify CVDs.
- Development of a full-scale database for long-term healthcare applications.
- Development and use of dry electrodes to reduce patient discomfort.
5. Conclusions
Author Contributions
Funding
Data Availability Statement
Acknowledgments
Conflicts of Interest
References
- WHO. Cardiovascular Diseases (CVDs): Key Facts. Available online: https://www.who.int/news-room/fact-sheets/detail/cardiovascular-diseases-(cvds) (accessed on 13 March 2021).
- Bansilal, S.; Castellano, J.M.; Fuster, V. Global burden of CVD: Focus on secondary prevention of cardiovascular disease. Int. J. Cardiol. 2015, 201, S1–S7. [Google Scholar] [CrossRef] [Green Version]
- The Relationship between Rural Setting and Health: Factors that Influence Individuals with or at Risk of CVD. American Heart Association. Available online: https://www.heart.org/-/media/files/about-us/policy-research/policy-positions/social-determinants-of-health/rural-health-policy-guidance.pdf?la=en (accessed on 13 March 2021).
- Liu, L.; Liu, J. Mobile phone-enabled control of medical care and handicapped assistance. Expert Rev. Med. Devices 2011, 8, 757–768. [Google Scholar] [CrossRef] [PubMed]
- Morón, M.J.; Luque, R.; Casilari, E. On the Capability of Smartphones to Perform as Communication Gateways in Medical Wireless Personal Area Networks. Sensors 2014, 14, 575–594. [Google Scholar] [CrossRef] [PubMed]
- Jurik, A.; Weaver, A. Remote Medical Monitoring. Computer 2008, 41, 96–99. [Google Scholar] [CrossRef]
- Kakria, P.; Tripathi, N.K.; Kitipawang, P. A Real-Time Health Monitoring System for Remote Cardiac Patients Using Smartphone and Wearable Sensors. Int. J. Telemed. Appl. 2015, 2015, 373474. [Google Scholar] [CrossRef] [PubMed] [Green Version]
- Abawajy, J.H.; Hassan, M.M. Federated Internet of Things and Cloud Computing Pervasive Patient Health Monitoring System. IEEE Commun. Mag. 2017, 55, 48–53. [Google Scholar] [CrossRef]
- Tsamis, G.; Grammatikakis, M.; Papagrigoriou, A.; Petrakis, P.; Piperaki, V.; Mouzakitis, A.; Coppola, M. Soft real-time smartphone ECG processing. In Proceedings of the 2017 12th IEEE International Symposium on Industrial Embedded Systems (SIES), Toulouse, France, 14–16 June 2017; pp. 1–4. [Google Scholar]
- Chatzigiannakis, I.; Valchinov, E.S.; Antoniou, A.; Kalogeras, A.; Alexakos, C.; Konstantinopoulos, P. Advanced observation and telemetry heart system utilizing wearable ECG device and a Cloud platform. In Proceedings of the 2015 IEEE Symposium on Computers and Communication (ISCC), Larnaca, Cyprus, 6–9 July 2015; pp. 25–30. [Google Scholar] [CrossRef] [Green Version]
- Sanders, D.; Ungar, L.; Eskander, M.A.; Seto, A.H. Ambulatory ECG monitoring in the age of smartphones. Clevel. Clin. J. Med. 2019, 86, 483–493. [Google Scholar] [CrossRef] [PubMed]
- Alivecor Kardia Mobile. Available online: https://www.alivecor.com/previous-labeling/kardiamobile/00LB17.1.pdf (accessed on 12 May 2021).
- Wireless Heart Health Mobile-Enabled Rapid Cardiovascular Screening Improves Health Care for Rural Patients in China. Available online: https://www.qualcomm.com/media/documents/files/wireless-heart-health-improves-health-care-for-rural-patients-in-china.pdf (accessed on 10 April 2021).
- Walsh, J.A.; Topol, E.; Steinhubl, S.R. Novel Wireless Devices for Cardiac Monitoring. Circulation 2014, 130, 573–581. [Google Scholar] [CrossRef] [PubMed]
- Engel, J.M.; Mehta, V.; Fogoros, R.; Chavan, A. Study of arrhythmia prevalence in NUVANT Mobile Cardiac Telemetry system patients. Annu. Int. Conf. IEEE Eng. Med. Biol. Soc. 2012, 2012, 2440–2443. [Google Scholar]
- NowCardio. Available online: https://contex-tech.com/medical/nowcardio (accessed on 10 April 2020).
- QardioMD. Available online: https://www.getqardio.com/qardiomd-heart-health (accessed on 10 April 2020).
- QardioCore, Powerful Features. Available online: https://www.getqardio.com/qardiocore-wearable-ecg-ekg-monitor-iphone (accessed on 28 June 2021).
- AN77759 Getting Started with PSoC5LP. Available online: http://www.cypress.com/?rID=60890 (accessed on 13 April 2021).
- Becchetti, C.; Neri, A. Medical Instrument Design and Development: From Requirements to Market Placements; John Wiley & Sons, Inc.: Hoboken, NJ, USA, 2013. [Google Scholar]
- Carlos, C. Heart Rate Monitor and Electrocardiograph Fundamentals. Freescale Semiconductor, 2009, Application Note Document Number: AN4059, Rev. 0, 3/2010. Available online: https://www.nxp.com/docs/en/application-note/AN4059.pdf?&%3Btid=AMdlDR (accessed on 16 May 2021).
- INA128PA Datasheet. Available online: https://www.ti.com/lit/ds/symlink/ina128.pdf?&ts=158936196185 (accessed on 10 April 2021).
- TLC2262 Dual Advanced LinCMOS Rail-to-Rail Operational Amplifier. Available online: http://www.ti.com/product/TLC2262 (accessed on 22 April 2021).
- Townsend, K.; Cufí, C.; Akiba, D.R. Getting Started with Bluetooth Low Energy: Tools and Techniques for Low-Power Networking; O’Reilly Media, Inc.: Sebastopol, CA, USA, 2014. [Google Scholar]
- Lenis, G.; Pilia, N.; Loewe, A.; Schulze, W.H.W.; Doessel, O. Comparison of Baseline Wander Removal Techniques considering the Preservation of ST Changes in the Ischemic ECG: A Simulation Study. Comput. Math. Methods Med. 2017, 2017, 9295029. [Google Scholar] [CrossRef] [PubMed]
- PSoC Creator Integrated Design Environment. Available online: https://www.cypress.com/products/psoc-creator-integrated-design-environment-ide (accessed on 22 April 2020).
- CY8CKIT-050 PSoC® 5LP Development Kit. Available online: https://www.cypress.com/documentation/development-kitsboards/cy8ckit-050-psoc-5lp-development-kit (accessed on 22 April 2020).
- HM Bluetooth Module Data Sheet. Available online: http://fab.cba.mit.edu/classes/863.15/doc/tutorials/programming/bluetooth/bluetooth40_en.pdf (accessed on 13 May 2021).
- HM-10 Data Sheet. Available online: https://people.ece.cornell.edu/land/courses/ece4760/PIC32/uart/HM10/DSD%20TECH%20HM-10%20datasheet.pdf (accessed on 13 May 2021).
- Zhengbo, Z.; Ha, C.; Zhang, Z. Design and evaluation of a ubiquitous chest-worn cardiopulmonary monitoring system for healthcare application: A pilot study. Med. Biol. Eng. Comput. 2017, 55, 283–294. [Google Scholar] [CrossRef] [PubMed]
- Pololu 5V Step-Up/Step-Down Voltage Regulator S7V8F5. Available online: https://www.pololu.com/product/2123 (accessed on 13 May 2021).
- Pololu 3.3V Step-Up/Step-Down Voltage Regulator S7V8F3. Available online: https://www.pololu.com/product/2122 (accessed on 13 May 2021).
- MAX1044 Datasheet (PDF)-Maxim Integrated Products. Available online: https://www.alldatasheet.com/datasheet-pdf/pdf/72725/MAXIM/MAX1044.html (accessed on 13 May 2021).
- MIT App Inventor2. Available online: http://appinventor.mit.edu/explore/ai2 (accessed on 16 May 2021).
- Firebase Real-Time Database. Available online: https://firebase.google.com/docs/database/?gclid=EAIaIQobChMI0oba7tet6QIV1w0rCh10egPGEAAYASAAEgKjf_D_BwE (accessed on 16 May 2021).
- Firebase Realtime Database Limits. Available online: https://firebase.google.com/docs/database/usage/limits (accessed on 16 May 2021).
- Hernandez, J.E.; Cretu, E. Simple Heart Rate Monitoring System with a MEMS Gyroscope for Sleep Studies. In Proceedings of the 2018 IEEE 9th Annual Information Technology, Electronics and Mobile Communication Conference (IEMCON), Vancouver, BC, Canada, 1–3 November 2018; pp. 61–67. [Google Scholar]
- CY8CKIT-059 PSoC® 5LP Prototyping Kit Guide. Available online: https://www.cypress.com/file/157971/download (accessed on 16 May 2021).
- Ultra-Low Power, 18-bit Precision ECG Data Acquisition System SLAU516-June 2013-Revised June 2013. Available online: http://www.ti.com/lit/ug/slau516/slau516.pdf?&ts=1589296171885 (accessed on 16 May 2021).
- SKX-2000C ECG Simulator ECG Signal Simulator ECG Generator. Available online: https://www.aliexpress.com/item/32810011459.html (accessed on 27 June 2021).
- Joaquinito, R.; Sarmento, H. A wireless biosignal measurement system using a SoC FPGA and Bluetooth Low Energy. In Proceedings of the 2016 IEEE 6th International Conference on Consumer Electronics—Berlin (ICCE-Berlin), Berlin, Germany, 4–7 September 2016; pp. 36–40. [Google Scholar]
- Bravo-Zanoguera, M.; Cuevas-González, D.; Reyna, M.A.; García-Vázquez, J.P.; Avitia, R.L. Fabricating a Portable ECG Device Using AD823X Analog Front-End Microchips and Open-Source Development Validation. Sensors 2020, 20, 5962. [Google Scholar] [CrossRef]
- Cardiosecur. Available online: https://www.cardiosecur.com/product/ecg-device-for-smartphones-mobile-ecg (accessed on 12 May 2021).
- Zio Patch. Available online: https://fccid.io/2AFBP-AT17P/User-Manual/Users-Manual-3392990.pdf (accessed on 12 May 2021).
- Wang, I.-J.; Liao, L.-D.; Wang, Y.-T.; Chen, C.-Y. A Wearable Mobile Electrocardiogram Measurement Device with Novel Dry Polymer-Based Electrodes. In Proceedings of the 2010 IEEE Region 10 Conf. (TENCON 10), Fukuoka, Japan, 21–24 November 2010; pp. 379–384. [Google Scholar]
- Valchinov, E.; Antoniou, A.; Rotas, K.; Pallikarakis, N. Wearable ECG system for health and sports monitoring. In Proceedings of the 4th International Conference Wireless Mobile Communication Healthcare, Athens, Greece, 20 November 2014; pp. 63–66. [Google Scholar]
- Nemati, E.; Deen, J.; Mondal, T. A wireless wearable ECG sensor for long-term applications. IEEE Commun. Mag. 2012, 50, 36–43. [Google Scholar] [CrossRef]
- Ali, H.; Villaneouva, B.E.; Yaqub, R. Design and Implementation of a Low Cost Wireless Ambulatory ECG Monitoring System for Deployment in Rural Communities. Int. J. Online Biomed. Eng. (IJOE) 2019, 15, 57–79. [Google Scholar] [CrossRef]
- Rijnbeek, P.R.; Kors, J.A.; Witsenburg, M. Minimum Bandwidth Requirements for Recording of Pediatric Electrocardiograms. Circulation 2001, 104, 3087–3090. [Google Scholar] [CrossRef] [PubMed] [Green Version]
- iHealth Rhythm Connected 1 Lead Electrocardiogram. Available online: https://twitter.com/iHealthLabsEU/status/666529448221614080/photo/1 (accessed on 28 May 2021).
- iHealth Rhythm: Smart One Lead EKG Monitor. Available online: https://www.gottabemobile.com/ihealth-rhythm-smart-one-lead-ekg-monitor (accessed on 28 May 2021).
- iHealth Wireless Health-Care Products. Available online: https://manualzz.com/doc/24747055/ihealth-wireless-health-care-products (accessed on 28 May 2021).
- Cypress Semiconductor CYBLE-416045-02 Ultra Low Power BLE Module. Available online: https://gr.mouser.com/new/cypress-semiconductor/cypress-cyble-416045-02-ble-module (accessed on 28 June 2021).
- Best Mobile Phones under Rs. 5000 in India. Available online: https://www.91mobiles.com/top-10-mobiles-below-5000-in-india (accessed on 29 June 2021).


| Component | Model Name | Parameters |
|---|---|---|
| INA | INA128PA | CMRR 93 dB |
| Supply voltage ∓ 3.3 V | ||
| Gain 54 (adjusted) | ||
| RLD | - | Gain 100 |
| TLC2262 | CMRR 93 dB | |
| Supply voltage ∓ 3.3 V | ||
| U1 based buffer amplifier | Unity gain | |
| U5 based inverting LP filter | Cut-off 50 Hz | |
| LP filter | Single-pole anti-aliasing filter | Cut-off 200 Hz |
| Component | Model Name | Parameters |
|---|---|---|
| ADC | Del_Sig ADC (Sigma Delta ADC) | 12-bit resolution |
| Differential mode range ∓ 2.048 V | ||
| Sampling rate 4 Ksps | ||
| DFB composite filter | Stage 1: Second Order Biquad HP Chebyshev filter | Cut-off 0.5 Hz |
| Stages 2 and 3: Second Order Biquad Band Stop Chebyshev filter | Notch of 10 Hz at 50 Hz | |
| Stage 4: FIR Blackman Filter | Cut-off 150 Hz | |
| - | - | Source voltage 5 V |
| Component | Model Name | Parameters |
|---|---|---|
| Bluetooth | Bluetooth 4 HM-10 | Operating frequency 2.4 GHz |
| Transmit power +6 dBm Receiver sensitivity −23 dBm | ||
| Source voltage 3.3 V |
| Component | Model Name | Parameters |
|---|---|---|
| Regulators | S7V8F5 | Output voltage +5 V |
| S7V8F3 | Output voltage of 3.3 V from 5 V | |
| Inverter IC | MAX1044 | Output voltage of −3.3 V from +3.3 V |
| Battery | Lithiumion battery | 3.7 V, 1000 mAh |
| [45] | [46] | [47] | [48] | This Work | |
|---|---|---|---|---|---|
| Number of Leads | Single | Single | Single | Single | Single |
| Electrodes | Dry reusable | Dry reusable | Dry reusable | Ag/AgCl single use | Ag/AgCl single use |
| INA CMRR (dB) | N/A * | INA333 100 | INA106 86 | INA333 100 | INA128PA 93 |
| Bandwidth (Hz) | 0.05–150 | 1–150 | 0.5–85 | 0.05–150 | 0.5–150 |
| AFE CMRR (dB) | N/A * | N/A * | N/A * | N/A * | Max 121 at 50 Hz |
| RLD | Yes | Yes | Yes | Yes | Yes |
| Microcontroller | TI MSP430 | (SoC) nRF51422 | PIC24FJ64GA | ATmega328P | PSoC 5LP |
| ADC (bits) | 12 | 10 | 10 | 8 | 12 |
| fs (Hz) | 512 | 500 | 500 | 1 K | 4 K |
| Communication Protocol | Bluetooth v2.0 + EDR | ANT | ANT | ZigBee | Bluetooth 4.0 BLE |
| Power | Lithium-Ion battery | Lithium-Ion battery | Lithium-Ion battery | Lithium-Ion battery | Lithium-Ion battery |
| Voltage (V) | 3.7 | 3.7 | 3 | 5 | 3.7 |
| Battery (mAh) | 1100 | 280 | 256 | 3000 | 1000 |
| Battery Life (h) | 33 | 24 | 15 | 39.62 | 25 |
| System Highlights |
|
|
|
|
|
| System Cost (USD) | N/A * | N/A * | N/A * | $70–80 | $55 |
| iHealth Rhythm [50,51,52] | QardioCore [18] | This Work | |
|---|---|---|---|
| Recoding mode | Continuous | Continuous | Continuous |
| Electrodes | ECG patch | Dry | Ag-AgCl |
| Number of leads | Single | Single | Single |
| ADC (bits) | N/A * | 16 | 12 |
| fs (Hz) | N/A * | 600 | 4 K |
| Bandwidth (Hz) | N/A * | 0.04–40 | 0.5–150 |
| AFE CMRR (dB) | N/A * | N/A * | Max 121 dB at 50 Hz |
| Communication Protocol | Bluetooth 4.0 BLE | Bluetooth 4.0 BLE | Bluetooth 4.0 BLE |
| ADC (bits) | N/A * | 16 | 12 |
| Power | Lithium-Ion battery | Lithium-Ion battery | Lithium-Ion battery |
| Battery life (h) | N/A * | 24 | 25 |
| System Highlights |
|
|
|
| Compatibility | Apple and Android | Apple | Android |
| System Cost (USD) | N/A * | $449 | $55 |
Publisher’s Note: MDPI stays neutral with regard to jurisdictional claims in published maps and institutional affiliations. |
© 2021 by the authors. Licensee MDPI, Basel, Switzerland. This article is an open access article distributed under the terms and conditions of the Creative Commons Attribution (CC BY) license (https://creativecommons.org/licenses/by/4.0/).
Share and Cite
Ali, H.; Naing, H.H.; Yaqub, R. An IoT Assisted Real-Time High CMRR Wireless Ambulatory ECG Monitoring System with Arrhythmia Detection. Electronics 2021, 10, 1871. https://doi.org/10.3390/electronics10161871
Ali H, Naing HH, Yaqub R. An IoT Assisted Real-Time High CMRR Wireless Ambulatory ECG Monitoring System with Arrhythmia Detection. Electronics. 2021; 10(16):1871. https://doi.org/10.3390/electronics10161871
Chicago/Turabian StyleAli, Hassan, Hein Htet Naing, and Raziq Yaqub. 2021. "An IoT Assisted Real-Time High CMRR Wireless Ambulatory ECG Monitoring System with Arrhythmia Detection" Electronics 10, no. 16: 1871. https://doi.org/10.3390/electronics10161871
APA StyleAli, H., Naing, H. H., & Yaqub, R. (2021). An IoT Assisted Real-Time High CMRR Wireless Ambulatory ECG Monitoring System with Arrhythmia Detection. Electronics, 10(16), 1871. https://doi.org/10.3390/electronics10161871