Article

IoT Device for Sitting Posture Classification Using Artificial Neural Networks

by
Francisco Luna-Perejón
1,2,*,
Juan Manuel Montes-Sánchez
1,2,
Lourdes Durán-López
1,2,3,
Alberto Vazquez-Baeza
1,
Isabel Beasley-Bohórquez
4 and
José L. Sevillano-Ramos
1,2,3
1
Architecture and Computer Technology Department, ETSII-EPS, University of Seville, 41012 Seville, Spain
2
Robotics and Technology of Computers Lab., University of Seville, 41012 Seville, Spain
3
Research Institute of Computer Engineering, University of Seville, 41004 Seville, Spain
4
Osuna University School, University of Seville, 41640 Seville, Spain
*
Author to whom correspondence should be addressed.
Electronics 2021, 10(15), 1825; https://doi.org/10.3390/electronics10151825
Submission received: 30 June 2021 / Revised: 27 July 2021 / Accepted: 28 July 2021 / Published: 29 July 2021

Abstract

:
Nowadays, the percentage of time that the population spends sitting has increased substantially due to the use of computers as the main tool for work or leisure and the increase in jobs with a high office workload. As a consequence, it is common to suffer musculoskeletal pain, mainly in the back, which can lead to both temporary and chronic damage. This pain is related to holding a posture during a prolonged period of sitting, usually in front of a computer. This work presents a IoT posture monitoring system while sitting. The system consists of a device equipped with Force Sensitive Resistors (FSR) that, placed on a chair seat, detects the points where the user exerts pressure when sitting. The system is complemented with a Machine Learning model based on Artificial Neural Networks, which was trained to recognize the neutral correct posture as well as the six most frequent postures that involve risk of damage to the locomotor system. In this study, data was collected from 12 participants for each of the seven positions considered, using the developed sensing device. Several neural network models were trained and evaluated in order to improve the classification effectiveness. Hold-Out technique was used to guide the training and evaluation process. The results achieved a mean accuracy of 81% by means of a model consisting of two hidden layers of 128 neurons each. These results demonstrate that is feasible to distinguish different sitting postures using few sensors allocated in the surface of a seat, which implies lower costs and less complexity of the system.

1. Introduction

The social-economic progress experienced globally in developed and developing countries has implied numerous changes in several areas. One of the areas that has undergone a radical change is labor. Advances in automation and the technological revolution that computing has brought about have decreased the number of jobs that involve high or medium physical activity in favor of a greater number of office or monitoring jobs: sedentary occupations that involve the use of a video display terminal (VDT) [1]. In addition, new leisure activities that require the use of electronic devices while sitting are also on the rise, contributing to even more sedentary lifestyles than before. All these behavioral changes have increased the time that the population spends sitting [2].
With the increase in the amount of time spent sitting, the rate of musculoskeletal system injuries is becoming higher and higher [3,4]. Studies report that jobs with seated working periods longer than 7 h daily increase the risk of low-back pain [5,6]. According to the Spanish Society of Rheumatology (SER), 80% of the Spanish population has suffered back pain at least once and the remaining 20% has acquired chronic pain [7]. These kinds of injuries are directly and indirectly associated with various diseases and they imply the third leading cause of self-perceived disability in the world [8]. In particular, in countries such as Spain and Switzerland, low-back and neck pain have become the leading causes of disability [9,10].
These types of injuries and pathologies, in addition to a clear deterioration in the quality of life of those who suffer them, also have a notorious economic burden to society. As this type of damage and pathology becomes more frequent, the increase in life expectancy and the years of working life implies a greater use of economic funds for the care and subsidy of sick leave. In Switzerland, in 2004, direct costs are estimated at €2.6 billion and indirect costs at €63 billion, around 2% of gross domestic product [10]. A study estimates that in Germany in 2014 the cost for incapacity for work as EUR 100 billion [11]. In Spain, in 2018, almost EUR 8000 million were spent for work disability and in 2019 they increased to 8637 million, 8.2% more than the previous year [12].
There are numerous studies that seek prevention of these pathologies, using different approaches. The methods that have proven more effective are the ones that deal with exercising, in combination or not with postural education [13,14]. However, there is no evidence that they are effective in the long term [15]. The use of ergonomic material has also been highly studied and there are a large number of commercial solutions. The main drawbacks of this type of resource are its high cost and that, without adequate training, users do not use them properly. Other common approaches focus on educating the population about correct postural habits and other health aspects [16,17], through the development of teaching materials, as well as the implementation of campaigns and training sessions. In general, they focus on providing generic training and do not give a personalized solution to the bad postural habits that each person may have. The use of back belts has also been studied, as a corrective and minimal intervention element [18]. However, there is no clear evidence of their effectiveness without complementing them with physical exercise.
Most recent approaches include biofeedback and cognitive behavioral training. This is based on making the users aware of the postures they perform, so that they can correct them according to their needs. These types of perspectives allow continuous monitoring of the users, knowing their behavior and providing feedback autonomously [19,20]. Some studies include the use of cameras [21], but their implementation in workplaces can raise privacy problems. For this reason, the use of instrumented office supplies, mainly chairs with sensors, is more common. The main advantages of these systems is that they allow continuous monitoring to alert the user of a bad postural habit, providing personalized learning, as well as allowing data to be collected so that it can be analyzed more thoroughly by health professionals. These devices can also help to analyze the most decisive factors that cause long-term injuries, establishing which are the most damaging postures or whether, as some studies suggest [22,23], any sustained sitting posture could result in pain if it persists uninterrupted for extended periods.
With the advancement in Machine Learning algorithms, it has been possible to create devices that are often more effective on a larger population group compared to those that integrate threshold-based algorithms [24]. In particular, with the advances achieved over Artificial Neural Networks (ANN) [25,26], it is possible to obtain more effective results while tolerating disturbances that should be solved with signal filtering and correction systems, to the point where it is possible to simplify the complexity of the system. These properties have made them very popular today for studying regression and classification problems of different scope [27,28]. They have proven to be effective in many health and monitoring related applications, and using samples of different types as inputs, such as spatial samples taken in an instant of time [29,30], sample characteristics obtained after a frequency analysis [31,32,33], or as a result of applying convolutional operations [34,35].
In this work, we aim to detect different sitting postures with a small number of sensors and little data processing prior to the use of the classifier algorithm in order to analyze whether the creation of a less expensive system is possible, both in economic and computational terms.
The following sections of this paper are organized as follows: first, in the ‘Related Work’ section, the most recent works related to the problem addressed in this study are summarized. After this, in the ‘Materials and Methods’ section, the device design, dataset acquisition and Machine Learning models evaluated are presented. Next, in the ‘Results and Discussion’ section, the dataset obtained from data acquisition process is described, and the models’ classification effectiveness results are presented and analyzed. Finally, conclusions are presented.

2. Related Works

Previous works included the use of force sensors or accelerometers arranged in office chairs to identify the user’s posture, but some others considered the development of image-based classifier algorithms. In this section we considered recent studies that are based on the use of devices to identify different postures while sitting.
In [36] the PoSeat system, a seat cushion consisting of 16 force sensors and an algorithm based on Vector Support Machines as posture classifier, was presented. The authors stated that it was capable of classifying five different positions, but the accuracy of the system was not disclosed.
Another system was presented in [37], consisting of a chair with one accelerometer and 20 Force Sensitive Resistors (FSR) allocated in the seat pan, the backrest, and the armrest, sampling at 100 Hz. The research study was conducted with 41 participants and 6 different sitting postures were considered. Several Machine Learning algorithms was analyzed (Support Vector Machines, Multinomial Regression, Boosting, Neural Networks, and Random Forest), reporting best results using Random Forest. The mean accuracy reached was 90.9% using all the sensors and an accuracy of 81.8% was reached using only the 10 sensors placed on the seat pan.
In [38], the authors classified six different sitting positions using a commercial textile pressure mat named Sensomative Science®. It consisted of a 14 × 14 pressure sensor matrix sampling at 1.5 Hz. The study considered six different positions and used a Random Forest algorithm as classifier. This work was conducted with 62 participants and it achieved a classification accuracy of 90%. The study described in [39] presented a Deep Learning Fully Convolutional Network to classify eight sitting postures using the samples sensed by a medilogic® Seat Pressure Measurement System. This system consisted of 480 piezoresistive sensors, but a subsampling was applied in order to reduce the number of sensing elements to 56. The classifier reached an accuracy of 98.9%. The number of participants in the dataset was not revealed.
In [40], the authors presented a system consisting of 81 and 90 FSR sensors placed in seat pan and backrest respectively. This work analyzed the accuracy of a Spiking Neural Network to identify 15 different sitting postures. The study was conducted with 19 users, achieving 88.5% accuracy.
Finally, in the work presented in [41] the authors implemented a computer vision system with a Deep Learning Convolutional Neural Network classifier, specifically a model based on Mobilenet v2. The study was conducted with 11 participants and the model achieved 68.3% accuracy classifying six sitting postures.
In this work we delved into the creation of a device that classifies different positions while sitting, reducing the number of sensors and the computational complexity of the system. We focused on the use of analog pressure sensors for this purpose, as well as to avoid recording information that may involve inconveniences regarding privacy.

3. Materials and Methods

In this section, the device design and the elements that make up the entire system are detailed. In order to analyze the feasibility to recognize different sitting postures, a dataset composed of correctly labeled records collected by the device is needed. Details about the data acquisition process carried out are also conveyed in this section. Finally, the Machine Learning-based models, which were trained and evaluated to analyze the effectiveness of Artificial Neural Networks (ANNs) as classifiers in this task, are described.

3.1. Internet of Thing

An Internet of Thing (IoT) device was designed for acquiring the data. This consists of three parts:
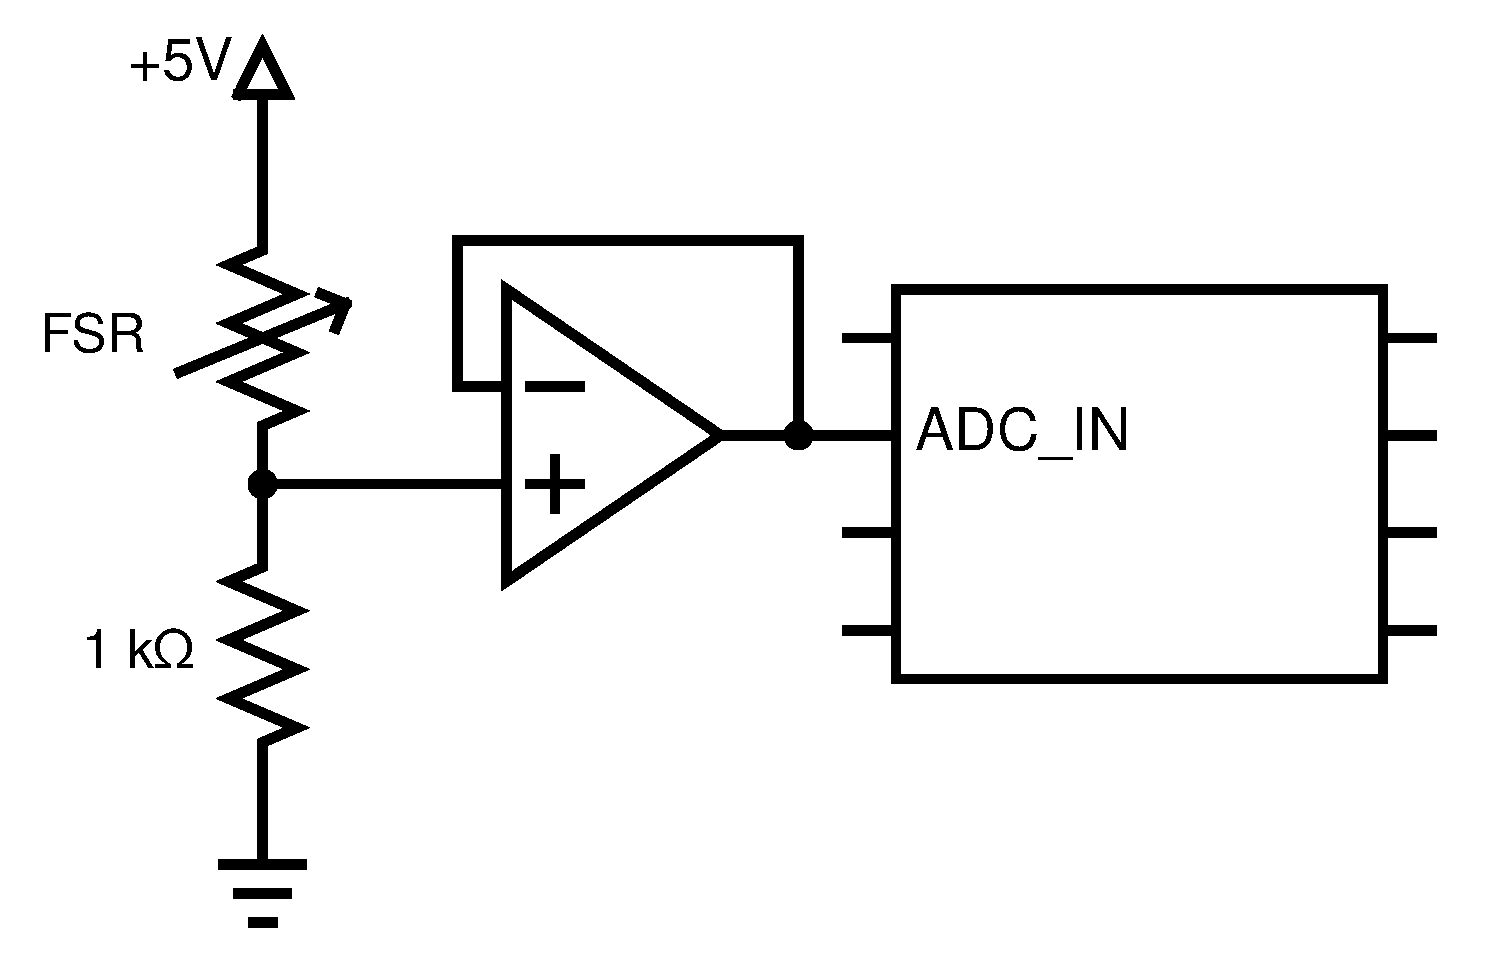
  • The sensor seat: For measuring changes in force distribution, 6 FSR were used. This kind of force sensor has been widely used in similar studies, alone or in combination with inertial measurement unit (IMU) sensors, for measuring changes in body weight distribution when standing or moving [42,43,44] but also when sitting [37,40]. The selected FSRs (FSR01CE, Ohmite®) have a sensing range from circa 20 g to 5 kg and an active area of 39.70 × 39.70 mm 2 and were fixed to a hard chair’s seat following the distribution shown in Figure 1. The sensors were set by observation, in a way that they covered most of the low part of the body in contact with the seat for all participants. Since the aim is to develop a simple, versatile, non-intrusive way of detecting posture changes, no other sensors like IMUs were used and no sensor was placed either in the user nor in the backrest or the armrests of the chair, like previous studies did [37]. A soft seat pillow was placed over the sensors for a homogeneous distribution of weight and as a protector of the sensors and wiring, which are quite fragile. If the pillow is not used, the measuring was the same but then the wiring was in direct contact with the user, which may cause damage to the device. Five different thickness and density pillows were tested, so the one used was selected in a trial and error procedure: The pillow selected was the one which, being thick enough to prevent the sensors and wiring from being damaged, did not change the measurements. A thicker or harder pillow prevented the sensors from detecting some weight variations, while a softer pillow was not enough to protect the device. The sensors were wired to a custom designed printed circuit board (PCB) input containing a simple voltage divider and a operational amplifier in non amplifying buffer configuration for each sensor, as shown in Figure 2.
  • The microcontroller unit (MCU): The custom PCB output was wired to the Analog-to-Digital Converter (ADC) entry-pins of a NUCLEO-F411RE STM32 Nucleo-64 development board, and a proper firmware was developed for gathering, handling and then sending this data via Bluetooth to a PC host. This board contains a STM32F411RE ARM Cortex-M4 core manufactured by ST®, which offers one 12-bit ADC with up to 16 channels. In addition, although this has not been implemented yet, this MCU was chosen because of the easy ANN integration capabilities the manufacturer offers, so in the future the device itself could do the posture classification on board in real time with no need of external computing. This has proven to be better in terms of fast response, enhanced portability, and energy saving by previous studies [43,45]. A Bluetooth Low Energy (BLE) expansion board was also attached to the NUCLEO-F411RE for communication purposes. Using the BLE protocol means less power consumption is needed, so a future revision of the device could run on batteries for a long time.
  • The personal computer (PC) application: A user-friendly interface was designed to show measurements from the sensors and logging the data for further use. The application was developed in javascript and using the node.js and vue.js frameworks, as well as a heat map graphic representation library. The application is run through the browser and it guides the user for obtaining data for each different posture. It also uses promise-based calls both to request MCU pairing and to request sensor values, using the BLE protocol. A heat-map type representation was used to visualize the changes in the sensors in real time, as shown in Figure 3.

3.2. Dataset

As indicated before, a dataset was developed in order to train and evaluate the ANN which classifies the different postures. For this purpose, the considered positions were recorded from different participants using the developed device.
The dataset developed for this work is attached as a Supplementary Material associated with this work in order that it can be used in subsequent research by the scientific community.
In this section, the users who have been involved in the data collection and the postures taken by each of them are detailed, as well as the process carried out to register the different postures.

3.2.1. Considered Postures and Participants

The standard way to sit in a chair with a backrest, widely recognized as the correct posture, is in an upright position with the buttocks occupying the seat from the rear, so that the back is correctly rested on the backrest. By following this practice, the time that can be spent in a sedentary position without injury is longer. Other positions taken while sitting over a long period of time are more inadequate and should be avoided.
In this study, six inadequate usual postures together with the upright one were considered to be classified. These seven positions were also analyzed in related works [38,42], covering the most common habits when sitting. Specifically, the postures considered in this study are based on those carried out in [37], whose supplementary material contains schematized illustration of these postures. Table 1 summarizes the description for each considered posture. It should be noted that during the recording of the activities, the participants were not provided illustrations of the postures to be carried out, but rather the postures were described with the phrases indicated in the table. This was done to avoid a misinterpretation by the participant in key aspects of each posture and not to condition what was observed in the images, and thus it recorded more realistic postures.
The postures were performed by 12 volunteers. The participants were 8 males and 4 females aged between 19 and 50, with heights between 1.58 and 1.92 m and weights between 45 and 117 kg. They were informed about the postures to be carried out, and records were acquired without prior training.

3.2.2. Acquisition Process

For the registration of all the positions considered, a chair with a back and armrests was used. We asked each participant to perform two repetitions for each pose for approximately 15 s, so that when a repetition of each position considered had been recorded, a second iteration was carried out to collect the second repetitions. During the recording of each posture, the system collected the values sensed by the device. Each sample obtained corresponds to the values of the FSRs. Approximately 120 samples were obtained for each repetition, which means a sampling frequency of about 8 Hz. A JavaScript Object Notation (json) file with the data collected was generated for each log.

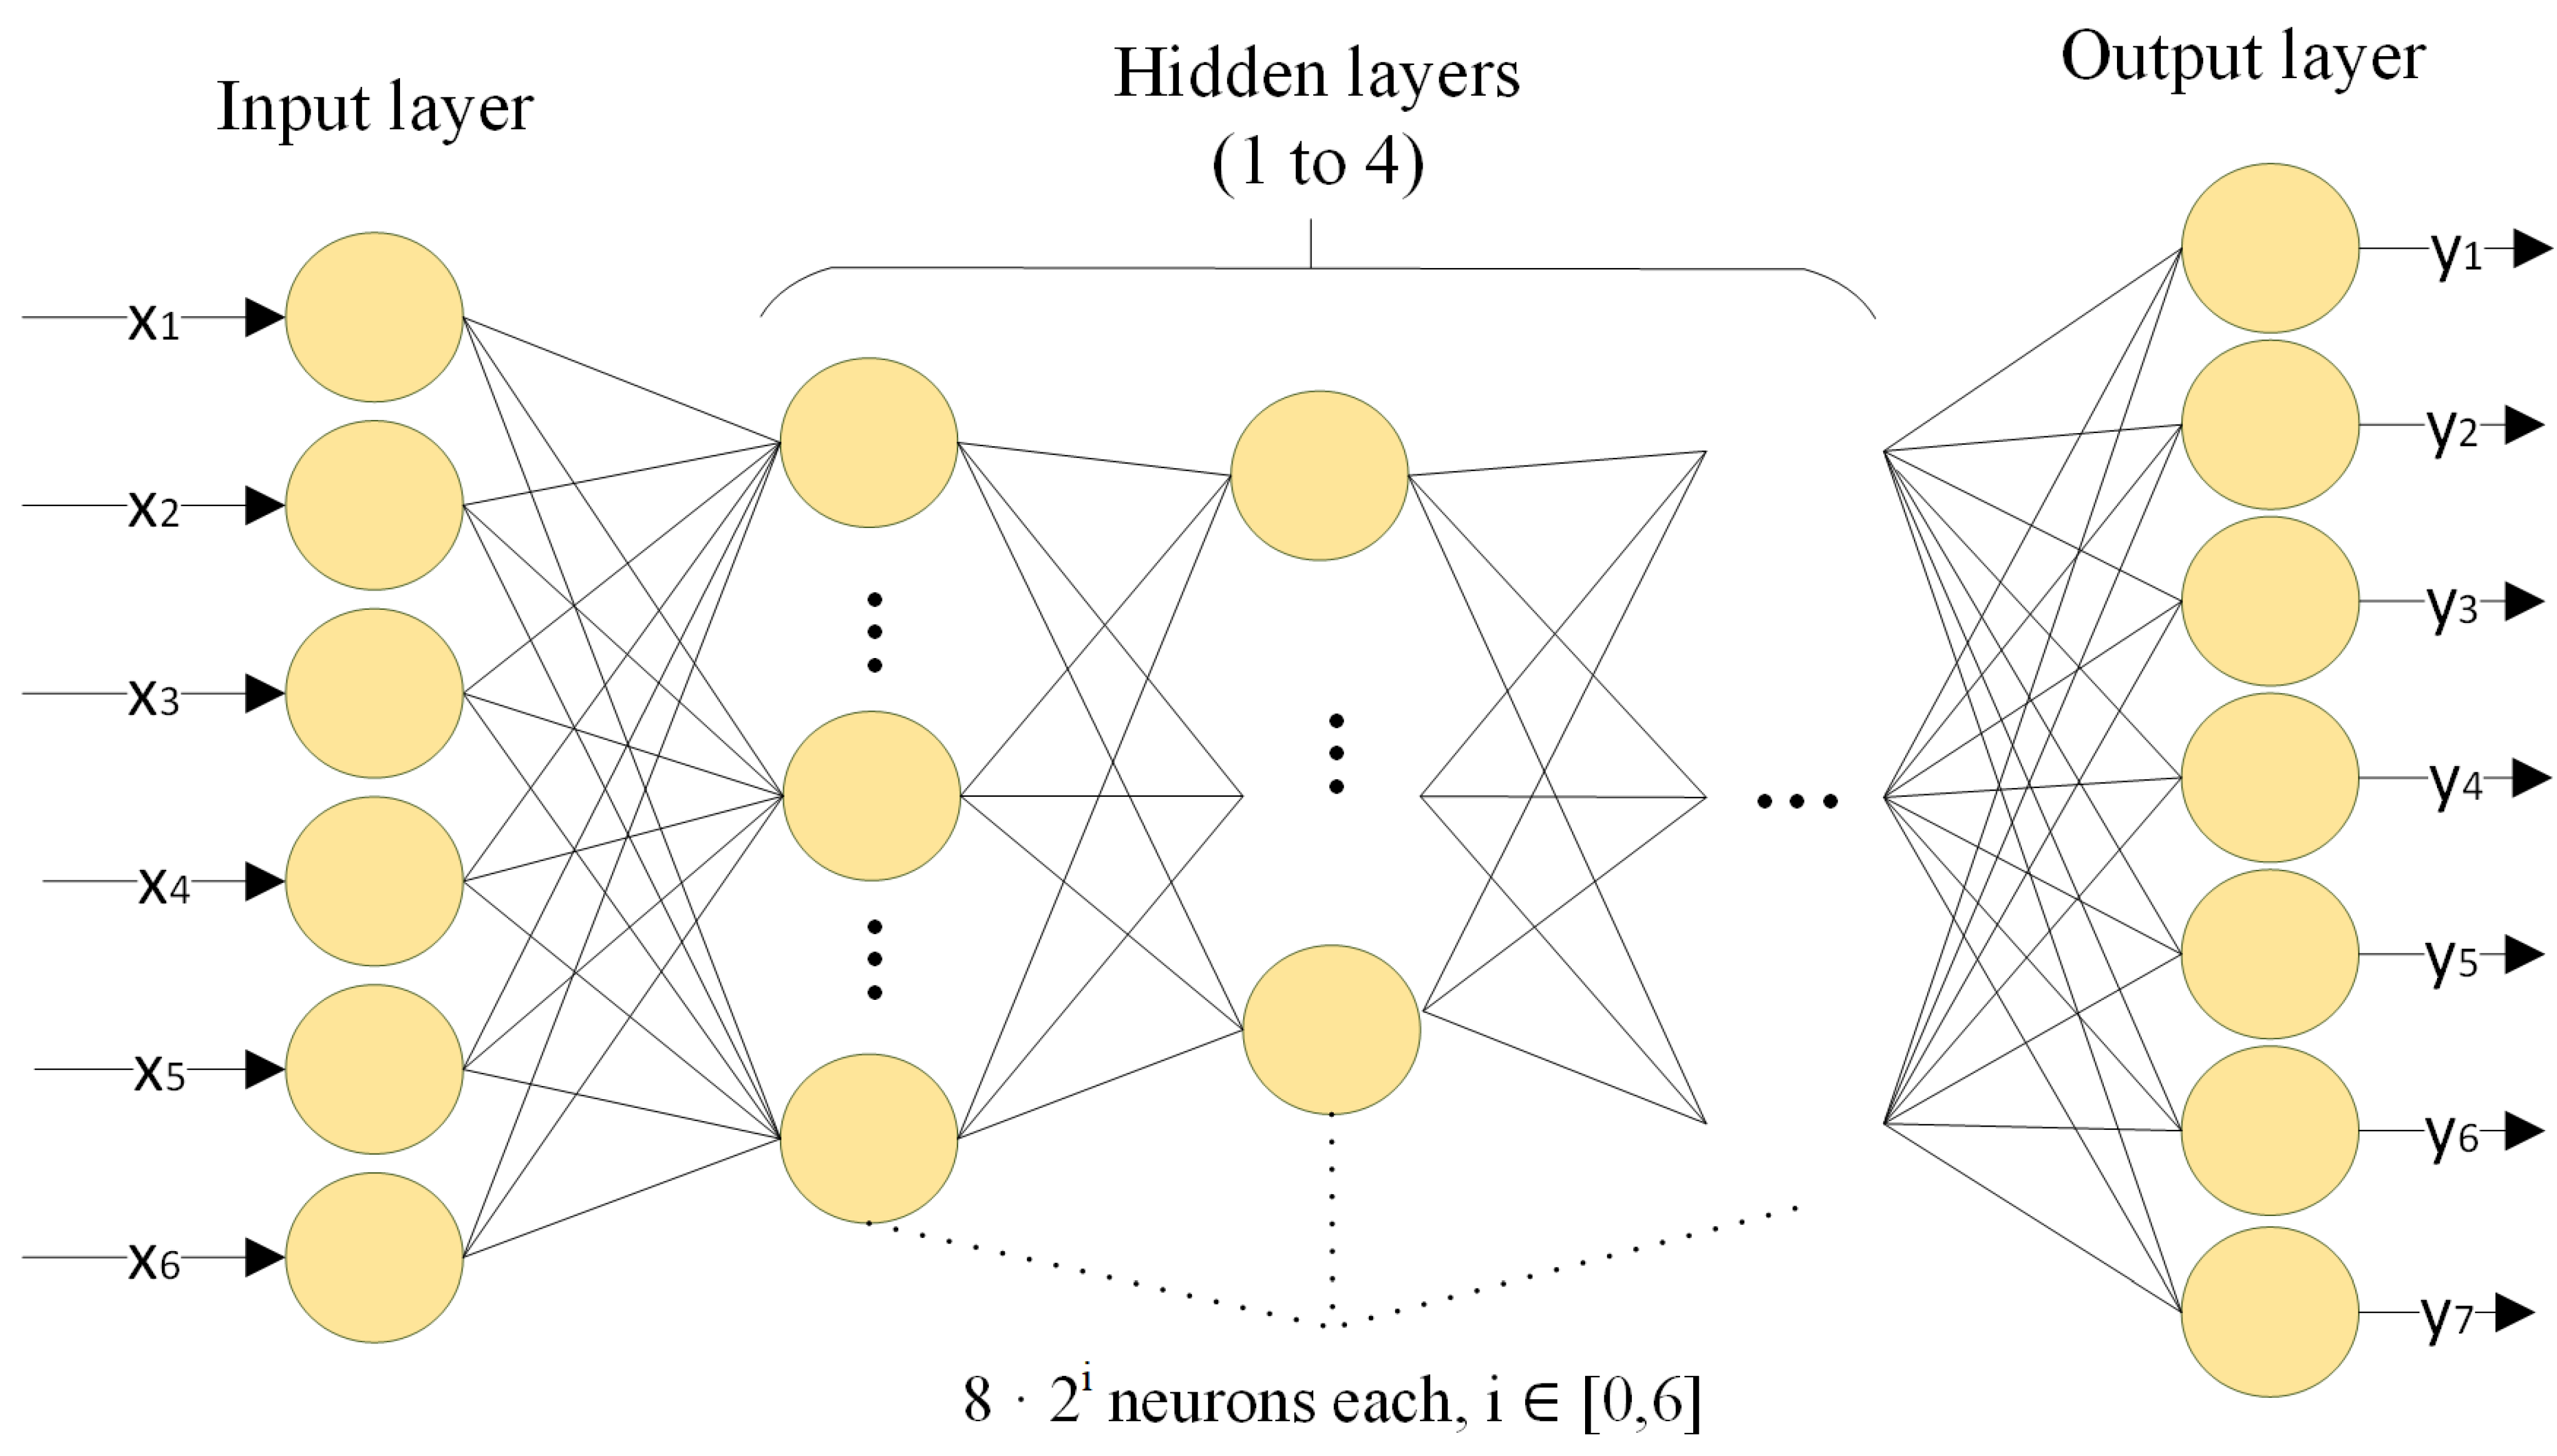
3.3. ANN-Based Machine Learning Classifier

In this work, an ANN model was used to classify the aforementioned seven postures. Several models were trained and tested with the dataset in order to establish the best neural network configuration based on the number of hidden layers as well as the number of neurons for each of them (see Figure 4).
Six neurons, which receive the output obtained for each of the system’s sensors, were set in the input layer. Different experiments were carried out with models having between one and four hidden layers, each of them with 8, 16, 32, 64, 128, 256, and 512 neurons. Finally, the last layer was connected to a Softmax decision layer of seven neurons which predicts the corresponding class. For designing, training, and validating the model, both TensorFlow (https://www.tensorflow.org (accessed on 28 July 2021)) and Keras (https://keras.io (accessed on 28 July 2021)) were used.

3.4. Evaluation Metrics

The effectiveness of the classification system was measured using different and well-known metrics: accuracy, sensitivity (also known as recall), specificity, precision, and F1-score [46]. Those metrics are presented in the next equations:
a c c u r a c y = c T P c + T N c T P c + T N c + F P c + F N c , c c l a s s e s
s e n s i t i v i t y = c T P c T P c + F N c , c c l a s s e s
s p e c i f i c i t y = c T N c T N c + F P c , c c l a s s e s
p r e c i s i o n = c T P c T P c + F P c , c c l a s s e s
F 1 s c o r e = 2 p r e c i s i o n s e n s i t i v i t y p r e c i s i o n + s e n s i t i v i t y
where c l a s s e s set includes the seven sitting postures considered in this study; TP means True Positive, that is, the number of cases that belong to this class and are correctly classified; FP refers to False Positive, which means the number of cases that do not correspond to this class but are incorrectly classified as belonging to this class; TN means True Negative, consisting in the number of cases that do not belong to this class and have not been classified as it; and finally FN refers to False Negatives, which means the number of cases that belong to this class but are incorrectly classified as belonging to other class. With regards to those metrics:
  • Accuracy is the proportion of TP and TN in all evaluated cases (see Equation (1)).
  • Sensitivity (Recall) refers to the proportion of TP in all the cases that belong to this class (see Equation (2)).
  • Specificity is the proportion of TN in all cases that do not belong to this class (see Equation (3)).
  • Precision refers to the proportion of TP in all cases that have been classified as it (see Equation (4)).
  • F1 score considers both the precision and the sensitivity (recall) of the test to compute the score. It is the harmonic mean of both parameters (see Equation (5)).
The mean Area Under Receiver Operating Characteristic (ROC) Curve (AUC) was also calculated. The ROC curve shows the diagnostic ability of a binary classifier system as its discrimination threshold is varied. The AUC is a commonly used metric that measures the area that is under the ROC curve, where an area of 1 represents a perfect test. As the idea for the ROC curve is to carry out a pairwise comparison between two classes, and, since this study consists of seven different classes, the one-versus-all strategy was applied, where the ROC curve for a specific class was calculated against the rest of the classes.

4. Results and Discussion

4.1. Data Processing

After the data was obtained following the acquisition protocol described in Section 3.2.2, the dataset was created. A preprocessing step was applied to the original data in order to reduce the large samples’ variability and therefore improve the quality of the dataset. As the sampling frequency established in the acquisition process was relatively high (eight samples per second approximately), spikes may appear in the sample collection of some of the sensors’ output, which could add noise to the dataset. For this reason, the moving average filter was used for calculating the averages for each continuous five samples of the full dataset, thus, reducing extreme outliers that may prevent the network from adjusting correctly. After that, the preprocessed data was normalized so that all values were within the range of 0 and 1. This normalization speeds up the learning phase and leads to a faster convergence.
The network was trained using approximately 85% of the dataset, while the 15% was used to validate the system and measure how good it was when analyzing new unseen samples. The training and validation split was made per user so that each of the participants was involved only in one set. Therefore, ten participants were considered for the training phase while the remaining two were left for the validation step.
Figure 5 shows the data distribution for the seven classes considered. Y axis represents the range of values that the sensors’ output could take (from 0 to 5000), while X axis corresponds to the samples obtained over the recording time. In order to observe the general tendency of the sensor’s output distribution for each class, the average for each posture was calculated over all the participants. As it can be observed, for class 1 (posture 1), the sensors’ output remain in the same range of values, from 4000 to 4500 approximately, which is reasonable as the weight of the user is mostly equally distributed between all the sensors. This fact also occurs in posture 3, where the user sits in a similar way comparing to posture 1, with the main difference being that the torso is bent forward. In class 2 (the user sits in a reclined position), sensors 1 and 2, which are located in the two positions closest to the chair’s backrest (Figure 1), recorded lower values than the rest. The data pattern shown for classes 4 and 5, which both correspond to a posture where the user’s torso is inclined laterally to the right (posture 4) or left (posture 5), is reasonable for class 4 but not expected for class 5. Instead of showing similar but mirrored values of the sensors, whether the torso of the participant is inclined to the left or right side, the weight distribution changes in a notorious way for each side. Classes 6 and 7, in which the user has an upright posture with the right or left leg over the opposite one (postures 6 or 7, respectively), present a sensor whose output is clearly lower than the others: sensor 3 in the case of posture 6 and sensor 4 in the case of posture 7, which are placed under the leg that is raised (Figure 1).

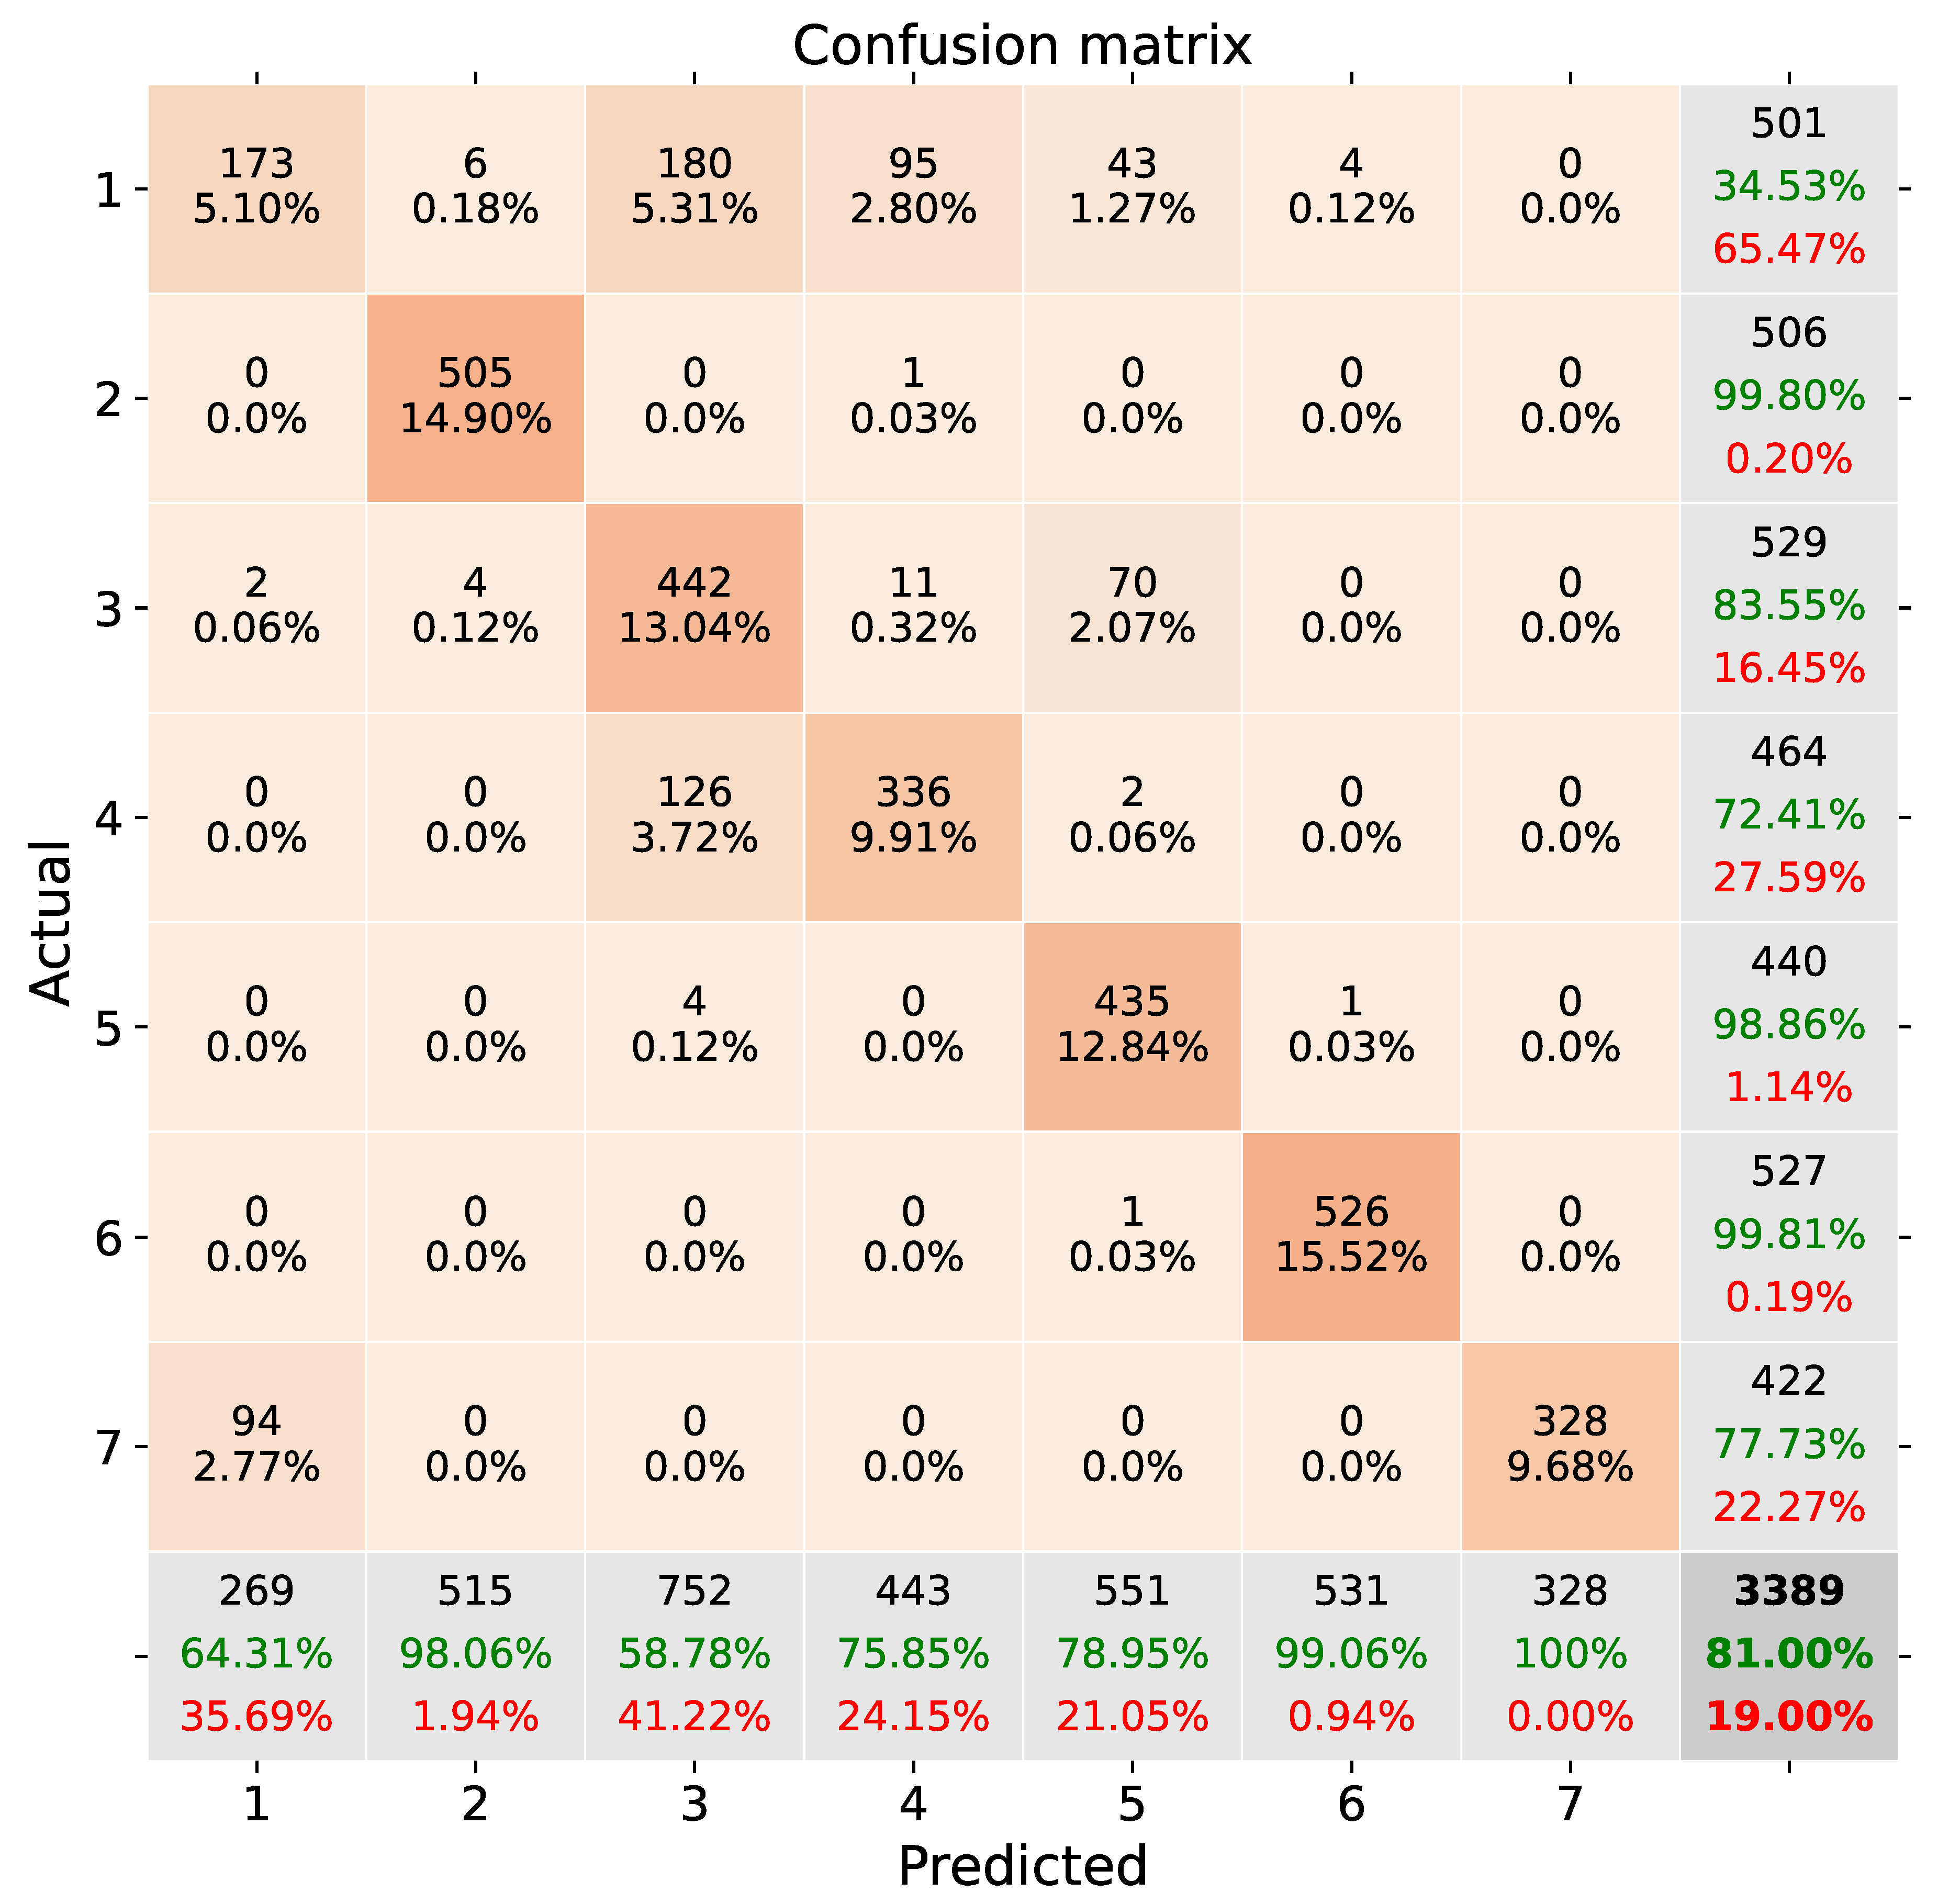
4.2. Classification Results

Table 2 summarizes the results obtained in terms of accuracy for the different experiments that were carried out using the aforementioned dataset with different ANN architectures. In order to provide robust results, the accuracy of a specific model was obtained by calculating the maximum over the resultant accuracies after training and evaluating the model five times. As it can be seen from this table, the model that achieved the best result consists of 2 hidden layers of 128 neurons each. This model obtained 81.00% accuracy in this experiment.
After this experiment, the best model was analyzed in detail in order to provide a deeper evaluation with the metrics presented in Section 3.4. The model achieved 96.40% specificity, 82.14% precision, 80.96% sensitivity, 80.24% F1 score, and 0.9672 AUC. In these results, the high value of specificity stands out, which denotes that the model has an overall high effectiveness at discarding classes to which a certain sample does not belong. The AUC is also high, which denotes a high reliability in the classification of the samples, in terms of probability. Figure 6 shows the confusion matrix for this model, where the whole test set (3369 samples from two users) was used. The X axis corresponds to the actual class (ground truth), and the Y axis represents the predictions performed by the model. In this regard, the last column for a specific ground truth class shows the sensitivity of the model for that class (using a one vs all approach), which is highlighted in green. In the same way, the last row for a specific predicted class presents its precision. The last cell in the major diagonal of the confusion matrix includes the overall accuracy obtained in the experiment.
When analyzing the confusion matrix, it can be seen that posture 1 is the class with lowest sensitivity among the seven different postures considered in this work. The ANN model predicts almost half of the samples corresponding to posture 1 as posture 3, which dramatically reduces the overall accuracy. This could be caused by the fact that, after analyzing the data distribution for the seven classes considered shown in Figure 5, there is a similar pattern in the signals obtained from the force sensors between these two classes. As it was presented in Table 1, these two postures are very similar from the point of view of the force sensors and the seat (the weight of the user is mostly equally distributed between all the sensors). In the study [38], the authors considered combining these two postures in a single class, justifying this solution on the basis that the participants do not usually take the reclined posture.
Regarding other related works, in [38] the effectiveness reached is higher than our solution in this study. However, the complexity of the device used is remarkable due to the large number of sensors that the device has, increasing the costs of the classifier system. Additionally, as mentioned before, this study began by classifying seven classes of postures but finally combined the two most difficult postures to distinguish into a single class. We observed this same disadvantage in studies performed by Wang et al. [40] and Licciardo et al. [39], where the number of sensors used were 56 and 181 respectively and large Deep Learning models were used as classifier. The number of sensors is substantially reduced, as can be seen in [37]. This study also revealed that only using the sensor from the seat pan, the accuracy obtained was reduced by 9%. The results presented in our study suggest that a smaller number of sensors located on the seat may be sufficient to classify the postures considered. Another aspect to take into account in [37] is, although the number of users involved in the samples collection process was higher, the time established for each collection was approximately 5 s. The sampling frequency was high, but the posture disturbance times are too slow to consider that changes can be perceived in 5 s. However, the results obtained suggest that the use of a force sensor on the backrest or the integration of an IMU in the device can improve the effectiveness without a high increase in costs.

4.3. Limitations of the Study

The developed ANN-based system is able to classify different sitting postures by means of six force sensors that are equally distributed in the surface of a seat. However, as in any other research study, this work presents some limitations which are discussed below.
The size of the dataset in terms of the number of participants involved in this study (12 users) has demonstrated that promising results for posture classification can be achieved after training and testing the best ANN model (81.00% accuracy for seven classes) presented in the previous section. Nevertheless, the data acquisition process must be continued in order to obtain a larger dataset. In that case, the variability of the samples would be greater, which means that the network would have a wider range of different data to train with. Hence, a more robust and stable system could be developed.

4.4. Future Works

All the detected limitations led us to rethink some aspects of this study that could have been done in a better way and that certainly would have improved the results. We believe that posture classification could be much accurate if one more sensor is introduced at the backrest of the chair, so postures 1 and 3 could be indistinguishably recognized as themselves by doing so. This sensor could be small and could even give binary response, for easier computation and for keeping the simplicity of the design. Weight, height, and even handedness of the user could be used as system inputs for calibrating the device and improving the results. Signal processing could also be improved by using an enhanced electronic input circuit: using a Wheatstone bridge would be more appropriate for measuring changes on a variable resistor than the voltage divider configuration, and it would probably increase the precision and reduce the noise. Exploring the possibility of new sensors with wider range could also be beneficial to the system. Speaking of digital processing, the MCU could also do some on-board filtering before sending the measures so the classification could be easier and faster. Although not implemented yet, if we look at other ANN implementations on MCUs which have been done successfully [43,45], real time classification with no need of an external computer could be done in the device at very low energy consumption.
With all that in mind, the ultimate goal would be to develop a final working device, fully enclosed, wireless, battery operated, and independent that could do all steps in the device itself: data acquiring, data processing, posture classification, and user notification. Further research must be previously done on how and when the user should be notified about his sitting behavior to positively impact his postural health.

5. Conclusions

In this work, a sitting posture detector system is presented. The classifier algorithm consists of a Machine Learning ANN architecture. The obtained results reveal that the most effective model consisted of two hidden layers and 128 neurons per layer. Based on previous studies, we can consider that the complexity of this model is low enough to be integrated into embedded systems and to be executed in real time.
As far as we know, the system developed is the one with the least number of sensors, with an effectiveness of 81% classifying seven different positions. The results reveal that the system has limitations to distinguish between an upright position and one with the back not resting on the backrest. This fact has also been identified in studies when sensors placed on the back were not used. As a consequence, we consider it necessary to incorporate one or more sensors in the backrest to achieve higher levels of effectiveness.
Due to restrictions derived from the global pandemic situation, a small group of participants was recruited to register sitting postures. For future versions this dataset needs to be expanded with a larger number of participants and repetitions.

Supplementary Materials

Author Contributions

Conceptualization, F.L.-P. and I.B.-B.; methodology, F.L.-P., J.M.M.-S. and L.D.-L.; software, F.L.-P. and L.D.-L.; validation, J.M.M.-S., L.D.-L. and A.V.-B.; formal analysis, F.L.-P. and L.D.-L.; investigation, F.L.-P.; resources, J.M.M.-S. and A.V.-B.; data curation, L.D.-L.; writing—original draft preparation, F.L.-P., J.M.M.-S., L.D.-L., A.V.-B., I.B.-B. and J.L.S.-R.; writing—review and editing, F.L.-P., J.M.M.-S., L.D.-L. and J.L.S.-R.; visualization, J.M.M.-S. and I.B.-B.; supervision, F.L.-P. and J.L.S.-R.; project administration, F.L.-P. and J.M.M.-S.; funding acquisition, J.L.S.-R. All authors have read and agreed to the published version of the manuscript.

Funding

This research was partially funded by the Telefónica Chair ‘Intelligence in Networks’ of Universidad de Sevilla, Spain.

Institutional Review Board Statement

Ethical review and approval were exempted for this study, because all the participants are part of the research group or relatives of some of its members, being aware of the risk and participating completely voluntarily.

Informed Consent Statement

Informed consent was obtained from all subjects involved in the study.

Data Availability Statement

The data presented in this study are available as the Supplementary Material: ‘Posture Dataset’.

Acknowledgments

We thank the Telefónica Foundation (Spain) for its HackForGood and ThinkBig initiatives, during which the device idea was developed, finally obtaining the second HackForGood national award in 2019. We also thank the Research Group “TEP-108: Robotics and Computer Technology” from Universidad de Sevilla (Spain) for its resources.

Conflicts of Interest

The authors declare no conflict of interest.

Abbreviations

The following abbreviations are used in this manuscript:
ADCAnalog-to-Digital Converter
ANNArtificial Neural Network
AUCArea Under Curve
BLEBluetooth Low Energy
FNFalse Negative
FPFalse Positive
FSRForce Sensitive Resistors
HLHidden Layers
IoTInternet of Things
JSONJavaScript Object Notation
MCUMicro-controller Unit
PCPersonal Computer
PCBPrinted Circuit Board
SERSpanish Society of Rheumatology
ROCReceiver Operative Characteristic
TNTrue Negative
TPTrue Positive
VDTVideo Display Terminal

References

  1. Lapointe, J.; Dionne, C.E.; Brisson, C.; Montreuil, S. Effort-reward imbalance and video display unit postural risk factors interact in women on the incidence of musculoskeletal symptoms. Work 2013, 44, 133–143. [Google Scholar] [CrossRef] [PubMed]
  2. Owen, N. Sedentary behavior: Understanding and influencing adults’ prolonged sitting time. Prev. Med. 2012, 55, 535–539. [Google Scholar] [CrossRef] [PubMed]
  3. Wu, S.; He, L.; Li, J.; Wang, J.; Wang, S. Visual display terminal use increases the prevalence and risk of work-related musculoskeletal disorders among Chinese office workers: A cross-sectional study. J. Occup. Health 2012, 54, 34–43. [Google Scholar] [CrossRef] [PubMed] [Green Version]
  4. Dick, R.B.; Lowe, B.; Ming-Lun, L.; Krieg, E.F. Further trends in work-related musculoskeletal disorders-a comparison of risk factors for symptoms using quality of work life data from the 2002, 2006 and 2010 general social survey. J. Occup. Environ. Med. Am. Coll. Occup. Environ. Med. 2015, 57, 910. [Google Scholar] [CrossRef] [Green Version]
  5. Cho, C.Y.; Hwang, Y.S.; Cherng, R.J. Musculoskeletal symptoms and associated risk factors among office workers with high workload computer use. J. Manip. Physiol. Ther. 2012, 35, 534–540. [Google Scholar] [CrossRef]
  6. Subramanian, S. Risk Factor Analysis in Sedentary Office Workers with Low Back Pain. J. Chalmeda Anand Rao Inst. Med. Sci. Vol 2017, 13, 16. [Google Scholar]
  7. García, A.O.; Mendiola, A.H.; de Estudio EPISER, G.; Peña, J.; Carmona, L. Impacto poblacional del dolor lumbar en España: Resultados del estudio EPISER. Revista Española de Reumatología Órgano Oficial de la Sociedad Española de Reumatología 2002, 29, 471–478. [Google Scholar]
  8. Vos, T.; Allen, C.; Arora, M.; Barber, R.M.; Bhutta, Z.A.; Brown, A.; Carter, A.; Casey, D.C.; Charlson, F.J.; Chen, A.Z.; et al. Global, regional, and national incidence, prevalence, and years lived with disability for 310 diseases and injuries, 1990–2015: A systematic analysis for the Global Burden of Disease Study 2015. Lancet 2016, 388, 1545–1602. [Google Scholar] [CrossRef] [Green Version]
  9. Soriano, J.B.; Rojas-Rueda, D.; Alonso, J.; Antó, J.M.; Cardona, P.J.; Fernández, E.; Garcia-Basteiro, A.L.; Benavides, F.G.; Glenn, S.D.; Krish, V.; et al. La carga de enfermedad en España: Resultados del Estudio de la Carga Global de las Enfermedades 2016. Med. Clín. 2018, 151, 171–190. [Google Scholar] [CrossRef]
  10. Wieser, S.; Horisberger, B.; Schmidhauser, S.; Eisenring, C.; Brügger, U.; Ruckstuhl, A.; Dietrich, J.; Mannion, A.F.; Elfering, A.; Tamcan, Ö.; et al. Cost of low back pain in Switzerland in 2005. Eur. J. Health Econ. 2011, 12, 455–467. [Google Scholar] [CrossRef] [Green Version]
  11. Gellert, F.J.; Kesselmann, M.; Wilke, C.B. Arbeitswelt im Wandel. Prävention und Gesundheitsförderung 2018, 13, 12–17. [Google Scholar] [CrossRef]
  12. Falcon, J.; Raul, J. Características Epidemiológicas de la Incapacidad para el Trabajo Debido a Desórdenes Músculo-Esqueléticos en Trabajadores del Ministerio de Salud 2019. 2018. Available online: https://hdl.handle.net/20.500.12727/5490 (accessed on 29 July 2021).
  13. Sihawong, R.; Janwantanakul, P.; Jiamjarasrangsi, W. A prospective, cluster-randomized controlled trial of exercise program to prevent low back pain in office workers. Eur. Spine J. 2014, 23, 786–793. [Google Scholar] [CrossRef] [PubMed] [Green Version]
  14. Moore, C.; Ceridan, E.; Schonard, C.; Marasa, M.; Shaib, F.; Holland, J. Prevention of low back pain in sedentary healthy workers: A pilot study. Am. J. Med Sci. 2012, 344, 90–95. [Google Scholar] [CrossRef] [PubMed]
  15. Steffens, D.; Maher, C.G.; Pereira, L.S.; Stevens, M.L.; Oliveira, V.C.; Chapple, M.; Teixeira-Salmela, L.F.; Hancock, M.J. Prevention of low back pain: A systematic review and meta-analysis. JAMA Intern. Med. 2016, 176, 199–208. [Google Scholar] [CrossRef] [PubMed]
  16. George, S.Z.; Childs, J.D.; Teyhen, D.S.; Wu, S.S.; Wright, A.C.; Dugan, J.L.; Robinson, M.E. Brief psychosocial education, not core stabilization, reduced incidence of low back pain: Results from the Prevention of Low Back Pain in the Military (POLM) cluster randomized trial. BMC Med. 2011, 9, 128. [Google Scholar] [CrossRef] [PubMed] [Green Version]
  17. Lavender, S.A.; Lorenz, E.P.; Andersson, G.B. Can a new behaviorally oriented training process to improve lifting technique prevent occupationally related back injuries due to lifting? Spine 2007, 32, 487–494. [Google Scholar] [CrossRef]
  18. Kraus, J.F.; Schaffer, K.B.; Rice, T.; Maroosis, J.; Harper, J. A field trial of back belts to reduce the incidence of acute low back injuries in New York City home attendants. Int. J. Occup. Environ. Health 2002, 8, 97–104. [Google Scholar] [CrossRef] [PubMed]
  19. Yoo, W.G.; Park, S.Y. Effects of posture-related auditory cueing (PAC) program on muscles activities and kinematics of the neck and trunk during computer work. Work 2015, 50, 187–191. [Google Scholar] [CrossRef]
  20. Yu, E.; Moon, K.; Oah, S.; Lee, Y. An evaluation of the effectiveness of an automated observation and feedback system on safe sitting postures. J. Organ. Behav. Manag. 2013, 33, 104–127. [Google Scholar] [CrossRef]
  21. Taieb-Maimon, M.; Cwikel, J.; Shapira, B.; Orenstein, I. The effectiveness of a training method using self-modeling webcam photos for reducing musculoskeletal risk among office workers using computers. Appl. Ergon. 2012, 43, 376–385. [Google Scholar] [CrossRef]
  22. Coenen, P.; Gilson, N.; Healy, G.N.; Dunstan, D.W.; Straker, L.M. A qualitative review of existing national and international occupational safety and health policies relating to occupational sedentary behaviour. Appl. Ergon. 2017, 60, 320–333. [Google Scholar] [CrossRef]
  23. Claus, A.P.; Hides, J.A.; Moseley, G.L.; Hodges, P.W. Thoracic and lumbar posture behaviour in sitting tasks and standing: Progressing the biomechanics from observations to measurements. Appl. Ergon. 2016, 53, 161–168. [Google Scholar] [CrossRef] [PubMed] [Green Version]
  24. de Quadros, T.; Lazzaretti, A.E.; Schneider, F.K. A movement decomposition and machine learning-based fall detection system using wrist wearable device. IEEE Sens. J. 2018, 18, 5082–5089. [Google Scholar] [CrossRef]
  25. Graupe, D. Principles of Artificial Neural Networks; World Scientific: Singapore, 2013; Volume 7. [Google Scholar]
  26. Glorot, X.; Bordes, A.; Bengio, Y. Deep sparse rectifier neural networks. In Proceedings of the Fourteenth International Conference on Artificial Intelligence and Statistics, Ft. Lauderdale, FL, USA, 11–13 April 2011; pp. 315–323. [Google Scholar]
  27. Aloysius, N.; Geetha, M. A review on deep convolutional neural networks. In Proceedings of the 2017 International Conference on Communication and Signal Processing (ICCSP), Chennai, India, 6–8 April 2017; pp. 0588–0592. [Google Scholar]
  28. Yu, Y.; Si, X.; Hu, C.; Zhang, J. A review of recurrent neural networks: LSTM cells and network architectures. Neural Comput. 2019, 31, 1235–1270. [Google Scholar] [CrossRef]
  29. Gutierrez-Galan, D.; Dominguez-Morales, J.P.; Cerezuela-Escudero, E.; Rios-Navarro, A.; Tapiador-Morales, R.; Rivas-Perez, M.; Dominguez-Morales, M.; Jimenez-Fernandez, A.; Linares-Barranco, A. Embedded neural network for real-time animal behavior classification. Neurocomputing 2018, 272, 17–26. [Google Scholar] [CrossRef]
  30. Selvi, R.T.; Muthulakshmi, I. An optimal artificial neural network based big data application for heart disease diagnosis and classification model. J. Ambient. Intell. Humaniz. Comput. 2021, 12, 6129–6139. [Google Scholar] [CrossRef]
  31. Xu, Z.Q.J.; Zhang, Y.; Xiao, Y. Training behavior of deep neural network in frequency domain. In International Conference on Neural Information Processing; Springer: Cham, Switzerland, 2019; pp. 264–274. [Google Scholar]
  32. Muñoz-Saavedra, L.; Luna-Perejón, F.; Civit-Masot, J.; Miró-Amarante, L.; Civit, A.; Domínguez-Morales, M. Affective state assistant for helping users with cognition disabilities using neural networks. Electronics 2020, 9, 1843. [Google Scholar] [CrossRef]
  33. Khatami, A.; Nazari, A.; Beheshti, A.; Nguyen, T.T.; Nahavandi, S.; Zieba, J. Convolutional neural network for medical image classification using wavelet features. In Proceedings of the 2020 International Joint Conference on Neural Networks (IJCNN), Glasgow, UK, 19–24 July 2020; pp. 1–8. [Google Scholar]
  34. Choi, E.J.; Yoo, Y.; Park, B.R.; Choi, Y.J.; Moon, J.W. Development of occupant pose classification model using deep neural network for personalized thermal conditioning. Energies 2020, 13, 45. [Google Scholar] [CrossRef] [Green Version]
  35. Duran-Lopez, L.; Dominguez-Morales, J.P.; Rios-Navarro, A.; Gutierrez-Galan, D.; Jimenez-Fernandez, A.; Vicente-Diaz, S.; Linares-Barranco, A. Performance Evaluation of Deep Learning-Based Prostate Cancer Screening Methods in Histopathological Images: Measuring the Impact of the Model’s Complexity on Its Processing Speed. Sensors 2021, 21, 1122. [Google Scholar] [CrossRef] [PubMed]
  36. Hu, Y.; Stoelting, A.; Wang, Y.T.; Zou, Y.; Sarrafzadeh, M. Providing a cushion for wireless healthcare application development. IEEE Potentials 2010, 29, 19–23. [Google Scholar] [CrossRef]
  37. Zemp, R.; Tanadini, M.; Plüss, S.; Schnüriger, K.; Singh, N.B.; Taylor, W.R.; Lorenzetti, S. Application of machine learning approaches for classifying sitting posture based on force and acceleration sensors. BioMed Res. Int. 2016, 2016, 5978489. [Google Scholar] [CrossRef] [Green Version]
  38. Bontrup, C.; Taylor, W.R.; Fliesser, M.; Visscher, R.; Green, T.; Wippert, P.M.; Zemp, R. Low back pain and its relationship with sitting behaviour among sedentary office workers. Appl. Ergon. 2019, 81, 102894. [Google Scholar] [CrossRef]
  39. Licciardo, G.D.; Russo, A.; Naddeo, A.; Cappetti, N.; Di Benedetto, L.; Rubino, A.; Liguori, R. A Resource Constrained Neural Network for the Design of Embedded Human Posture Recognition Systems. Appl. Sci. 2021, 11, 4752. [Google Scholar] [CrossRef]
  40. Wang, J.; Hafidh, B.; Dong, H.; El Saddik, A. Sitting posture recognition using a spiking neural network. IEEE Sens. J. 2020, 21, 1779–1786. [Google Scholar] [CrossRef]
  41. Kulikajevas, A.; Maskeliunas, R.; Damaševičius, R. Detection of sitting posture using hierarchical image composition and deep learning. PeerJ Comput. Sci. 2021, 7, e442. [Google Scholar] [CrossRef]
  42. Barkallah, E.; Freulard, J.; Otis, M.J.D.; Ngomo, S.; Ayena, J.C.; Desrosiers, C. Wearable devices for classification of inadequate posture at work using neural networks. Sensors 2017, 17, 2003. [Google Scholar] [CrossRef] [Green Version]
  43. Luna-Perejón, F.; Domínguez-Morales, M.; Gutiérrez-Galán, D.; Civit-Balcells, A. Low-Power Embedded System for Gait Classification Using Neural Networks. J. Low Power Electron. Appl. 2020, 10, 14. [Google Scholar] [CrossRef]
  44. Lee, S.H.; Son, J. Development of a Safety Management System Tracking the Weight of Heavy Objects Carried by Construction Workers Using FSR Sensors. Appl. Sci. 2021, 11, 1378. [Google Scholar] [CrossRef]
  45. Luna-Perejón, F.; Domínguez-Morales, M.J.; Civit-Balcells, A. Wearable fall detector using recurrent neural networks. Sensors 2019, 19, 4885. [Google Scholar] [CrossRef] [Green Version]
  46. Sokolova, M.; Lapalme, G. A systematic analysis of performance measures for classification tasks. Inf. Process. Manag. 2009, 45, 427–437. [Google Scholar] [CrossRef]
Figure 1. Measuring device installed on a chair. The device has bilateral symmetry. All linear dimensions in mm.
Electronics 10 01825 g001
Figure 2. FSR connection to the MCU ADC input (the same for each sensor).
Electronics 10 01825 g002
Figure 3. Screenshot of the PC application while a participant was using the seat. Captions in Spanish are displayed to the user for guidance.
Electronics 10 01825 g003
Figure 4. Diagram of the different ANN architectures analyzed in this study.
Electronics 10 01825 g004
Figure 5. Data distribution distinguishing between the output of the six sensors for each class calculated on average for all the involved participants. These classes represent the seven postures considered for this work described in Table 1. Y axis represents the range of values that the sensors’ output could take, while X axis corresponds to the samples obtained over the recording time.
Electronics 10 01825 g005
Figure 6. Confusion matrix summarizing the results obtained with the best model (two hidden layers, 128 neurons per each).
Electronics 10 01825 g006
Table 1. List of recorded postures.
# PostureDescription
Posture 1In an upright posture, with the back supported by the chair’s backrest and the buttocks placed at the back of the seat.
Posture 2In a reclined position, with only the upper part of the back resting on the back of the chair and the buttocks resting on the front part of the seat.
Posture 3With the torso bent forward, elbows resting on the legs, back completely separated from the backrest.
Posture 4With the torso inclined laterally to the right, armrest supporting part of the weight.
Posture 5With the torso inclined laterally to the left, armrest supporting part of the weight.
Posture 6In an upright posture, similar to posture 1, but with the right leg crossed over the left.
Posture 7In an upright posture, similar to posture 1, but with the left leg crossed over the right.
Table 2. Accuracy results obtained on the different experiments that were performed. Several ANN models were evaluated, exploring different number of hidden layers (HL) and neurons per layer for each case, in order to search for the optimal configuration. The best result (highlighted in bold) is obtained for 2 HLs with 128 neurons per layer.
No. of HLNo. of Neurons
8163264128256512
148.15%70.69%67.21%74.03%63.47%73.14%72.05%
263.26%76.15%65.29%71.05%81.00%73.65%74.68%
363.61%69.07%73.08%75.74%73.26%73.44%72.46%
463.29%67.21%68.13%73.30%74.97%76.86%79.10%
Publisher’s Note: MDPI stays neutral with regard to jurisdictional claims in published maps and institutional affiliations.

