Abstract
For connected vehicles, as well as generally for the transportation sector, data are now seen as a precious resource. They can be used to make right decisions, improve road safety, reduce CO2 emissions, or optimize processes. However, analyzing these data is not so much a question of which technologies to use, but rather about where these data are analyzed. Thereby, the emerging vehicle architecture has to become a data-oriented architecture based on embedded computing platforms and take into account new applications, artificial intelligence elements, advanced analytics, and operating systems. Accordingly, in this paper, we introduce the concept of data management to the vehicle by proposing an on-board data management layer, so that the vehicle can play the role of data platform capable of storing, processing, and diffusing data. Our proposed layer supports analytics and data science to deliver additional value from the connected vehicle data and stimulate the development of new services. In addition, our data platform can also form or contribute to shaping the backbone of data-driven transport. An on-board platform was built where the dataset size was reduced 80% and a rate of 99% accuracy was achieved in a 5 min traffic flow prediction using artificial neural networks (ANNs).
1. Introduction
The United Nations has projected that more than 66% of the world’s population will be urban by 2050—or an increase of 2.5 billion to current urban communities—creating many challenges related to urban living (World Urbanization Prospects, UN-Habitat, 2018). As an obvious consequence, big cities holding more than 10 million inhabitants will be faced with a set of deficits related to the urban mobility, notably with the increased car ownership. For instance, road traffic congestion can be expected to become more intricate, further exacerbating already high negative environmental, social, and economic impacts. As reported by the U.S, ‘2019 Urban Mobility Report’, the trends from 1982 to 2017 show that congestion is a persistently growing problem []. Nevertheless, the intelligent transportation system (ITS), which is one such promising technology, has attracted the interest of many researchers from around the world since it aims at introducing improvements regarding the efficiency and safety level of the roads and transportation system via the adoption of different new information and communication technologies (NICT) on sundry levels, including sensing, communication, application, and computing. Some initiatives are illustrated in [,,,,,,]. Auto manufacturers, stakeholders, transportation agencies, and researchers are working together to make vehicles more intelligent and autonomous, adding new sensing and connectivity solutions coupled with high-performance embedded computing. Today’s cars hold about 40 microprocessors, dozens of sensors, and about 20,000 components []. In addition, wireless technologies and automotive safety have witnessed unprecedented developments over the past 30 years as a variety of vehicle communication networks have been developed under a common term known as vehicle to everything (V2X). With diligent work to move the emerging 5G technology from the labs to real life, cellular vehicle to everything (C-V2X) technology will provide superior performance to support vehicles communicating with transport infrastructure [,]. This high capability of communication and progresses in vehicular sensing technologies have paved the way for one of the most heavily researched ITS technologies, known as connected vehicle technology (CV) [,]. The Connected Vehicle Research project, supported by the United States Department of Transport, ITS Japan, and Co-Operative Networks for Intelligent Road Safety (COOPERS) in Europe, can be considered a successful research-and-development initiative which aims to tackle some of the biggest ITS challenges in the areas of safety, mobility, and environment []. It is evident that, in the connected vehicle scenario, applications are the cornerstone of ITS in supporting sustainable urban development by improving road traffic efficiency, safety, and mobility []. The development of new applications and services for sustainable ITS closely rely on data that play a central role in developing new solutions, tools, and businesses.
On the one hand, there is no doubt that the different types of datasets generated by today’s vehicles feed a variety of multi-modal transportation applications, to expeditiously supply not only motorists, but all transportation users with appropriate information as they can serve as the source for many use cases and services []. Nevertheless, how do we harness the power of those data to connect with road users, turn insights into action, and feed more applications and third-party service providers?
On the other hand, analyzing these data is not so much a question of which technologies to use, but rather about where these data are analyzed. At the present time, technology makers are proposing real models to meet the on-board computing demands. It is possible now to integrate industrial-grade computers into modern cars. Hence, for more flexibility in meeting the daily challenges of autonomous and connected vehicle applications, ITS has to adopt on-board computing technology as an emerging paradigm.
In this paper, to meet the needs of road users and third-party service providers, we introduce the concept of data management to the vehicle by proposing an on-board data management layer, so that vehicle can play the role of data platform capable of storing, processing, and diffusing data. Our proposed layer support analytics and data science to deliver additional value from connected vehicle data, and stimulate the development of new services. In addition, our data layer can also form or contribute to shaping the backbone of data-driven transport.
The main novelty of our data management layer is that it relies on the on-board computing paradigm, which reduces the data processing costs that would be conducted near the source of data generation. Further, it saves massive bandwidth costs by moving workloads to the vehicle. Streamed and generated datasets will locally by stored, analyzed for anomalies, filtered for redundant data points, and reshaped in different forms. Then, only the necessary data are delivered.
2. Background
2.1. Academia
The rapid advancement in the Internet of Vehicles (IoV), along with the ever-increasing data consumption, clearly reflects the importance of data for connected vehicles. If the latter form the center of future intelligent transportation systems, one of the most interesting fields that presents many challenges as we progress is transport data. Certainly, data have great potential and power, and data are the blood that will run through the veins of connected vehicles. In this regard, the increasing focus of the ITS research community towards the subject of data has led to a lot of works and research. The assessment and review of some of the most recent relevant academic studies has led to the conclusion that most of them have treated transport data from three perspectives: (i) data collection; (ii) data sharing; (iii) data analytics.
From the data collection perspective, the authors of [] proposed the recruitment of high reputation users to perform urban sensing for a desired coverage, given a limited budget. Similarly, data collection based on the recruitment of connected vehicles was studied by Author18 [], which required an optimal set of vehicles to be identified and recruited to carry out urban data collection in favor of a service provider to facilitate users on city streets. In other study, Author19 [] focused on how to maximize message coverage in urban vehicular networks by the optimal deployment of roadside units. They considered traffic stream and delay constraints of applications to attentively identify the appropriate site for RSUs. Recently, Author20 [] suggested a solution to collect real-time floating car data using dedicated short-range communication (DSRC).
Some other studies have been conducted on connected vehicles data from the data sharing perspective. Accordingly, the authors of [] dealt with connected vehicles-related data distribution tasks, where they designed an infrastructure to enable large-scale message delivery by labeling and customizing unstructured data into topics to serve a wide range of consumers. Author22 [] discussed the possibility of substituting RSU by city buses widely distributed in the city area to improve intra-cluster BSM dissemination. The authors of [] introduced a unicast backbone-based data distribution technique to decrease data distribution overhead and latency. In mitigating the issues of frequently changing topology, a proposed solution is to construct a vehicular backbone and establish the vehicles’ forwarding tables in view of realizing unicast data delivery and data aggregation.
In view of the data analytics perspective, the authors of [] came up with a big data analytics architecture on autonomous vehicles. The proposed architecture comprises distributed data storage mechanism for a streaming process for real-time analysis and the vehicular cloud server tool for batch processing the offline data. In [], the authors presented a data management approach for a dynamic highway toll pricing application. In [], the authors relied on a Hadoop tool to examine large amounts of traffic data. Particularly, they used MapReduce framework in Hadoop to divide large scale traffic event data into sub-events. Next to that, they applied parallel processing on sub-events to derive anomalous traffic events. The authors of [] conducted a case study where machine learning schemes were applied to analyze vehicular measurement data for efficiently detecting negative communication conditions. In [], several technical challenges that appear when applying data analytics in the context of cooperative intelligent transport systems (C-ITS). The authors also conducted simulation tests to demonstrate how data analytics can help C-ITS applications. In view of meeting the rapidly evolving and increasing data traffic volume in vehicular networks in general, AI-based solutions have shown promising advantages when used to address the various VANET challenges through real-time analysis and decision making with intelligent resource management [].
Summing up, in the transport data domain, the most important ability is the instant and efficient processing of data. However, as illustrated in Table 1, not all previous works have considered the storage and processing tasks; even those that considered it have relied on out-vehicle storage and processing resources, such as cloud and edge resources.

Table 1.
Summary of related works.
2.2. Automotive Industry
From the industry side, autonomous driving is the biggest innovation in the automotive industry. Industry experts such as The Society of Automotive Engineers (SAE) International defined six levels of driving automation ranging from 0 (no driving automation) to 5 (full driving automation) [].
Today, the industry has achieved Level 4 autonomous driving. While autonomous driving innovators work toward achieving fully automated driving, different industries are defining new business models to use the advancement in autonomous driving. Vehicle innovation encompasses the progress in autonomous driving to innovate new services and capabilities that span across industries. Vehicle innovation’s services include the in-vehicle experience and more.
Fully autonomous vehicles do not require human attention, and will not even have steering wheels or acceleration/braking pedals. However, as illustrated in Figure 1, data are its primary driver and therefore should be considered as an essential vehicle part in the engineering and design of Level 5 vehicles.
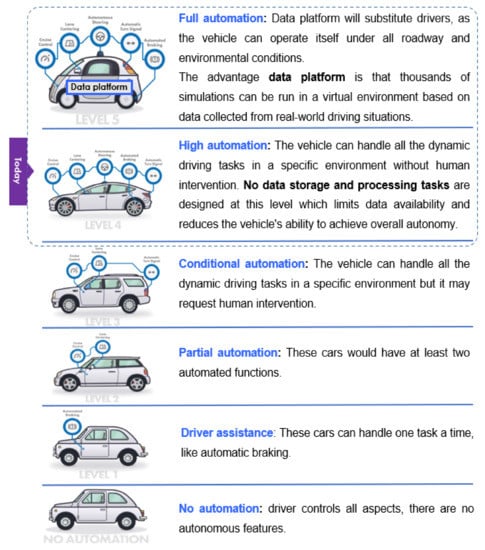
Figure 1.
Levels of autonomy and data platform.
3. On-Board Data Management Layer: Our Proposal
Given our primary goal of how to harness the power of the connected vehicles’ data to connect with road users, feed more applications, and supply third-party service providers, the main idea is to introduce the concept of data management to the vehicle by proposing a new layered data-oriented architecture based on on-board computing.
3.1. Basic Concept
Our data management concept refers to the entire process aimed at storing, processing, and providing the data created or collected by the vehicle. This concept encompasses a wide combination of functions aimed at making data accurate, consistent, valuable available, and accessible.
Figure 2 illustrates the different stages of the data lifecycle in the proposed data management context. On-board computing, also known as embedded computing, is an emerging paradigm that aims to meet the need for low latency and real-time interactive applications by moving a large portion of computing, storage, and networking functions into the vehicle.
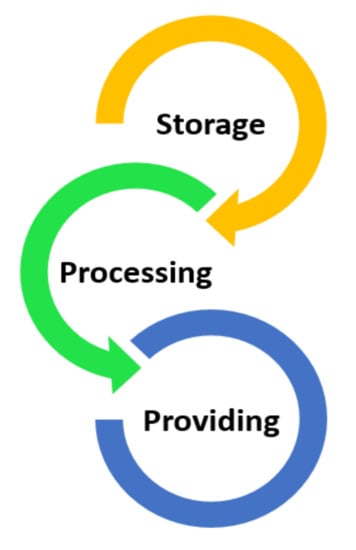
Figure 2.
Basic concept of the proposed data management layer.
3.2. On-Board Data-Oriented Architecture
In our architecture, an on-board computer allows data to be stored and analyzed in proximity of its source, as well as make them available for further uses. Unlike traditional architectures, data coming from the sensor layer do not have to waste all that time getting to the edge or the central data center; this definitely increases speed and reduces response time.
3.2.1. Data Management Layer
The proposed architecture includes a dedicated data management layer where all collected and generated data have to be maintained, stored, processed, and analyzed inside the vehicle to open up new possibilities for an endless reuse of these data. The new architecture is described below and illustrated graphically in Figure 3.
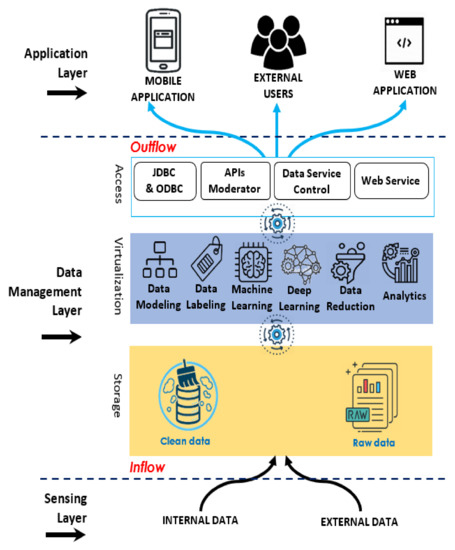
Figure 3.
Proposed data-driven architecture concept.
The sensing layer groups two main categories of data: (1) external data coming from out-vehicle sources, e.g., surrounding vehicles, road-side units (RSUs), and others; (2) internal data generated inside the vehicle through local sensor observations.
- Storage The on-board storage sublayer is the central repository that allows the vehicle to store all incoming flow from the sensing layer as-is in its original format, whether it has been collected from multiple out-vehicle sources or generated inside the vehicle through different sensors and actuator. The storage sublayer includes two types of data: raw data and clean data obtained after processing by the tools of the data science sublayer. The proposed on-board storage allows us the following key features: (1) build applications, namely helps road users, transport agents, and third parties to access the transport data and quickly build the views and data-driven applications they really need; (2) retain data authenticity, namely store and analyze the information in different formats, retaining data authenticity; (3) speed, i.e., the ability to sift through immense quantities of data quickly; (4) explore and analyze, i.e., the ability to explore and analyze data, perform analytics, and derive different values and benefits.
- Virtualization This sublayer represents the area of data science that curates the data into a more manageable structure to break the complexity of raw data. Multiple data science tools are performed at this level to reduce, model, shape, and structure the raw data and perform machine learning to provide useful insights including real-time and historical data.
- Access The access sub-layer helps data to be accessed in various ways by multiple front-end tools. Outflow is at the top of this sublayer. Publishing is performed as data services that allow road users and third parties to reuse the stored data through a push/pull mechanism.
3.2.2. On-Board Computing Paradigm: Advantages
From day to day, vehicles are getting better equipped and smarter. Due to the sufficient storage and computing resources contemporary vehicles hold, they are able to locally carry out complex operations resulting in network burden and latency reductions. These resources are a high-tech embedded industrial computer designed to operate in various harsh conditions of vehicle environment while performing complex tasks, from capturing the data generated by various sensors and devices to the data storing and analyzing to meet the ITS applications requirement.
On-board computing can currently play an effective role in supporting and easing the burdens of classic vehicle cloud computing (VCC) and vehicle edge computing (VEC) [,], but it may become a partial or full replacement for them in the near future. On-board computing, more than a technology, is a design framework of sorts that would redefine the way connected vehicle systems are built and the way they function, which can enhance the whole ITS system.
This emerging paradigm can minimize the latency of the network, i.e., it can minimize the time for response between client and server devices. Since the storing and computing tasks are next to where the data are actually gathered or generated, there is no need for data to travel to and from the distant centralized systems. Additionally, the cost of maintaining high-capacity, long-range networks will be reduced as bandwidth requirements continue to diminish.
4. Study Case: On-Board Data Platform for Machine Learning
In the interest of implementing an on-board data management layer, enabling rapid storage, real-time data analysis, and publishing rapid replies to end-users, which is a pivotal characteristic for connected and autonomous vehicle applications, we performed an implementation of an embedded data platform based on the basic safety message dataset.
4.1. Dataset and Configurations
4.1.1. Data
In the connected vehicle scenario, safety applications are greatly relying on the basic safety message (BSM), which is one of the messages defined in SAE Standard J2735 []. Exploiting the 5.9 GHz dedicated short-range communications band, vehicles broadcast BSMs ten times every second. For the purpose of this study, we received the BSM dataset from the U.S. DOT. The two-month dataset was gathered within the Safety Pilot Model Deployment Data (SPMD) program, conducted from August 2012 to late 2013 in Ann Arbor []. As such, the BSM dataset is an integral part of our data platform and instrumental in the implementation of the data management layer.
4.1.2. On-Board Hardware configuration
The hardware side of our data platform was implemented considering a desktop workstation as an on-board computer. The technical characteristics of the hardware platform are illustrated in Table 2.
Table 2.
Hardware platform features.
4.1.3. On-Board Software Configuration
In order to make our data management layer able to meet the multiple needs of applications and end-users, it is fundamental to choose the appropriate development environment. The incorrect choice will limit our efficiency and prevent our ability to properly implement our software solutions.
Accordingly, to make the development of this data platform easier and faster, we adopted the model-view-controller (MVC) design philosophy and made use of many software tools to set up the development environment: Eclipse, Springboot, MyBATIS, Apache Kafka, Maven, MonetDB, Tomcat, Postgres, Anaconda, TenserFlow, and Deeplearning4j.
4.2. Data Management Layer: Functionalities
Focusing on the data management layer in our proposed stratification, we consider any exploitation of stored data in various cases and scenarios as new reuse of data. Thereby, our platform provides the following functionalities:
- Data Storage;
- Data Modeling;
- Data Reduction;
- Data Analysis;
- Data Publishing;
4.2.1. Data Storage
We first store the inflow in a column-oriented storage: MonetDB raw database as flat files using this rich and real-world connected vehicle dataset available under comma separated files (.csv). The cleaned and modeled data are then moved to a row-oriented storage: Postgres clean database. A 10-record sample for the BSM file collected on 11 April 2013 is given in Table 3.
Table 3.
Sample records for BSM file.
Given that the data items are collected at a frequency of 10 Hz, it is clear that the size of the data table will increase significantly as a result of redundancy resulting in difficulties dealing with. For instance, one day of generated data can reach 16,095,310 rows.
4.2.2. Data Modeling
Looking at the basic safety message data structure, we clearly notice that the latter consists of frames, which in turn contain data elements. As is known, connected vehicle applications directly depend on data elements; for the latter to be useful, they need to be location and time specific. Therefore, it may be useful to store the basic safety messages as data elements since the relation among data for single vehicle can be considered. In general, the best way to store a BSM is as connected data elements. This will permit any application or task to get the contents of required data elements. For that reason, we design the modeling illustrated in Figure 4.
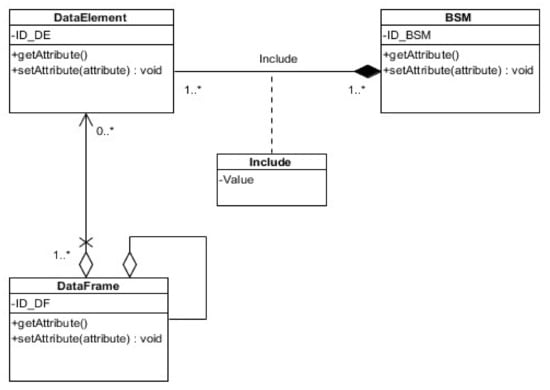
Figure 4.
Data modeling.
4.2.3. Data Reduction
Analyzing the available BSM dataset, we noticed that most vehicles maintain the same speed and direction for a significant amount of time. Therefore, if we consider the broadcasting of the basic safety message is at 10 Hz, during normal traffic flow, the majority of data elements maintain a single value. For instance, as shown in Table 4, 20 sample messages were analyzed for a 2 s time period. For the majority of messages, the only considered change was the position (latitude and longitude). Often times, Messages 2–19 do not hold any useful content.
Table 4.
Summary values of the data elements of the Part 1 dataset.
Table 3 clearly shows the worthy opportunity to compress the message data and reduce the storage and bandwidth requirements. In such cases, data compression methods such as run-length encoding (RLE) illustrated in Figure 5 have been shown to be significant; nevertheless, run-length is not widely compatible with traditional row-oriented databases. Conversely, applying run-length to a column-oriented database may increases the chances of data compression []. Using our raw database, we discovered that the column store system is an appealing method to perform the RLE-based data compression.
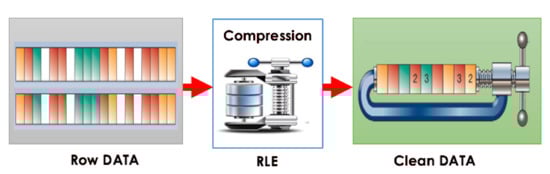
Figure 5.
Data reduction.
In our study, we applied a compression on a single data element: speed. The speed column was first sorted so that the same values are grouped together. Then, the average number of iterations was measured. The larger is the number of iterations, the best are the RLE results. We applied run-length encoding on the available dataset (.csv) stored in our raw database. The original size was about 220 GB, and the results are excellent as the new size was reduced to about 44 GB, which represents 20% of the original size. This means that the ratio of decreasing the BSM bandwidth and storage amount requirement successfully reached 80%.
4.2.4. Data Analysis
As a feature that our proposed layer can provide, we aimed to apply machine learning as a data science tool to analyze the BSM dataset to predict road traffic flow (TF). To do so, we adopted the artificial neural network (ANN) technique following the steps shown in the Figure 6.
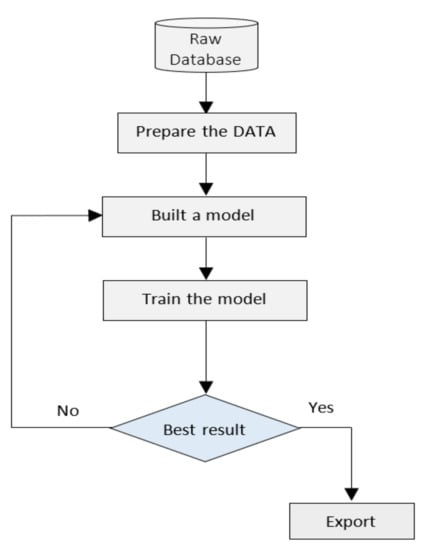
Figure 6.
Data analysis flowchart.
Our data analysis platform was built using TensorFlow, Python, Jupyter Notebooks, and Java, as well as Springnoot for the prediction serving part.
- Preparing data: Exploiting the vehicle type data element, vehicles that have been included in the prediction process were classified into the following categories: commercial vehicles, traveler car, and busses. The analyzed dataset included the traffic amount of the first 3 h in the morning, during the period from 7:00 a.m. to 10:00 a.m. over an entire week across 13.4 miles, as illustrated in Figure 7.
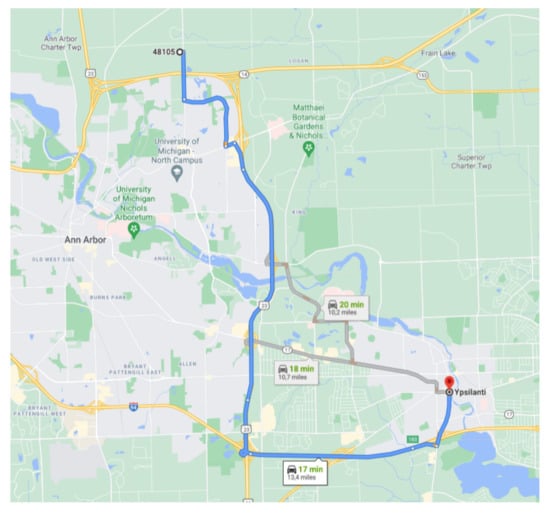 Figure 7. Predicted flow road segment.Traffic flow is usually defined as the count of vehicles that pass through a particular road, path, or intersection during a period of time, usually expressed as vehicles per hour. Using the position data frame, we were able to know how many vehicles have passed through the fragment illustrated in Figure 7 and extract the amount of traffic flow. We also draw attention to the fact that we considered both directions of the road. The 5 min data extraction is shown in Table 5.
Table 5. Velocity and traffic Flow measurement for 5 min interval.
Figure 7. Predicted flow road segment.Traffic flow is usually defined as the count of vehicles that pass through a particular road, path, or intersection during a period of time, usually expressed as vehicles per hour. Using the position data frame, we were able to know how many vehicles have passed through the fragment illustrated in Figure 7 and extract the amount of traffic flow. We also draw attention to the fact that we considered both directions of the road. The 5 min data extraction is shown in Table 5.
Table 5. Velocity and traffic Flow measurement for 5 min interval. - Developing best model: We used the multilayer perceptron (MLP) ANN to fulfill the traffic flow prediction. As a class of feedforward ANN, an MLP consists of at least three layers of nodes: input layer, hidden layer, and output layer. MLP utilizes the backpropagation technique for training.Table 6 includes the set of the analyzed dataset characteristics: date; time; number of traveler cars, buses, and commercial vehicles; median speed of traveler cars, buses, and commercial vehicles; and traffic density, which is indicated by the number of vehicles occupying a road segment. Table 6 also includes the sensibility, which is a mathematical expectation of how the neural network’s output will be affected by the expected deviation of its input.
Table 6. Input layer parameters.To develop the most suitable model, we took the following steps:
- Random arrangement of the dataset.
- Dividing the dataset into subgroups: The training subgroup represents 10% of the dataset; the cross-validation subgroup represents 10%; the test subgroup represents the remaining 80% of the dataset.
- Developing of different ANN models and then training them using the training subgroup; determining the performance of each model using cross-validation subgroup.
- Using different parameters indicated at the top of Table 7 to evaluate different predicted results’ performance.
Table 7. Different developed ANN models.
Based on Table 7, the best ANN model has three hidden neurons. - Results and discussionFigure 8 shows the linear correlation between the expected and real flow values and Table 8 summarizes the output of the eligible ANN test stage.
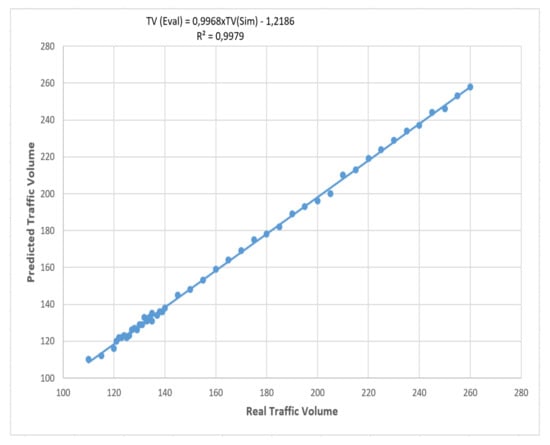 Figure 8. Predicted traffic flow vs real traffic flow.
Table 8. Outputs of the best ANN model.We can clearly see the very small value of errors along with a very good value of the correlation coefficient.Accordingly, it could be considered that our developed ANN has succeeded in reusing the stored data to predict even for a short time the traffic flow in the future. Thus, our data platform can play a major role in providing a valuable transport dataset that can be exploited for machine learning.
Figure 8. Predicted traffic flow vs real traffic flow.
Table 8. Outputs of the best ANN model.We can clearly see the very small value of errors along with a very good value of the correlation coefficient.Accordingly, it could be considered that our developed ANN has succeeded in reusing the stored data to predict even for a short time the traffic flow in the future. Thus, our data platform can play a major role in providing a valuable transport dataset that can be exploited for machine learning.
5. Conclusions
In this paper, we introduce the concept of data management inside the vehicle by proposing an on-board data management layer so that the vehicle can play the role of a data platform capable of storing, processing and disseminating data. Our proposed layer was based on three stages. In the first stage, all incoming flow from the sensing layer as-is in its original format was stored as raw data. In the second stage, a set of treatments was performed to prepare and clean the raw data. In the third stage, new information and insights were provided by reusing previously stored data.
In our study case, we were able to create an on-board data platform where we achieved a considerable lossless data compression. As a matter of fact, we reached the reduction rate of 80%, which definitely has a good impact on storage and bandwidth requirements. Through our platform, we also performed a machine learning task on stored data using the ANN model to predict the traffic flow, where we obtained an accuracy of 0.9979.
However, our work carries some deficiencies that should be acknowledged. First, we solely relied on the available BSM dataset; upcoming works have to focus on the data sensing layer. Second, we tested some functionalities of our platform (i.e., data storage, modeling, reduction and analysis); other functionalities such as data publishing should be considered in future work. Third, our developed platform was tested inside an isolated vehicle; forthcoming works are required to take into consideration the real-world traffic conditions, as well as make our platform publicly available for an accurate testing.
Author Contributions
Conceptualization, K.B.; validation, S.B. and A.M. All authors have read and agreed to the published version of the manuscript.
Funding
This research received no external funding.
Conflicts of Interest
The authors declare no conflict of interest.
References
- Schrank, D.; Eisele, B.; Lomax, T. 2019 Urban Mobility Report; Texas A&M University System: College Station, TX, USA, 2019; Volume 10, pp. 4–7. [Google Scholar]
- U.S. Department of Transportation. Available online: https://www.transportation.gov/ (accessed on 1 June 2021).
- European Commission. Mobility and Transport, Road Safety. Available online: https://ec.europa.eu/transport/road_safety/ (accessed on 1 June 2021).
- European Transport Safety Council. Available online: http://etsc.eu/ (accessed on 1 June 2021).
- Japan Transport Safety Board. Available online: https://www.mlit.go.jp/jtsb/english.html (accessed on 1 June 2021).
- ADSSS—UTMS Society of Japan. Available online: http://www.utms.or.jp/english/system/dsss.html (accessed on 1 June 2021).
- UK Association for the Promotion of Intelligent Transport Systems. Available online: https://its-uk.org.uk/ (accessed on 1 June 2021).
- Australian Trade and investment Commission, Future Transport and Mobility. Available online: https://www.austrade.gov.au/future-transport/ (accessed on 1 June 2021).
- Anderson, J.M.; Nidhi, K.; Karlyn, D.S.; Paul, S.; Constantine, S.; Oluwatola, T.A. Autonomous Vehicle Technology: A Guide for Policymakers; RAND Corporation: Santa Monica, CA, USA, 2016; Available online: https://www.rand.org/pubs/research_reports/RR443-2.html. (accessed on 1 June 2021).
- Molina-Masegosa, R.; Gozalvez, J. LTE-V for Sidelink 5G V2X Vehicular Communications: A New 5G Technology for Short-Range Vehicle-to-Everything Communications. IEEE Veh. Tech. Mag. 2017, 12, 30–39. [Google Scholar] [CrossRef]
- Miucic, R. (Ed.) Connected Vehicles, Intelligent Transportation Systems; Springer International Publishing: Cham, Switzerland, 2019. [Google Scholar]
- MacHardy, Z.; Khan, A.; Obana, K.; Iwashina, S. V2X Access Technologies: Regulation, Research, and Remaining Challenges. IEEE Com. Surv. Tutor. 2018, 20, 1858–1877. [Google Scholar] [CrossRef]
- Wallace, R.; Spulber, A.; Dennis, E.P. International scan of connected vehicle technology deployment efforts. Cent. Automot. Res. Tech. Rep. 2017. Available online: https://www.cargroup.org/publication/international-scan-of-connected-and-automated-vehicle-technology-deployment-efforts/ (accessed on 1 June 2021).
- Siegel, J.E.; Erb, D.C.; Sarma, S.E. A Survey of the Connected Vehicle Landscape—Architectures, Enabling Technologies, Applications, and Development Areas. IEEE Trans. ITS 2018, 19, 2391–2406. [Google Scholar] [CrossRef] [Green Version]
- Robert, G. (Ed.) Intelligent Transportation Systems Functional Design for Effective Traffic Management; Springer International Publishing: Cham, Switzerland, 2016. [Google Scholar] [CrossRef]
- Rettore, P.H.; Maia, G.; Villas, L.A.; Loureiro, A.A.F. Vehicular Data Space: The Data Point of View. IEEE Com. Surv. Tutor. 2019, 21, 2392–2418. [Google Scholar] [CrossRef]
- Khan, J.A.; Doudane, Y.G. ROVERS: Incentive-Based Recruitment of Connected Vehicles for Urban Big Data Collection. IEEE Trans. Veh. Tech. 2019, 68, 5281–5294. [Google Scholar] [CrossRef]
- Abdelhamid, S.; Hassanein, H.S.; Takahara, G. Reputation-aware, trajectory-based recruitment of smart vehicles for public sensing. IEEE Trans. Int. Tran. Sys. Veh. Tech. 2018, 19, 1387–1400. [Google Scholar] [CrossRef]
- Jalooli, A.; Song, M.; Wang, W. Message coverage maximization in infrastructure-based urban vehicular networks. Els. Veh. Com. 2019, 16, 1–14. [Google Scholar] [CrossRef]
- Turcanu, I.; Salvo, P.; Baiocchi, A.; Cuomo, F.; Engel, T. A multi-hop broadcast wave approach for floating car data collection in vehicular networks. Veh. Commun. 2020, 24, 100232. [Google Scholar] [CrossRef] [Green Version]
- Du, J.Y.; Chowdhury, M.; Rahman, M.; Dey, K.; Apon, A.; Luckow, A.; Ngo, L.B. A Distributed Message Delivery Infrastructure for Connected Vehicle Technology Applications. IEEE Trans. Inte. Tran. Sys. Veh. Tech. 2018, 19, 787–801. [Google Scholar] [CrossRef]
- Zeng, L.; Zhang, J.; Han, Q.; Ye, L.; He, Q.; Zhang, X.; Yang, T. A Bus-Oriented Mobile FCNs Infrastructure and Intra-Cluster BSM Transmission Mechanism. IEEE Multi. Open Acc. J. Spe. Sec. Adv. Big. Dat. Ana. For. Veh. Soc. Net. 2019, 7, 24308–24320. [Google Scholar] [CrossRef]
- Wang, X.; Wang, Z.; Cai, S. Data delivery in vehicular named data networking. IEEE Netw. Lett. 2020, 14, 120–123. [Google Scholar] [CrossRef]
- Daniel, A.; Subburathinam, K.; Paul, A.; Rajkumar, N.; Rho, S. Big autonomous vehicular data classifications: Towards procuring intelligence in ITS. Veh. Commun. 2017, 9, 306–312. [Google Scholar] [CrossRef]
- Guerreiro, G.; Figueiras, P.; Silva, R.; Costa, R.; Jardim-Goncalves, R. An architecture for big data processing on intelligent transportation systems. An application scenario on highway traffic flows. In Proceedings of the 2016 IEEE 8th International Conference on Intelligent Systems (IS), Sofia, Bulgaria, 4–6 September 2016; pp. 65–72. [Google Scholar]
- Adoni, W.Y.H.; Nahhal, T.; Aghezzaf, B.; Elbyed, A. The mapreduce-based approach to improve vehicle controls on big traffic events. Int. Col. Log. Sup. Cha. Man 2017, 68, 1–6. [Google Scholar]
- Cheng, N.; Lyu, F.; Chen, J.; Xu, W.; Zhou, H.; Zhang, S.; Shen, X. Big Data Driven Vehicular Networks. IEEE Net. 2018, 32, 160–167. [Google Scholar] [CrossRef] [Green Version]
- Javed, M.A.; Zeadally, S.; Hamida, E.B. Data analytics for Cooperative Intelligent Transport Systems. Veh. Commun. 2019, 15, 67–72. [Google Scholar] [CrossRef]
- Tong, W.; Hussain, A.; Bo, W.X.; Maharjan, S. Artificial intelligence for vehicleto-everything: A survey. IEEE Access 2019, 7, 10823–10843. [Google Scholar] [CrossRef]
- Standard J3016: Taxonomy and Definitions for Terms Related to Driving Automation Systems for On-Road Motor Vehicles J3016_202104. SAE Int. Stan. Doc. 2021. [CrossRef]
- Raza, S.; Wang, S.; Ahmed, M.; Anwar, M.R. A Survey on Vehicular Edge Computing: Architecture, Applications, Technical Issues, and Future Directions. Wirel. Commun. Mob. Comput. 2019, 2019, 3159762. [Google Scholar] [CrossRef]
- Liu, L.; Chen, C.; Pei, Q.; Maharjan, S.; Zhang, Y. Vehicular Edge Computing and Networking: A Survey. Mob. Net. Appl. 2020. [Google Scholar] [CrossRef]
- Standard J2735: Dedicated Short Range Communications Message Set Dictionary. Version 3-2016. SAE Int. Tec. Rep. 2016. Available online: https://www.sae.org/standards/content/j2735_201603/ (accessed on 1 May 2021).
- Connected Vehicle Safety Pilot Model Deployment (SPMD). Available online: https://www.its.dot.gov/research_archives/safety/aacvte.htm (accessed on 1 May 2021).
- Abadi, D.J.; Madden, S.R.; Hachem, N. Column-stores vs. row-stores: How different are they really? In Proceedings of the SIGMOD/PODS ’08—International Conference on Management of Data, Vancouver, BC, Canada, 9–12 June 2008; pp. 967–980. [Google Scholar] [CrossRef]
Publisher’s Note: MDPI stays neutral with regard to jurisdictional claims in published maps and institutional affiliations. |
© 2021 by the authors. Licensee MDPI, Basel, Switzerland. This article is an open access article distributed under the terms and conditions of the Creative Commons Attribution (CC BY) license (https://creativecommons.org/licenses/by/4.0/).