Article

A Real-Time Monitoring Platform for Distributed Energy Resources in a Microgrid—Pilot Study in Oman

1
Department of Electrical & Computer Engineering, Sultan Qaboos University, Al Khodh 123, Oman
2
Centre for Smart Power and Energy Research, Faculty of Science, Engineering and Built Environment, Deakin University, Geelong, VIC 3216, Australia
3
Sustainable Energy Research Center, Sultan Qaboos University, Al Khodh 123, Oman
*
Author to whom correspondence should be addressed.
Electronics 2021, 10(15), 1803; https://doi.org/10.3390/electronics10151803
Submission received: 18 June 2021 / Revised: 17 July 2021 / Accepted: 24 July 2021 / Published: 28 July 2021
(This article belongs to the Section Power Electronics)

Abstract

:
This article presents the development of a platform for real-time monitoring of multi-microgrids. A small-scale platform has been developed and implemented as a prototype, which takes data from various types of devices located at a distance from each other. The monitoring platform is interoperable, as it allows several protocols to coexist. While the developed prototype is tested on small-scale distributed energy resources (DERs), it is done in a way to extend the concept for monitoring several microgrids in real scales. Monitoring strategies were developed for DERs by making a customized two-way communication channel between the microgrids and the monitoring center using a long-range bridged wireless local area network (WLAN). In addition, an informative and easy-to-use software dashboard was developed. The dashboard shows real-time information and measurements from the DERs—providing the user with a holistic view of the status of the DERs. The proposed system is scalable, modular, facilitates the interoperability of various types of inverters, and communicates data over a secure communication channel. All these features along with its relatively low cost make the developed real-time monitoring platform very useful for online monitoring of smart microgrids.

1. Introduction

Renewable Energy Systems (RES) may be installed in a power grid in two forms. The first form is a centralized, large-size system, which is usually directly connected to the high-voltage grid. The second form is a decentralized, relatively small-size system that is connected to the distribution power network. In the second form, the distribution network is facing a large number of distributed prosumers, who at each instant of time can be either generating or consuming energy with a high level of variability. This problem necessitates developing platforms for real-time management of energy flow from these prosumers.
Smart grids have been developed to make the operation and planning of power systems more efficient and facilitate the management of RESs. A smart grid incorporates sensors and controllers to monitor the power system in real time and make automatic changes when required. Additionally, a smart grid incorporates various distributed energy resources (DERs), distributed computing, and communication networks for a bidirectional flow of data to balance power supply and demand while providing optimal socio-economic benefits [1,2]. The successful implementation of a smart grid requires participation and compatibility among various disciplines and technologies. Examples of such cross-disciplinary areas are as follows [3]:
(1)
Power Electronics: This is used for converting the available power from one form to another and to integrate various types of DERs with the grid. This ensures high power quality and energy efficiency [4,5].
(2)
Power Systems: The power system must retain its ability to operate efficiently, remain stable, and isolate faults with faster service restoration. This requires conducting various studies that focus on achieving the balance between supply and demand, control systems, optimal network reconfiguration, contingency analysis, short-circuit analysis, stability analysis, and relay protection coordination [6].
(3)
Communications Networks: Bidirectional communication channels are essential to achieve advanced grid functionalities required for system operation, monitoring, pricing, and protection. It is necessary to digitally connect various power system stakeholders through communication links to achieve the required data flow [7].
(4)
Economics: One of the main objectives of deploying smart grids is to reduce the overall energy production cost while taking care of various rules and regulations for its promotion and power trading. As such, smart grids require various techno-economic analyses to be carried out [8].
One type of platform that helps integrating distributed generators (DGs) into the distribution grid is the microgrid. A microgrid is a localized group of energy sources and loads with an embedded control scheme. The core idea of a microgrid is to collect a limited number of DGs, local loads, and possibly storage components into a single unit. The microgrid also integrates a local control for each DG unit and master control for the whole unit as it is connected to the power grid at a point of common coupling (PCC). The microgrid is equipped with distributed controls using the local information of a specific region, which enables DG units to be systematically integrated to ensure a reliable operation of the system [9,10]. A further step to integrate the DERs into the power grid without compromising the reliability and stability of the power system is the notion of a virtual power plant (VPP). The VPP coordinates all DERs, or multiple microgrids, in a single agent to make them behave as a single power plant at the PCC [11].
Many types of monitoring technologies have been integrated with smart grid applications to provide real-time data for prosumers and power generation companies. One of these emerging technologies is the Internet of Things (IoT), which has become prominent in this area as it is easy to integrate and is generally cost-effective. The core of this technology is an embedded system capable of reading electrical parameters from sensors attached to the electrical system that relays these readings to a cloud server through a TCP/IP Internet connection. Cost-effective embedded systems such as ESP8266, a low-cost Wi-Fi microchip with a full TCP/IP stack and microcontroller capability, and ESP32, a system on a chip (SoC) series with Wi-Fi and dual-mode Bluetooth capabilities, are excellent solutions for Internet-based monitoring systems due to their ability to read analog voltage and current directly from compatible sensors and send the readings to cloud servers via integrated Wi-Fi modules [12]. Web servers can also be deployed and integrated into such embedded systems to provide a local monitoring solution without an external internet connection [13,14,15].
For large-scale distributed electrical generation systems, long-range wireless technology is an essential requirement. Despite all the attractive features of IoT technology, such systems are very limited in terms of coverage range as well as throughput and can only be used for sending limited amounts of data. The range of IoT devices can be extended to a few kilometers by using long-range wireless technologies such as LoRaWAN [16]. Another possibility to overcome range limitations is to deploy IoT nodes in a private network with a star topology in which a local gateway is responsible for relaying nodes’ data to a remote server using any wireless technology supporting TCP/IP connection. Nevertheless, IoT has been developed targeting low-throughput applications in which required physical parameters to be measured are varying slowly with time such as temperature, humidity, etc. In contrast, smart grid systems are generally dynamic and could have a large swing in power outputs within a few seconds, which requires drastically different systems to monitor and log such changes.
Another approach for smart grid monitoring is the use of Data Acquisition Units (DAQ). These are small electronic devices designed to collect and send data to a processing unit they are physically attached to. The processing unit is responsible for data collection, visualization, analysis, and possible data transfer to external destinations using different communication protocols [17]. Unlike IoT, DAQs are much faster because they are not designed to relay data beyond the processing unit. The utilization of DAQs in monitoring systems for smart grids has been widely exploited in the literature [18,19,20]. National Instruments has been a key player in this area with industry-grade DAQs, coupled with the LabVIEW platform, which supports a plethora of communication protocols as well as data visualization and analysis tools. Nevertheless, DAQs are not always practical to use in monitoring applications since they are required to be physically close to the processing unit they are attached to. In some instances, DAQs may require continuous calibration especially in some environments where there is a change in operating temperature, humidity, and pressure.
A more flexible solution for smart grid monitoring is the use of smart meters. This technology has been around for several years and has been incorporated mostly by utility companies for billing purposes as well as the management and optimization of energy distribution to consumers [21,22]. Electricity distribution companies are widely using smart meter technology for demand management and demand response through time-of-use tariffs [23]. Smart meters typically send the acquired data through existing wireless communication infrastructure such as 3G, 4G, 5G, WiMAX, WLAN, and LoRaWAN [24,25]. Smart meter technology is similar to IoT in terms of compactness, ease of installation, and reliance on existing wireless infrastructure. However, unlike IoT, smart meters are customized toward electrical consumption and fault detection.
At the heart of the smart grid system is the inverter, which is responsible for connecting renewable energy sources to the grid. Manufacturers of hybrid inverters have been overwhelmingly moving toward integrating various monitoring systems into their products; enabling consumers and utility companies to gather consumption and operation parameters directly from these inverters without the need for additional devices. Companies such as SMA are well known for their provision of various products, which are shipped with multiple monitoring systems including integrated web servers, web portals, and a MODBUS interface as well as proprietary protocols designed specifically for integration with compatible products [26,27]. These proprietary protocols and software are restrictive when integrated into a large-scale system containing components from different manufacturers. Interoperability is always an issue in such systems; therefore, it is always desirable to select inverters supporting common communication protocols and interfaces. Possible system expansion and large variation of technologies may require opting for complete integration of devices using different communication protocols.
With the sheer number of available technologies utilized to monitor smart grid performance, some scenarios may arise in which mixing some of these technologies is inevitable. Several systems have been proposed to integrate many technologies for monitoring the performance of smart grids [28,29,30]. Most of these systems are based on using a common communication protocol to collect data from all products into a centralized node or cloud servers. In [31], a real-time power flow monitoring system is proposed, which uses the existing SCADA of a medium voltage distribution network and adds to it new measuring devices and a capillary communication system to connect the control center to all field power quality analyzers. In [32], a real-time monitoring of a microgrid is proposed that uses distributed cloud–fog architecture. It has three layers: namely, a device layer, fog layer, and cloud layer. Basically, it communicates device layer information over the Internet. Furthermore, González et al. [
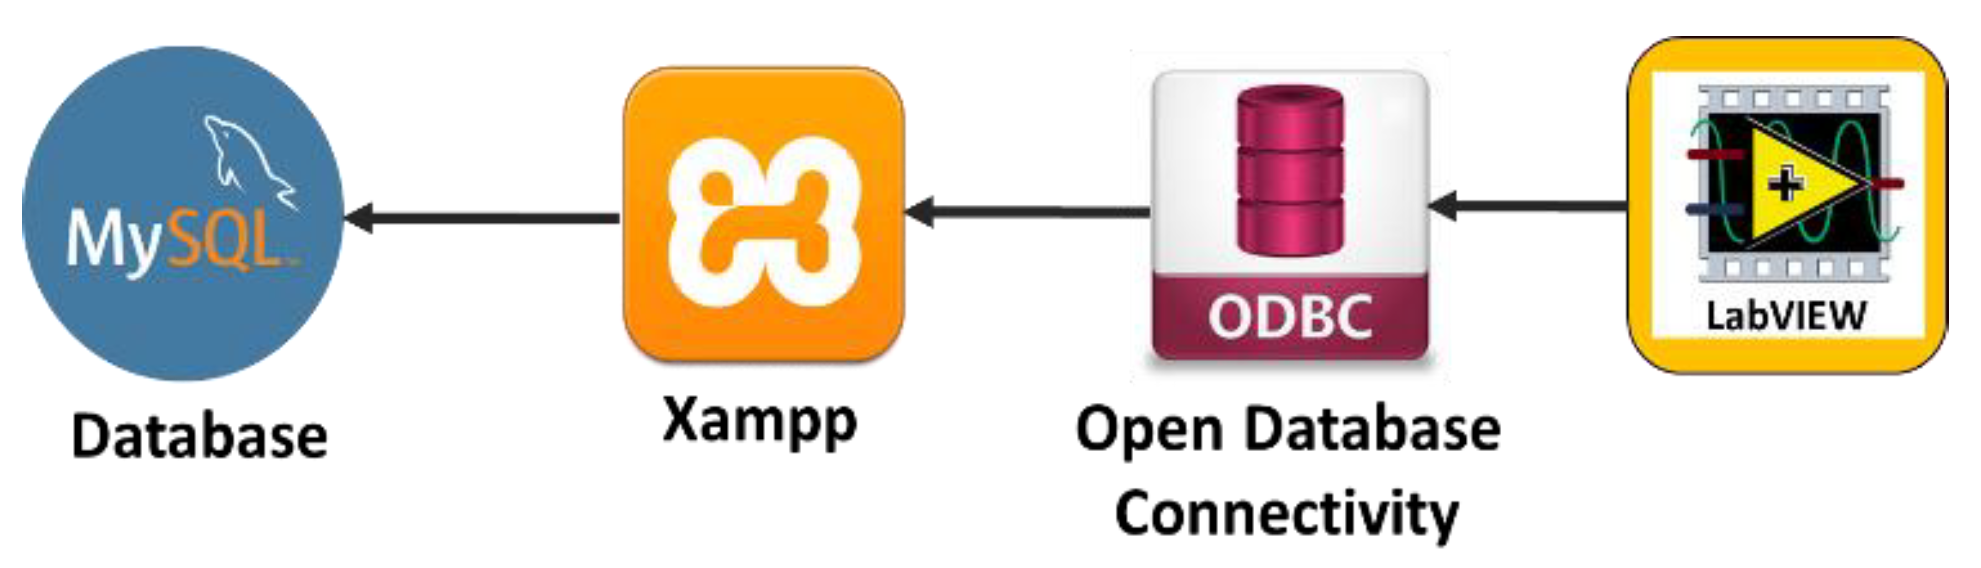
33] presents a remote monitoring platform for an experimental microgrid. There are some similarities between this research work and what is presented here in terms of using LabVIEW program and an Open Platform Communications (OPC) interface, but the architectures used are different. This article proposes a monitoring system for smart grids in which all elements of the system are connected to a central server by long-range bridged WLAN. Inverters, smart meters, and controllable loads can use different communication protocols and still be able to relay information to the central server. While the proposed system uses MODBUS over TCP connection as a backbone communication protocol, it is capable of supporting other standard protocols simultaneously. The ability to support many other protocols makes the proposed system very scalable and modular, and it facilitates the interoperability of various types of inverters.
The rest of this paper is structured as follows. Section 2 describes the DERs under study and the components that were introduced to them to have a real-time monitoring platform. This is followed by a discussion of the implementation of the platform in Section 3. The platform is driven by a stack of software, where its architecture is presented in Section 4. The results are discussed in Section 5, while concluding remarks and future extensions are highlighted in Section 6.

2. The Distributed Energy Resources

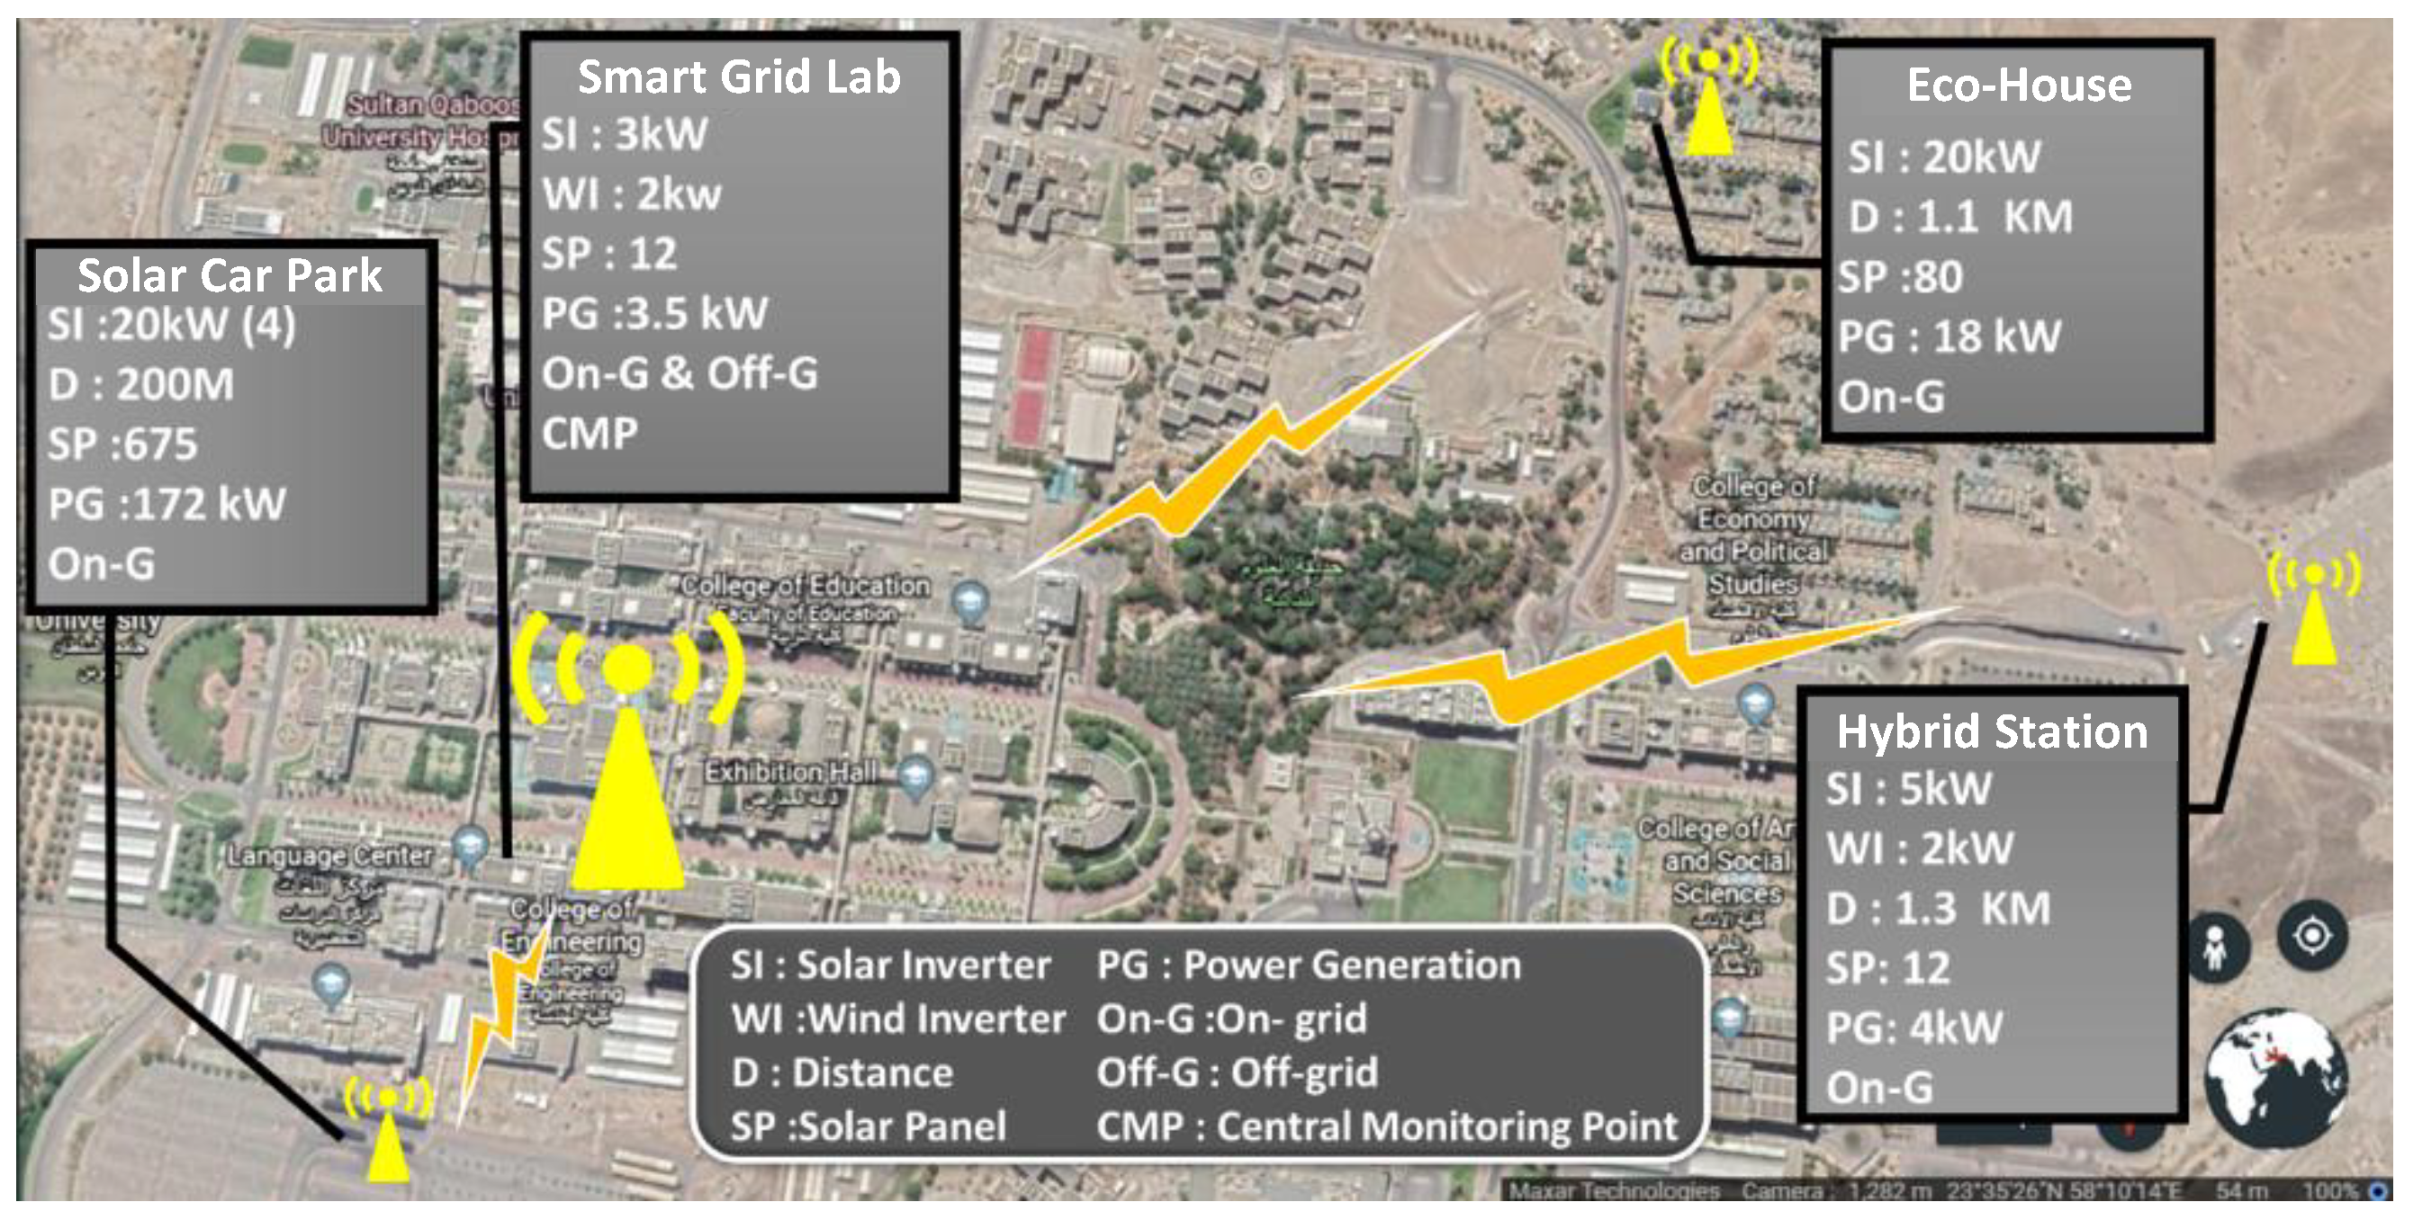
This section describes the DERs used in this study, where we develop a customized real-time platform for monitoring assets in those DERs. The platform uses a secure wireless bidirectional communication channel. However, while a small-scale DER system is used, the platform is designed in a way to make it expandable for larger systems in the field. The small-scale DERs consist of four standalone renewable energy systems located at the Sultan Qaboos University campus, Sultanate of Oman (see Figure 1). The figure shows four RESs that are located within a few kilometers from each other. These RESs are (1) Smart Grid Lab, (2) Solar Car Park, (3) Eco-House, and (4) Hybrid Station. Each RES generates a different amount of electrical energy depending on the number of installed solar panels and wind turbines. The amount of generated power from each RES is annotated in the figure.
The combined power production from all RESs is roughly close to 50 kW at the peak hour. All RESs are linked by a high-speed IEEE 802.11n wireless link facilitating data transfer to a central server for data storage, analysis, and visualization.
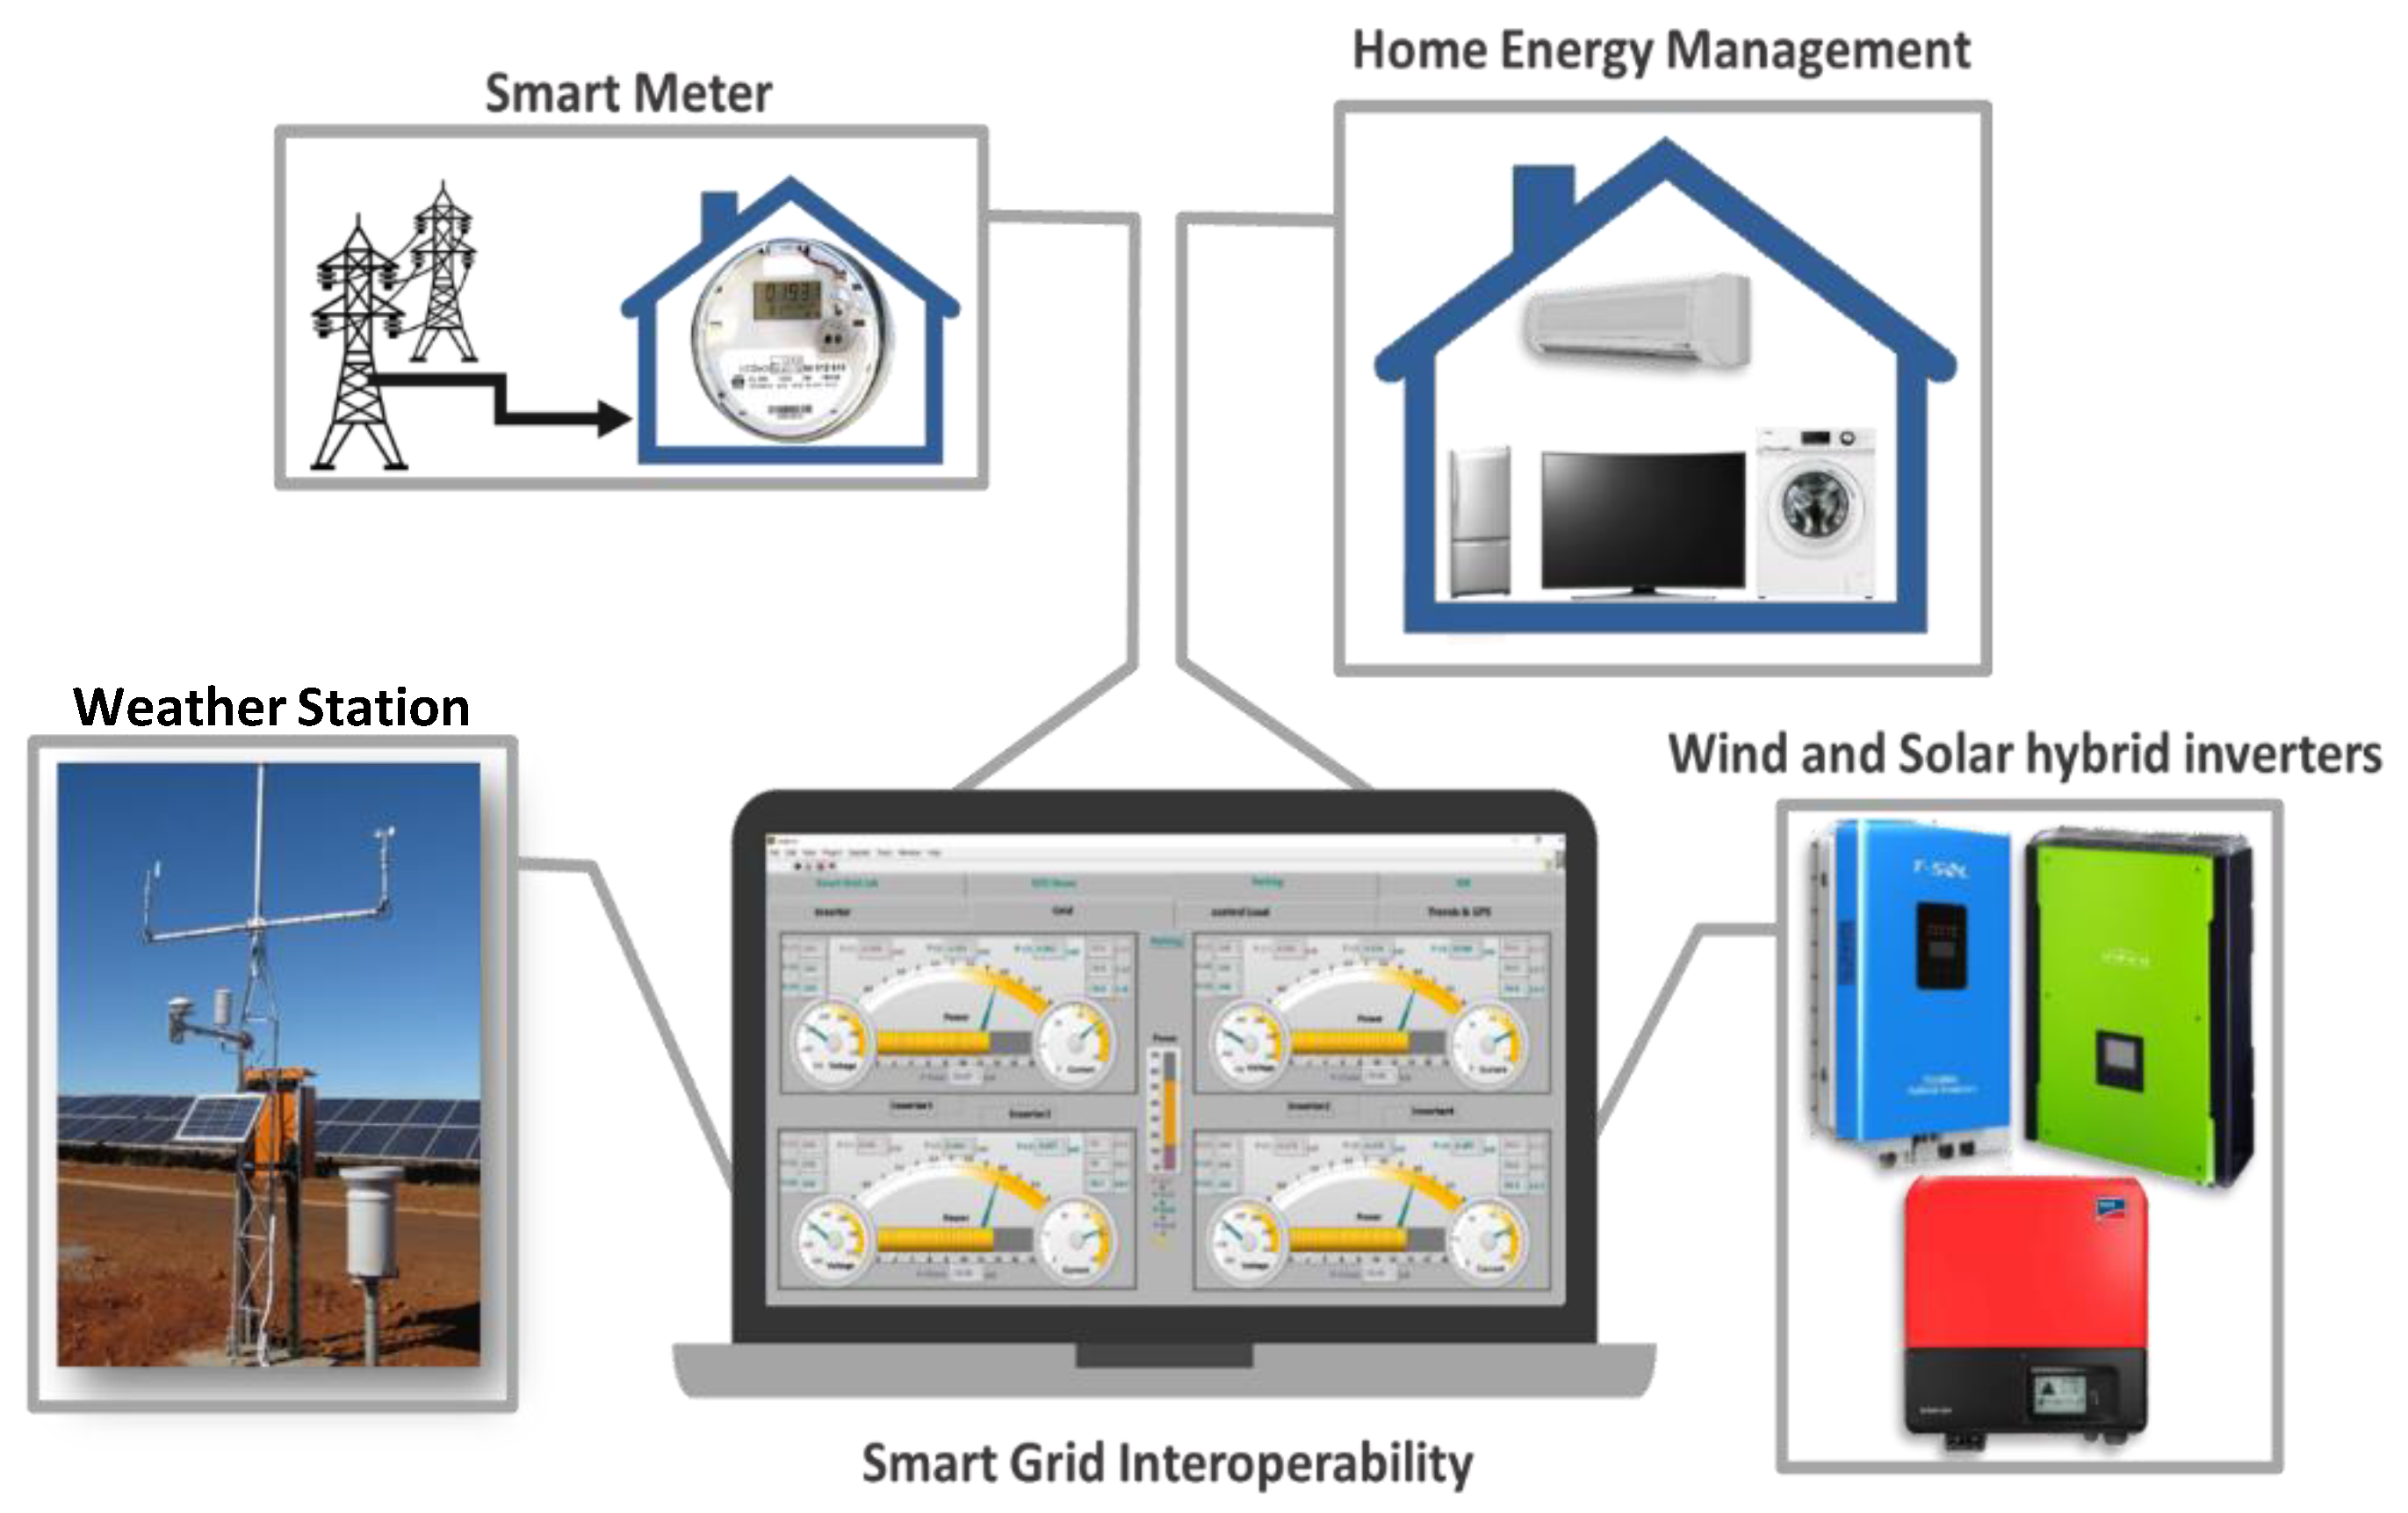
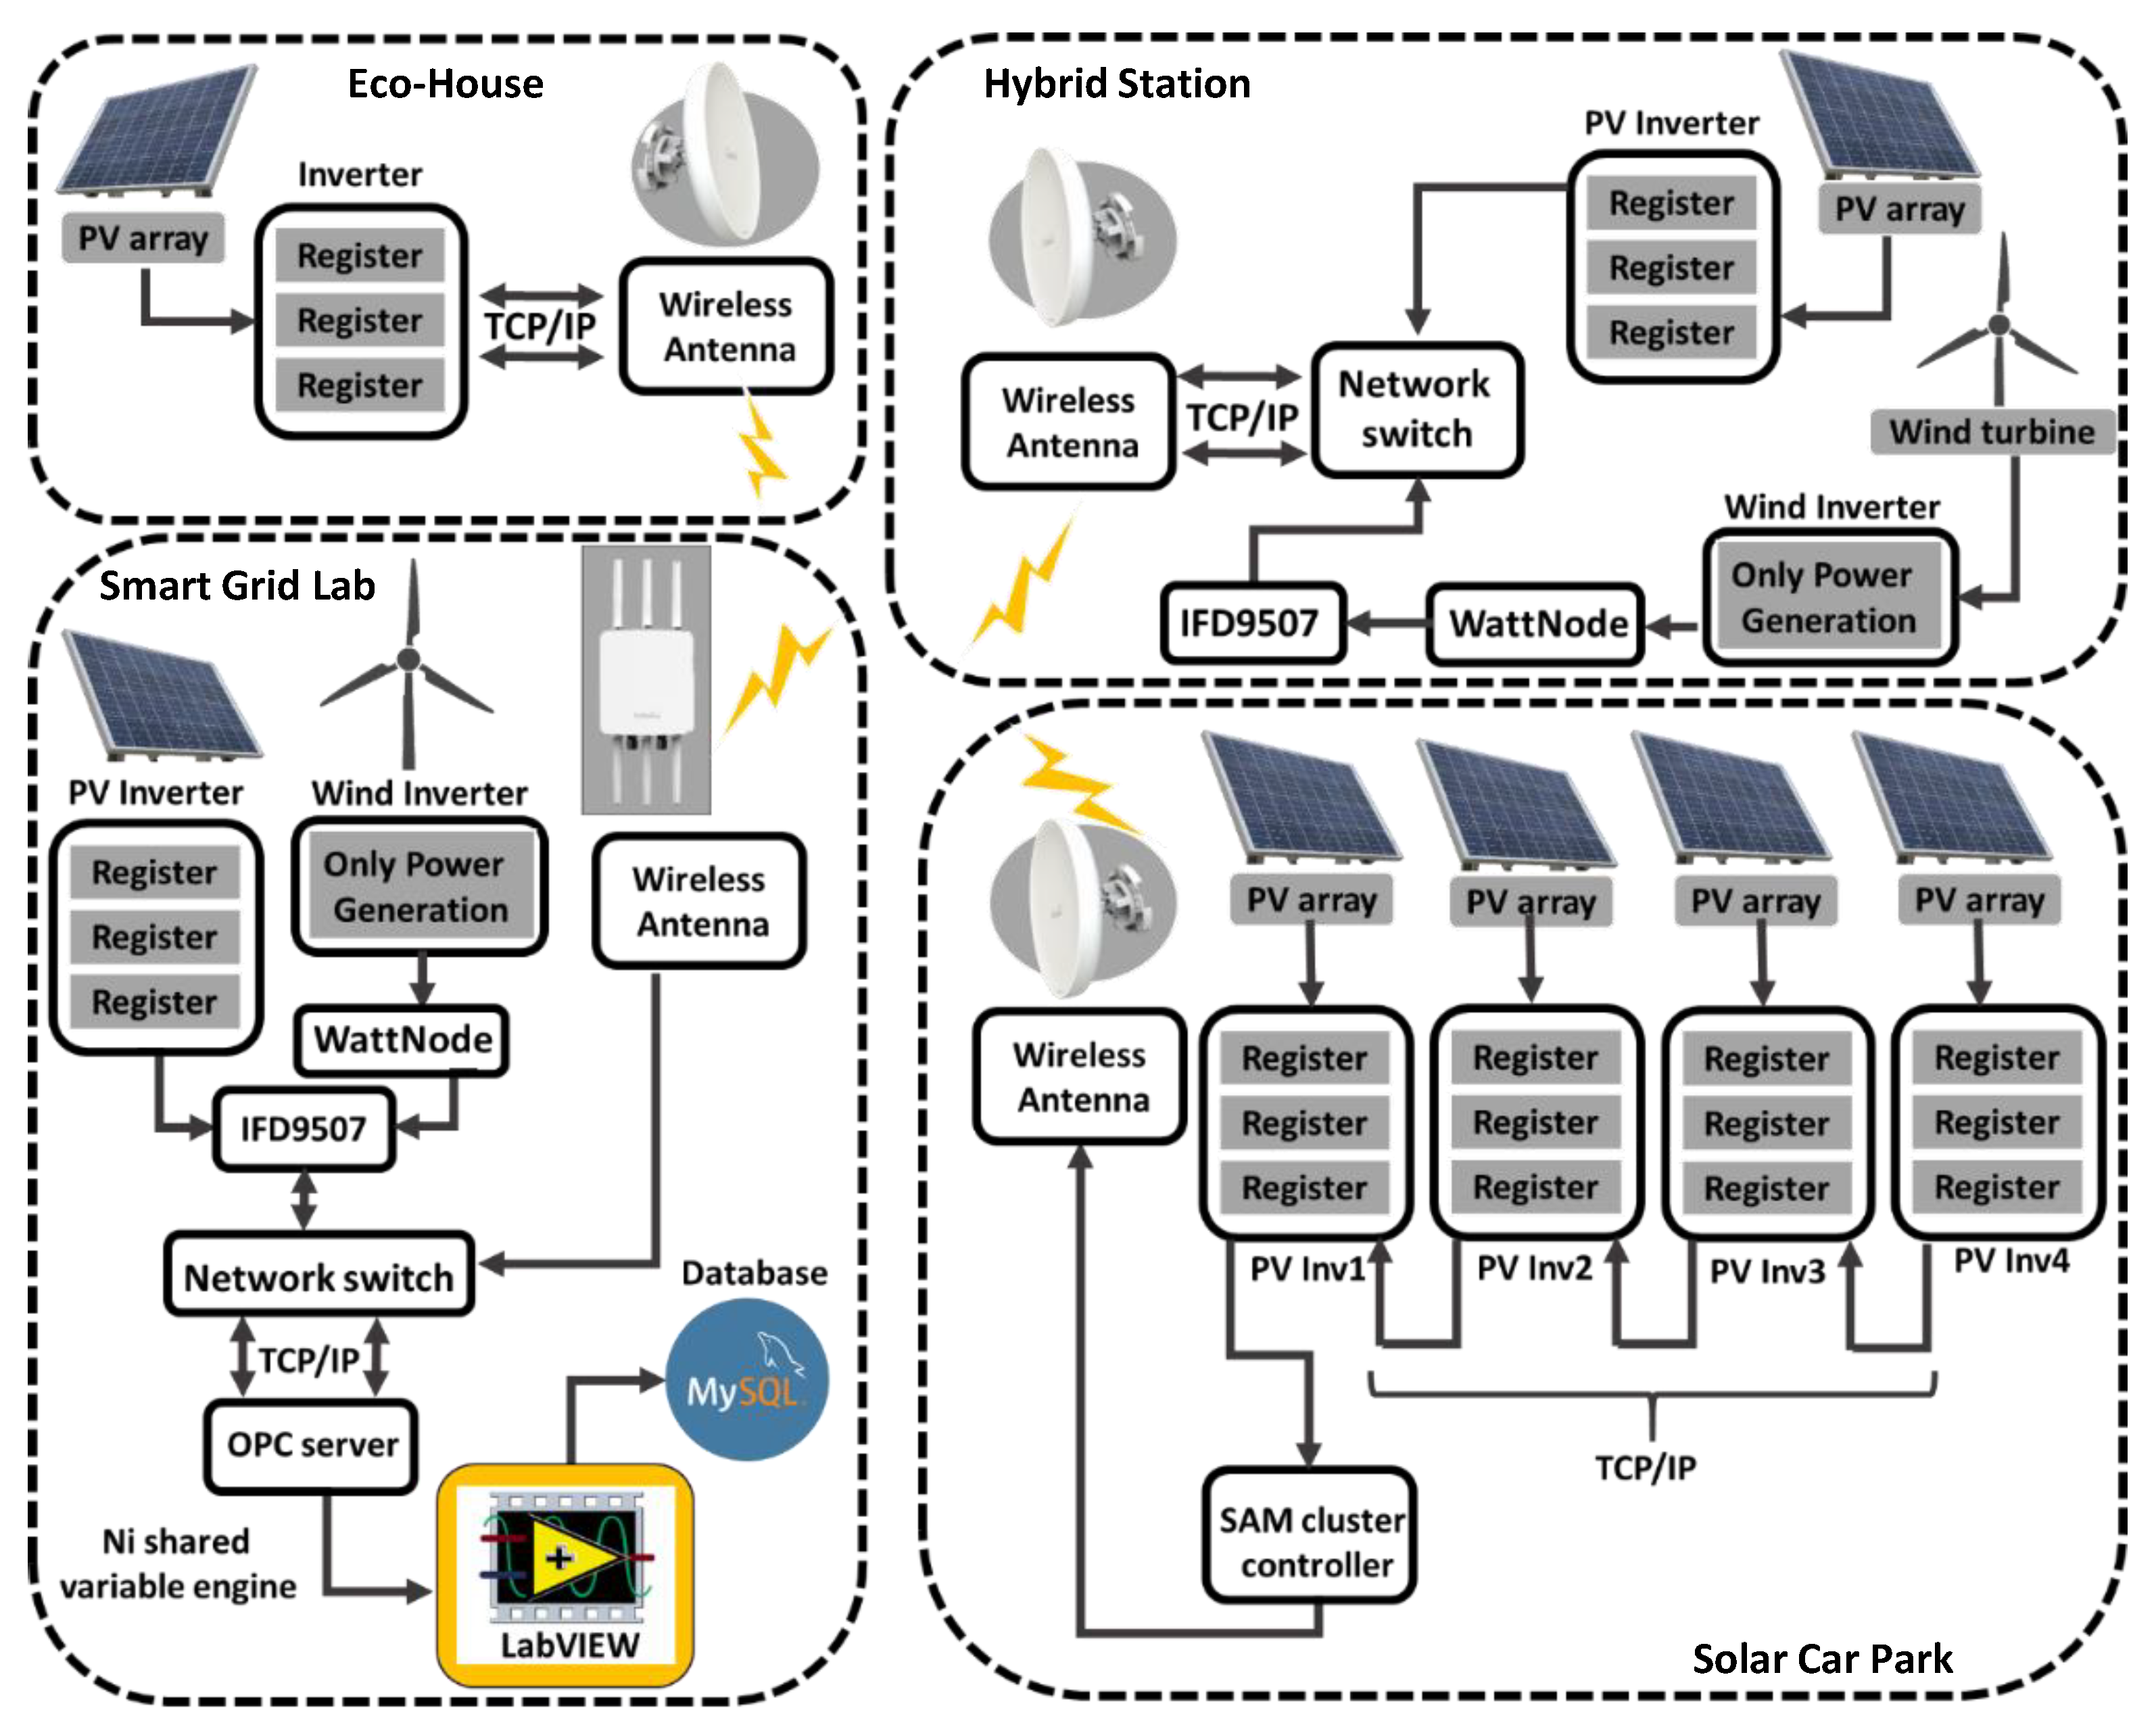
Each RES is equipped with a monitoring system, as shown in Figure 2. The figure shows a general architecture of a real-time monitoring system within a building. The aim is to make the monitoring system interoperable so that it can receive data from different devices. The energy system shown in the figure consists of solar panels, wind turbines, storage batteries, one or more inverters, smart meters, and an optional weather station. The monitoring system is used for collecting and logging data from these components. The following subsections discuss the components of the RES and the monitoring system.

2.1. Inverters

There are two different categories of inverters deployed in this system; namely, solar and wind inverters. Solar inverters are installed at the four locations, whereas wind inverters only exist at the Smart Grid Lab and the Hybrid Station. The following subsections detail the inverters used at each location.

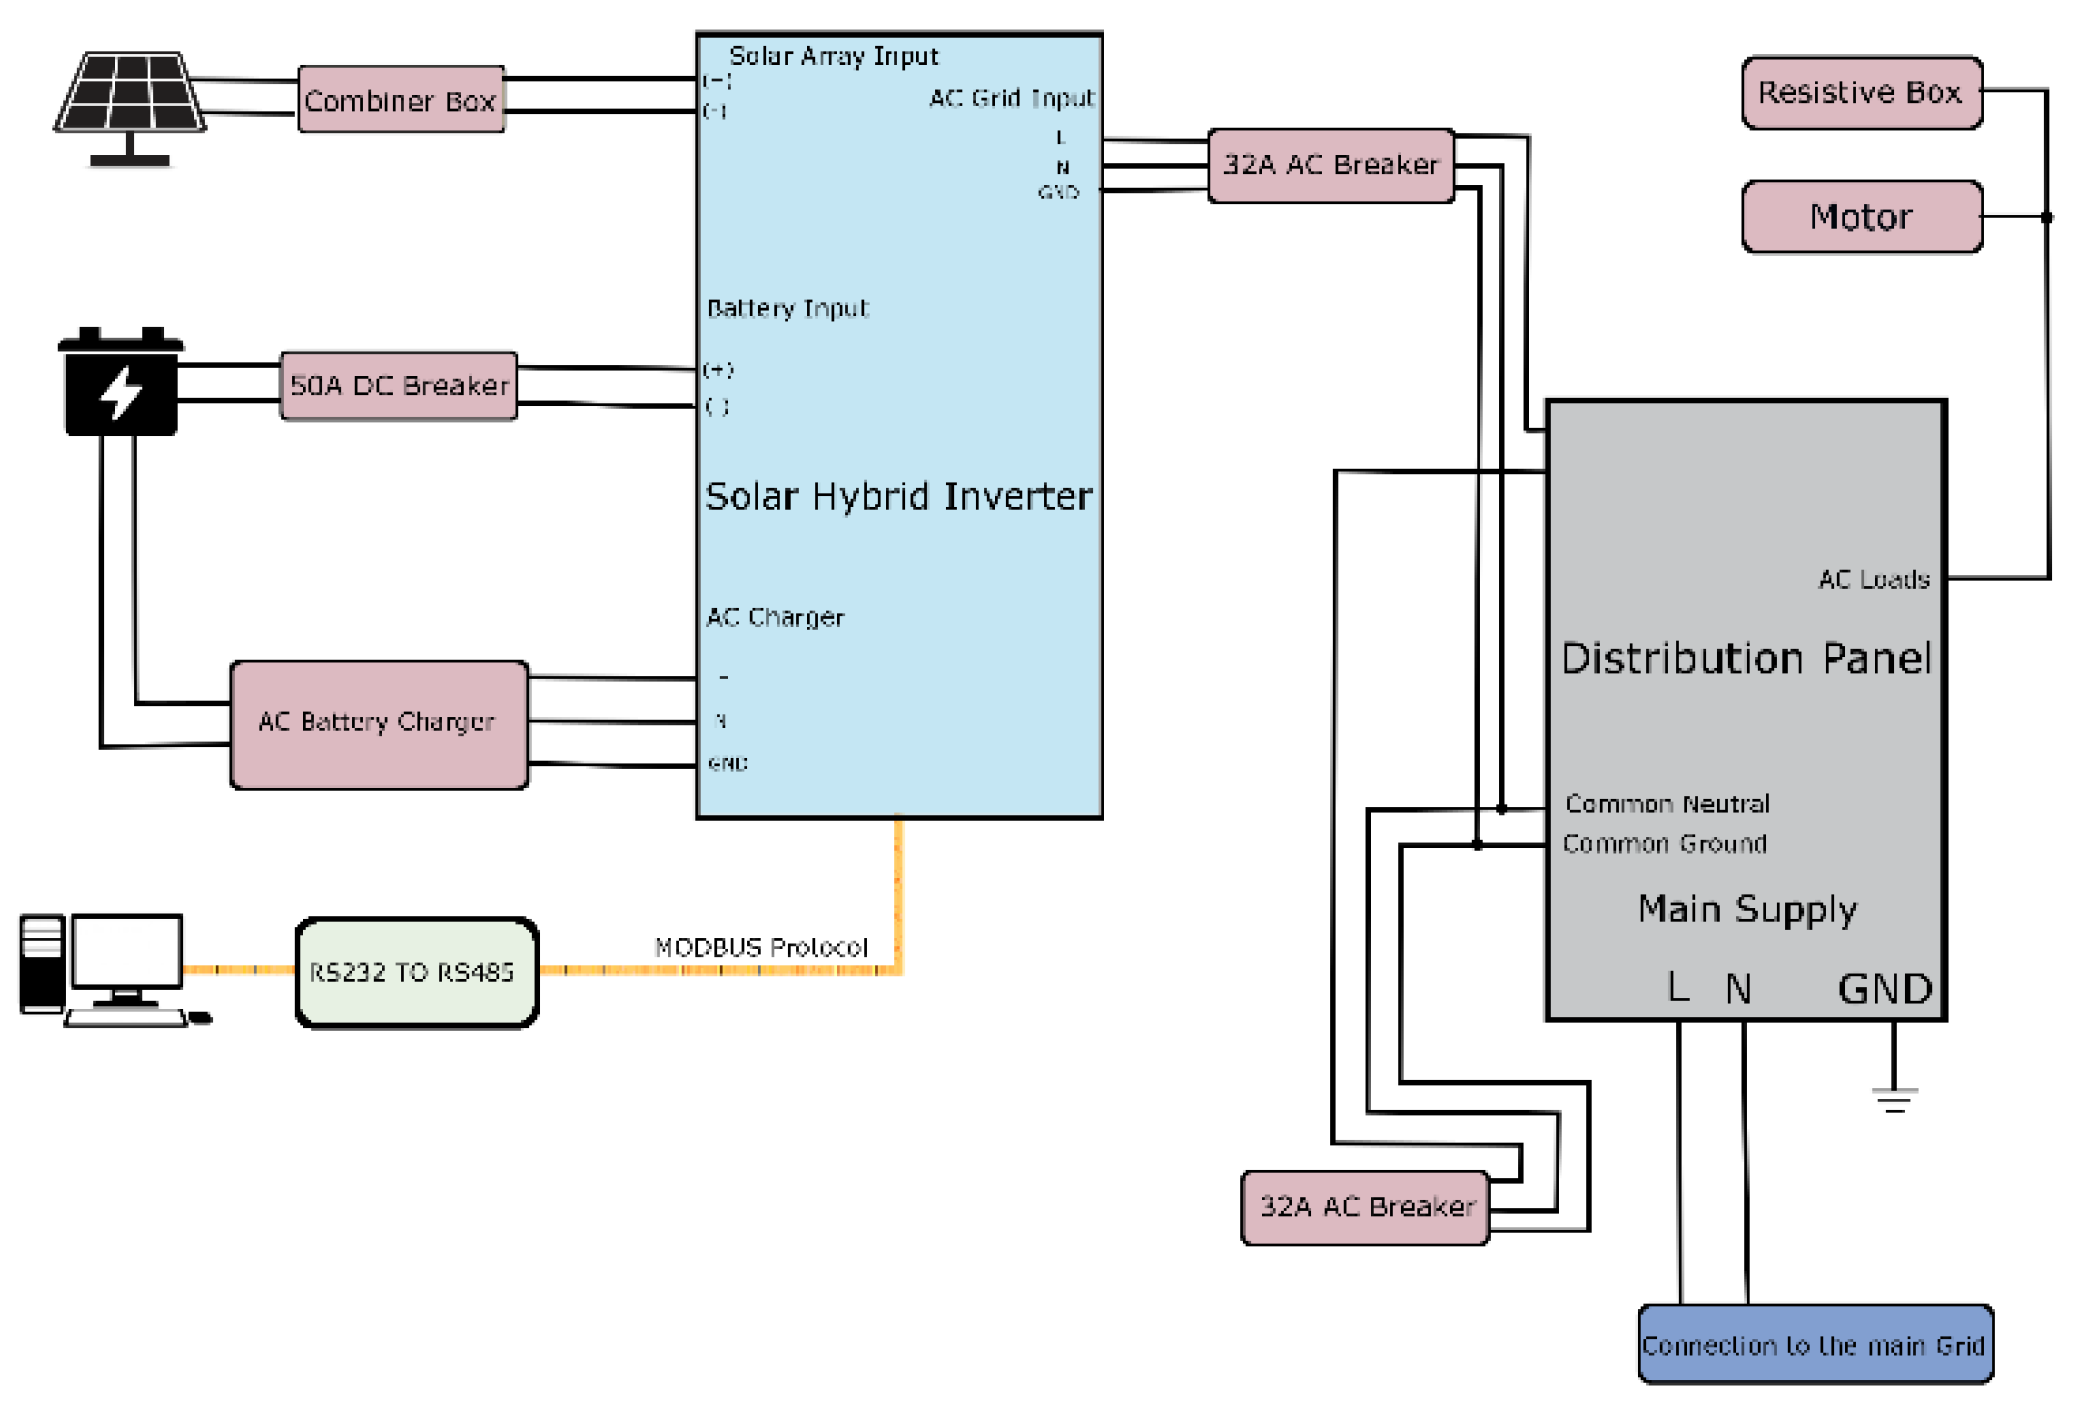
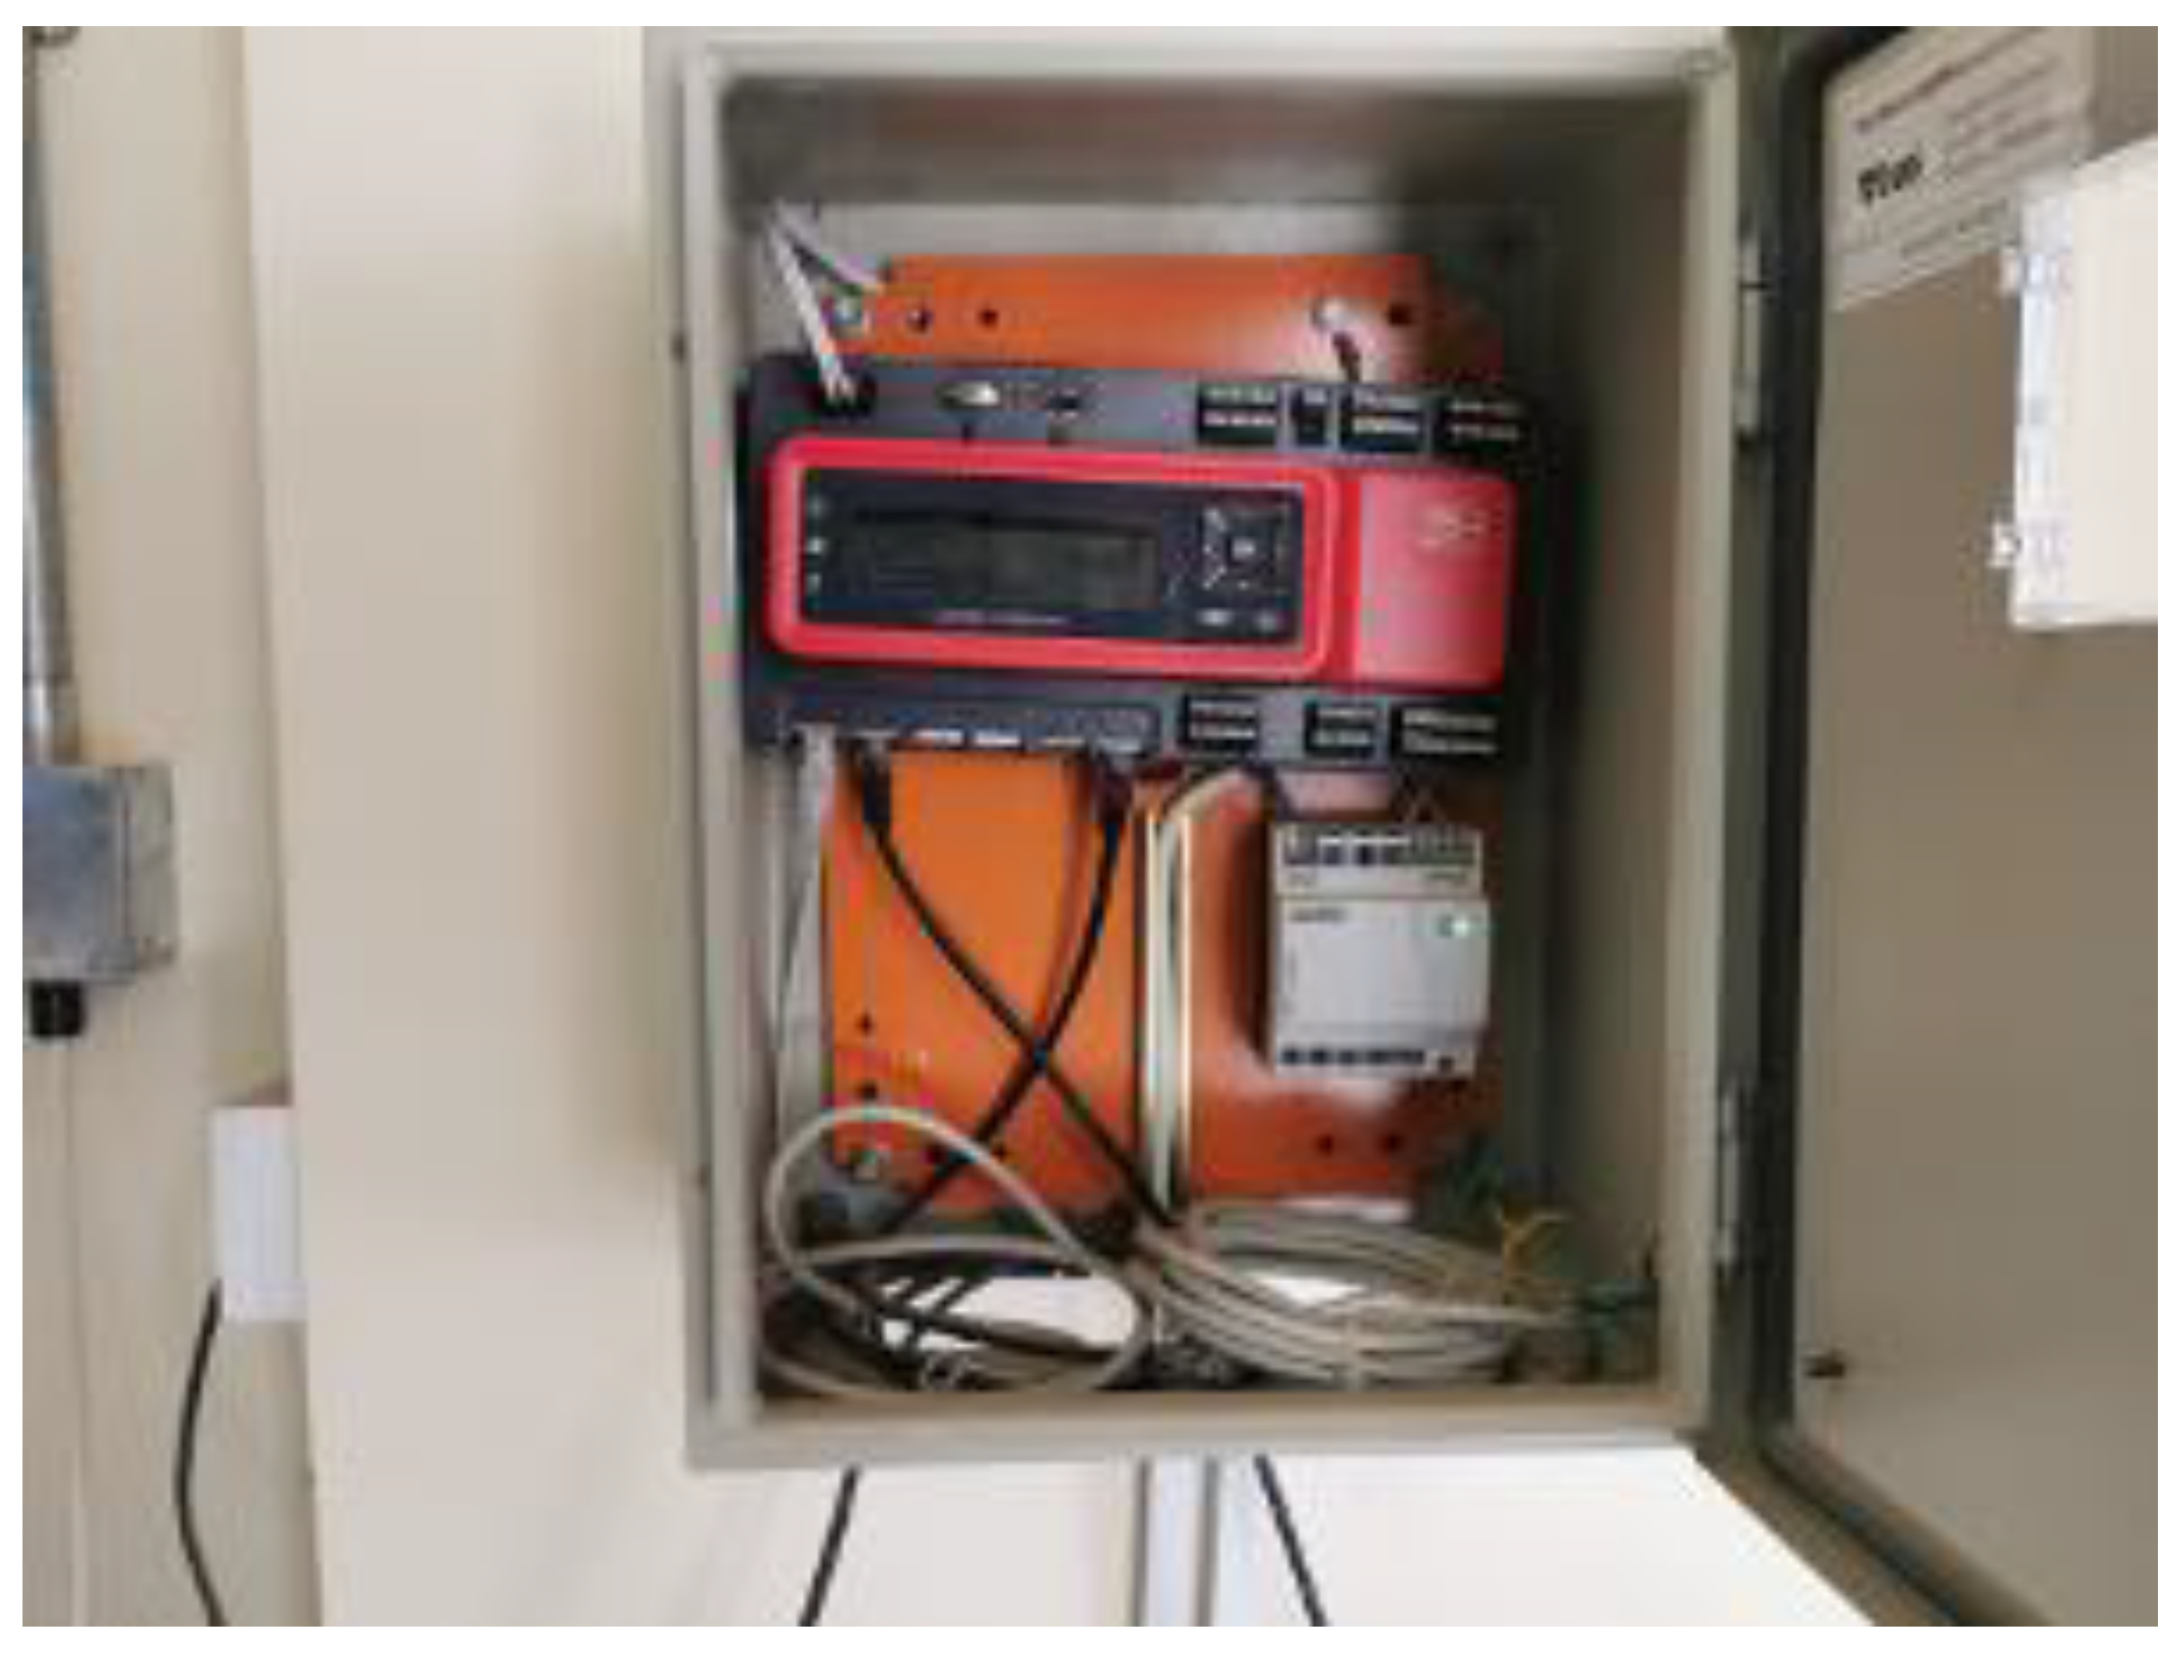
2.1.1. Smart Grid Lab Inverters

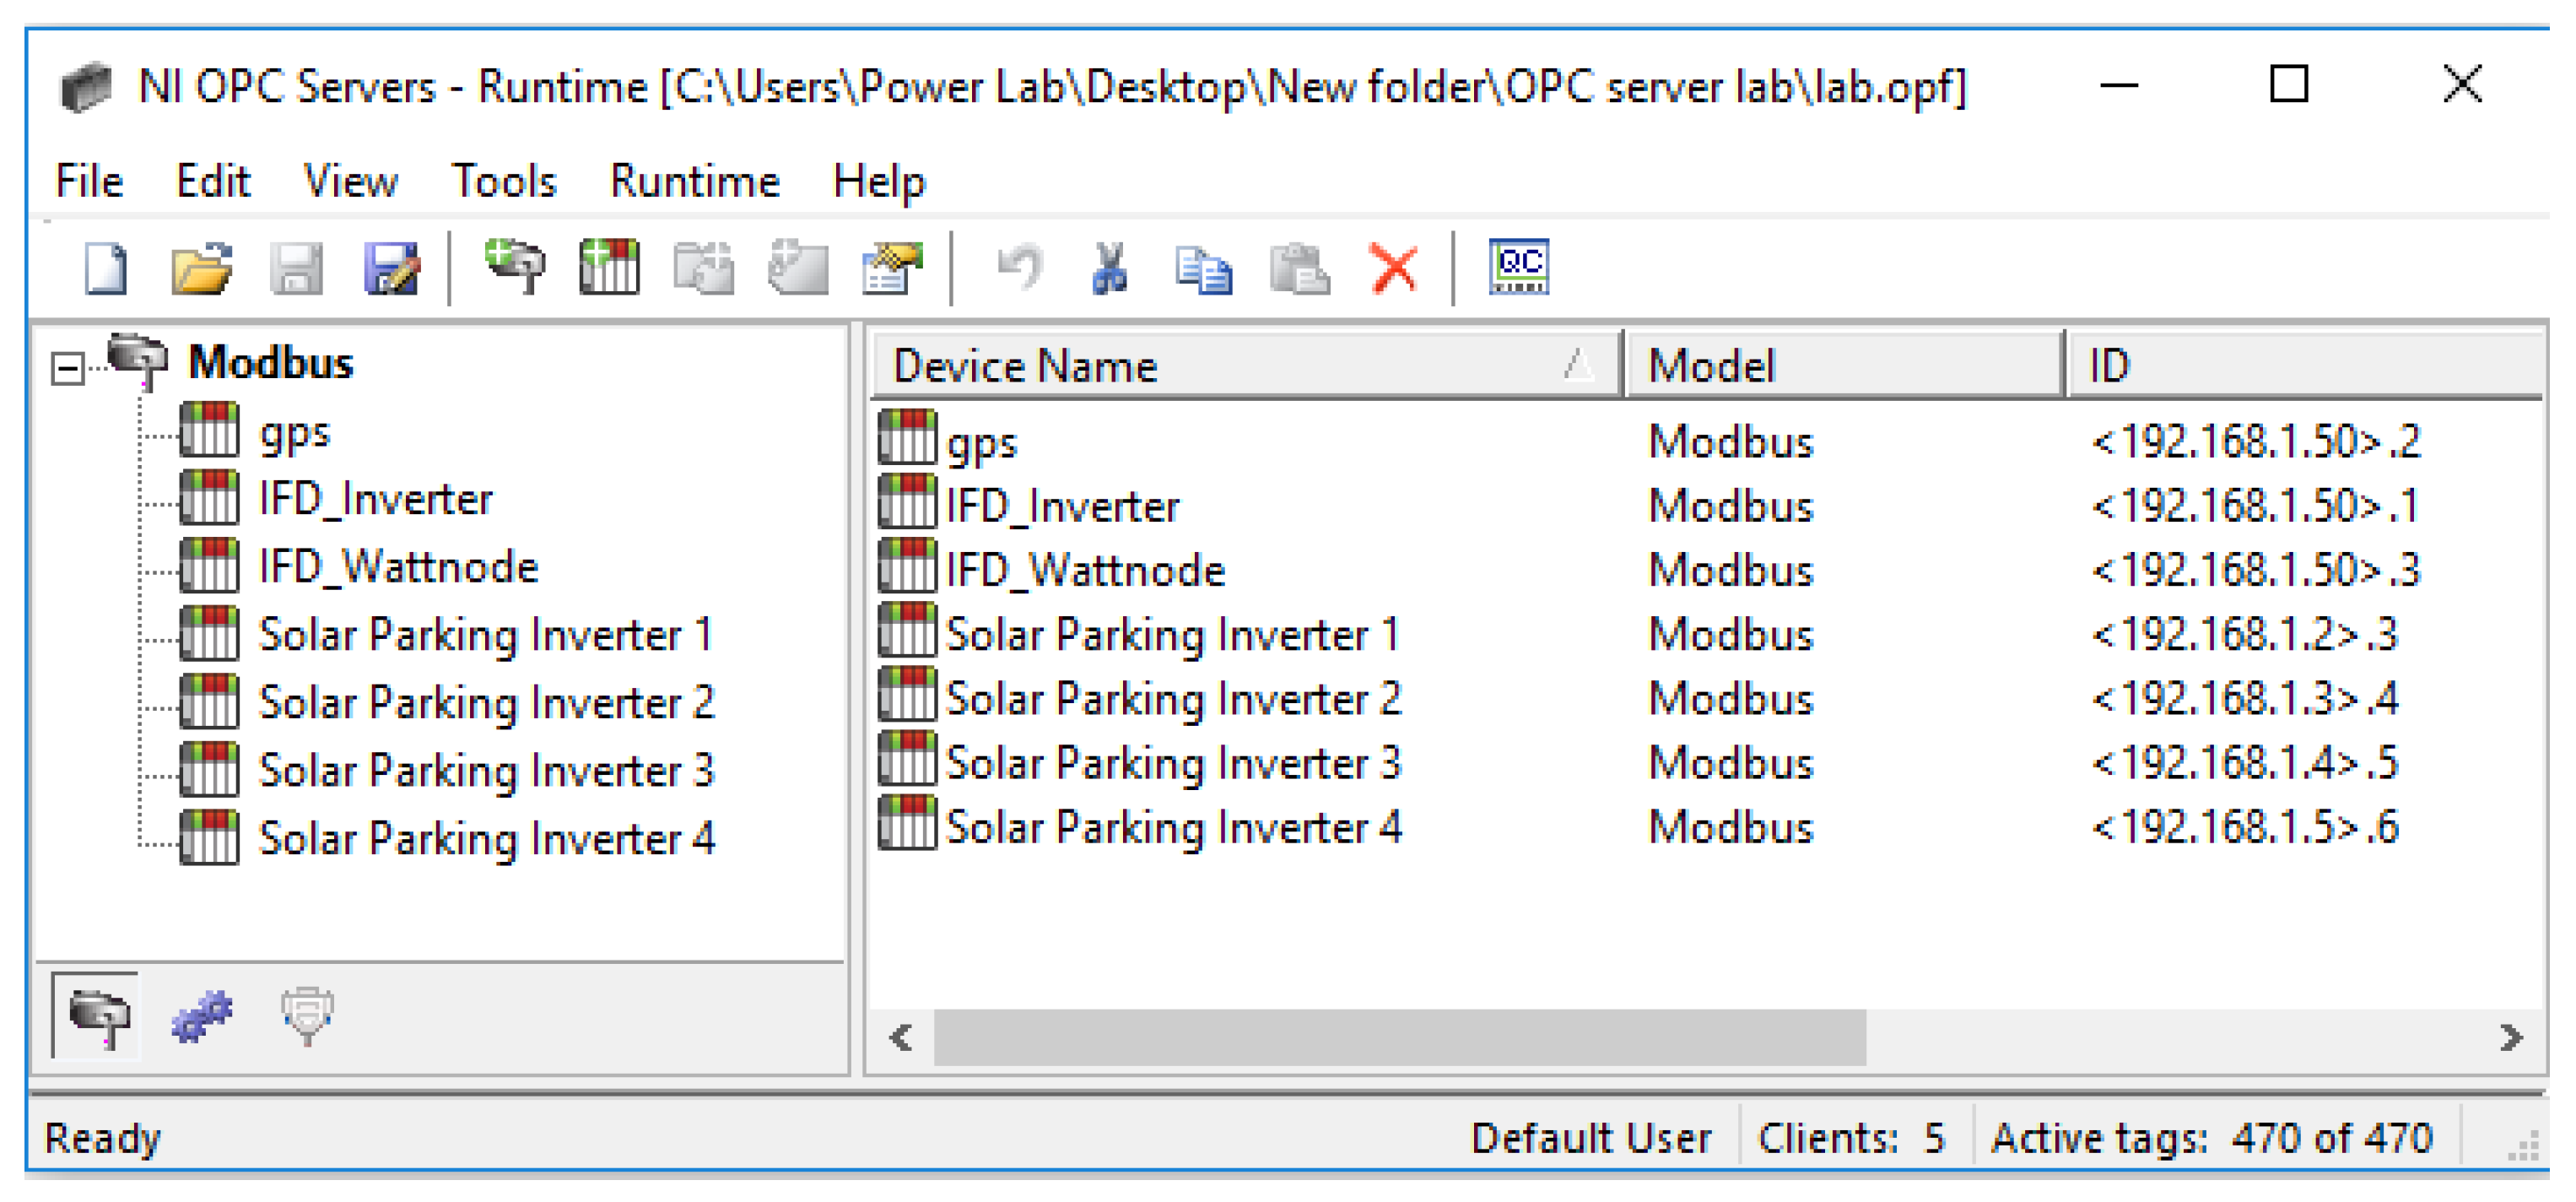
The inverter used in this station for the solar system is the T-SOL TEM3000. This hybrid inverter is capable of producing a maximum AC power of up to 3 kW. The inputs of the inverter are connected to an array of solar panels at the rooftop of the College of Engineering (East Building). On the second floor of the building, storage batteries are connected in parallel to the battery input of the inverter on the ground floor. The inverter has an AC output to charge the batteries—another output for off-grid loads—and a direct connection through a circuit breaker to the grid. The inverter uses the Modbus RS485 protocol for data extraction, which is not compliant with Modbus-TCP/IP. Therefore, a serial-to-Ethernet converter (Delta, IFD9507) was used to convert Modbus-RS485 to Modbus-TCP/IP and provide a standard interface to the system. The serial-to-Ethernet converter is connected to the central server using a standard Ethernet cable to enable the server to extract and store all necessary information from the inverter. Since the manufacturer of the inverter did not include the corresponding Modbus registers addresses for the electrical parameters, the addresses were reverse-engineered by comparing the data extracted at random address with the data displayed on the integrated screen of the inverter.
As for the wind turbine at this location, the HYGCL-15-V1.5 inverter is capable of producing a maximum of 1.6 kW to the grid. Since this inverter does not support any common communication protocol, it was necessary to use smart meters (WattNode WNC-3Y-400-MB) to measure the produced power, which is fed to the grid.

2.1.2. Solar Car Park Inverters

The Solar Car Park contains four SMA STP20000TL inverters. Each inverter is capable of outputting a maximum of 20 kW of power to the grid. All inverters are equipped with Modbus TCP/IP service exposing all electrical parameters through a standard TCP/IP connection. The four inverters are daisy-chained and connected to a complaint cluster controller. This cluster controller contains an integrated network switch, which provides an easy mechanism to connect to each inverter using a unique IP address. The cluster controller is wirelessly bridged to the server located at the Smart Grid Lab using IEEE802.11n wireless connection. This allows the server to query the stored electrical parameters from each inverter.

2.1.3. Eco House Inverters

Similar to the Solar Car Park station, the Eco-House location was equipped with the same inverter. The solar panels, which are installed at the rooftop of the Eco-House, are connected to the solar inverter. The output of the inverter is fed directly to the grid, and the electrical parameters are exposed through a standard TCP/IP connection to a central router inside the building.

2.1.4. Hybrid Station Inverters

The Hybrid Station is equipped with the InfiniSolar V inverter, where the latter can produce a maximum AC power of 5 kW. The inverter has two DC input terminals: one for solar panels and the other for batteries. The output of the inverter can feed the grid directly with the addition of an off-grid terminal enabling the inverter to power small loads in the absence of grid power. One drawback of this inverter is that it does not support Modbus protocol by default, and an extension card is required to provide Modbus access. Therefore, a smart meter was installed at the AC output of the inverter to measure the power sent to the grid.
Similar to the Smart Grid Lab, the Hybrid Station is equipped with the HYGCL-15-V1.5 inverter along with the WattNode WNC-3Y-400-MB smart meter.

2.2. Energy Storage System

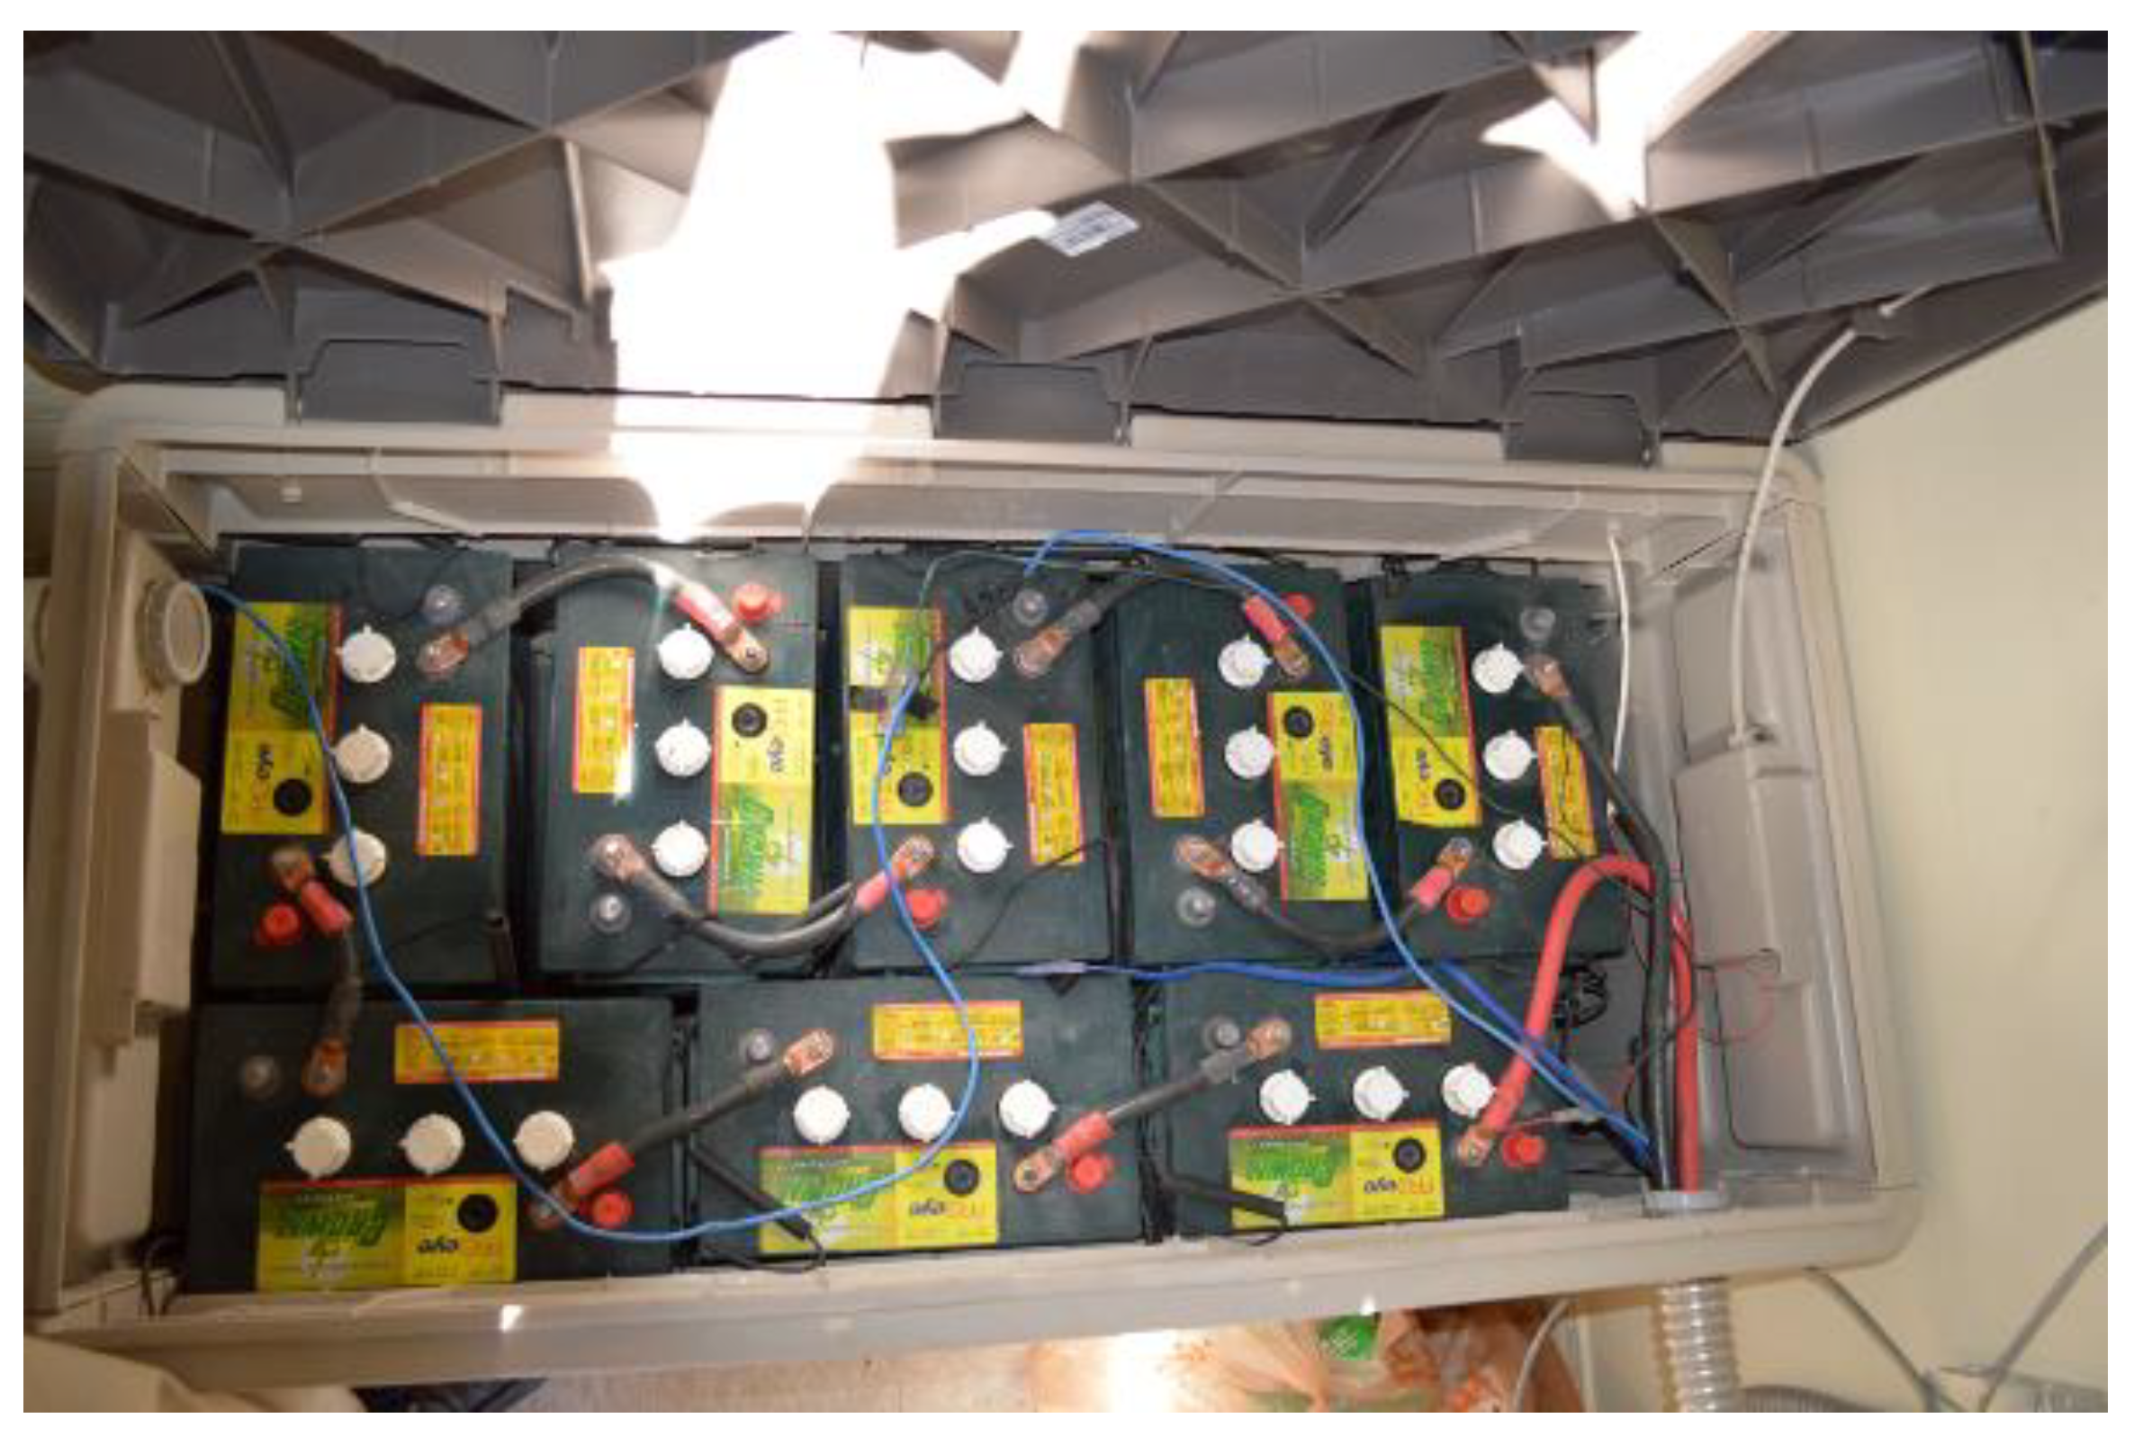
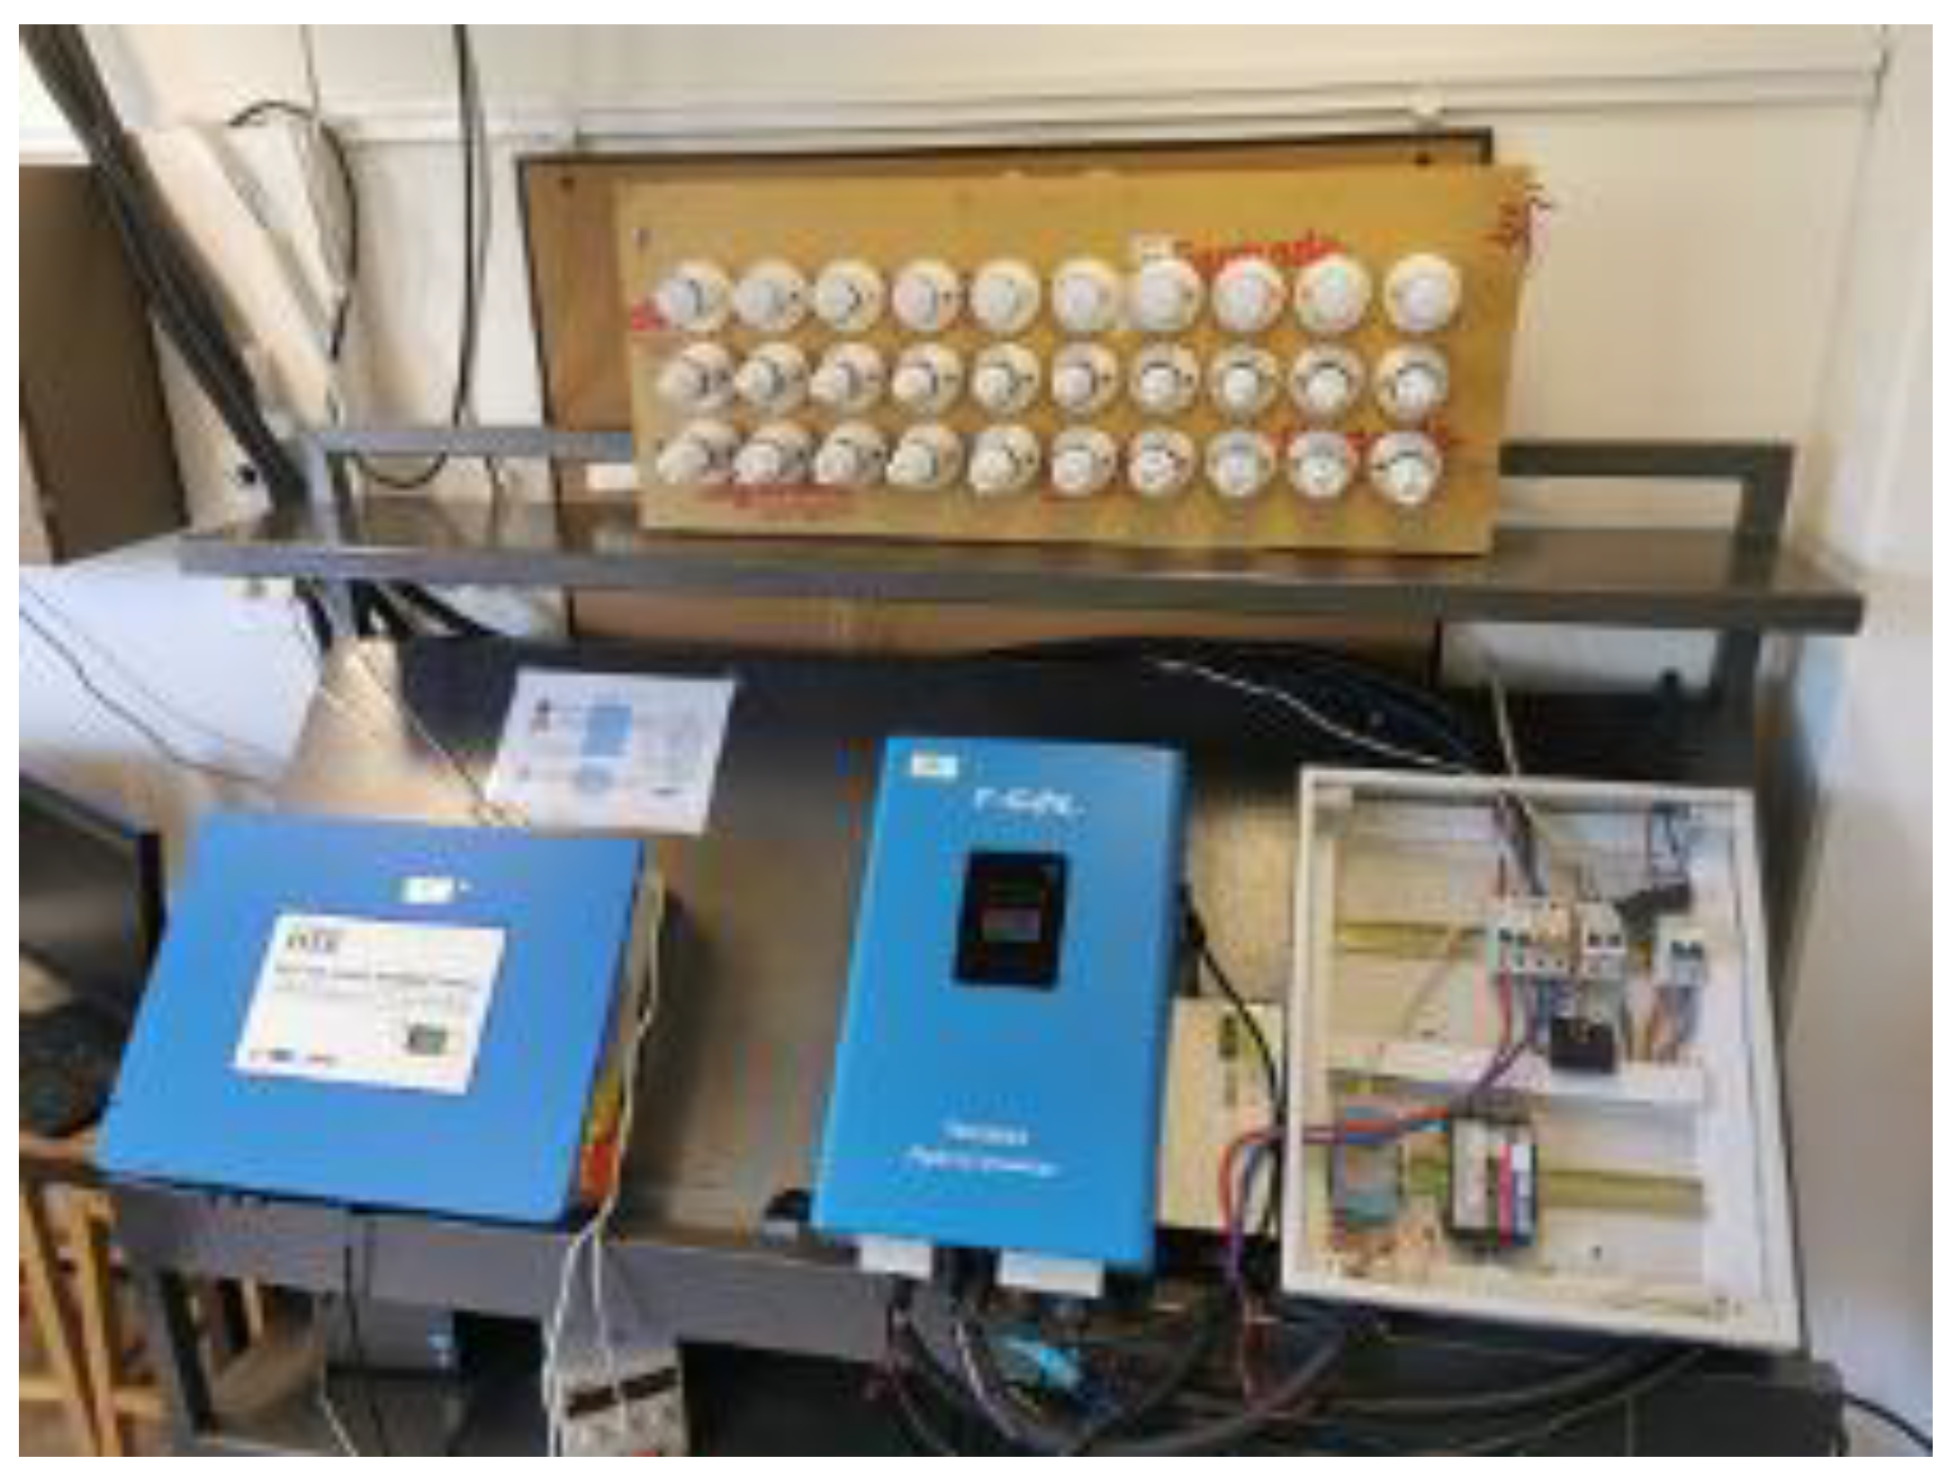
Both Smart Grid Lab and Hybrid Station DERs host battery storage systems. The battery system provides power backup for appliances in case of a power outage from the utility. It can be used for other purposes such as peak load shifting or peak load shaving in more sophisticated systems.
Figure 3 shows the battery storage system at the Smart Grid Lab. The storage system consists of 24 12-Volt batteries, each capable of storing 200 AH of electrical energy.
In contrast, Figure 4 shows the storage system used at the hybrid station, which consists of eight 12-Volt batteries.

2.3. Smart Meters

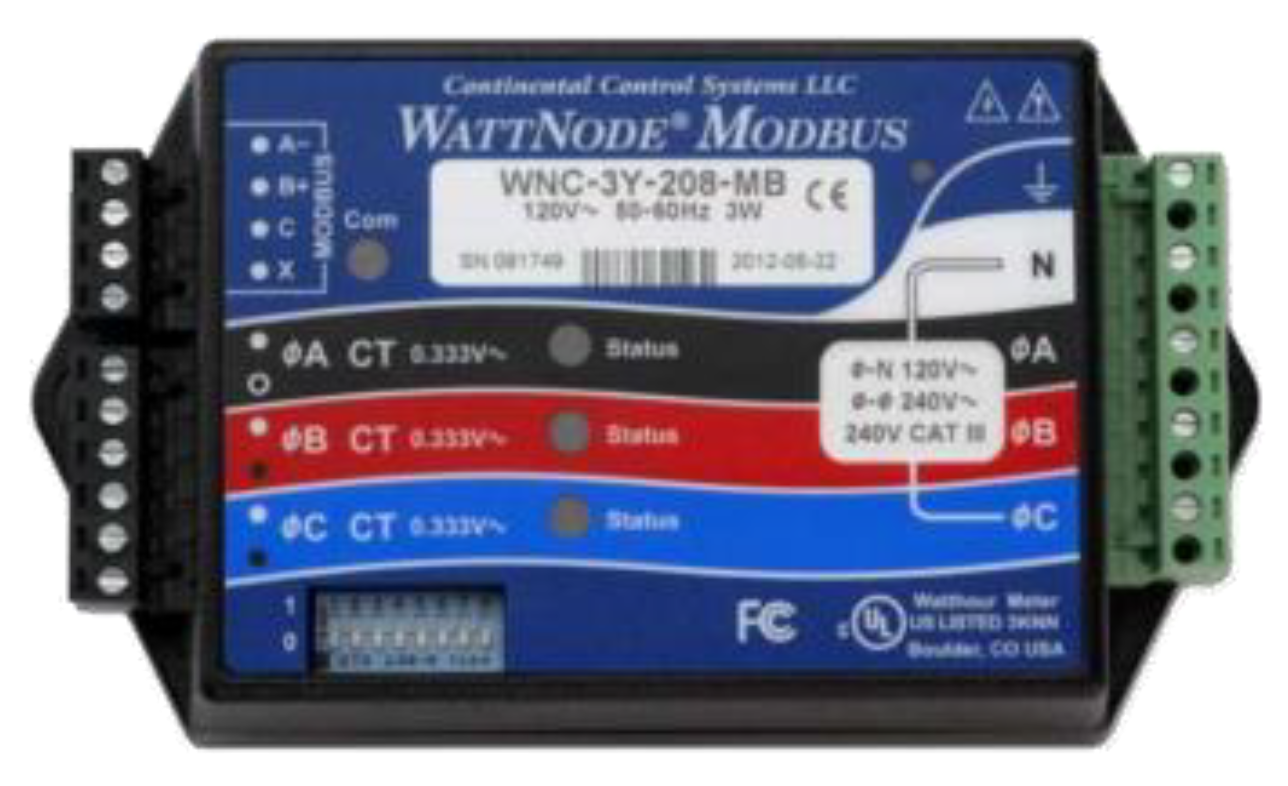
The WattNode WNC-3Y-400-MB, shown in Figure 5, is used as the smart meter for all DERs. This type of metering device was chosen for its rich features and mainly for its support of the Modbus protocol. It can measure the electrical parameters of three different phases simultaneously and provides the readings through the standard Modbus interface. However, WattNode does not support TCP/IP protocol. Therefore, a protocol converter is required to be able to integrate it into the system.
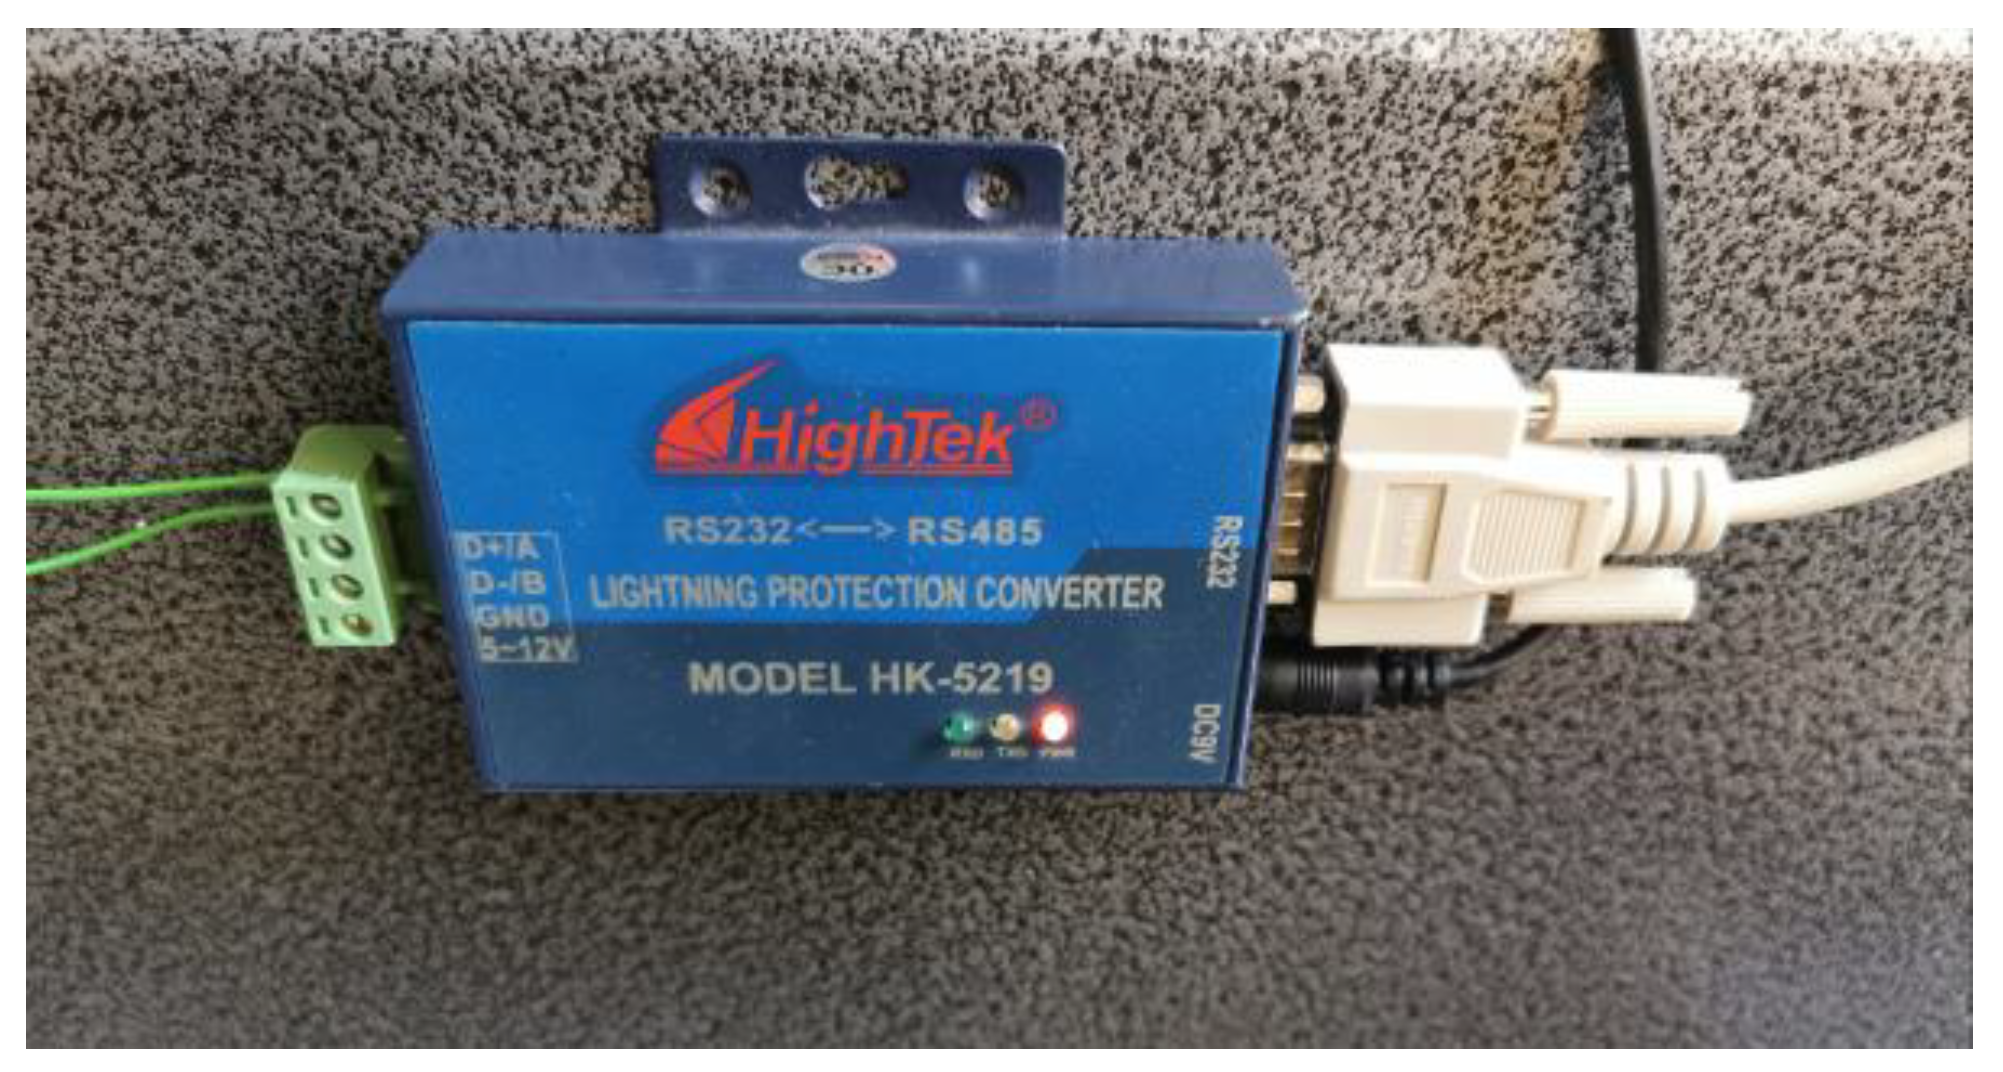
The WattNode metering device is used in two configurations in different DERs in the developed system. The first configuration is at the Smart Grid Lab, where the WattNode is connected to the serial port of the main server via RS232-to-RS485 converter as seen in Figure 6. In this case, a TCP/IP connection is not required as the server has direct access to the WattNode through the integrated serial port.
The second configuration is at the Hybrid Station in which the WattNode is connected to the server through an RS485-to-TCP/IP converter. This is required, since the Hybrid Station is remotely connected to the main server. Therefore, a wireless TCP/IP connection is required to facilitate a remote parameter acquisition.

2.4. Protocol Converters

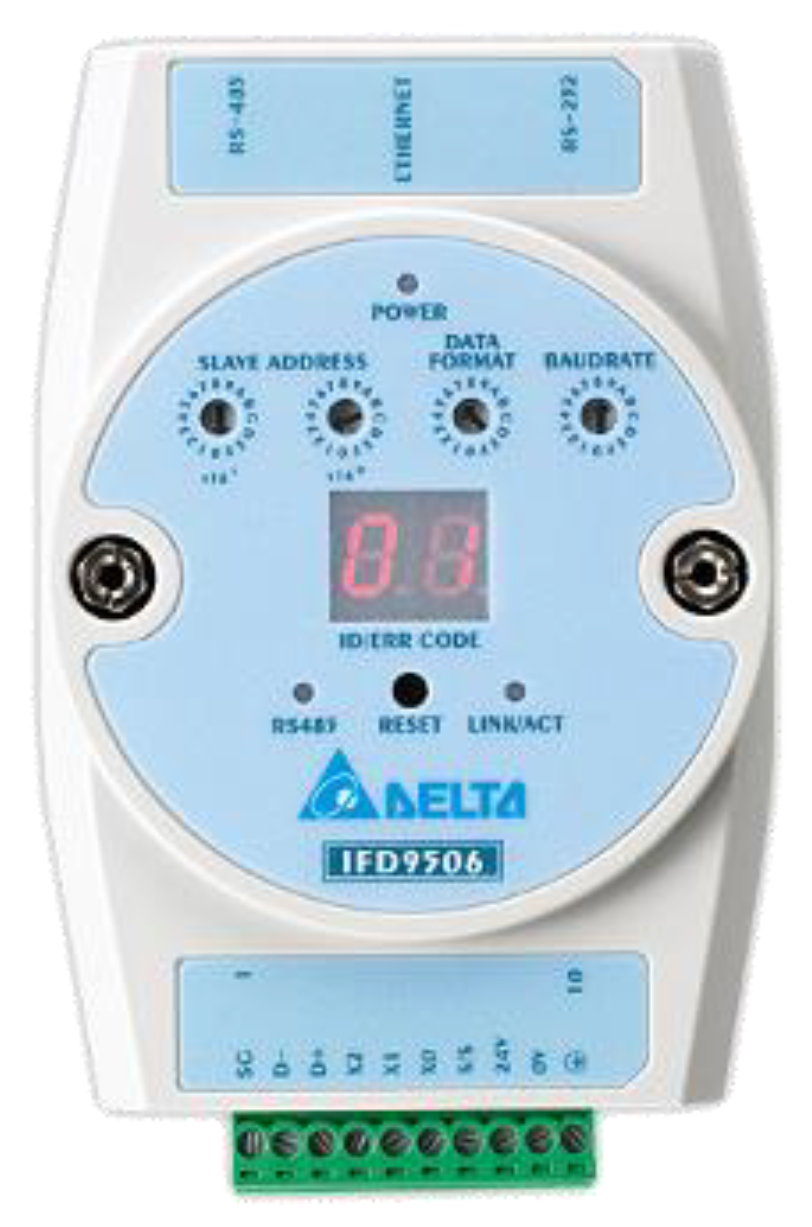
Generally speaking, meters that lack a TCP/IP interface require a protocol converter that allows those meters to access the network. Figure 7 shows the IFD9507 converter, which is capable of converting Modbus RS485 to Modbus TCP/IP; making it possible to query and extract Modbus registers through a standard TCP/IP connection.

2.5. Wireless Communication System

To establish a real-time monitoring system, the communication technology used must have a high data rate, support for long-range communication, and a relatively long operating life. This has led to choose the IEEE802.11n standard, which meets all the aforementioned requirements and has long been used in industry with high effectiveness. Although the range of communication technologies depends on the power of the antenna to a high extent, all possible ranges of this standard are suitable for the proposed platform.
The system consists of a central access point—connected to the main server—and several wireless clients connecting remote stations to the central access point. All wireless devices are mounted at the rooftops of the DERs to provide unobstructed line of sight (LOS) connectivity. These devices are configured to operate in the 5 GHz band to avoid possible interference with the existing wireless network operating at 2.4 GHz.
The EnGenius ENH 1750EXT access point was installed at the rooftop of the Smart Grid Lab. This access point can communicate with a maximum of eight other wireless clients. The antennas that are connected to this device have an omnidirectional radiation pattern and consequently low radiation gain. This permits the reception of wireless signals from all directions equally. This is an essential requirement as other locations are spatially oriented at different angles.
High-gain antennas (EnStation5 EN300) with long-range communication were installed on all other DERs (i.e., Solar Car Park, Eco-House, and Hybrid Station). Due to the high directivity of these antennas, they had to be oriented to point directly toward the access point for the maximum signal to be received. Calibration and orientation adjustments were carried out for each device to ensure a reliable connection.

3. System Implementation

Figure 8 illustrates the layout of the developed system. Each location is described in detail in the following subsections.

3.1. Smart Grid Lab

The implemented system at the Smart Grid Lab is shown in Figure 9. In addition to the power generation and grid connection, the system contains a controllable load to demonstrate the real-time control feature of the developed platform. Inverter connection to the main grid is done through a circuit breaker in addition to manual switches designed for convenient testing of grid connection. The WattNode meter and the IFD9507 converters are enclosed in a customized panel for easy access. The IFD converter is connected to a network switch attached to the main server via a CAT6 Ethernet cable.

3.2. Solar Car Park

The Solar PV system is connected to the low-voltage AC network through four SMA inverters. All electrical connections are enclosed inside a wiring trunk, which also contains Ethernet cables connecting all inverters in a daisy chain configuration. The fourth inverter is connected to the SMA cluster controller through a CAT6 Ethernet cable providing direct TCP/IP access to all inverters in this setup, as depicted in Figure 10. The SMA Cluster Controller is connected via a CAT6 Ethernet cable to the EnStation5 wireless client mounted at the rooftop of the building to provide wireless access to the system.

3.3. Eco-House

The Eco-House hosts a 20-kW rooftop solar PV system connected to the load inside the house and also connected to the neighboring low-voltage network through a single SMA STP20000TL inverter that has a direct connection to the main router via a CAT6 cable. The main router is connected to the EnStation5 wireless client mounted at the rooftop of the building via a CAT6 Ethernet cable.

3.4. Hybrid Station

The Hybrid Station includes a single 5 kW InfiniSolar V hybrid inverter connected to an array of 12 solar panels, each of which is producing a maximum power of 327 W. The inverter is also connected to energy storage batteries. A switch connects the inverter to the solar panels and batteries. This inverter does not support Modbus protocol by default, and an extension card is required for this purpose. To measure the amount of power generated at the output of the inverter, the WattNode device is connected to the grid terminal of the inverter providing a direct measurement of voltage, current, and power. The WattNode is connected to the IFD9507 converter, which is connected to an externally mounted EnStation5 via a CAT6 Ethernet cable providing wireless access to the meter. Figure 11 shows the single line diagram of the Hybrid Station, along with the actual implementation at the site.

3.5. Synchronization Mechanism

The real-time monitoring and control of a distributed multi-microgrid necessitates the use of a synchronization mechanism and timestamping of measured quantities/commands. Accurate timestamping is not only needed for the successful operation of the distributed system to achieve its goals, but it is also crucial for troubleshooting and drawing meaningful conclusions and correlating past events as well as making accurate informed predictions about renewable energy generation and load consumptions. This is more challenging in the case of a large number of microgrids, which are distributed over wide geographical areas. A larger number of microgrids causes more network delay and timing jitter, while wide geographical distribution adds more communication delay. A potential solution adopted for time synchronization is the use of a common satellite receiver clock, such as GPS [34].
The stringent synchronization requirement applies to systems in which fine events and fast actions on the milli/microsecond scale are required, such as fault location applications and protection actions. In these cases, accurate timing information should be extracted using a GPS clock. However, in this work, the main objective was monitoring the slow variation of electric variables of small-scale distributed microgrids. Therefore, this requirement is relaxed, and the developed system is operated in a near real-time mode. This means that the data timing was based on network protocol providing accuracy within a few seconds. In this work, the measurements are done periodically every 15 min in some cases and 60 min in other scenarios; then, the data are streamed to the central location in a Smart Grid Lab. The system was capable of capturing millisecond events, but due to storage requirements, time information was rounded to minutes. The installed prototype was capable of capturing voltage, current, and power changes over time from all nodes with acceptable accuracy. Therefore, the used Ethernet network clock is enough to achieve accurate monitoring goals.
The implemented prototype system was synchronized using the internal Ethernet clock. The control station sends query signals periodically to remote stations to pull measured data. The intervals used in testing the prototype measurements are 15 min and 60 min. The remote stations respond with measured quantities, and the control station deducts round-trip time before saving it to the database.

4. Software Architecture

This section discusses the software stack that was developed to drive the real-time monitoring system.

4.1. Software Components

The developed software for real-time monitoring uses Open Platform Communications (OPC), which is a series of standards and specifications for industrial telecommunication. OPC specifies the communication of real-time plant data among devices from different manufacturers. An industrial automation task force developed the original standard under the name OLE for Process Control (Object Linking and Embedding for process control). OPC has grown beyond its original OLE implementation to include other data transportation technologies.
The software consists of three components: namely, OPC server, LabVIEW core, and MySQL Database Management System. The integration of these three components (1) provides a flexible and scalable solution for connecting inverters and devices from different manufacturers, (2) reduces the complexity of the designed code, and (3) provides a mechanism to store data using a standard database management system. Figure 12 shows the interaction between an inverter and the software components, where the latter are described in detail in the following subsections.

4.1.1. NI OPC Server

The National Instrument (NI) OPC server is an industry-standard and high-performance server. It can handle real-time monitoring of data obtained through various communication protocols. In addition, several industrial applications such as electric power generation and petrochemical refining require secure communication, which is one of the main features of OPC. One of the capabilities of the NI OPC server is that it supports the Modbus protocol, which establishes an interface between the devices and the LabVIEW environment. It is possible to read all data from the registers of every single device in the network from the OPC server.
Each device that supports Modbus-TCP/IP protocol and is connected to the local network can be identified in the OPC server using a specific IP address. These devices are queried periodically by the OPC server to retrieve Modbus registers containing the desired electrical parameters. The server is initially configured with the devices’ IP addresses and Modbus registers addresses. The configuration of the NI OPC Server is highlighted in Figure 13.
For system debugging and troubleshooting, the software “OPC Quick Client” was used to display live readings from Modbus nodes, as shown in Figure 14. In addition, these readings include error flags, indicating any errors occurring during communication with remote OPC servers.

4.1.2. LabVIEW Core

LabVIEW is a software tool that supports many industrial communication protocols. It provides graphical programming software, which can be used to create graphical user interfaces (GUI) for data visualization and instrumentation control. In addition, LabVIEW has a rich library of modules including a database storage module, which can be used to connect to industry-standard database platforms such as MySQL.
To provide software connectivity between the LabVIEW environment and OPC Server, the Data logging and Supervisory Control (DSC) module was installed. This module provides access to the OPC server via an NI Shared Variable Engine (SVE). LabVIEW integration with the OPC server is illustrated in Figure 15.

4.1.3. MYSQL Database

MySQL is an open-source relational database management system, which provides an efficient way to store large amounts of data in local storage. It uses SQL programming language to query, store, delete, and modify existing data. XAMPP was installed on the main server for database configuration and management.
To provide the connectivity between MySQL and LabVIEW, an ODBC driver is installed in the server and configured with the necessary parameters to connect with the database. The integration between LabVIEW and MySQL is illustrated in Figure 16.

4.2. Data Visualization

It is essential to design an informative and easy-to-use graphical interface. Designing such an interface was a challenging task, given the large number of parameters to be visualized. Two approaches were implemented to achieve this objective. The first approach is designing the GUI on LabVIEW itself, which has many built-in visualization gauges and graphs. However, the limitation of this approach is that such a GUI can only be accessed at the local machine unless a remote front panel server is deployed or a custom web page is designed and integrated with the LabVIEW webserver. The second approach is designing the GUI using the open-source Grafana platform, which connects to databases and displays the parameters in various forms. This approach overcomes the limitation of LabVIEW, where clients can visualize the results as a dashboard that can be accessed from any web browser. The following subsections discuss the implementation of each approach.

4.2.1. LabVIEW Visualization

A GUI is developed using the LabVIEW software for the visualization of system parameters in real time. For example, one can visualize quantities in the DC-side of the inverters such as solar panel DC voltages, currents, and power. Figure 17 shows the visualization of DC-side quantities of an inverter.
Similarly, one can also visualize the inverter’s quantities in the AC-side, as illustrated in Figure 18.
Historical values of all quantities are stored in a database. They can be plotted over a desired period of time, as shown in Figure 19.

4.2.2. Grafana Visualization

Grafana is an open-source platform that can be connected with many types of database management systems. Grafana can produce a visual representation of stored data as gauges, charts, and tables. Once Grafana is deployed, the visualization can be accessed from any web browser. The administrator of the server can set authentication to the service to ensure that only authorized personnel have access to the data. The user has the option to select a time range to monitor recorded values. Grafana allows creating multiple dashboards, where each dashboard can be customized depending on the type and number of acquired parameters. Figure 20 shows an example of a dashboard for the Solar PV on the roof of the Solar Car Park.

5. Discussion of Results

The performance of the whole system in terms of power generation was evaluated during the first three quarters of the calendar year 2020. Table 1 illustrates the recorded data from the monitoring platform for some specific quantities during the first quarter of the year 2020. During this period, the Solar Car Park generated a daily combined average of 12.4 kW from all four inverters. The generated electrical energy from the station in the first quarter was 26.8 MWh, accounting for more than 75% of the energy generated from all stations. The Eco-House produced a daily average of 3.7 kW of power and 8 MWh of energy in the first quarter of 2020, accounting for 23% of the energy generated from all stations in that period. The least amount of power and energy was generated by the Smart Grid Lab with a daily average power of 203 W and generated energy of 0.44 MWh. The amount of generated energy was roughly 2% of all stations. The reason for the low generation capacity is that the lab is only used for research purposes and not for consumption by actual loads. The Hybrid Station was not commissioned until the end of August 2020. Therefore, it is not accounted for any power and energy generated within this period.
The data for the second and third quarters of the year 2020 are also recorded. Quarter 2 witnessed an increase in power production due to the increase in solar radiation in this period of the year. The amount of increase is around 25% of the values generated in the first quarter.
The daily average power generated at the Solar Car Park is 15.6 kW, reaching a peak of 51.3 kW during the afternoon hours. The generated energy in the second quarter of the year 2020 was about 33.7 MWh, accounting for 98.5% of the total energy production for all stations. This large percentage is attributed to the Eco-House station being out of service, and the Hybrid Station is not yet operational at that time.
The Smart Grid Lab station produced a daily average power of 251 W and a generated energy of 0.54 MWh accounting for only 1.5% of power production from all stations.
The third quarter of the year 2020 includes data from the Hybrid Station, as it was commissioned at the end of August 2020. In Quarter 3, a slight decrease in power production is observed compared with the second quarter of the year 2020. This decrease is attributed to reduced solar radiation due to the seasonal motion of western winds carrying a large amount of dust in the atmosphere; thereby reducing the generated power. Average power generation from the Smart Grid station has decreased by 7%, while power generated at the Solar Car Park station decreased by 8%.
The Solar Car Park has a daily average power generation of about 14.4 kW with an aggregate generated energy of 31.1 MWh in the third quarter. This accounts for 95% of all energy generated by all stations.
The Smart Grid Lab accounted for 1.5% energy generation in the third quarter with 0.5 MWh and a daily average power of 232 W.
The Hybrid Station generated a daily average of 265 W with a peak of 1.7 kW during the afternoon and an aggregated energy of 1.2 MWh in the third quarter. This accounted for 3.5% of all stations’ energy generation.
It is worth mentioning here that the measured data were set to a common time frame to compare DER’s contribution to the grid. Synchronized measured data were recorded during September 2020. 
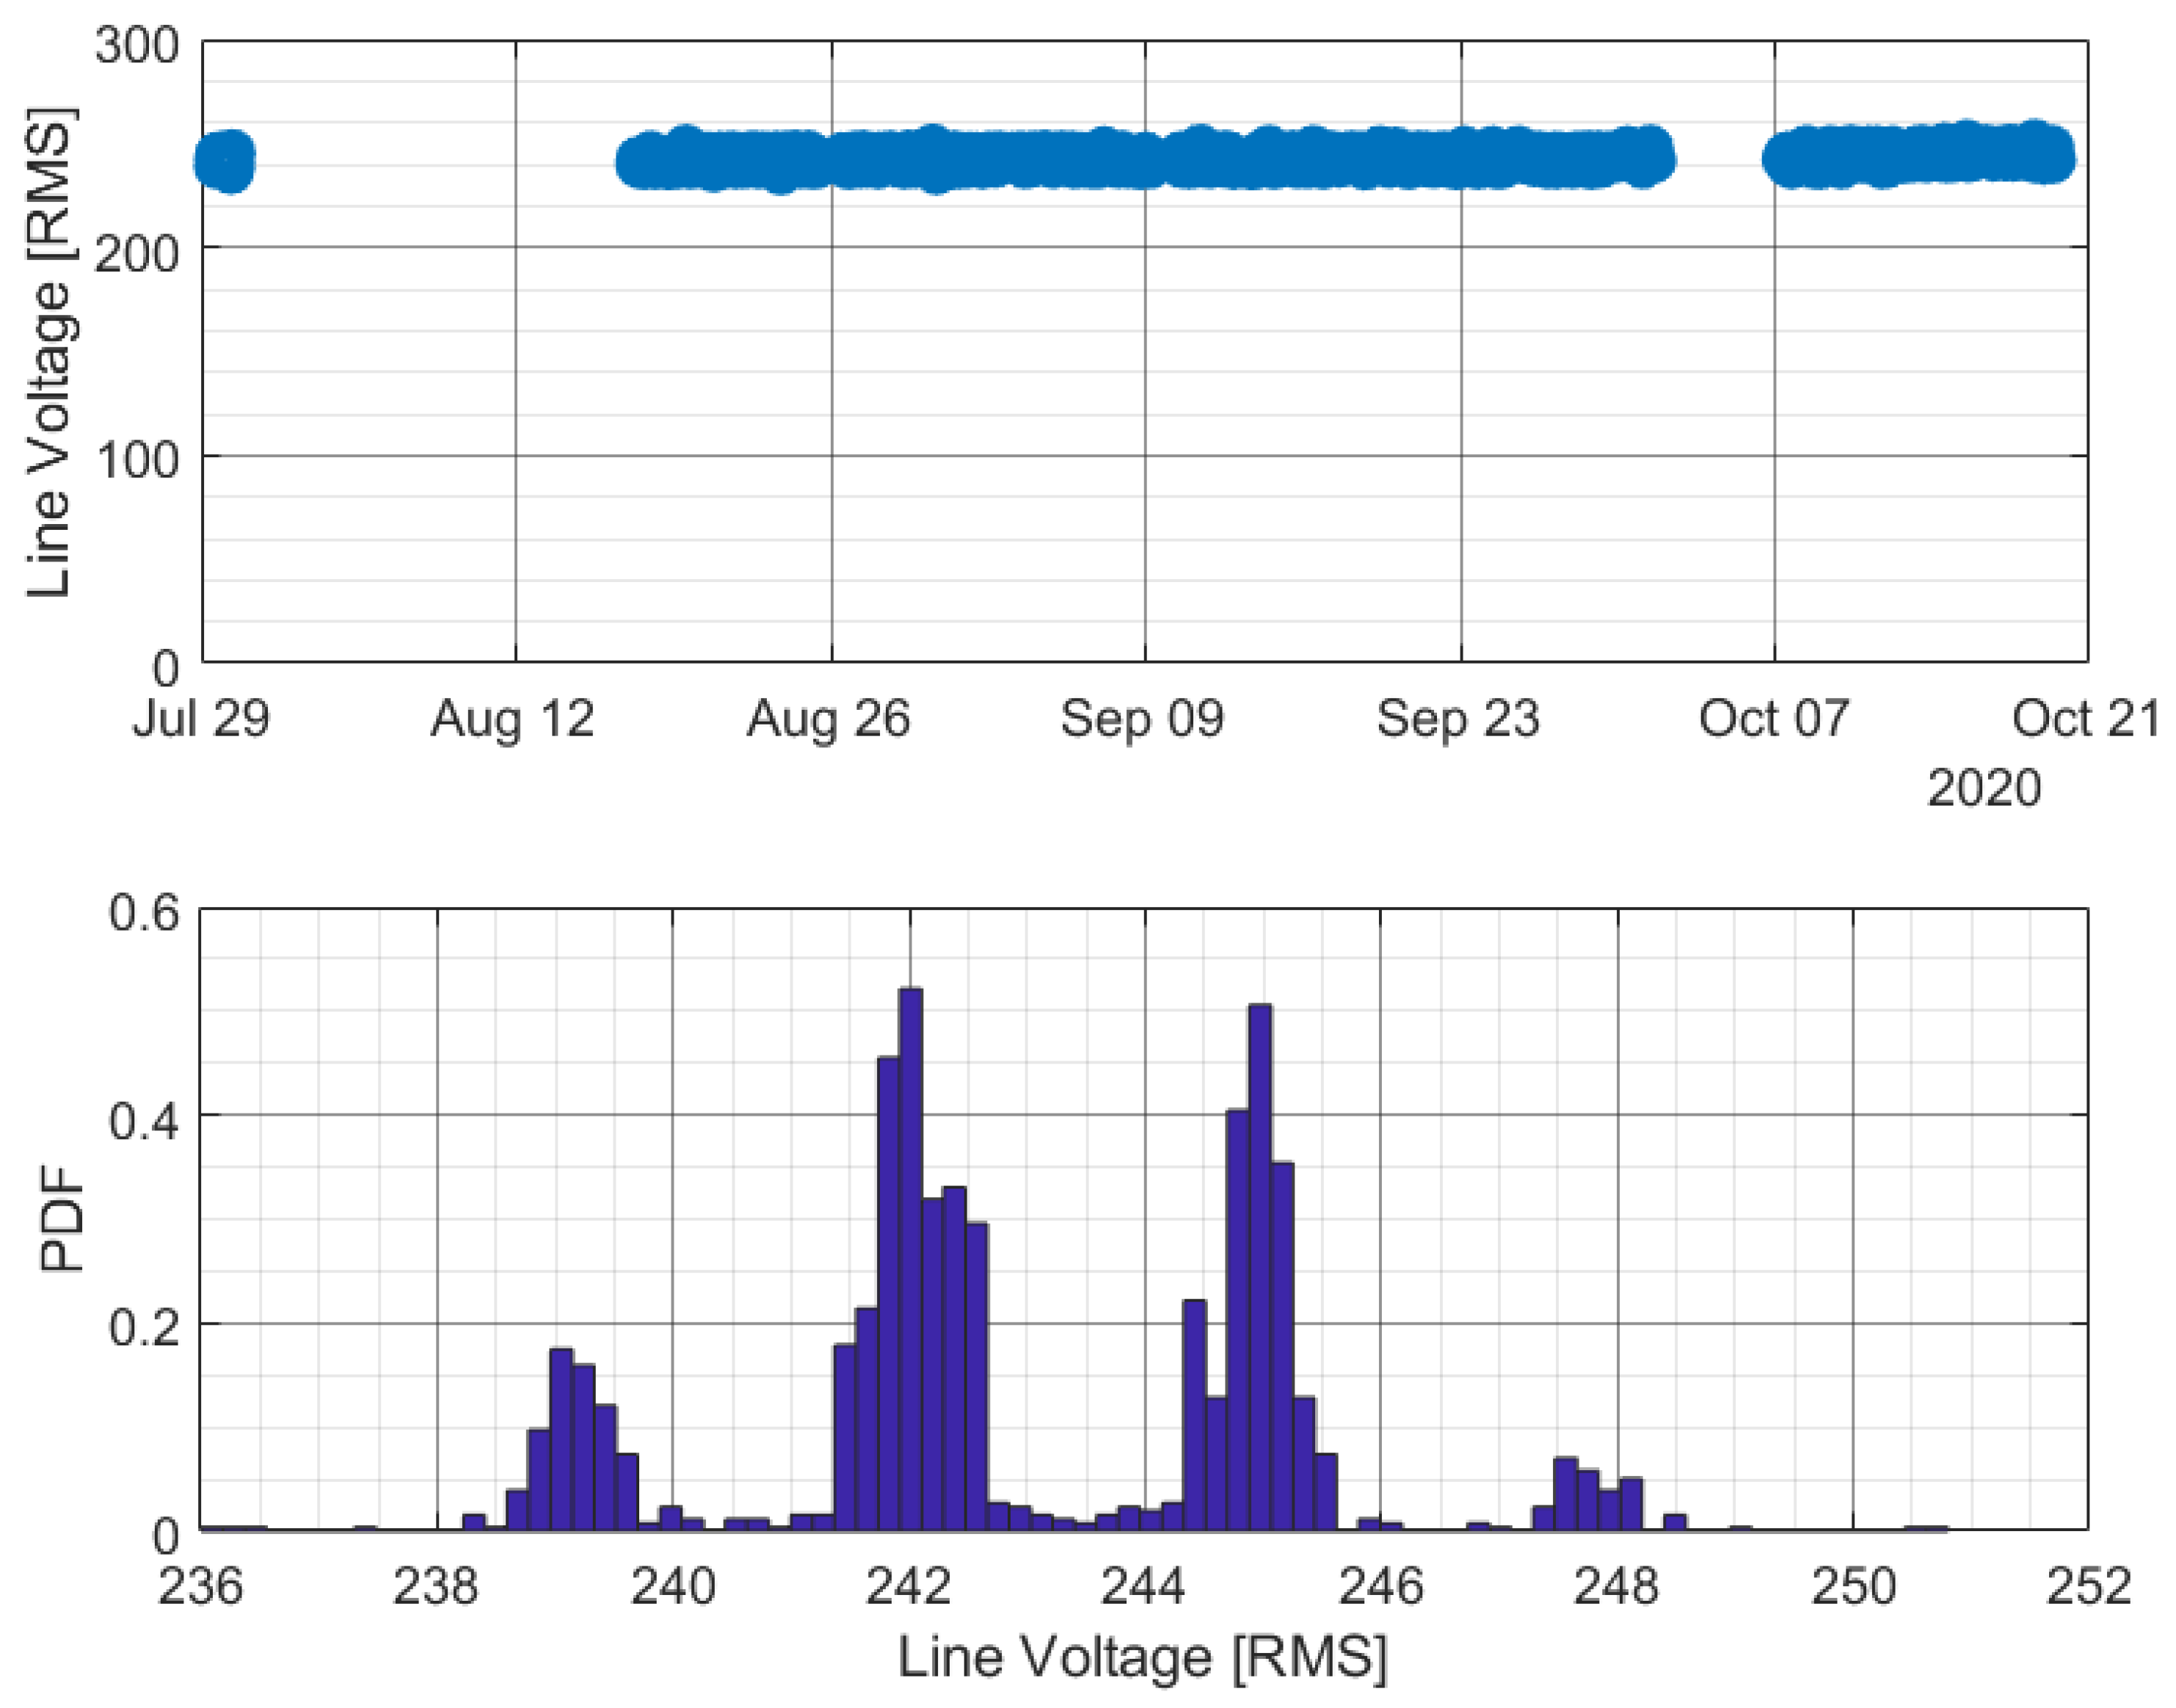
Figure 21 shows the recorded line-to-neutral voltage at the point of common coupling and its distribution at the hybrid station. The system was off during some periods of time due to some inverter disconnections. The figure clearly shows that the voltage is fluctuating within an acceptable range of ≈10 Vrms around a mean value of 243 Vrms from measured data. More specifically, the calculated standard deviation of the line voltage from measurements is ≈2 Vrms.
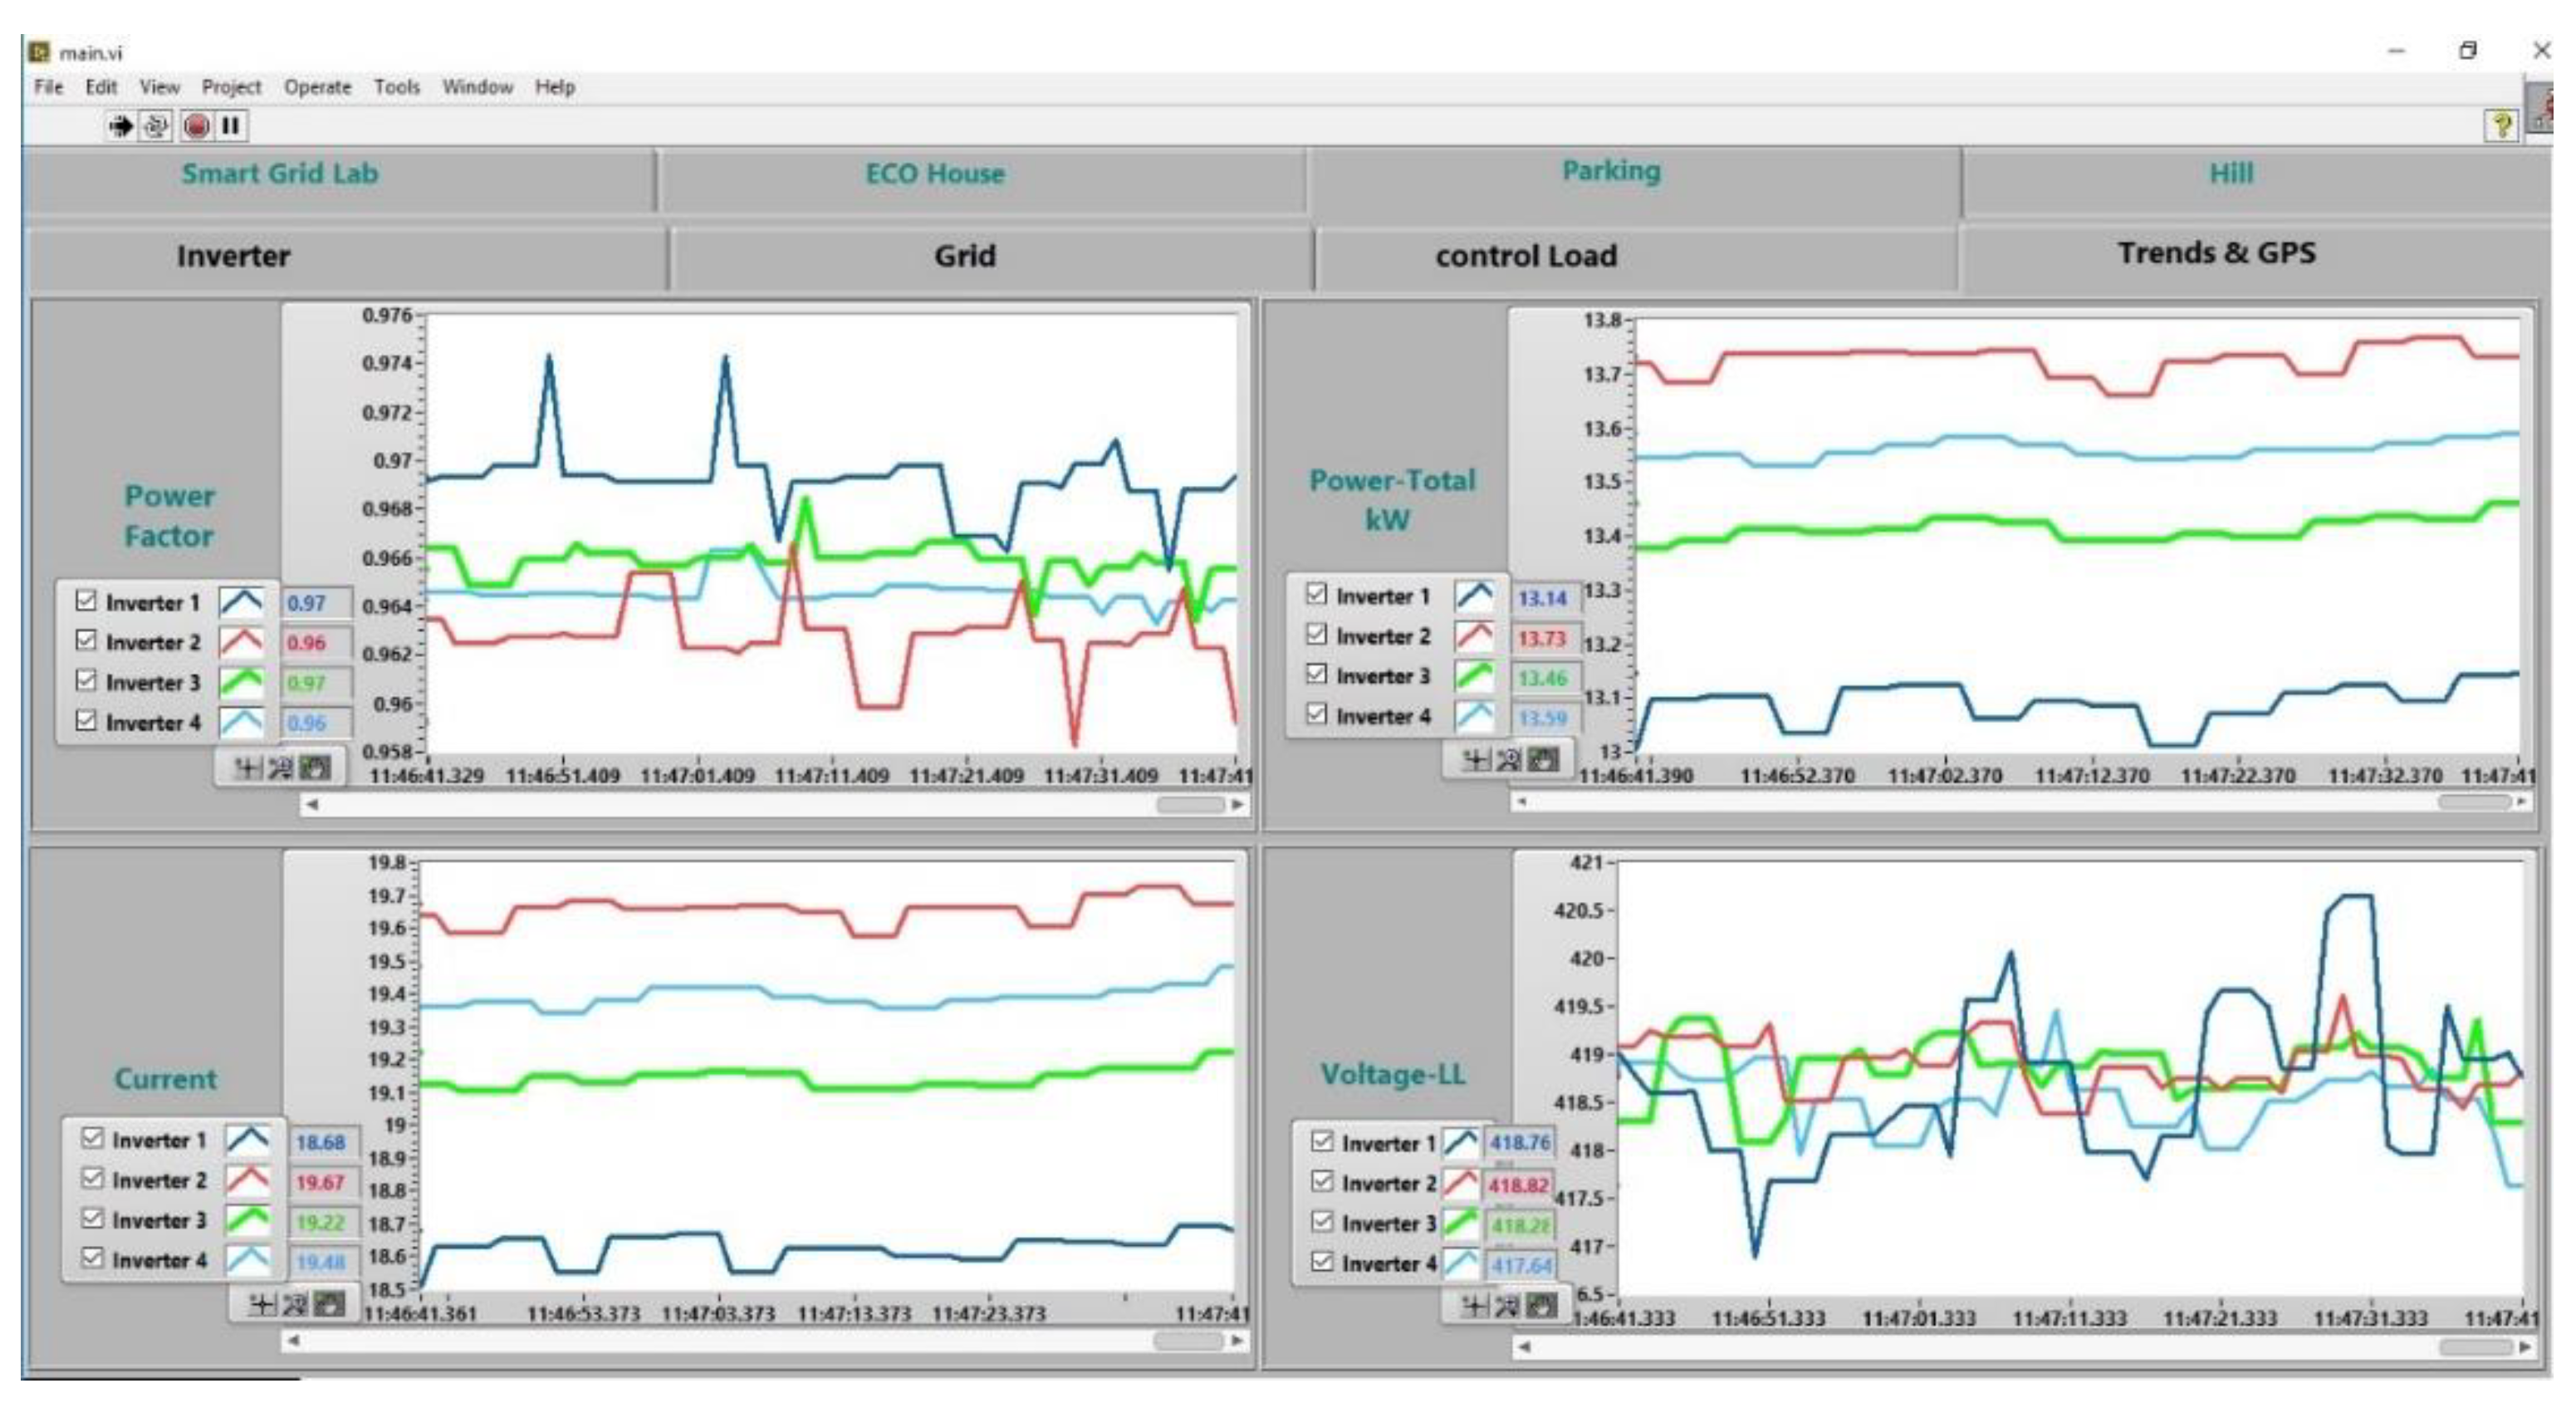
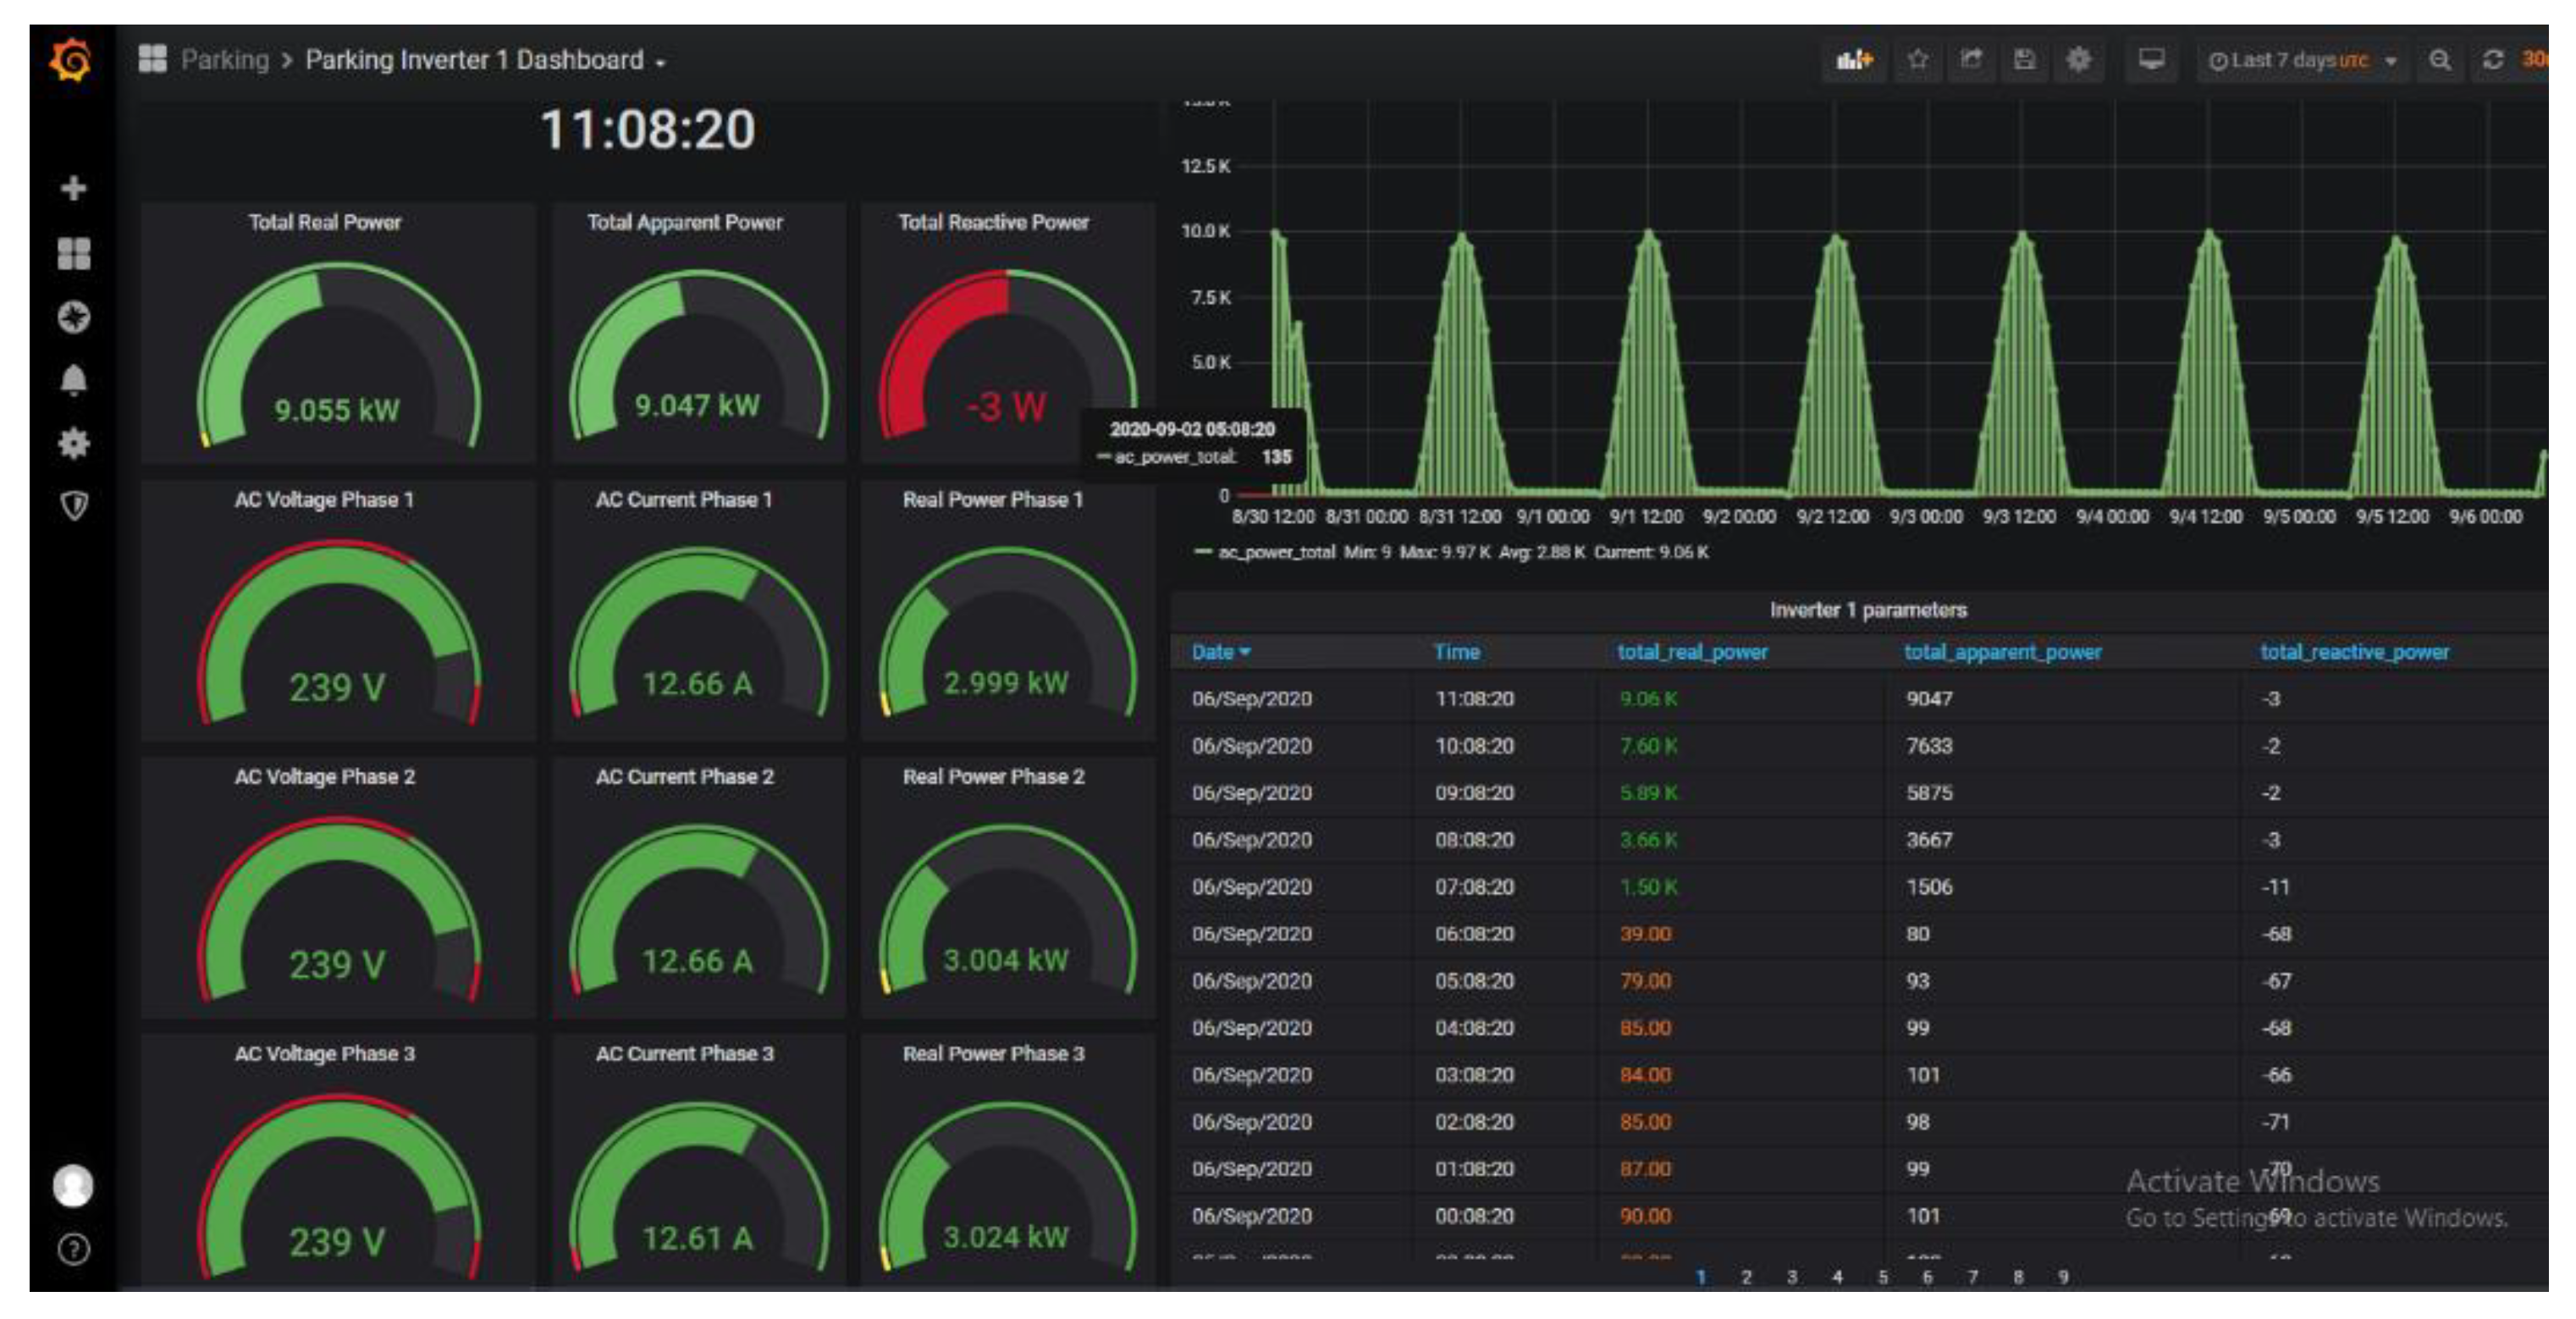
Figure 22 demonstrates the battery charging/discharging current, the output power generated by the PV system solar panels, and the inverter output power. The data were collected at intervals of 15 min. During the daytime, the solar panel is supplied the load power and charging the battery, while during night time, the battery is discharging power as expected. Similarly, a display of the recorded data from the Hybrid Station and the four inverters used at the Solar Car Park is shown in Figure 23 during the second half of September.

6. Conclusions

This paper presents an implementation of integrated distributed energy systems with the power grid using inverter-based distributed renewable energy resources (DERs). The management of DERs is carried out in real time using different communication technologies. A testbed was implemented at Sultan Qaboos University in Oman, where four DERs were grid-connected to the LV network of SQU. The testbed is capable of online monitoring DERs where field-proven results show that DERs controllers can support the smart grid energy management system based on different modes of operation and configuration settings under varying power system conditions. The prototype can be extended to include more control functions and peer–peer communications. This will pave the road to an advanced smart microgrid implementation in the power system.
The real-time monitoring platform is fed by a customized two-way secured communication channel between the microgrids and the control center using a long-range bridged wireless local area network (WLAN). For displaying information in various forms, a dashboard is developed that shows real-time measurements from the DERs. The proposed system is scalable, modular, facilitates the interoperability of various types of inverters, and communicates data over a secure communication channel.
The developed system can be extended to perform control and protection actions. This requires the use of a more accurate GPS clock for network-wide synchronization and the use of higher sampling to capture fast transients. Increasing the sampling rate will lead to a huge amount of electrical parameter data being sent to the central station from all nodes. Hence, constraints due to storage limitations should be considered. On the other hand, although the used communication technology in the developed system is working as needed for monitoring, however, other communication technology options should be investigated to ensure scalability and security of the system. To include monitoring of the microgrid protection system, the controllers of the DERs need to be connected to circuit breaker auxiliary contacts and instrument transformer secondary, tripping, and closing circuits of the circuit breaker.

Author Contributions

Conceptualization, N.H., A.A.M., N.T. and A.E.; methodology, N.H. and A.A.M.; software, A.A.M. and N.T.; validation, A.A.M., N.T. and A.E.; investigation, A.A.-H.; resources, A.A.-H.; writing—original draft preparation, N.H., A.A.M., N.T. and A.E.; writing—review and editing, N.H., A.A.M., N.T., A.E., A.A.-H.; visualization, A.A.M., N.T. and A.E.; project administration, N.H., A.A.M. and A.A.-H.; funding acquisition, N.H. and A.A.-H. All authors have read and agreed to the published version of the manuscript.

Funding

This research was funded by BP Oman, grant number BP/DVC/SERC/17/01. The APC was funded by the same grant.

Acknowledgments

The authors would like to thank Sultan Qaboos University and the Sustainable Energy Research Center (SERC) for creating an excellent and productive academic environment to carry out this research. Special thanks go to the Engr. Abbas Teirab and Engr. Ali Mousavi for their support in implementing the prototype and their excellent work in conducting the experiments.

Conflicts of Interest

The authors declare no conflict of interest.

References

  1. Dileep, G. A survey on smart grid technologies and applications. Renew. Energy 2020, 146, 2589–2625. [Google Scholar] [CrossRef]
  2. Fan, J.; Borlase, S. The evolution of distribution. IEEE Power Energy Mag. 2009, 7, 63–68. [Google Scholar]
  3. Panigrahi, R.; Mishra, S.K.; Srivastava, S.C.; Srivastava, A.K.; Schulz, N.N. Grid Integration of Small-Scale PV Systems in Secondary Distribution Network—A Review. IEEE Trans. Ind. Appl. 2020, 56, 3178–3195. [Google Scholar] [CrossRef]
  4. Bose, B.K. Power Electronics in Renewable Energy Systems and Smart Grid: Technology and Applications; Wiley-IEEE Press: Hoboken, NJ, USA, 2019. [Google Scholar]
  5. Aragon-Aviles, S.; Trivedi, A.; Williamson, S.S. Smart Power Electronics–Based Solutions to Interface Solar-Photovoltaics (PV), Smart Grid, and Electrified Transportation: State-of-the-Art and Future Prospects. MDPI Appl. Sci. 2020, 10, 4988. [Google Scholar] [CrossRef]
  6. Podmore, R.; Robinson, M.R. The Role of Simulators for Smart Grid Development. IEEE Trans. Smart Grid 2010, 1, 205–212. [Google Scholar] [CrossRef]
  7. Bouhafs, F.; Mackay, M.; Merabti, M. Links to the future: Communication requirements and challenges in the smart grid. IEEE Power Energy Mag. 2012, 10, 24–32. [Google Scholar] [CrossRef]
  8. Maurer, L.; Stevens, A.; Reder, W. Tales from the frontline: Keys to successful self-healing distribution projects. IEEE Power Energy Mag. 2012, 10, 100–106. [Google Scholar] [CrossRef]
  9. Li, F.; Lima, J.W.M.; Rudnick, H.; Marangon-Lima, L.M.; Padhy, N.P.; Brunekreeft, G.; Reneses, J.; Kang, C. Distribution pricing: Are we ready for the smart grid? IEEE Power Energy Mag. 2015, 13, 76–86. [Google Scholar] [CrossRef]
  10. Praiselin, W.J.; Edward, J.B. A Review on Impacts of Power Quality, Control and Optimization Strategies of Integration of Renewable Energy Based Microgrid Operation. Int. J. Intell. Syst. Appl. 2018, 10, 67–81. [Google Scholar]
  11. Hossain, M.A.; Pota, H.R.; Hossain, M.J.; Blaabjerg, F. Evolution of microgrids with converter-interfaced generations: Challenges and opportunities. Int. J. Electr. Power Energy Syst. 2019, 109, 160–186. [Google Scholar] [CrossRef]
  12. Yavuz, L.; Önen, A.; Muyeen, S.M.; Kamwa, I. Transformation of microgrid to virtual power plant—A comprehensive review. IET Gener. Transm. Distrib. Spec. Issue Emerg. Technol. Virtual Power Plant Mi-Crogrid 2019, 13, 1994–2005. [Google Scholar] [CrossRef]
  13. Pramono, S.H.; Sari, S.N.; Maulana, E. Internet-based monitoring and protection on PV smart grid system. In Proceedings of the 2017 International Conference on Sustainable Information Engineering and Technology (SIET), Malang, Indonesia, 24–25 November 2017. [Google Scholar]
  14. Naeem, M.; Anani, N.; Ponciano, J.; Shahid, M. Remote condition monitoring of a PV system using an embedded web server. In Proceedings of the 2nd IEEE PES International Conference and Exhibition on Innovative Smart Grid Technologies, Manchester, UK, 5–7 December 2011. [Google Scholar]
  15. Yaghmaee, M.H.; Hejazi, H. Design and Implementation of an Internet of Things Based Smart Energy Metering. In Proceedings of the IEEE International Conference on Smart Energy Grid Engineering (SEGE), Oshawa, ON, Canada, 12–15 August 2018. [Google Scholar]
  16. LÓpez-Vargas, A.; Fuentes, M.; Vivar, M. On the application of IoT for real-time monitoring of small stand-alone PV systems: Results from a new smart datalogger. In Proceedings of the IEEE 7th World Conference on Photovoltaic Energy Conversion (WCPEC) (A Joint Conference of 45th IEEE PVSC, 28th PVSEC & 34th EU PVSEC), Waikoloa Village, HI, USA, 10–15 June 2018. [Google Scholar]
  17. Brenkuš, J.; Stopjaková, V.; Slávik, M. Energy Monitoring Platform for Smart Grid Applications. In Proceedings of the 2018 International Conference on Applied Electronics (AE), Pilsen, Czech Republic, 11–12 September 2018. [Google Scholar]
  18. Rezk, H.; Tyukhov, I.; Al-Dhaifallah, M.; Tikhonov, A. Performance of data acquisition system for monitoring PV system parameters. Measurement 2017, 104, 204–211. [Google Scholar] [CrossRef]
  19. Bayrak, G.; Cebecï, M. Monitoring a grid connected PV power generation system with labview. In Proceedings of the 2013 International Conference on Renewable Energy Research and Applications (ICRERA), Madrid, Spain, 20–23 October 2013. [Google Scholar]
  20. Mathur, A.; Krishnan, R. A novel approach to micro-grid control using DAQ interface. In Proceedings of the 2013 International Conference on Energy Efficient Technologies for Sustainability, Nagercoil, India, 10–12 April 2013. [Google Scholar]
  21. Chompoo-Inwai, C.; Mungkornassawakul, J. A Smart Recording Power Analyzer Prototype Using LabVIEW and Low-Cost Data Acquisition (DAQ) in Being a Smart Renewable Monitoring System. In Proceedings of the 2013 IEEE Green Technologies Conference (GreenTech), Denver, CO, USA, 4–5 April 2013. [Google Scholar]
  22. Bansal, P.; Singh, A. Smart metering in smart grid framework: A review. In Proceedings of the Fourth International Conference on Parallel, Distributed and Grid Computing (PDGC), Waknaghat, India, 22–24 December 2016. [Google Scholar]
  23. Hafez, O. Time of use prices considering smart meters and their future implementation in Saudi Arabia smart grid. In Proceedings of the 2017 Saudi Arabia Smart Grid (SASG), Jeddah, Saudi Arabia, 12–14 December 2017. [Google Scholar]
  24. Vilas, G.; Pujara, A.; Bakre, S.M.; Muralidhara, V. Implementation of metering practices in smart grid. In Proceedings of the 2015 International Conference on Smart Technologies and Management for Computing, Communication, Controls, Energy and Materials (ICSTM), Chennai, India, 6–8 May 2015. [Google Scholar]
  25. Wibisono, G.; Permata, S.G.; Awaludin, A.; Suhasfan, P. Development of advanced metering infrastructure based on LoRa WAN in PLN Bali toward Bali Eco smart grid. In Proceedings of the 2017 Saudi Arabia Smart Grid (SASG), Jeddah, Saudi Arabia, 12–14 December 2017. [Google Scholar]
  26. Jellad, T.; Taouil, K.; Chtourou, Z. MgSMA: An enhanced SMA for microgrid energy management. In Proceedings of the 2014 5th International Renewable Energy Congress (IREC), Hammamet, Tunisia, 25–27 March 2014. [Google Scholar]
  27. Mallwitz, R.; Engel, B. Solar power inverters. In Proceedings of the 2010 6th International Conference on Integrated Power Electronics Systems, Nuremberg, Germany, 16–18 March 2010. [Google Scholar]
  28. Beránek, V.; Olšan, T.; Libra, M.; Poulek, V.; Sedláček, J.; Dang, M.-Q.; Tyukhov, I.I. New Monitoring System for Photovoltaic Power Plants. Manag. Energ. 2018, 11, 2495. [Google Scholar] [CrossRef] [Green Version]
  29. Raman, S.H.; Hanafiah, M.A.M.; Ghani, M.R.A.; Jusoh, W.N.S.E.W. A human machine interface (HMI) framework for Smart Grid system. In Proceedings of the 2014 IEEE Innovative Smart Grid Technologies—Asia (ISGT ASIA), Kuala Lumpur, Malaysia, 20–23 May 2014. [Google Scholar]
  30. Mak, S.T.; So, E. Integration of PMU, SCADA, AMI to accomplish expanded functional capabilities of Smart Grid. In Proceedings of the 29th Conference on Precision Electromagnetic Measurements (CPEM 2014), Rio de Janeiro, Brazil, 24–29 August 2014. [Google Scholar]
  31. Artale, G.; Cataliotti, A.; Cosentino, V.; DiCara, D.; Guaiana, S.; Panzavecchia, N.; Tinè, G. Real-Time Power Flow Monitoring and Control System for Microgrids Integration in Islanded Scenarios. IEEE Trans. Ind. Appl. 2019, 55, 7186–7197. [Google Scholar] [CrossRef]
  32. Dabbaghjamanesh, M.; Moeini, A.; Kavousi-Fard, A.; Jolfaei, A. Real-time monitoring and operation of microgrid using distributed cloud–fog architecture. Elsevier J. Parallel Distrib. Comput. 2020, 146, 15–24. [Google Scholar] [CrossRef]
  33. González, I.; Calderón, A.J.; Andújar, J.M. Novel remote monitoring platform for RES-hydrogen based smart microgrid. Elsevier Energy Convers. Manag. 2017, 148, 489–505. [Google Scholar] [CrossRef]
  34. Bhattarai, B.P.; Paudyal, S.; Luo, Y.; Mohanpurkar, M.; Cheung, K.; Tonkoski, R.; Hovsapian, R.; Myers, K.S.; Zhang, R.; Zhao, P.; et al. Big data analytics in smart grids: State-of-the art, challenges, opportunities, and future directions. IET Smart Grid 2019, 2, 141–154. [Google Scholar] [CrossRef]
Figure 1. Locations of the renewable energy systems at the Sultan Qaboos University campus. The figure is annotated with information about Solar Inverters (SI), Wind Inverters (WI), Distance (D), Solar Panels (SP), Power Generation (PG), On-Grid (On-G), Off-Grid (Off-G), and Central Monitoring Point (CMP).
Electronics 10 01803 g001
Figure 2. An RES monitoring system. The monitoring system collects and logs data from solar panels, wind turbines, storage batteries, inverters, smart meters, and an optional weather station.
Electronics 10 01803 g002
Figure 3. Battery bank used at the Smart Grid Lab.
Electronics 10 01803 g003
Figure 4. Battery storage for the hybrid DER.
Electronics 10 01803 g004
Figure 5. WattNode WNC-3Y-400-MB used as a smart meter.
Electronics 10 01803 g005
Figure 6. Connection of WattNode to the server via an RS232-to-RS485 converter.
Electronics 10 01803 g006
Figure 7. Connection of WattNode to the server via an RS485-to-TCP/IP converter.
Electronics 10 01803 g007
Figure 8. The layout of the real-time monitoring system. Notice that only the Smart Grid Lab and Hybrid Station include a wind turbine in their DERs. All locations communicate with the server through a bidirectional communication channel.
Electronics 10 01803 g008
Figure 9. System implementation at the Smart Grid Lab. The top figure shows a block diagram of the system, while the bottom shows the actual implementation in the lab.
Electronics 10 01803 g009aElectronics 10 01803 g009b
Figure 10. SMA cluster controller at the Solar Car Parking Station.
Electronics 10 01803 g010
Figure 11. The Hybrid Station. The top figure shows the single line diagram of PV-Battery, while the bottom figure shows how the WattNode and IFD9507 converter are interfaced to the hybrid inverter.
Electronics 10 01803 g011
Figure 12. The software components of the monitoring system.
Electronics 10 01803 g012
Figure 13. NI OPC server configuration.
Electronics 10 01803 g013
Figure 14. OPC Quick Client for debugging and troubleshooting.
Electronics 10 01803 g014
Figure 15. NI shared variable engine for connectivity between LabVIEW and OPC.
Electronics 10 01803 g015
Figure 16. LabVIEW connection with MySQL database.
Electronics 10 01803 g016
Figure 17. LabVIEW visualization of inverter’s DC-side quantities.
Electronics 10 01803 g017
Figure 18. LabVIEW visualization of inverter’s AC-side quantities.
Electronics 10 01803 g018
Figure 19. Time-domain plots based on the values of quantities over a period of time.
Electronics 10 01803 g019
Figure 20. A Grafana dashboard that shows the parameters queried from the Solar Car Park DER.
Electronics 10 01803 g020
Figure 21. The line-to-neutral voltage at the Hybrid Station. Top plot: real-time measurements, Bottom: PDF of line voltage.
Electronics 10 01803 g021
Figure 22. Microgrid PV system power and battery monitoring. The (top) plot shows the generated power from the PV panels and the output from the inverter. The (bottom) plot shows the current value on the battery side.
Electronics 10 01803 g022
Figure 23. Power (top) and voltage levels (bottom) measured from the inverters at the Hybrid Station and Solar Cark Park.
Electronics 10 01803 g023
Table 1. Power generation in the first quarter of the year 2020.
LocationSmart Grid LabSolar Car ParkEco-House
Parameter
Minimum Generated Power72 W52 W13 W
Maximum Generated Power713 W42.8 kW11.3 kW
Average Generated Power203 W12.4 kW3.7 kW
Generate Energy0.44 MWh26.8 MWh8.0 MWh
Generate Energy Percentage2%75%23%
Average AC Voltage243 V240.0 V241.2 V
Average AC Current0.84 A51.6 A15.3 A
Publisher’s Note: MDPI stays neutral with regard to jurisdictional claims in published maps and institutional affiliations.

