
GaborPDNet: Gabor Transformation and Deep Neural Network for Parkinson’s Disease Detection Using EEG Signals

 , , ,
, , , 

 ,
, 
Abstract
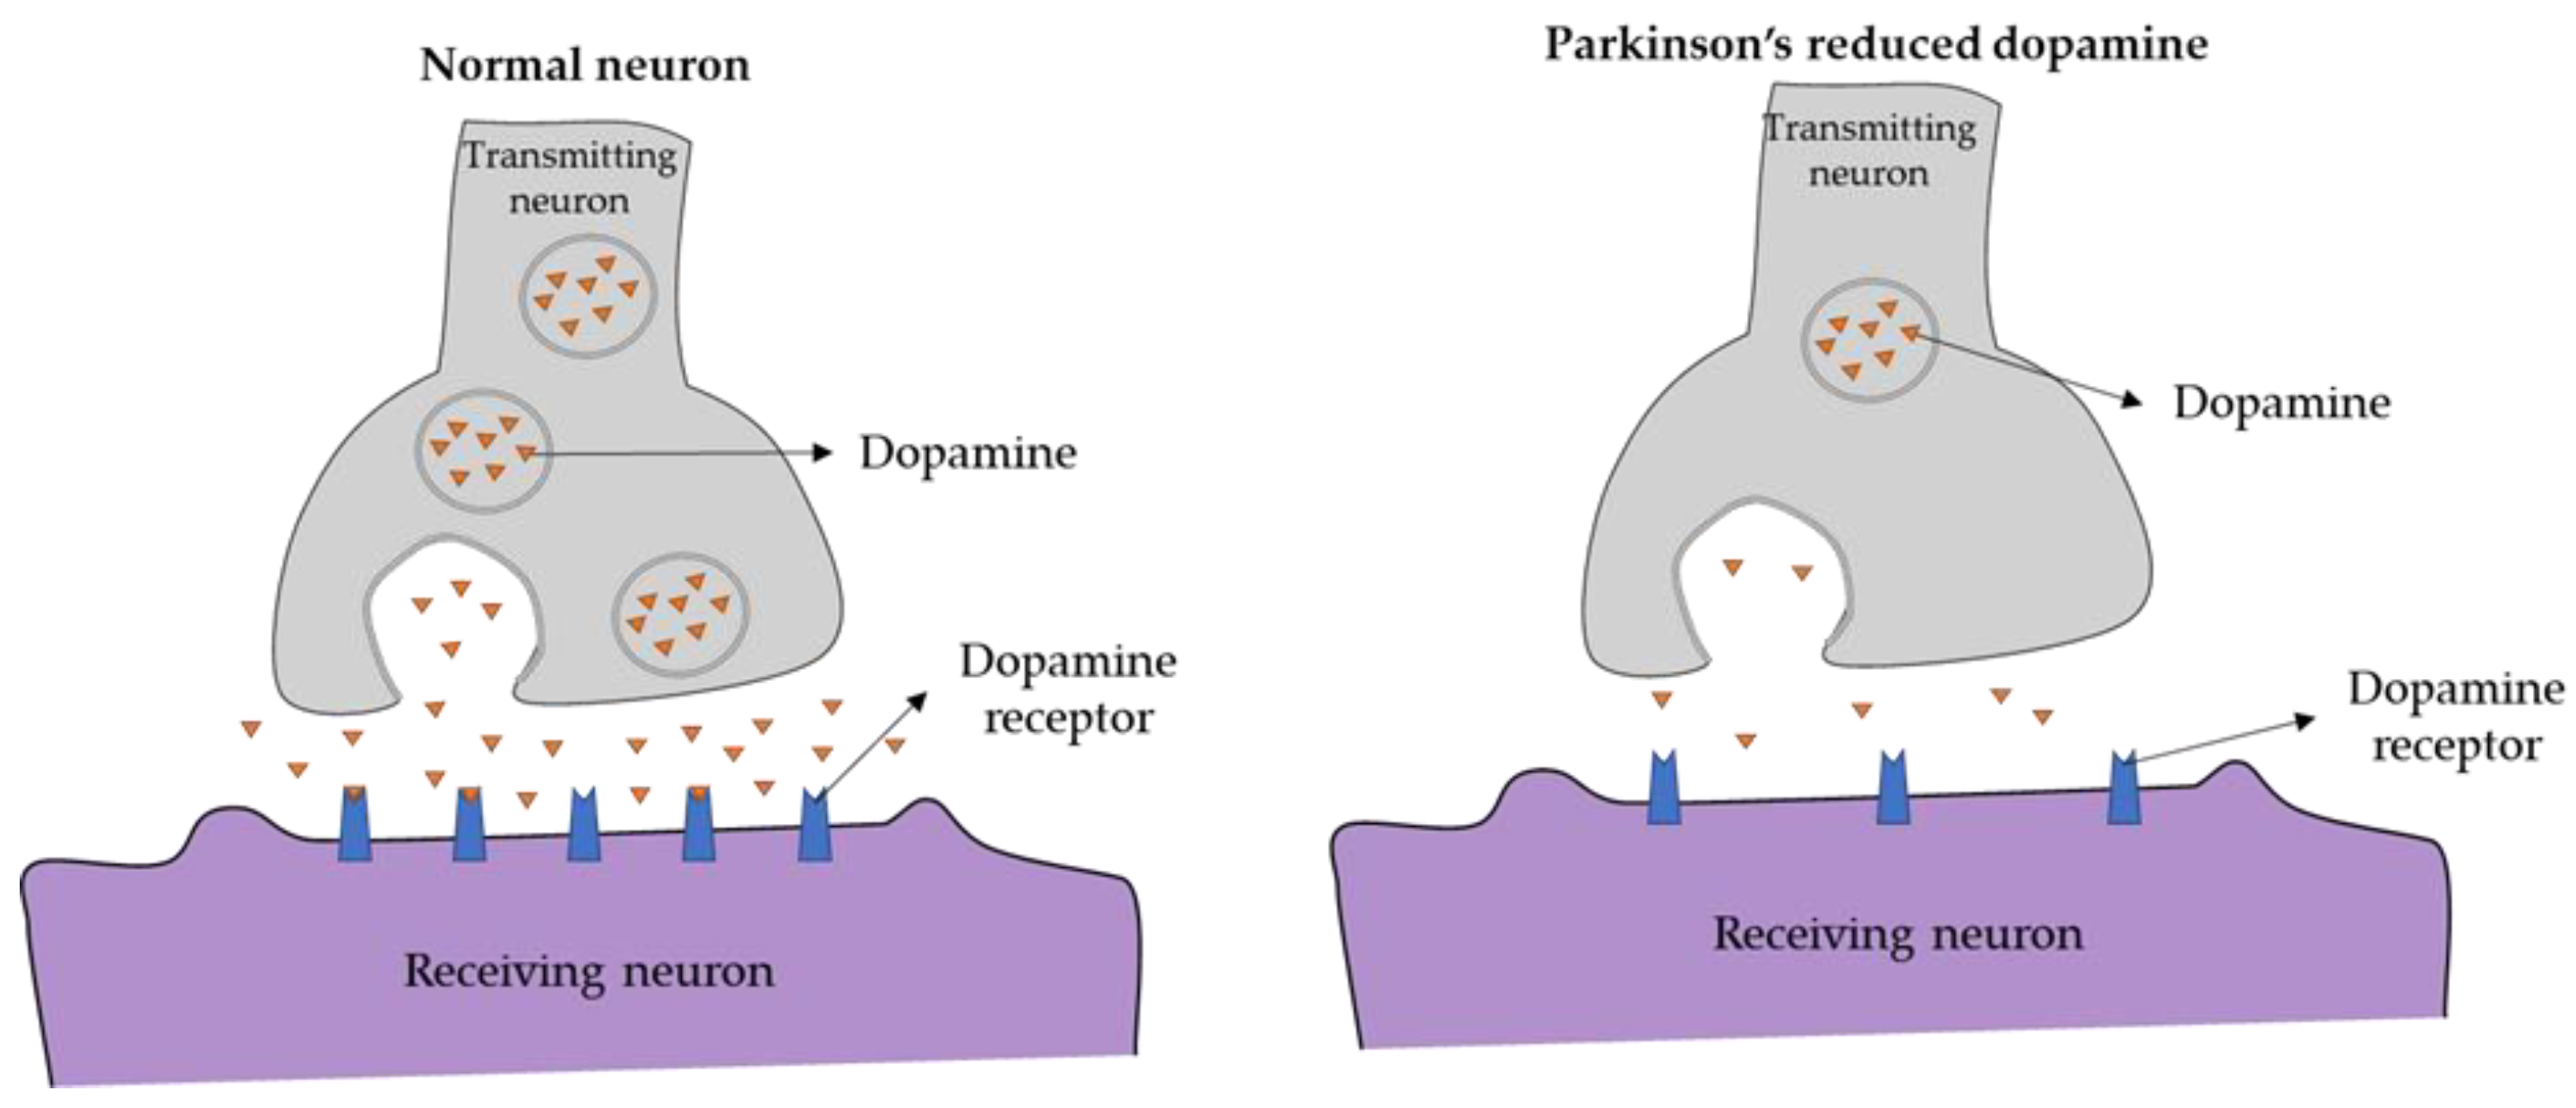
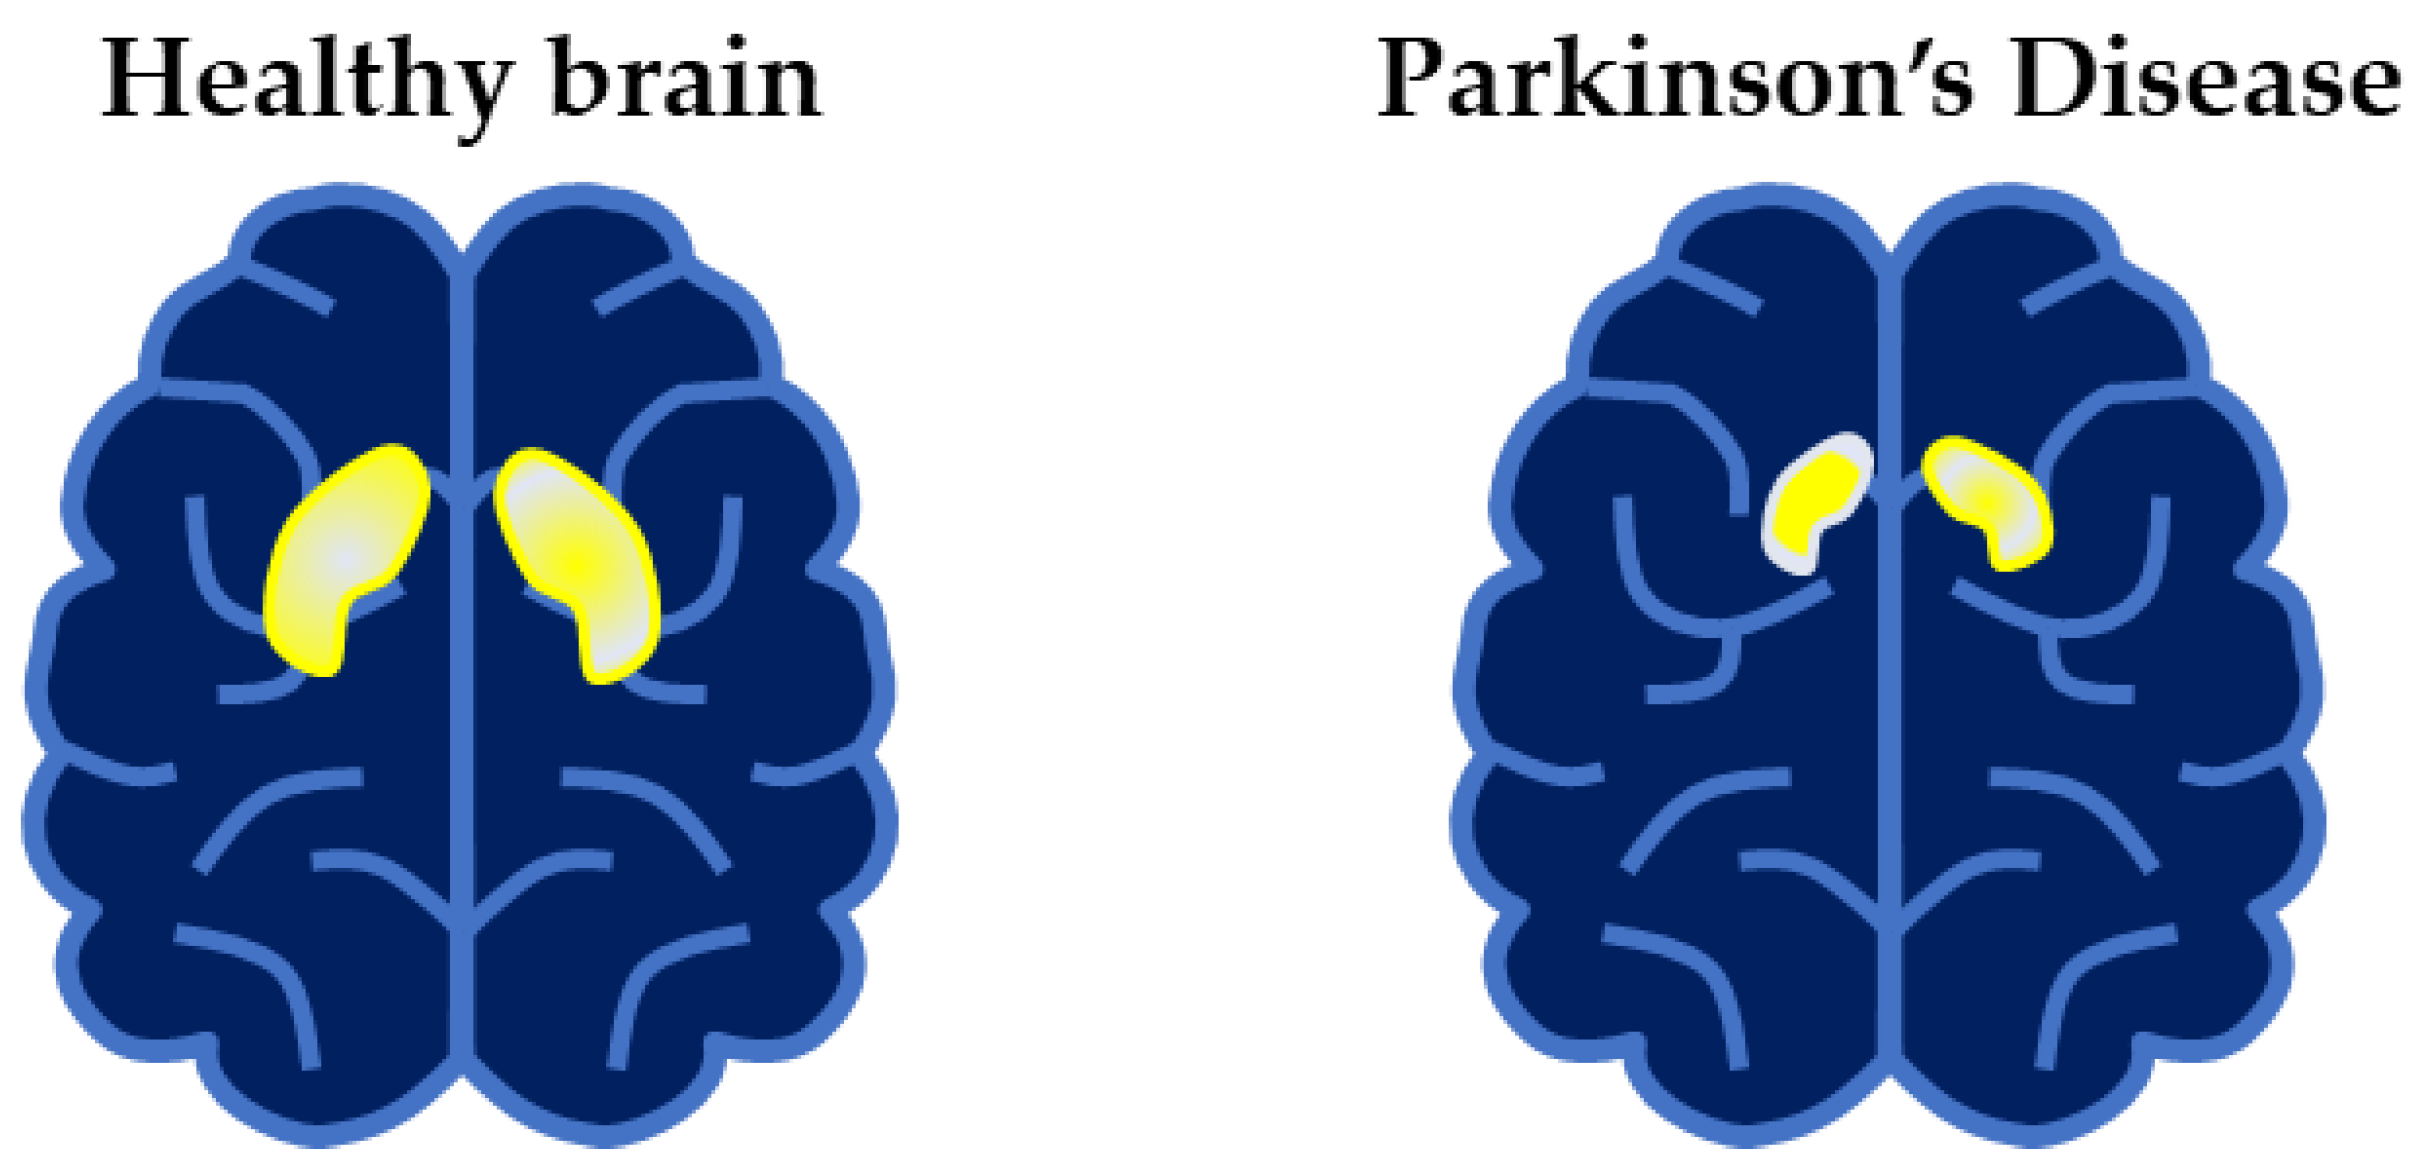
:1. Introduction
Related Works
2. Materials and Methods
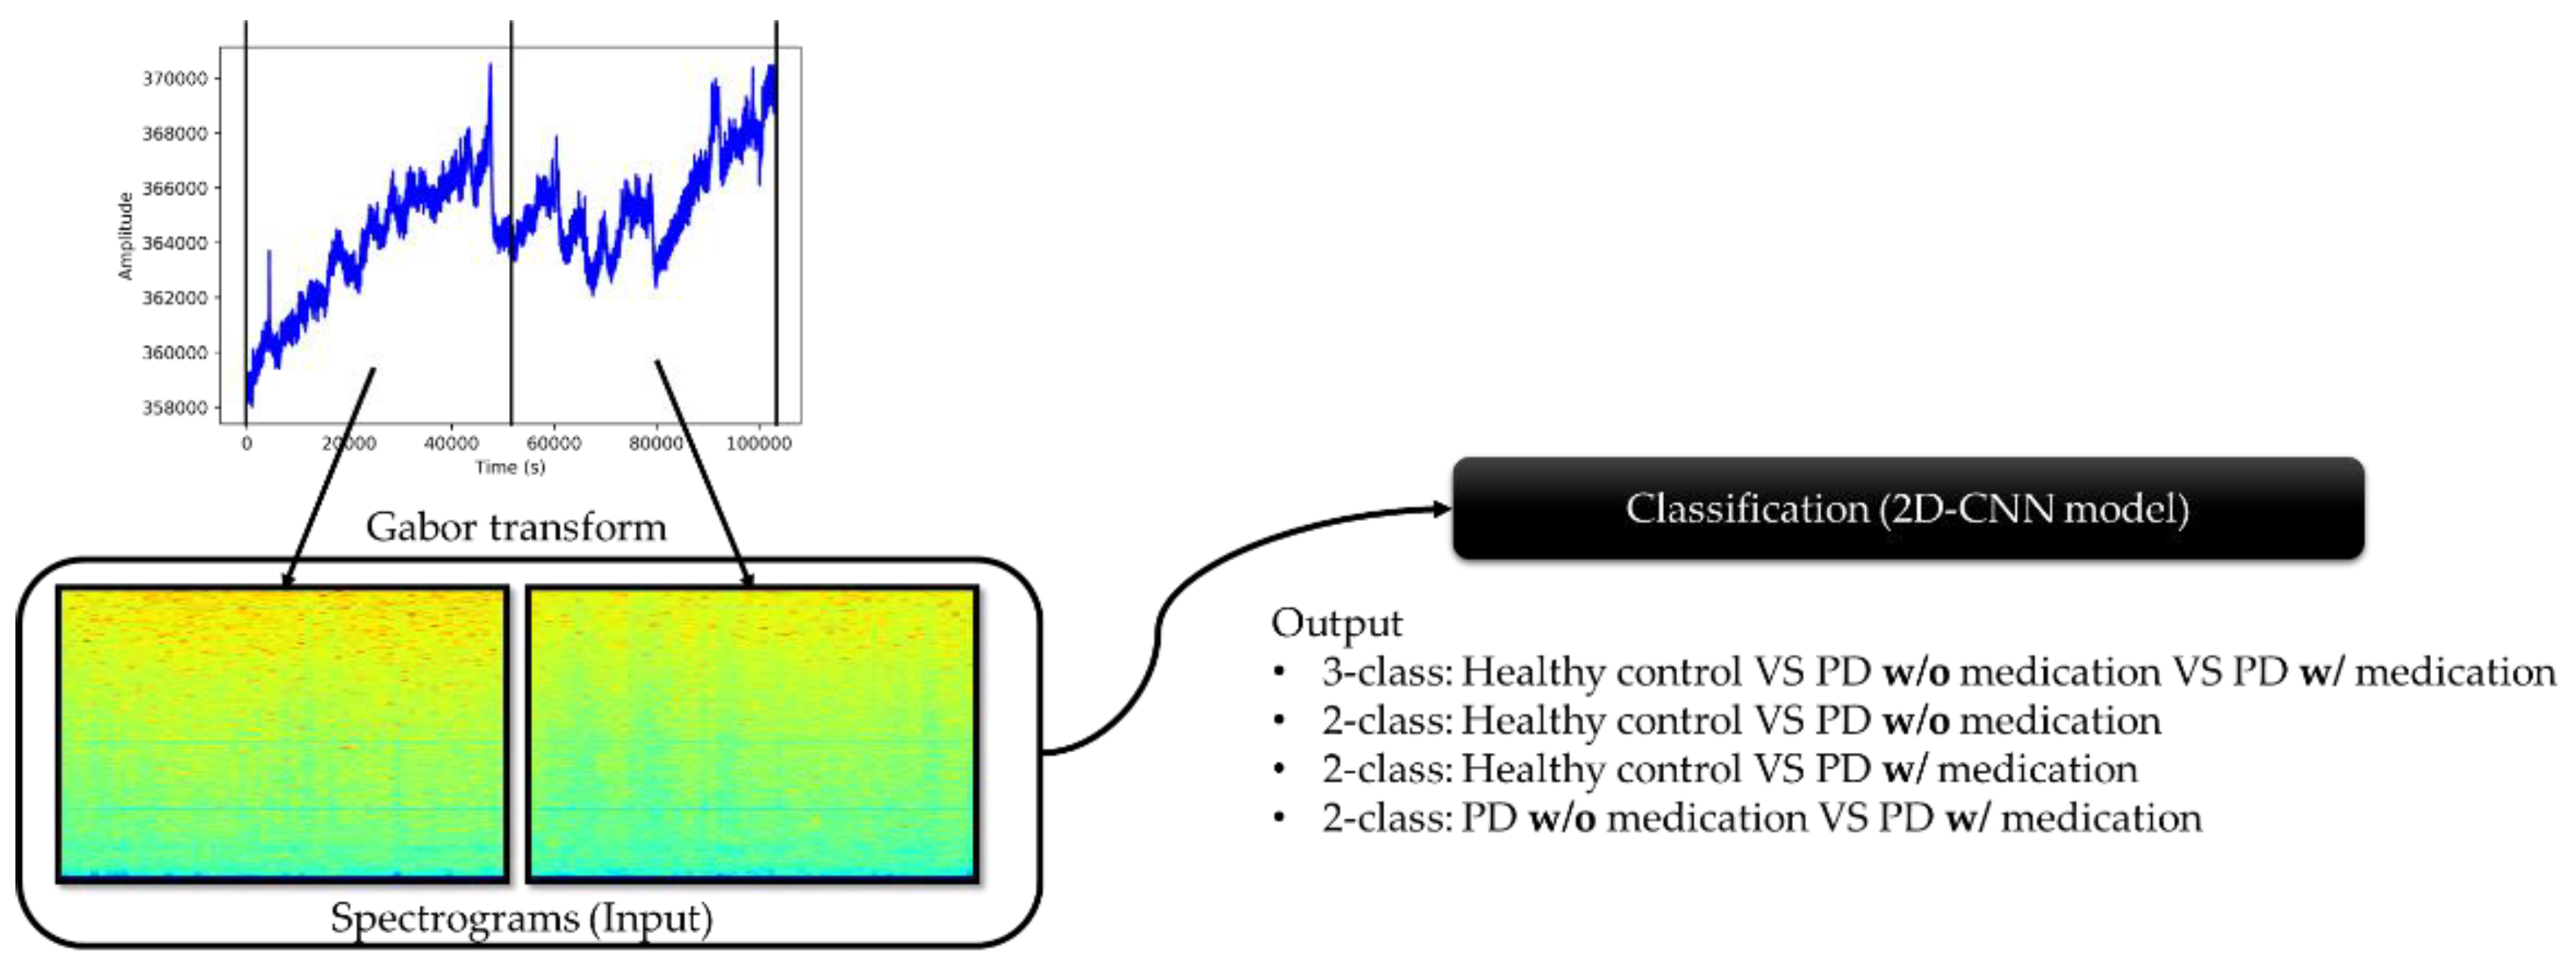
2.1. Dataset Acquisition
2.2. Experimental Setup
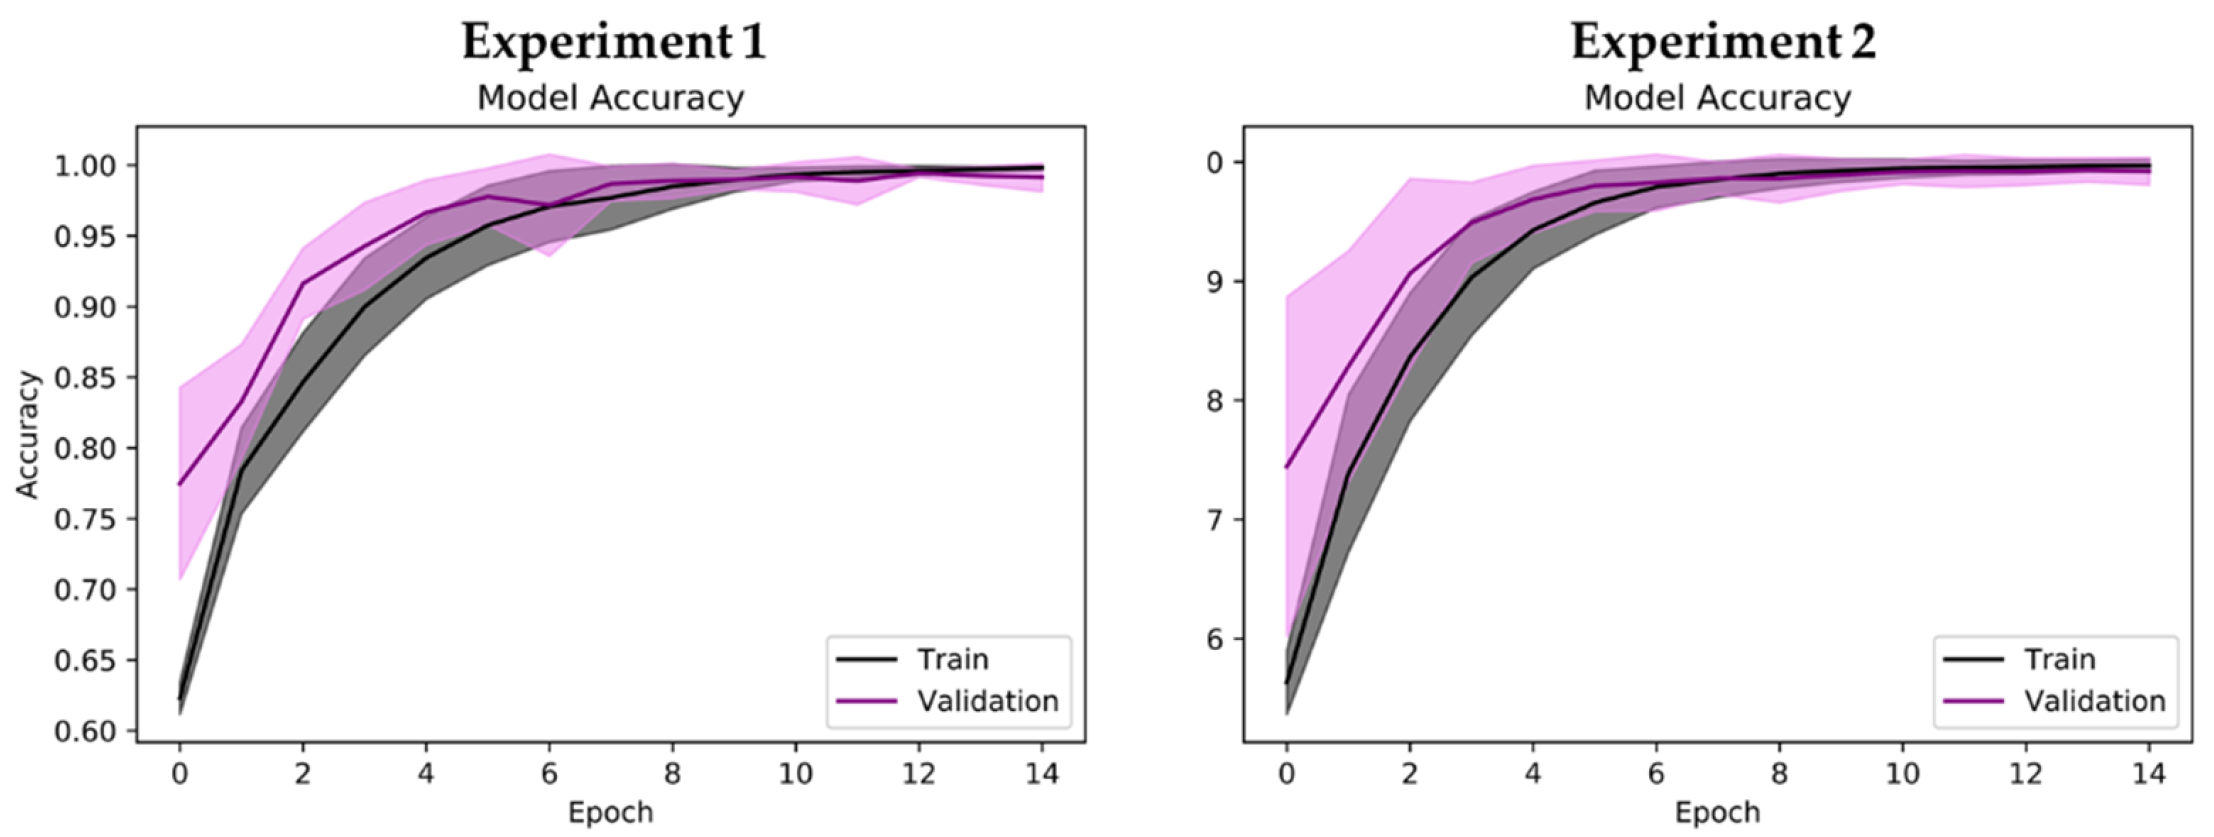
- Experiment 1: 3-class classification, namely, healthy control, PD without medication, and PD with medication (total no. of spectrogram images = 2944).
- Experiment 2: healthy control versus PD patients without medication (total no. of spectrogram images = 1984).
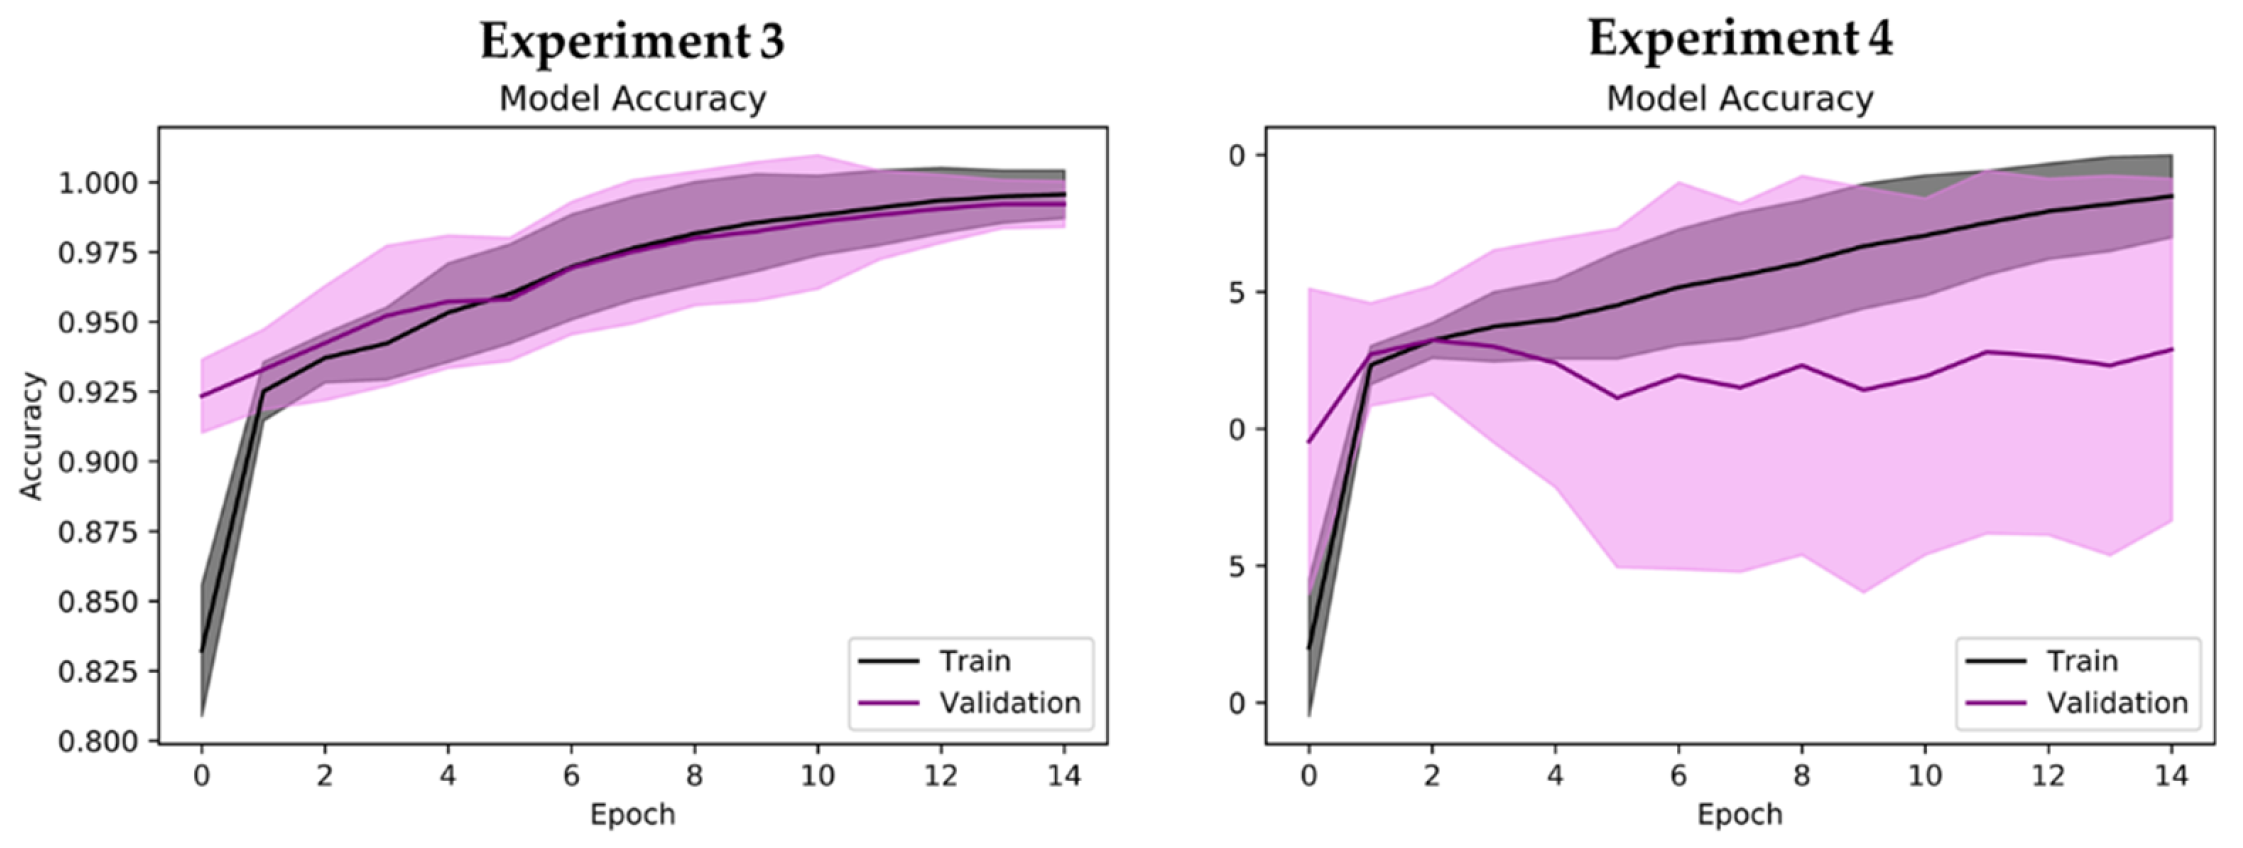
- Experiment 3: healthy control versus PD patients with medication (total no. of spectrogram images = 1984).
- Experiment 4: PD patients with and without medication (total no. of spectrogram images = 1920).
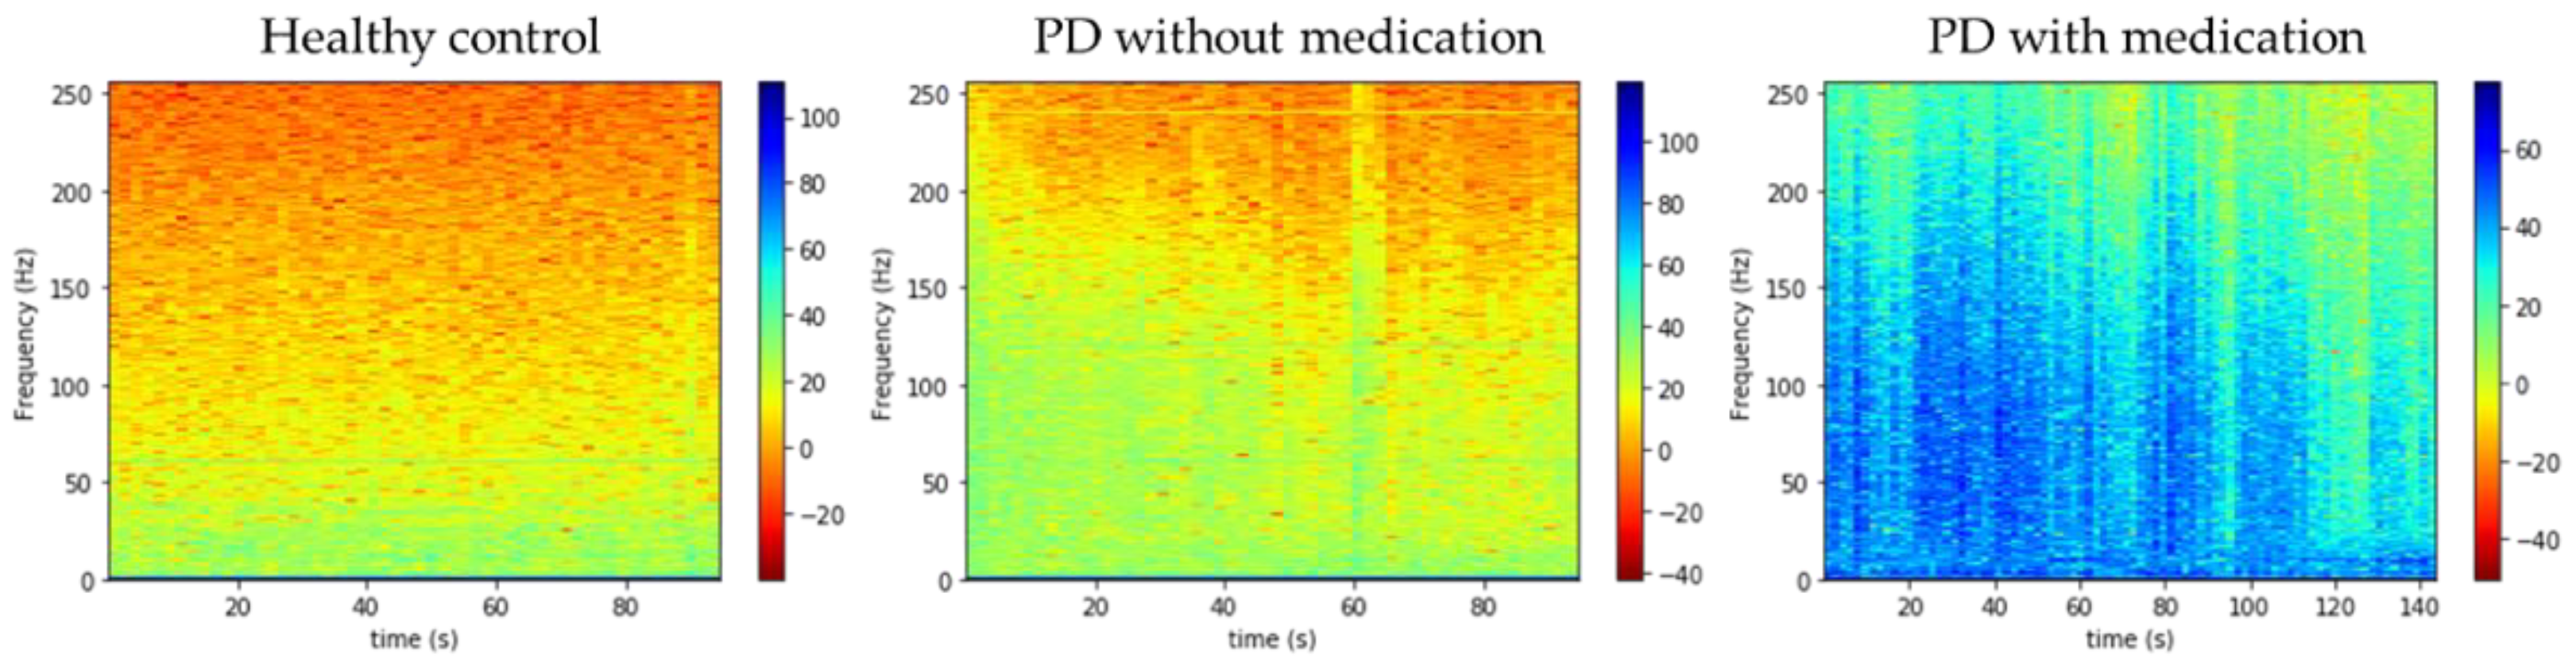
2.3. Preprocessing (Gabor Transform)
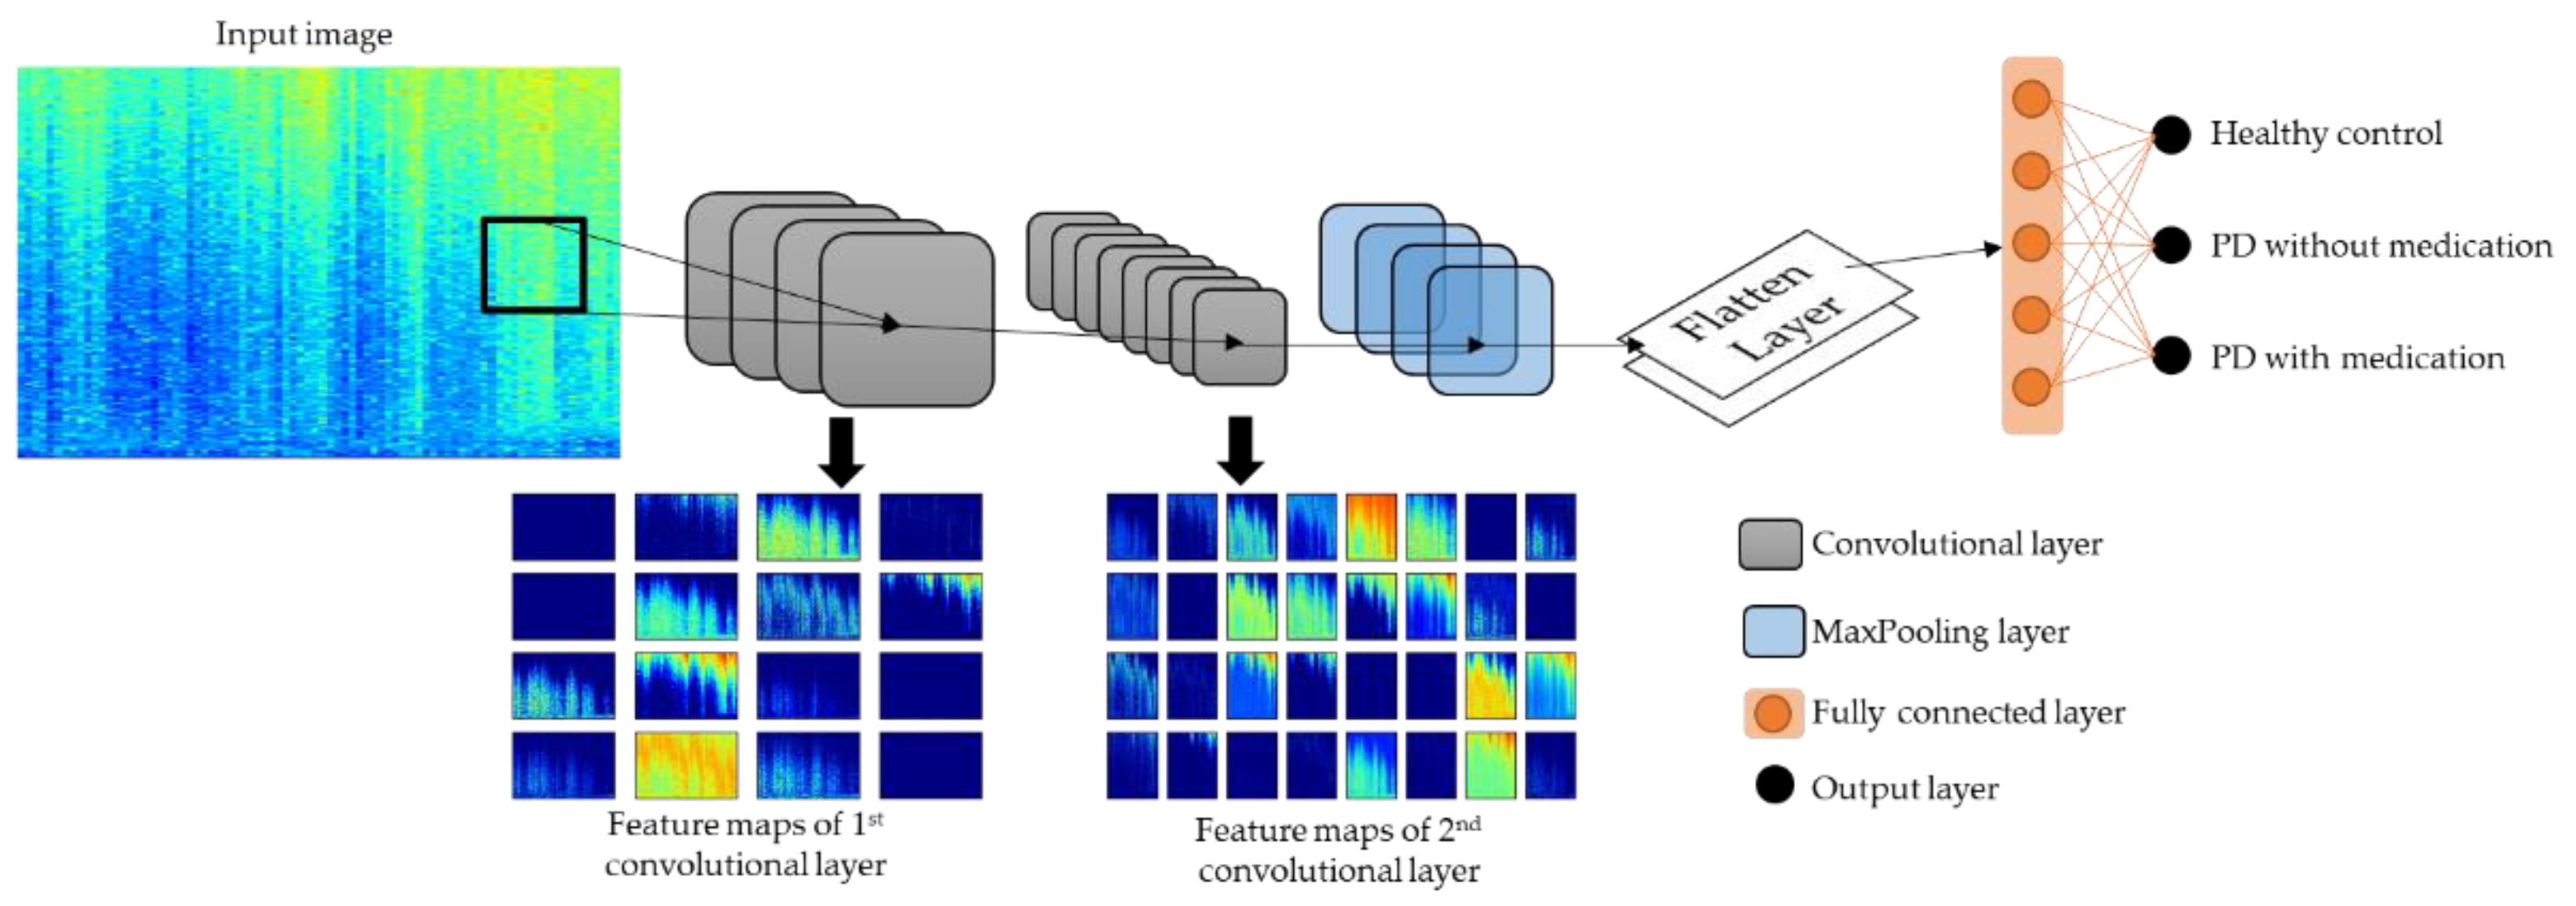
2.4. Model Architecture
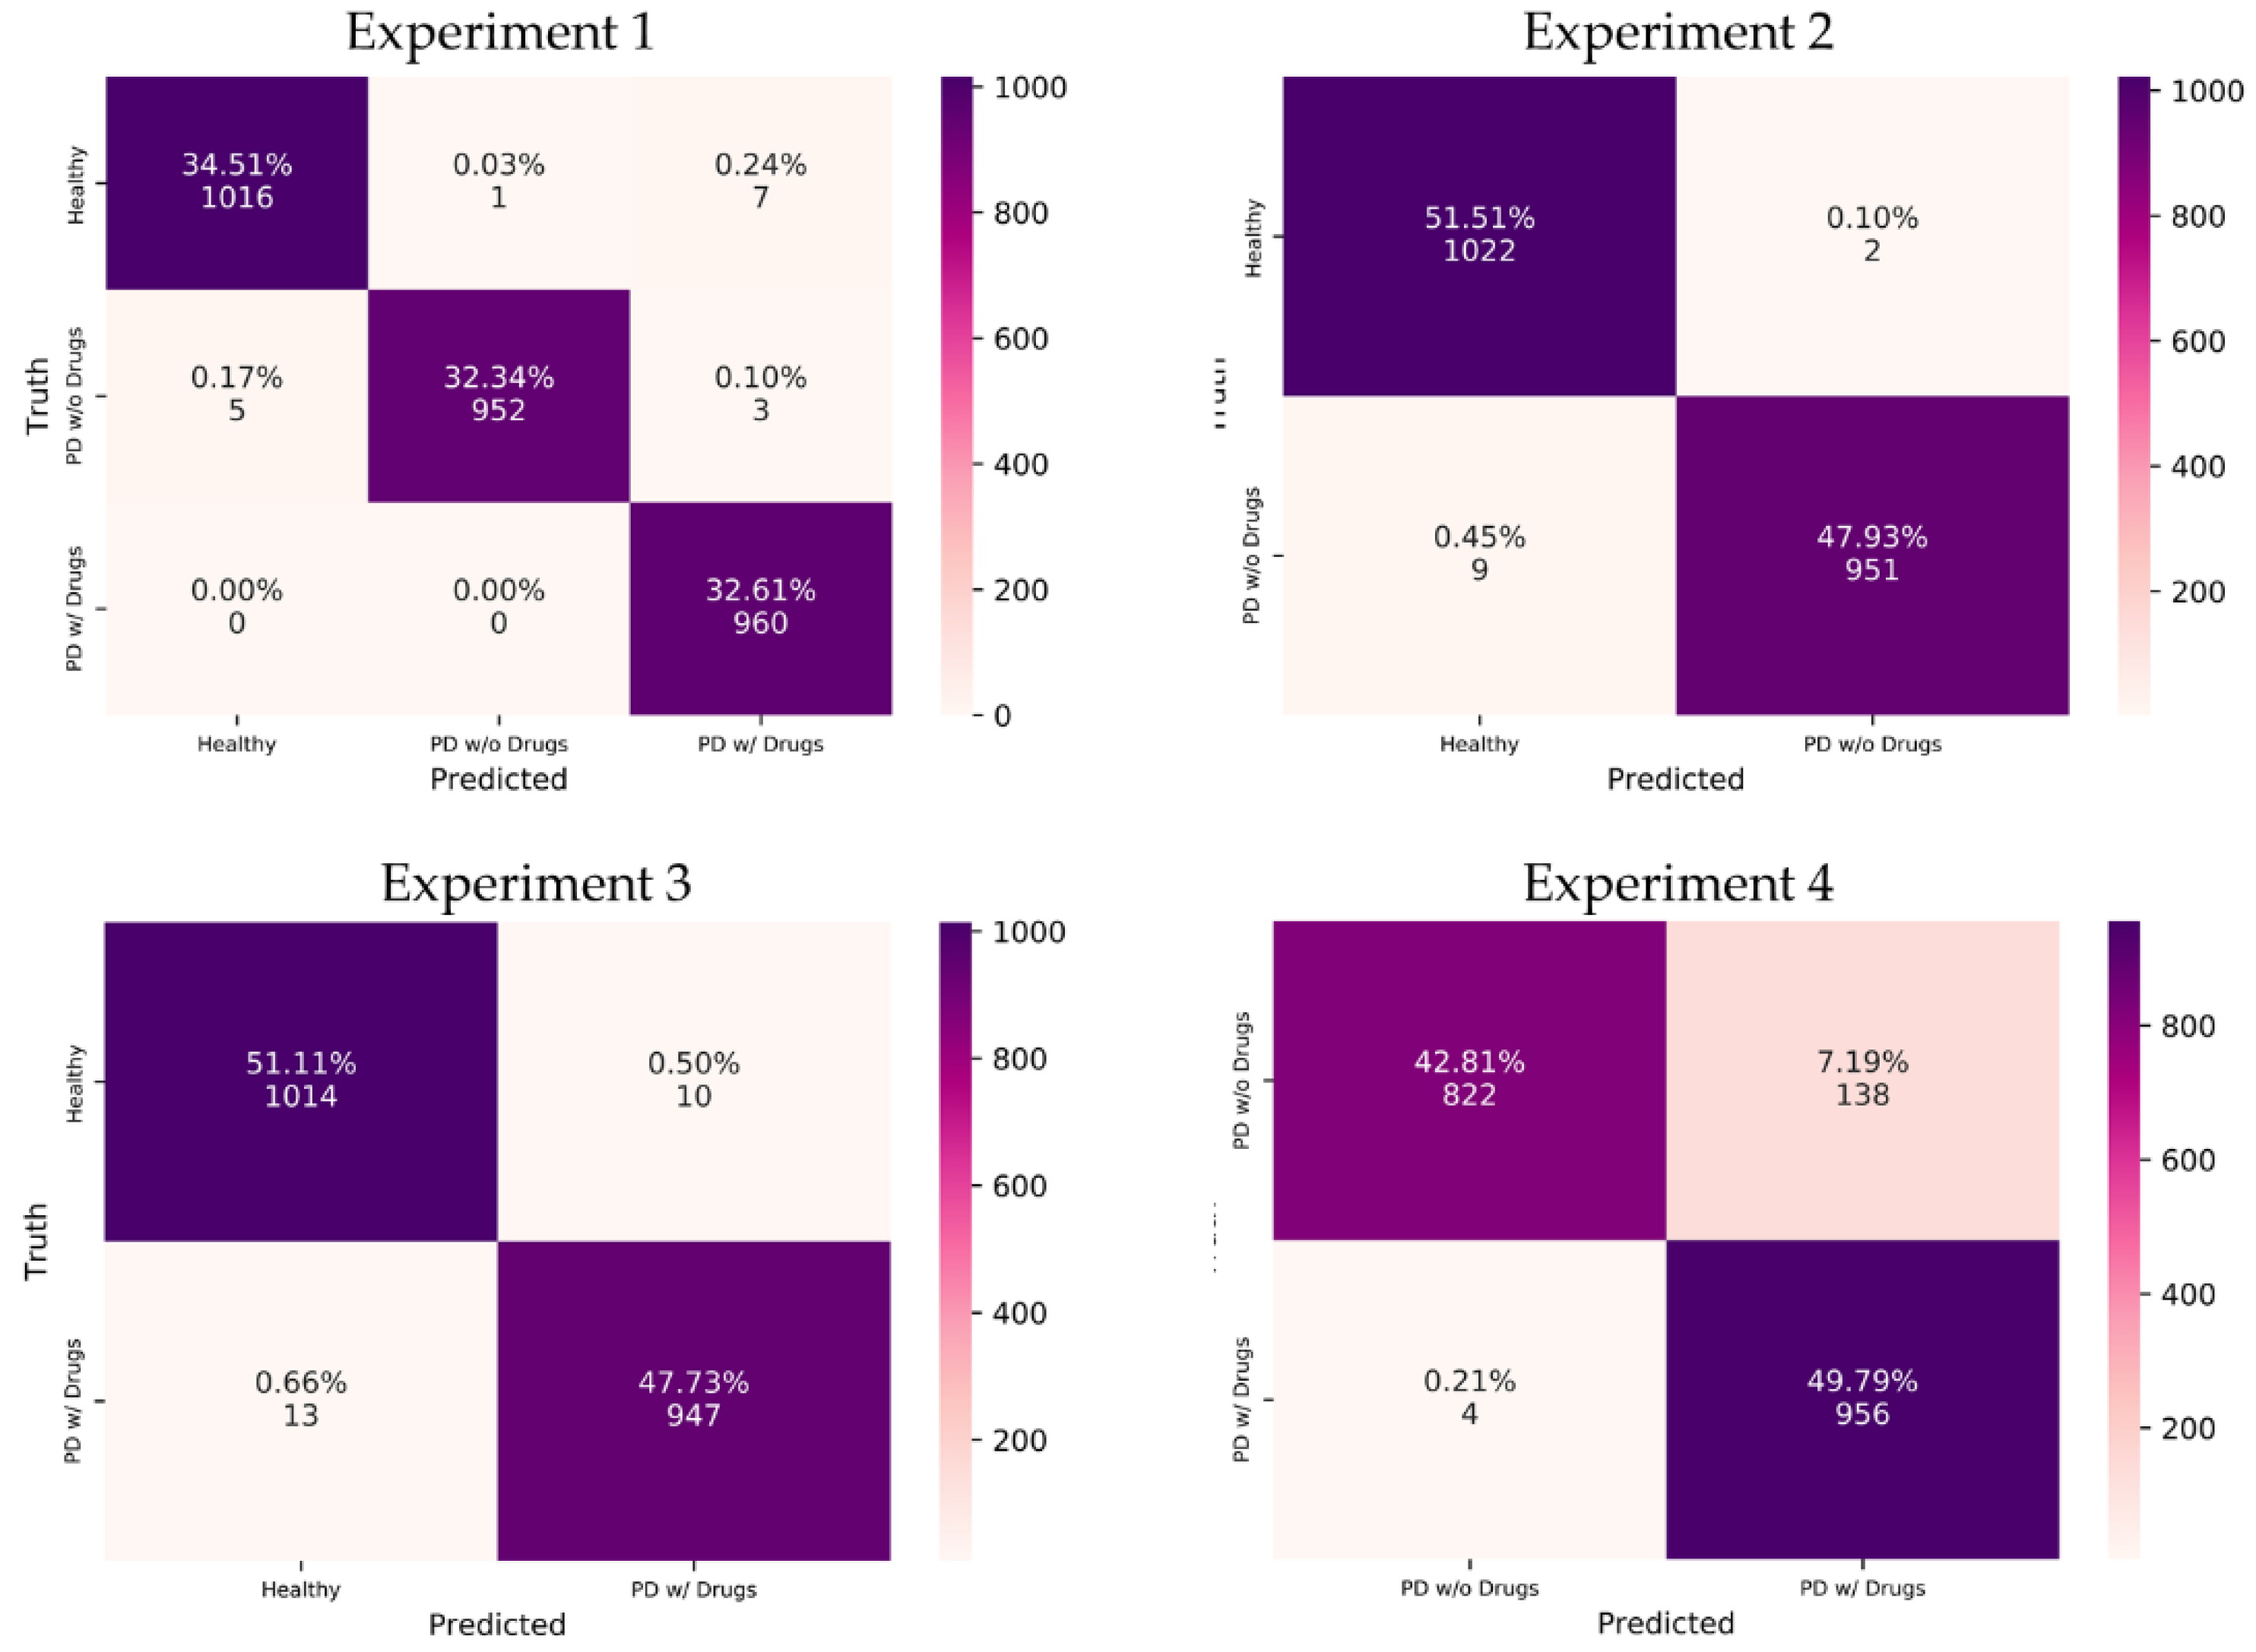
3. Results
4. Discussion
- Simple workflow.
- A new publicly available PD dataset was used.
- Spectrograms via Gabor transformation of EEG signals were used for analysis.
- Deep-learning model based of 2D-CNN was proposed for automated PD detection.
- High model performance for three-class classification: healthy controls, and PD patients with and without dopaminergic medications.
- The proposed model could automatically detect PD patients and distinguish if each patient was on medication or not.
- Two-dimensional CNN models are computationally demanding, which results in long training times.
- Large computer memory is required, as the model may crash when it exceeds the memory load due to the large number of images for model training.
- The small number of participants in the PD dataset used in this study may reduce the generalizability of the proposed model.
5. Conclusions
Author Contributions
Funding
Data Availability Statement
Conflicts of Interest
References
- Goetz, C.G. The history of Parkinson’s disease: Early clinical descriptions and neurological therapies. Cold Spring Harb. Perspect. Med. 2011, 1, a008862. [Google Scholar] [CrossRef] [PubMed] [Green Version]
- Bhat, S.; Acharya, U.R.; Hagiwara, Y.; Dadmehr, N.; Adeli, H. Parkinson’s disease: Cause factors, measurable indicators, and early diagnosis. Comput. Biol. Med. 2018, 102, 234–241. [Google Scholar] [CrossRef] [PubMed]
- Politis, M.; Wu, K.; Molloy, S.; Bain, P.G.; Chaudhuri, K.R.; Piccini, P. Parkinson’s disease symptoms: The patient’s perspective. Mov. Disord. 2010, 25, 1646–1651. [Google Scholar] [CrossRef] [PubMed]
- Balestrino, R.; Schapira, A.H.V. Parkinson disease. Eur. J. Neurol. 2020, 27, 27–42. [Google Scholar] [CrossRef]
- Báez-Mendoza, R.; Schultz, W. The role of the striatum in social behavior. Front. Neurosci. 2013, 7, 233. [Google Scholar] [CrossRef] [PubMed] [Green Version]
- Savitt, J.M.; Dawson, V.L.; Dawson, T.M. Diagnosis and treatment of Parkinson disease: Molecules to medicine. J. Clin. Investig. 2006, 116, 1744–1754. [Google Scholar] [CrossRef] [Green Version]
- Yuvaraj, R.; Murugappan, M.; Acharya, U.R.; Adeli, H.; Ibrahim, N.M.; Mesquita, E. Brain functional connectivity patterns for emotional state classification in Parkinson’s disease patients without dementia. Behav. Brain Res. 2016, 298, 248–260. [Google Scholar] [CrossRef] [PubMed]
- Imbriani, P.; Schirinzi, T.; Meringolo, M.; Mercuri, N.B.; Pisani, A. Centrality of Early Synaptopathy in Parkinson’s Disease. Front. Neurol. 2018, 9. [Google Scholar] [CrossRef] [Green Version]
- Pagano, G.; Niccolini, F.; Politis, M. Imaging in Parkinson’s disease. Clin. Med. 2016, 16, 371–375. [Google Scholar] [CrossRef]
- Orozco, J.L.; Valderrama-Chaparro, J.A.; Pinilla-Monsalve, G.D.; Molina-Echeverry, M.I.; Pérez Castaño, A.M.; Ariza-Araújo, Y.; Prada, S.I.; Takeuchi, Y. Parkinson’s disease prevalence, age distribution and staging in Colombia. Neurol. Int. 2020, 12, 8401. [Google Scholar] [CrossRef]
- Miller, I.N.; Cronin-Golomb, A. Gender differences in Parkinson’s disease: Clinical characteristics and cognition. Mov. Disord. 2010, 25, 2695–2703. [Google Scholar] [CrossRef] [Green Version]
- Dick, F.D.; De Palma, G.; Ahmadi, A.; Scott, N.W.; Prescott, G.J.; Bennett, J.; Semple, S.; Dick, S.; Counsell, C.; Mozzoni, P.; et al. Environmental risk factors for Parkinson’s disease and parkinsonism: The Geoparkinson study. Occup. Environ. Med. 2007, 64, 666–672. [Google Scholar] [CrossRef] [Green Version]
- Dorsey, E.R.; Elbaz, A.; Nichols, E.; Abd-Allah, F.; Abdelalim, A.; Adsuar, J.C.; Ansha, M.G.; Brayne, C.; Choi, J.Y.J.; Collado-Mateo, D.; et al. Global, regional, and national burden of Parkinson’s disease, 1990–2016: A systematic analysis for the Global Burden of Disease Study 2016. Lancet Neurol. 2018, 17, 939–953. [Google Scholar] [CrossRef] [Green Version]
- GBD 2015 Neurological Disorders Collaborator Group. Global, regional, and national burden of neurological disorders during 1990–2015: A systematic analysis for the Global Burden of Disease Study 2015. Lancet Neurol. 2017, 16, 877–897. [Google Scholar] [CrossRef] [Green Version]
- Rizek, P.; Kumar, N.; Jog, M.S. An update on the diagnosis and treatment of Parkinson disease. CMAJ 2016, 188, 1157–1165. [Google Scholar] [CrossRef] [Green Version]
- Postuma, R.B.; Berg, D.; Stern, M.; Poewe, W.; Olanow, C.W.; Oertel, W.; Obeso, J.; Marek, K.; Litvan, I.; Lang, A.E.; et al. MDS clinical diagnostic criteria for Parkinson’s disease. Mov. Disord. 2015, 30, 1591–1601. [Google Scholar] [CrossRef] [PubMed]
- Beach, T.G.; Adler, C.H. Importance of low diagnostic Accuracy for early Parkinson’s disease. Mov. Disord. 2018, 33, 1551–1554. [Google Scholar] [CrossRef] [PubMed]
- Marsden, C.D. Parkinson’s disease. Lancet 1990, 335, 948–949. [Google Scholar] [CrossRef]
- Burton, A. How do we fix the shortage of neurologists? Lancet Neurol. 2018, 17, 502–503. [Google Scholar] [CrossRef] [Green Version]
- Han, C.-X.; Wang, J.; Yi, G.-S.; Che, Y.-Q. Investigation of EEG abnormalities in the early stage of Parkinson’s disease. Cogn. Neurodyn. 2013, 7, 351–359. [Google Scholar] [CrossRef]
- Bhurane, A.A.; Dhok, S.; Sharma, M.; Yuvaraj, R.; Murugappan, M.; Acharya, U.R. Diagnosis of Parkinson’s disease from electroencephalography signals using linear and self-similarity features. Expert Syst. 2019, e12472. [Google Scholar] [CrossRef]
- Soikkeli, R.; Partanen, J.; Soininen, H.; Pääkkönen, A.; Riekkinen, P. Slowing of EEG in Parkinson’s disease. Electroencephalogr. Clin. Neurophysiol. 1991, 79, 159–165. [Google Scholar] [CrossRef]
- Oh, S.L.; Hagiwara, Y.; Raghavendra, U.; Yuvaraj, R.; Arunkumar, N.; Murugappan, M.; Acharya, U.R. A deep learning approach for Parkinson’s disease diagnosis from EEG signals. Neural Comput. Appl. 2020, 32, 10927–10933. [Google Scholar] [CrossRef]
- Neufeld, M.Y.; Inzelberg, R.; Korczyn, A.D. EEG in demented and non-demented parkinsonian patients. Acta Neurol. Scand. 1988, 78, 1–5. [Google Scholar] [CrossRef] [PubMed]
- Neufeld, M.Y.; Blumen, S.; Aitkin, I.; Parmet, Y.; Korczyn, A.D. EEG frequency analysis in demented and nondemented parkinsonian patients. Dementia 1994, 5, 23–28. [Google Scholar] [CrossRef] [PubMed]
- Stoffers, D.; Bosboom, J.L.W.; Deijen, J.B.; Wolters, E.C.; Berendse, H.W.; Stam, C.J. Slowing of oscillatory brain activity is a stable characteristic of Parkinson’s disease without dementia. Brain 2007, 130, 1847–1860. [Google Scholar] [CrossRef] [PubMed]
- Gunduz, H. An efficient dimensionality reduction method using filter-based feature selection and variational autoencoders on Parkinson’s disease classification. Biomed. Signal Process. Control 2021, 66, 102452. [Google Scholar] [CrossRef]
- Khare, S.K.; Bajaj, V.; Acharya, U.R. PDCNNet: An automatic framework for the detection of Parkinson’s Disease using EEG signals. IEEE Sens. J. 2021, 1. [Google Scholar] [CrossRef]
- Khare, S.K.; Bajaj, V.; Acharya, U.R. Detection of Parkinson’s disease using automated tunable Q wavelet transform technique with EEG signals. Biocybern. Biomed. Eng. 2021, 41, 679–689. [Google Scholar] [CrossRef]
- de Oliveira, A.P.S.; de Santana, M.A.; Andrade, M.K.S.; Gomes, J.C.; Rodrigues, M.C.A.; dos Santos, W.P. Early diagnosis of Parkinson’s disease using EEG, machine learning and partial directed coherence. Res. Biomed. Eng. 2020, 36, 311–331. [Google Scholar] [CrossRef]
- Khoshnevis, S.A.; Sankar, R. Classification of the stages of Parkinson’s disease using novel higher-order statistical features of EEG signals. Neural Comput. Appl. 2020. [Google Scholar] [CrossRef]
- Anjum, M.F.; Dasgupta, S.; Mudumbai, R.; Singh, A.; Cavanagh, J.F.; Narayanan, N.S. Linear predictive coding distinguishes spectral EEG features of Parkinson’s disease. Parkinsonism Relat. Disord. 2020, 79, 79–85. [Google Scholar] [CrossRef]
- Liu, G.; Zhang, Y.; Hu, Z.; Du, X.; Wu, W.; Xu, C.; Wang, X.; Li, S. Complexity Analysis of Electroencephalogram Dynamics in Patients with Parkinson’s Disease. Parkinsons. Dis. 2017, 2017, 8701061. [Google Scholar] [CrossRef]
- Yuvaraj, R.; Acharya, U.R.; Hagiwara, Y. A novel Parkinson’s Disease Diagnosis Index using higher-order spectra features in EEG signals. Neural Comput. Appl. 2018, 30, 1225–1235. [Google Scholar] [CrossRef]
- Loh, H.W.; Ooi, C.P.; Vicnesh, J.; Oh, S.L.; Faust, O.; Gertych, A.; Acharya, U.R. Automated Detection of Sleep Stages Using Deep Learning Techniques: A Systematic Review of the Last Decade (2010–2020). Appl. Sci. 2020, 10, 8963. [Google Scholar] [CrossRef]
- Faust, O.; Hagiwara, Y.; Hong, T.J.; Lih, O.S.; Acharya, U.R. Deep learning for healthcare applications based on physiological signals: A review. Comput. Methods Programs Biomed. 2018, 161, 1–13. [Google Scholar] [CrossRef] [PubMed]
- Rockhill, A.P.; Jackson, N.; George, J.; Aron, A.; Swann, N.C. UC San Diego Resting State EEG Data from Patients with Parkinson’s Disease. OpenNeuro 2020. [Google Scholar] [CrossRef]
- George, J.S.; Strunk, J.; Mak-McCully, R.; Houser, M.; Poizner, H.; Aron, A.R. Dopaminergic therapy in Parkinson’s disease decreases cortical beta band coherence in the resting state and increases cortical beta band power during executive control. NeuroImage Clin. 2013, 3, 261–270. [Google Scholar] [CrossRef] [PubMed] [Green Version]
- Swann, N.C.; de Hemptinne, C.; Aron, A.R.; Ostrem, J.L.; Knight, R.T.; Starr, P.A. Elevated synchrony in Parkinson disease detected with electroencephalography. Ann. Neurol. 2015, 78, 742–750. [Google Scholar] [CrossRef] [Green Version]
- Jackson, N.; Cole, S.R.; Voytek, B.; Swann, N.C. Characteristics of Waveform Shape in Parkinson’s Disease Detected with Scalp Electroencephalography. Eneuro 2019, 6. [Google Scholar] [CrossRef] [Green Version]
- Appelhoff, S.; Sanderson, M.; Brooks, T.L.; van Vliet, M.; Quentin, R.; Holdgraf, C.; Chaumon, M.; Mikulan, E.; Tavabi, K.; Höchenberger, R.; et al. MNE-BIDS: Organizing electrophysiological data into the BIDS format and facilitating their analysis. J. Open Source Softw. 1896, 4, 1896. [Google Scholar] [CrossRef] [Green Version]
- Pernet, C.R.; Appelhoff, S.; Gorgolewski, K.J.; Flandin, G.; Phillips, C.; Delorme, A.; Oostenveld, R. EEG-BIDS, an extension to the brain imaging data structure for electroencephalography. Sci. Data 2019, 6, 103. [Google Scholar] [CrossRef] [Green Version]
- Christensen, O.; Feichtinger, H.G.; Paukner, S. Gabor Analysis for Imaging. In Handbook of Mathematical Methods in Imaging; Scherzer, O., Ed.; Springer: New York, NY, USA, 2015; pp. 1717–1757. [Google Scholar] [CrossRef] [Green Version]
- Brunton, S.L.; Kutz, J.N. Data-Driven Science and Engineering; Cambridge University Press: Cambridge, UK, 2019. [Google Scholar] [CrossRef] [Green Version]
- Krizhevsky, A.; Sutskever, I.; Hinton, G.E. ImageNet classification with deep convolutional neural networks. Commun. ACM 2017, 60, 84–90. [Google Scholar] [CrossRef]
- Yildirim, O.; Baloglu, U.B.; Acharya, U.R. A Deep Learning Model for Automated Sleep Stages Classification Using PSG Signals. Int. J. Environ. Res. Public Health 2019, 16, 599. [Google Scholar] [CrossRef] [Green Version]
- Albawi, S.; Mohammed, T.A.; Al-Zawi, S. Understanding of a convolutional neural network. In Proceedings of the 2017 International Conference on Engineering and Technology (ICET), Antalya, Turkey, 21–23 August 2017; pp. 1–6. [Google Scholar] [CrossRef]
- Hafemann, L.G.; Sabourin, R.; Oliveira, L.S. Learning features for offline handwritten signature verification using deep convolutional neural networks. Pattern Recognit. 2017, 70, 163–176. [Google Scholar] [CrossRef] [Green Version]
- Latreille, V.; Carrier, J.; Gaudet-Fex, B.; Rodrigues-Brazete, J.; Panisset, M.; Chouinard, S.; Postuma, R.B.; Gagnon, J.F. Electroencephalographic prodromal markers of dementia across conscious states in Parkinson’s disease. Brain 2016, 139, 1189–1199. [Google Scholar] [CrossRef] [Green Version]
- Amato, N.; Caverzasio, S.; Galati, S. Clinical implication of high-density EEG sleep recordings in Parkinson’s disease. J. Neurosci. Methods 2020, 340, 108746. [Google Scholar] [CrossRef] [PubMed]
- Högl, B.; Stefani, A.; Videnovic, A. Idiopathic REM sleep behaviour disorder and neurodegeneration—An update. Nat. Rev. Neurol. 2018, 14, 40–55. [Google Scholar] [CrossRef]
- Al-Qassabi, A.; Fereshtehnejad, S.-M.; Postuma, R.B. Sleep Disturbances in the Prodromal Stage of Parkinson Disease. Curr. Treat. Options Neurol. 2017, 19, 22. [Google Scholar] [CrossRef] [PubMed]
- Sakar, B.E.; Isenkul, M.E.; Sakar, C.O.; Sertbas, A.; Gurgen, F.; Delil, S.; Apaydin, H.; Kursun, O. Collection and Analysis of a Parkinson Speech Dataset with Multiple Types of Sound Recordings. IEEE J. Biomed. Health Inform. 2013, 17, 828–834. [Google Scholar] [CrossRef] [PubMed]
- Pereira, C.R.; Pereira, D.R.; Da Silva, F.A.; Hook, C.; Weber, S.A.; Pereira, L.A.; Papa, J.P. A Step towards the Automated Diagnosis of Parkinson’s Disease: Analyzing Handwriting Movements. In Proceedings of the 2015 IEEE 28th International Symposium on Computer-Based Medical Systems, São Carlos and Ribeirão Preto, Brazil, 22–25 June 2015; pp. 171–176. [Google Scholar] [CrossRef]
- Tuncer, T.; Dogan, S.; Acharya, U.R. Automated detection of Parkinson’s disease using minimum average maximum tree and singular value decomposition method with vowels. Biocybern. Biomed. Eng. 2020, 40, 211–220. [Google Scholar] [CrossRef]
- di Biase, L.; Di Santo, A.; Caminiti, M.L.; De Liso, A.; Shah, S.A.; Ricci, L.; Di Lazzaro, V. Gait Analysis in Parkinson’s Disease: An Overview of the Most Accurate Markers for Diagnosis and Symptoms Monitoring. Sensors 2020, 20, 3529. [Google Scholar] [CrossRef] [PubMed]
- Caramia, C.; Torricelli, D.; Schmid, M.; Munoz-Gonzalez, A.; Gonzalez-Vargas, J.; Grandas, F.; Pons, J.L. IMU-Based Classification of Parkinson’s Disease From Gait: A Sensitivity Analysis on Sensor Location and Feature Selection. IEEE J. Biomed. Health Inform. 2018, 22, 1765–1774. [Google Scholar] [CrossRef] [PubMed]


| Author | Input Feature | Approach | Dataset | Accuracy (%) |
|---|---|---|---|---|
| Gunduz [27] 2021 | Deep relief features | SVM | - | 91.60 |
| Khare et al. [28] 2021 | Time–frequency representation (TFR) | CNN | 16—Healthy 15—PD | 100.00 |
| Khare et al. [29] 2021 | Multiple EEG subbands | Least-squares SVM | 16—Healthy 15—PD | 97.65 |
| de Oliveira et al. [30] 2020 | Partial directed coherence | Random forest | 12—Healthy 35—PD | 99.22 |
| Khoshnevis et al. [31] 2020 | High-order statistical feature of EEG | RUS Boosted trees ensemble | 20—Healthy 20—PD | 87.00 |
| Anjum et al. [32] 2020 | Power spectra density | Linear-predictive-coding EEG Algorithm for PD (LEAPD) | 27—Healthy 27—PD | 93.30 |
| Oh et al. [23] 2020 | End-to-end | 13-layer 1D-CNN | 20—Healthy 20—PD | 88.25 |
| Bhurane et al. [21] 2019 | linear and self-similarity features | SVM | 20—Healthy 20—PD | 99.10 |
| Liu et al. [33] 2017 | Discrete wavelet transform (DWT) | Three-way decision model (O_CCA) | 25—healthy 17—PD | 92.86 |
| Yuvaraj et al. [34] 2016 | High-order spectra | SVM | 20—Healthy 20—PD | 99.62 |
| Healthy Controls (n = 16) | PD Patients (n = 15) | |
|---|---|---|
| No. of males | 7 | 7 |
| No. of females | 9 | 8 |
| Age | 63.5 ± 9.6 | 63.2 ± 8.2 |
| NAART | 49.1 ± 7.1 | 46 ± 6.3 |
| MMSE | 29.2 ± 1.1 | 28.4 ± 1.0 |
| UPDRS III | ||
| Without medication | - | 45.5 ± 13.0 |
| With medication | - | 33.7 ± 10.9 |
| Healthy Control | PD with Medicine | PD without Medicine | |
|---|---|---|---|
| Subject No. | 16 | 15 | 15 |
| No. of channels | 32 | 32 | 32 |
| No. of EEG recordings (Subject no. X no. of channels) | 512 | 480 | 480 |
| No. of Spectrograms (1 EEG recording = 2 spectrograms) | 1024 | 960 | 960 |
| No. | Layer | Filter No. | Kernel Size | Unit Size | Parameter | Output Shape |
|---|---|---|---|---|---|---|
| 1 | 2Dconv1 | 16 | 5 × 5 | - | ReLu, constraint = 3 | 217 × 334 |
| 2 | Dropout | - | - | Rate = 0.2 | 217 × 334 | |
| 3 | 2Dconv2 | 32 | 3 × 3 | - | ReLu, constraint = 3 | 217 × 334 |
| 4 | MaxPool | - | - | - | - | 108 × 167 |
| 5 | Flatten | - | - | - | - | 1 × 577,152 |
| 6 | Dense | - | - | 512 | ReLu, constraint = 3 | 1 × 512 |
| 7 | Dropout | - | - | - | Rate = 0.7 | 1 × 512 |
| 8 | Dense | - | - | 3/1 | Softmax/sigmoid | 1 × 3/1 × 1 |
| Experiment No. | Accuracy (%) | Precision (%) | Sensitivity (%) | F1 Score (%) | ROC–AUC |
|---|---|---|---|---|---|
| 1 | 99.46 ± 0.73 | 99.48 ± 0.01 | 99.46 ± 0.01 | 99.46 ± 0.01 | - |
| 2 | 99.44 ± 1.02 | 99.79 ± 0.43 | 99.06 ± 1.83 | 99.42 ± 1.08 | 1.000 |
| 3 | 98.84 ± 1.59 | 98.99 ± 1.76 | 98.65 ± 2.84 | 98.79 ± 1.69 | 0.999 |
| 4 | 92.60 ± 6.05 | 88.37 ± 9.10 | 99.58 ± 0.51 | 93.38 ± 5.15 | 0.997 |
| Classes | Precision (%) | Sensitivity (%) | F1 Score (%) | Samples |
|---|---|---|---|---|
| Healthy | 99.52 ± 0.01 | 99.22 ± 0.02 | 99.36 ± 0.01 | 1024 |
| PD w/o drugs | 99.90 ± 0.00 | 99.17 ± 0.01 | 99.53 ± 0.01 | 960 |
| PD w/drugs | 99.01 ± 0.02 | 100.00 ± 0.00 | 99.49 ± 0.01 | 960 |
| Author | Input Feature | Approach | No. Of Classes | Classification | Accuracy (%) |
|---|---|---|---|---|---|
| Khare et al. [28] 2021 | Smoothed pseudo-Wigner Ville distribution | CNN | 2 | HC vs. PD | 99.97 |
| HC vs. PD w/o Med | 99.84 | ||||
| HC vs. PD w/Med | 100.00 | ||||
| Khare et al. [29] 2021 | Multiple subbands of EEG | Least square SVM | 2 | HC vs. PD w/o Med | 96.13 |
| HC vs. PD w/Med | 97.65 | ||||
| This work | Gabor transform (spectrograms) | CNN | 3 | HC vs. PD w/o med vs. PD w/med | 99.46 |
| 2 | HC vs. PD w/o Med | 99.44 | |||
| HC vs. PD w/Med | 98.84 | ||||
| PD w/o Med vs. PD w/Med | 92.60 |
Publisher’s Note: MDPI stays neutral with regard to jurisdictional claims in published maps and institutional affiliations. |
© 2021 by the authors. Licensee MDPI, Basel, Switzerland. This article is an open access article distributed under the terms and conditions of the Creative Commons Attribution (CC BY) license (https://creativecommons.org/licenses/by/4.0/).
Share and Cite
Loh, H.W.; Ooi, C.P.; Palmer, E.; Barua, P.D.; Dogan, S.; Tuncer, T.; Baygin, M.; Acharya, U.R. GaborPDNet: Gabor Transformation and Deep Neural Network for Parkinson’s Disease Detection Using EEG Signals. Electronics 2021, 10, 1740. https://doi.org/10.3390/electronics10141740
Loh HW, Ooi CP, Palmer E, Barua PD, Dogan S, Tuncer T, Baygin M, Acharya UR. GaborPDNet: Gabor Transformation and Deep Neural Network for Parkinson’s Disease Detection Using EEG Signals. Electronics. 2021; 10(14):1740. https://doi.org/10.3390/electronics10141740
Chicago/Turabian StyleLoh, Hui Wen, Chui Ping Ooi, Elizabeth Palmer, Prabal Datta Barua, Sengul Dogan, Turker Tuncer, Mehmet Baygin, and U. Rajendra Acharya. 2021. "GaborPDNet: Gabor Transformation and Deep Neural Network for Parkinson’s Disease Detection Using EEG Signals" Electronics 10, no. 14: 1740. https://doi.org/10.3390/electronics10141740
APA StyleLoh, H. W., Ooi, C. P., Palmer, E., Barua, P. D., Dogan, S., Tuncer, T., Baygin, M., & Acharya, U. R. (2021). GaborPDNet: Gabor Transformation and Deep Neural Network for Parkinson’s Disease Detection Using EEG Signals. Electronics, 10(14), 1740. https://doi.org/10.3390/electronics10141740