Article

Low Complexity Lane Detection Methods for Light Photometry System

Division of Signal Processing and Electronic Systems, Institute of Automation and Robotics, Poznan University of Technology, Jana Pawła II 24, 60-965 Poznań, Poland
*
Author to whom correspondence should be addressed.
Electronics 2021, 10(14), 1665; https://doi.org/10.3390/electronics10141665
Submission received: 16 June 2021 / Revised: 7 July 2021 / Accepted: 11 July 2021 / Published: 13 July 2021
(This article belongs to the Section Computer Science & Engineering)

Abstract

:
The aim of the paper was to analyze effective solutions for accurate lane detection on the roads. We focused on effective detection of airport runways and taxiways in order to drive a light-measurement trailer correctly. Three techniques for video-based line extracting were used for specific detection of environment conditions: (i) line detection using edge detection, Scharr mask and Hough transform, (ii) finding the optimal path using the hyperbola fitting line detection algorithm based on edge detection and (iii) detection of horizontal markings using image segmentation in the HSV color space. The developed solutions were tuned and tested with the use of embedded devices such as Raspberry Pi 4B or NVIDIA Jetson Nano.

1. Introduction

The task of detecting lines and lanes was mainly developed in the field of ADAS (advanced driver assistance systems). In the beginning, ADAS were passive, but with new tools, these systems allow for more advanced tasks, i.e., active assistance. The subject of line detection is still valid in scientific papers [1,2]. Many algorithms and techniques are available. However, they may not be effective under specific conditions; for example, in the detection of airport runway lines that require precise driving of measurement equipment, such as mobile measurement trailers for checking the correctness of light intensity of airport lamps [3,4].
Steadily growing requirements of aviation agencies regarding flight safety have for several years been determining more and more precise control of lighting located on various airport areas, especially on runways and taxiways [5]. A medium-sized airport has about 200 central axis lamps in white and red and about 180 touchdown zone lamps. However, there are many more light points on taxiways. Importantly, each lamp must meet the standards specified in the documents on the basis of which permits for the ongoing operation of the airport are issued. For example, according to the guidelines of the European Union Aviation Safety Agency (EASA), the airports must meet certain standards depending on the navigational aids used, supporting precise air operations (ILS—Instrument Landing System) [5].
Typical airport lamps are equipped with halogen bulbs, which have a limited lifetime [6]. Moreover, a possible decrease in the luminous efficiency of these lamps is caused by contamination of the prisms (e.g., by sticking, powdered rubber from aircraft tires). Nowadays, airports are forced by demanding safety rules to gradually upgrade lighting systems to ones based on LED light sources. Light emitted with such bulbs has different characteristics than halogen ones [7], and this causes a need to prepare a measuring system that can be adapted to work with different light sources.
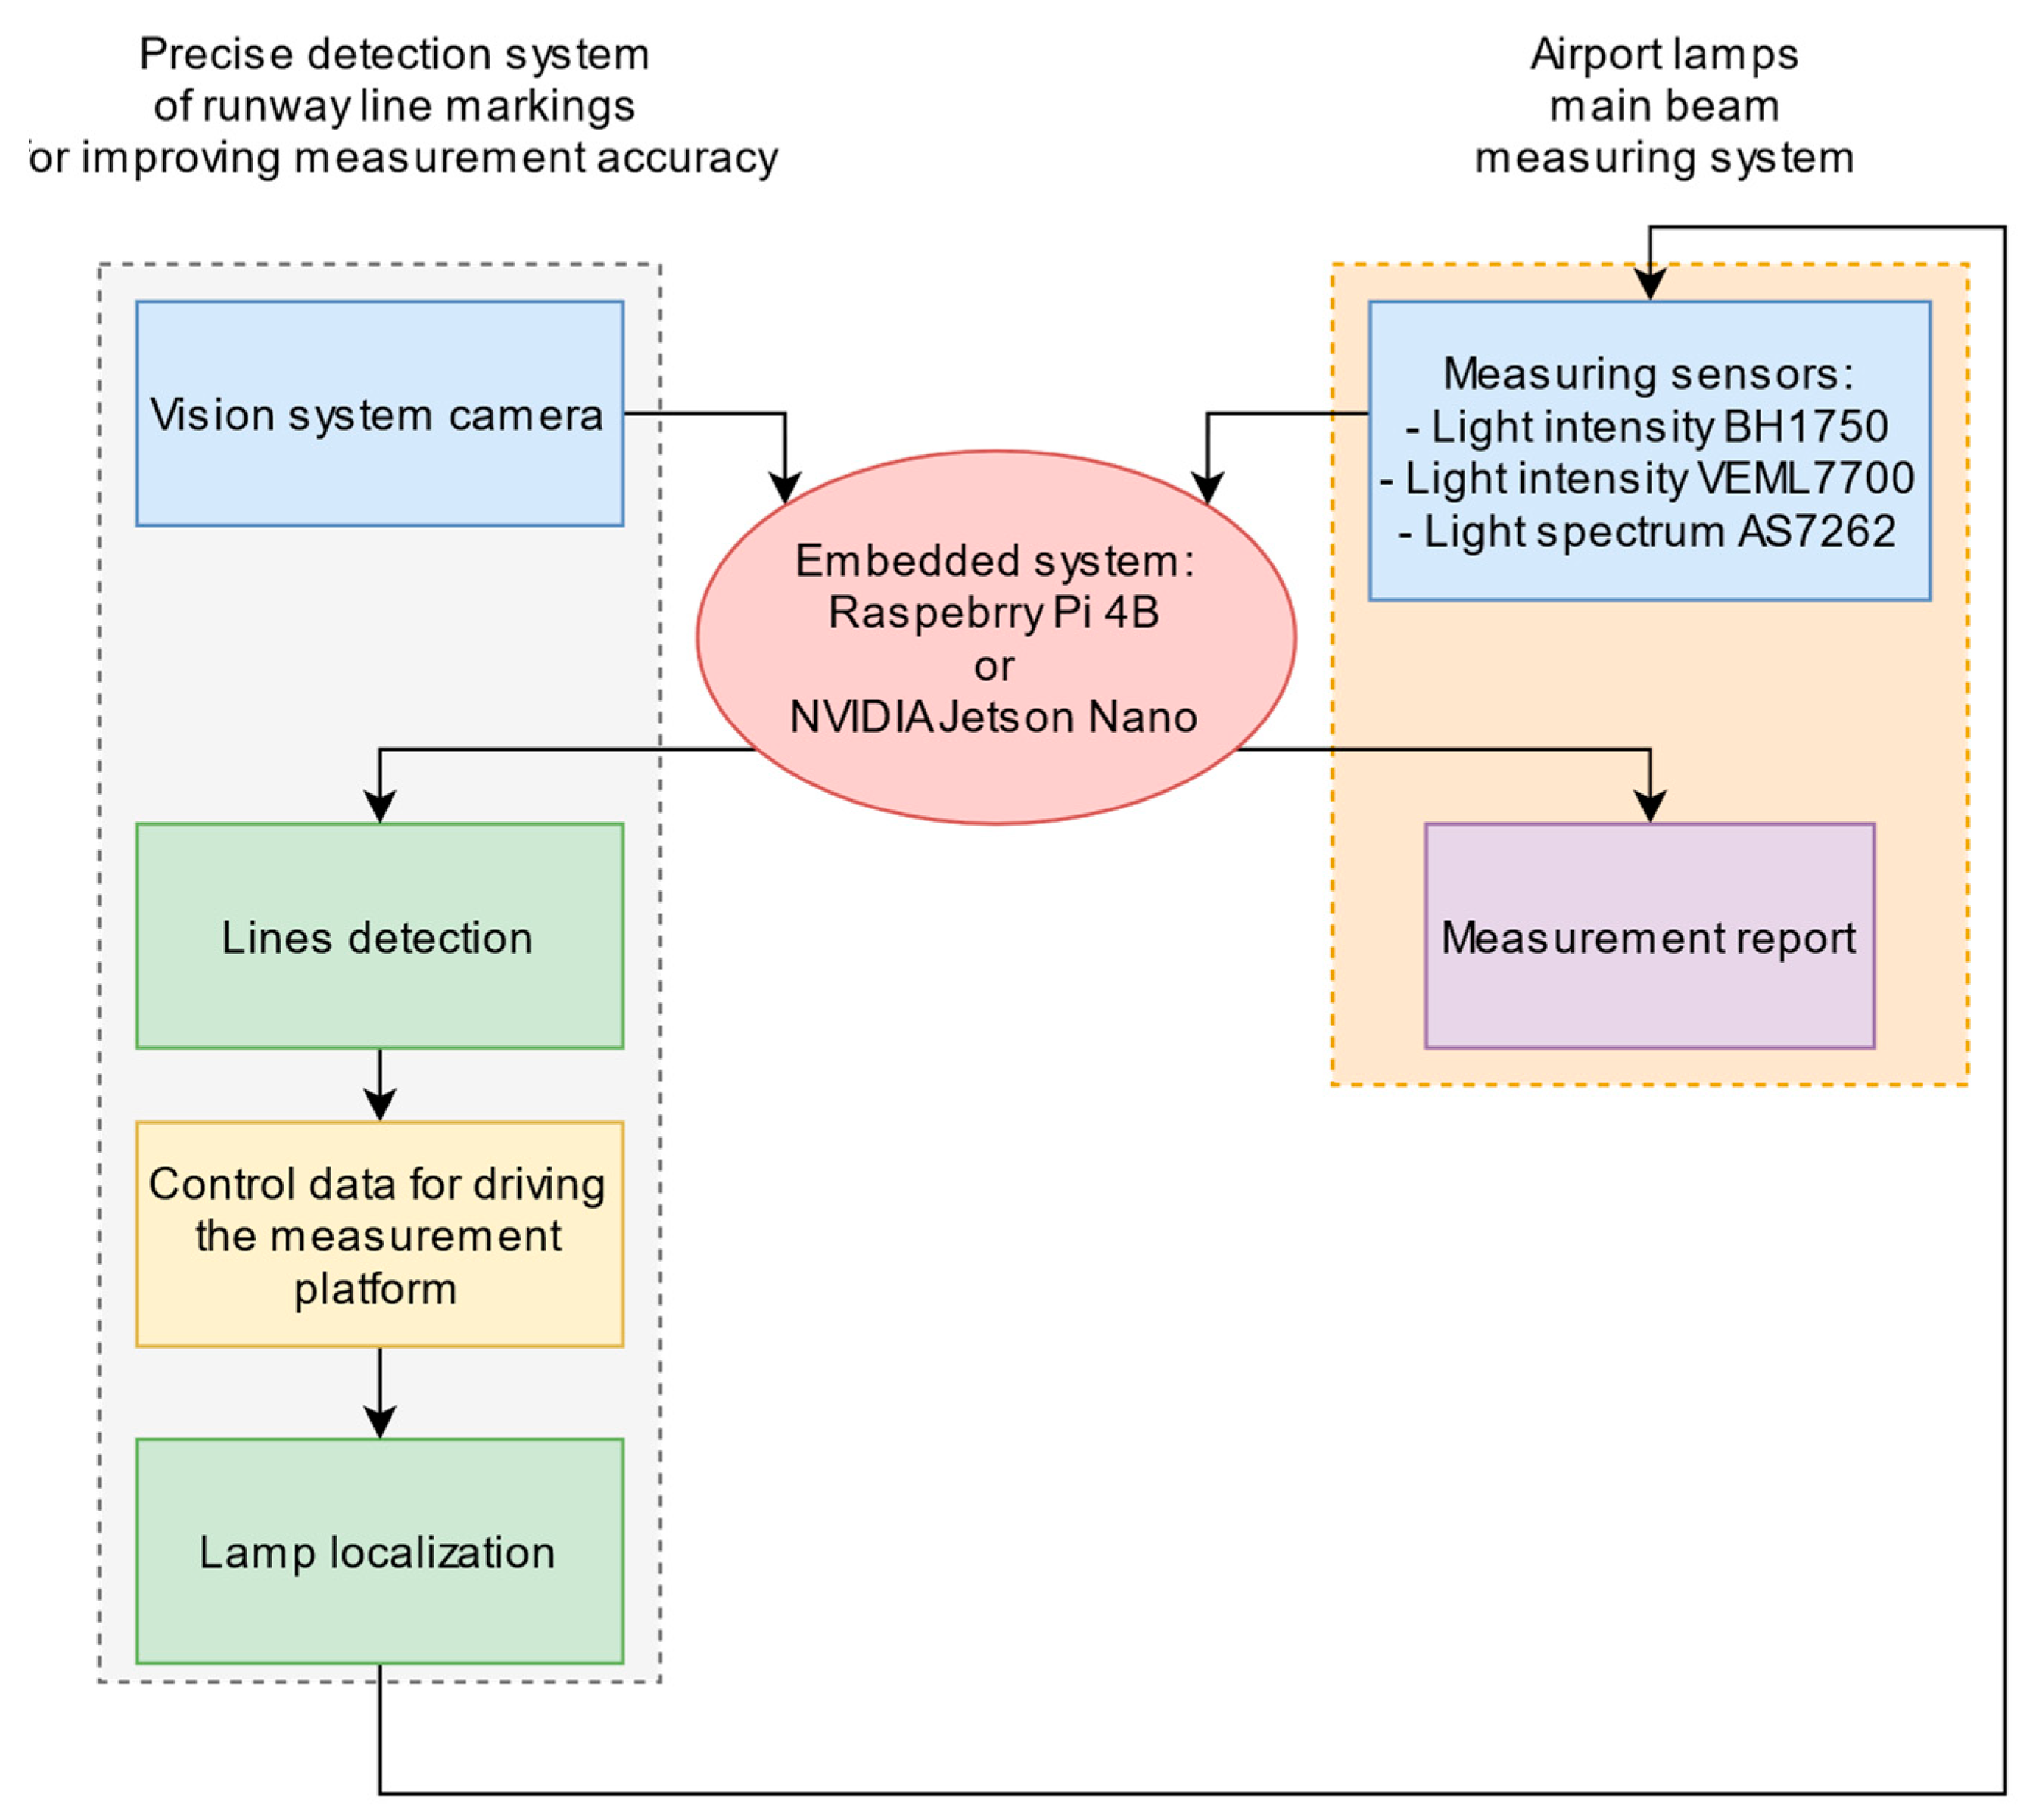
In order to analyze the possible applications of vision inspections in the measurement platform for testing the quality of operation of the airport lamps, it is necessary to divide the system into areas of activity in which the use of various types of cameras may be desirable. Figure 1 shows a block diagram of the proposed solution that could help the driver/operator to immediately analyze the measurements parameters.
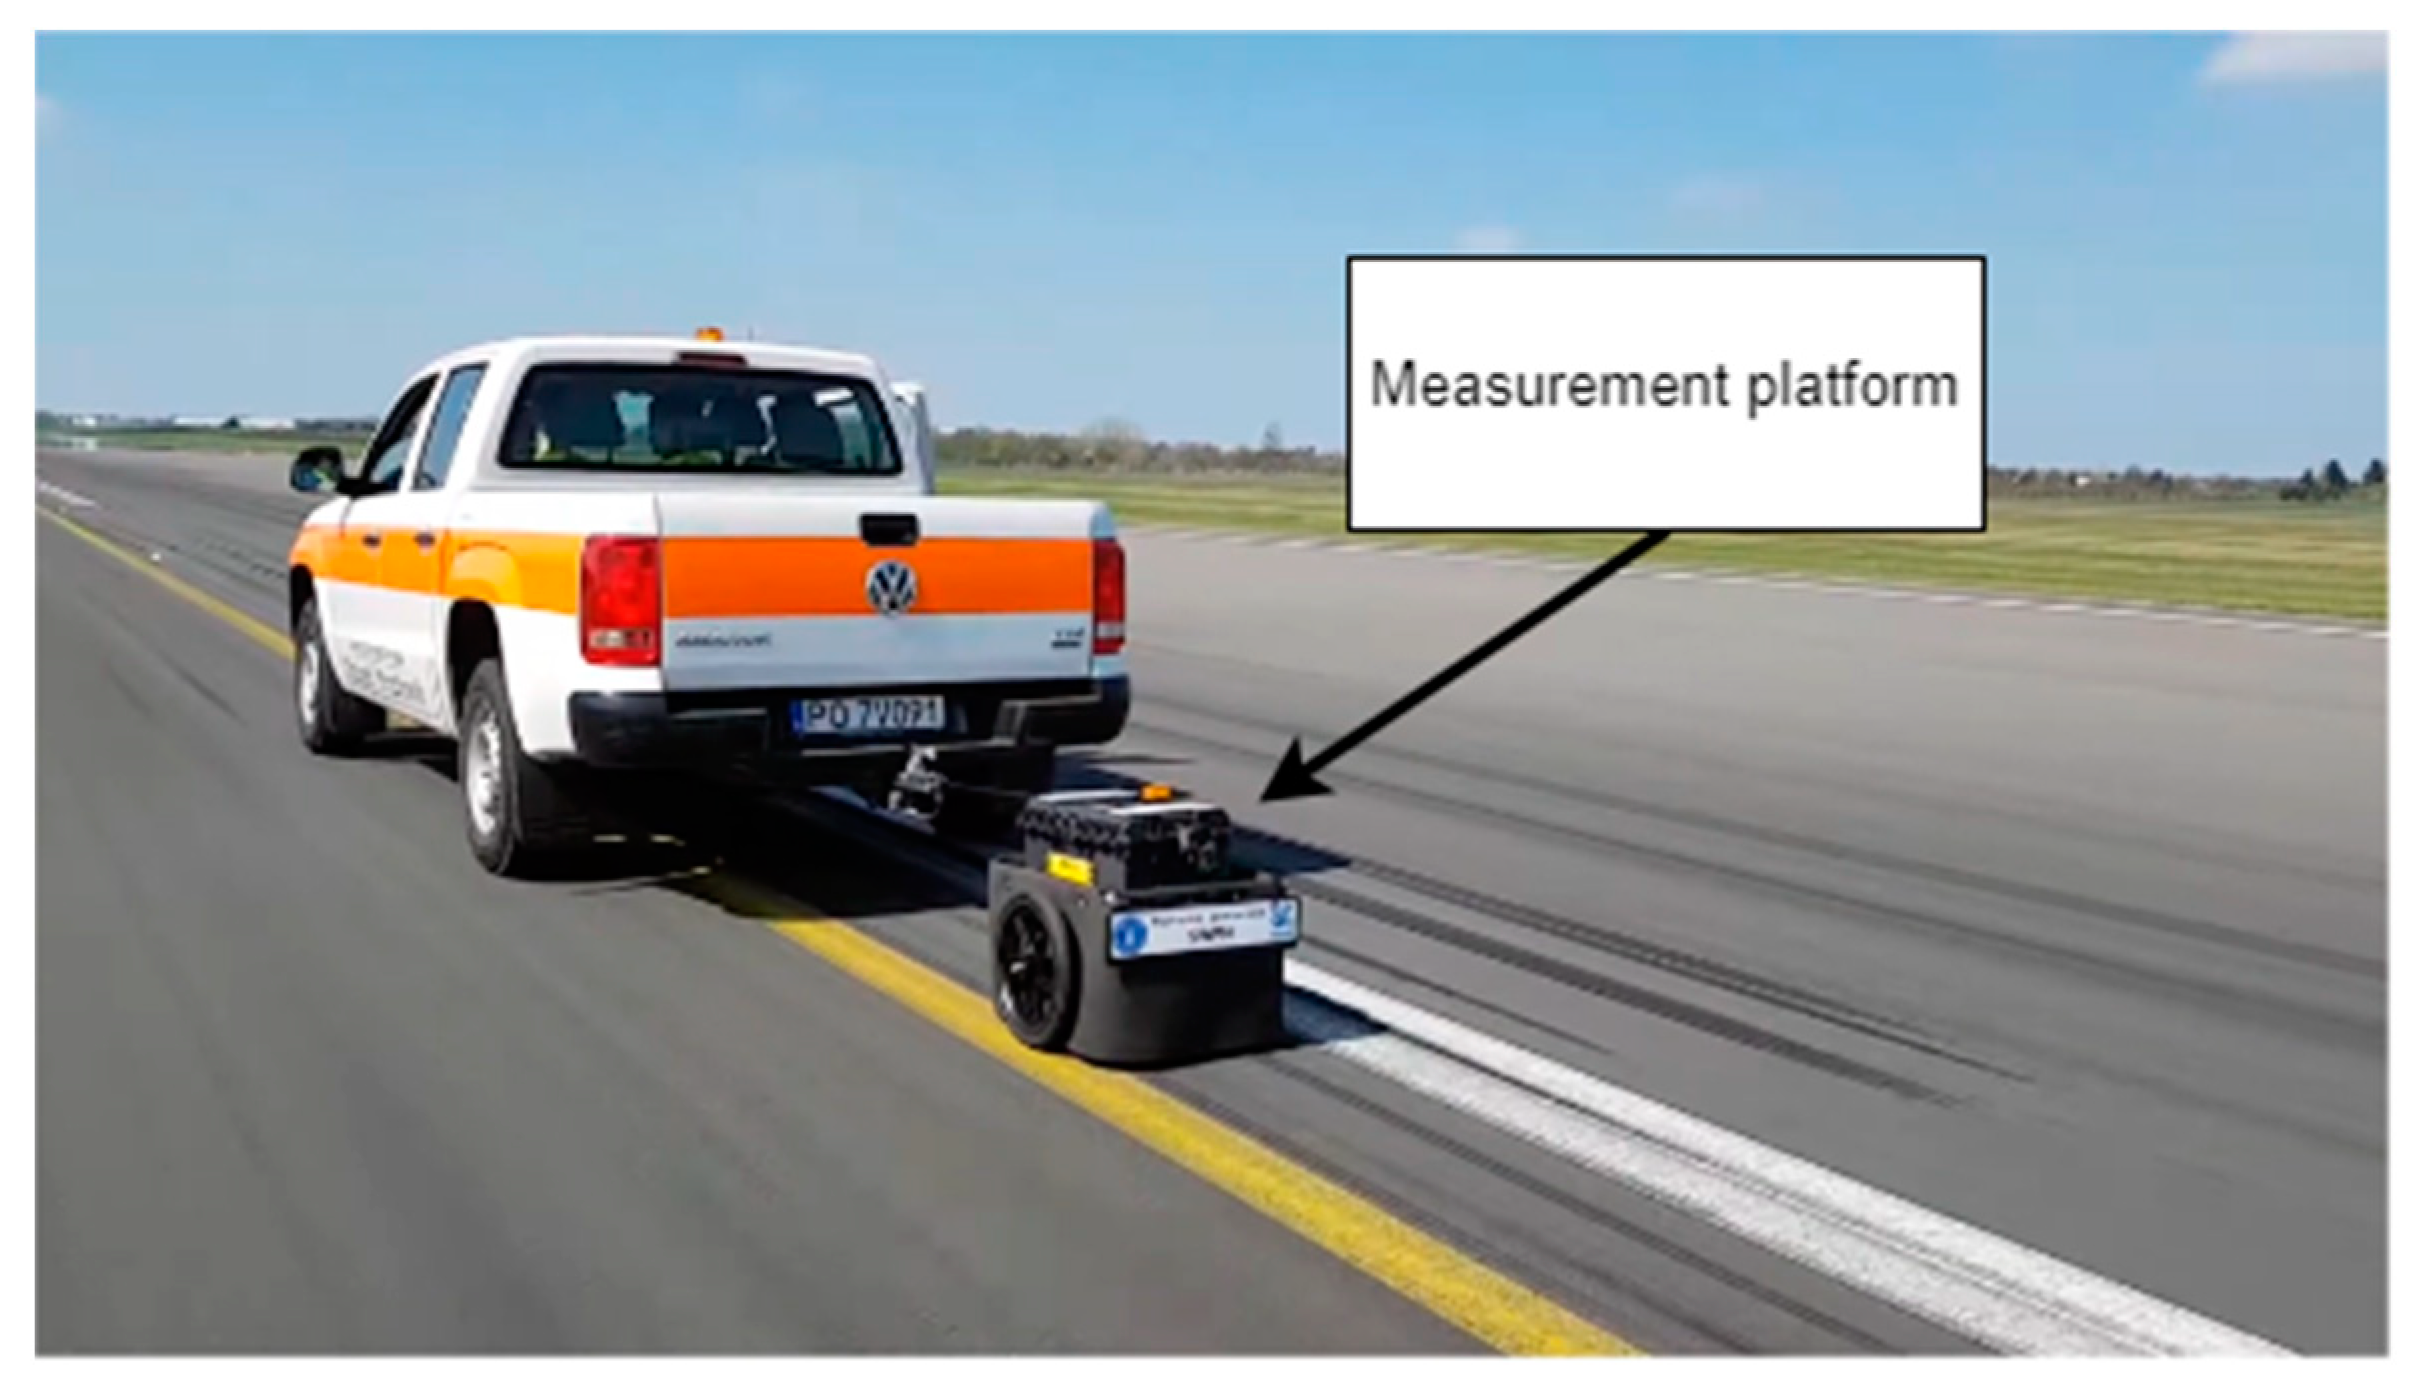
Various mobile systems for measuring the technical condition of airport lamps have been researched [8,9]. An exemplary solution built by the authors of this article is presented in Figure 2 [3,
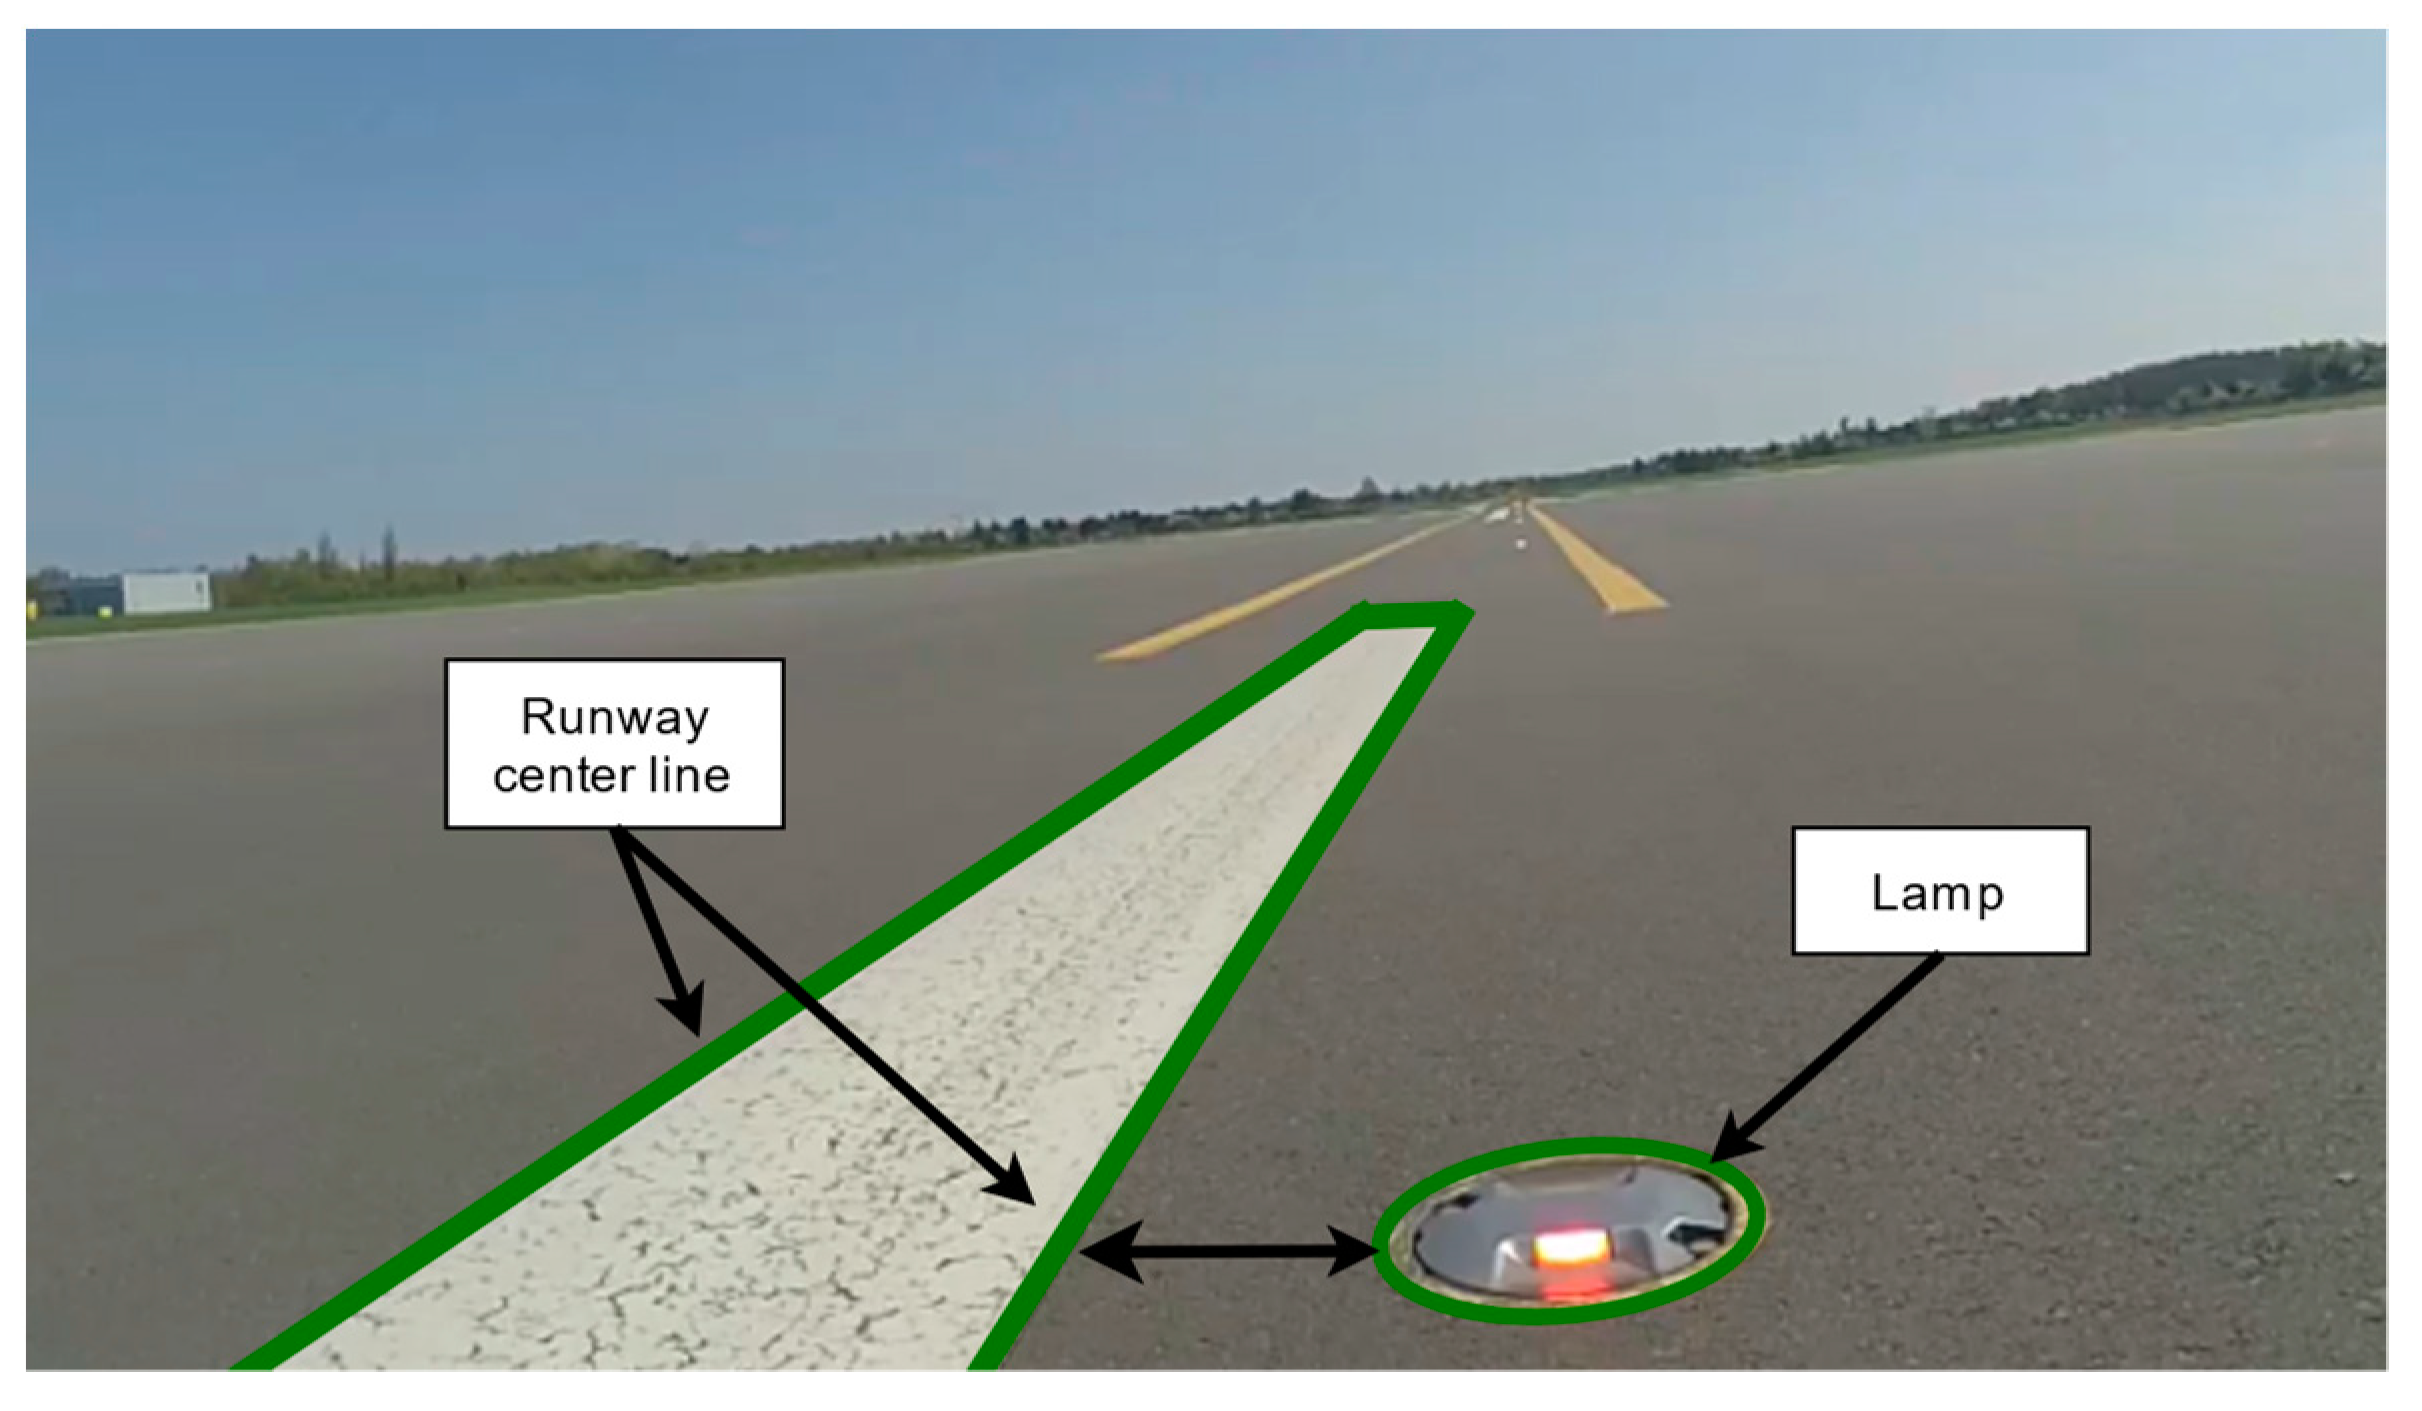
4]. Such systems require precise driving of the measuring device onto the tested lamp. It is quite important because very often, incorrect hovering on the lamp or its omission misclassifies the obtained results, which increases the time and cost of the inspection process. For an illustration of this problem, Figure 3 shows the view from the platform for testing the quality of operation of the airport lamps during the lighting control. The location of the lamp over such a large area, without reference points in the form of the runway edge or other characteristic objects, is possible only based on the detection of center lines.
The differences in the luminous intensity values of the new and used lamps range from several hundred to several thousand lux, depending on the color of the emitted light and the distance from the source. The same differences may arise in the event of an incorrect drive-on and poor test execution, even with a new lamp that in the results could be classified as worn. Technical documentation describing the airport design process contains strictly defined luminous intensity standards expressed in candelas. This unit is treated as a standard to which the obtained results should be compared, each time converting readings from the sensors used. 
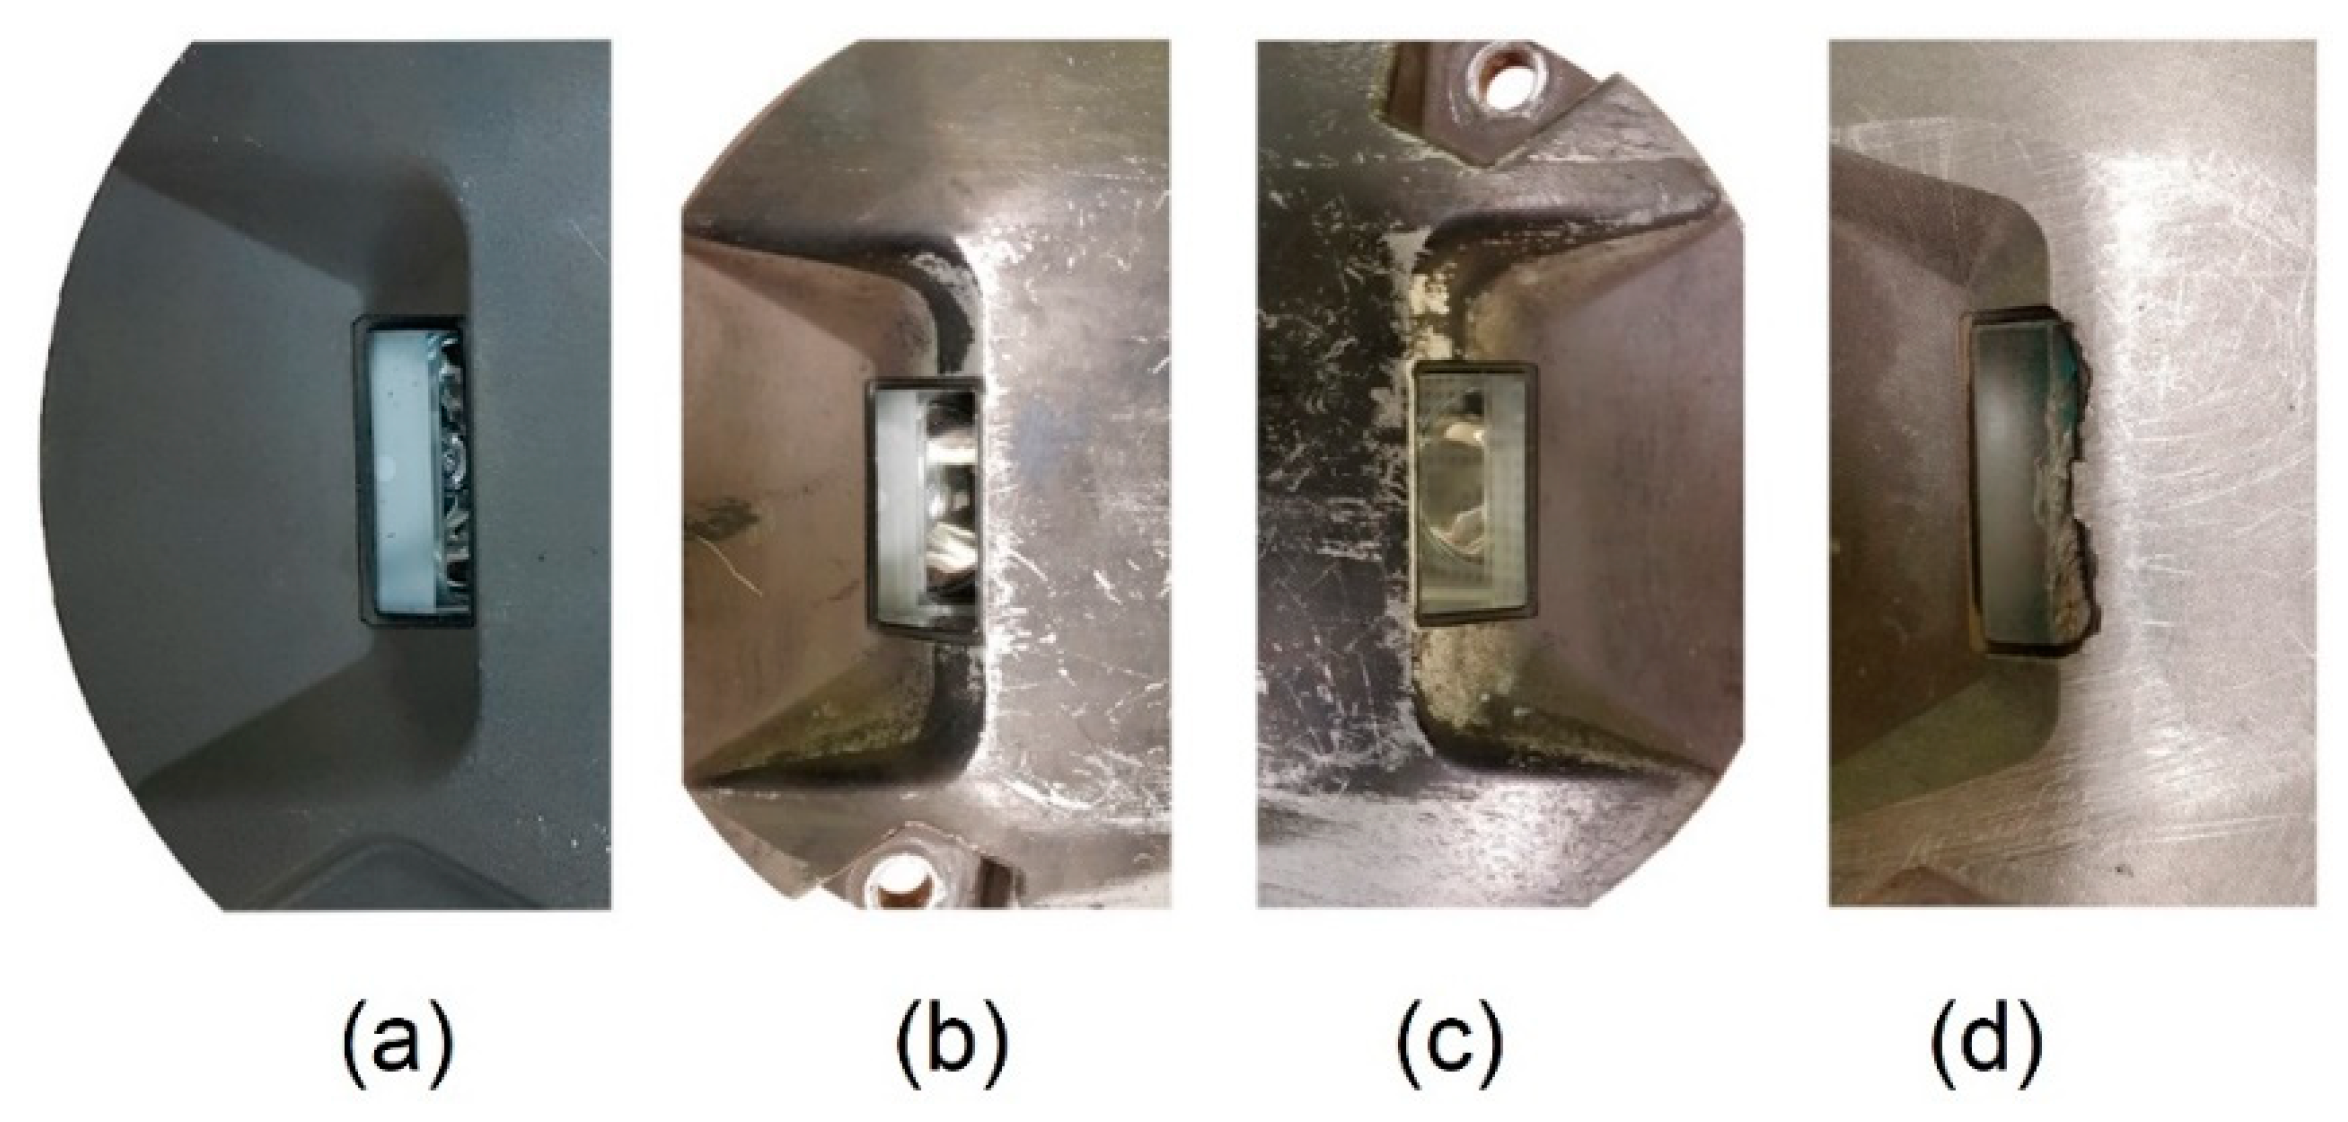
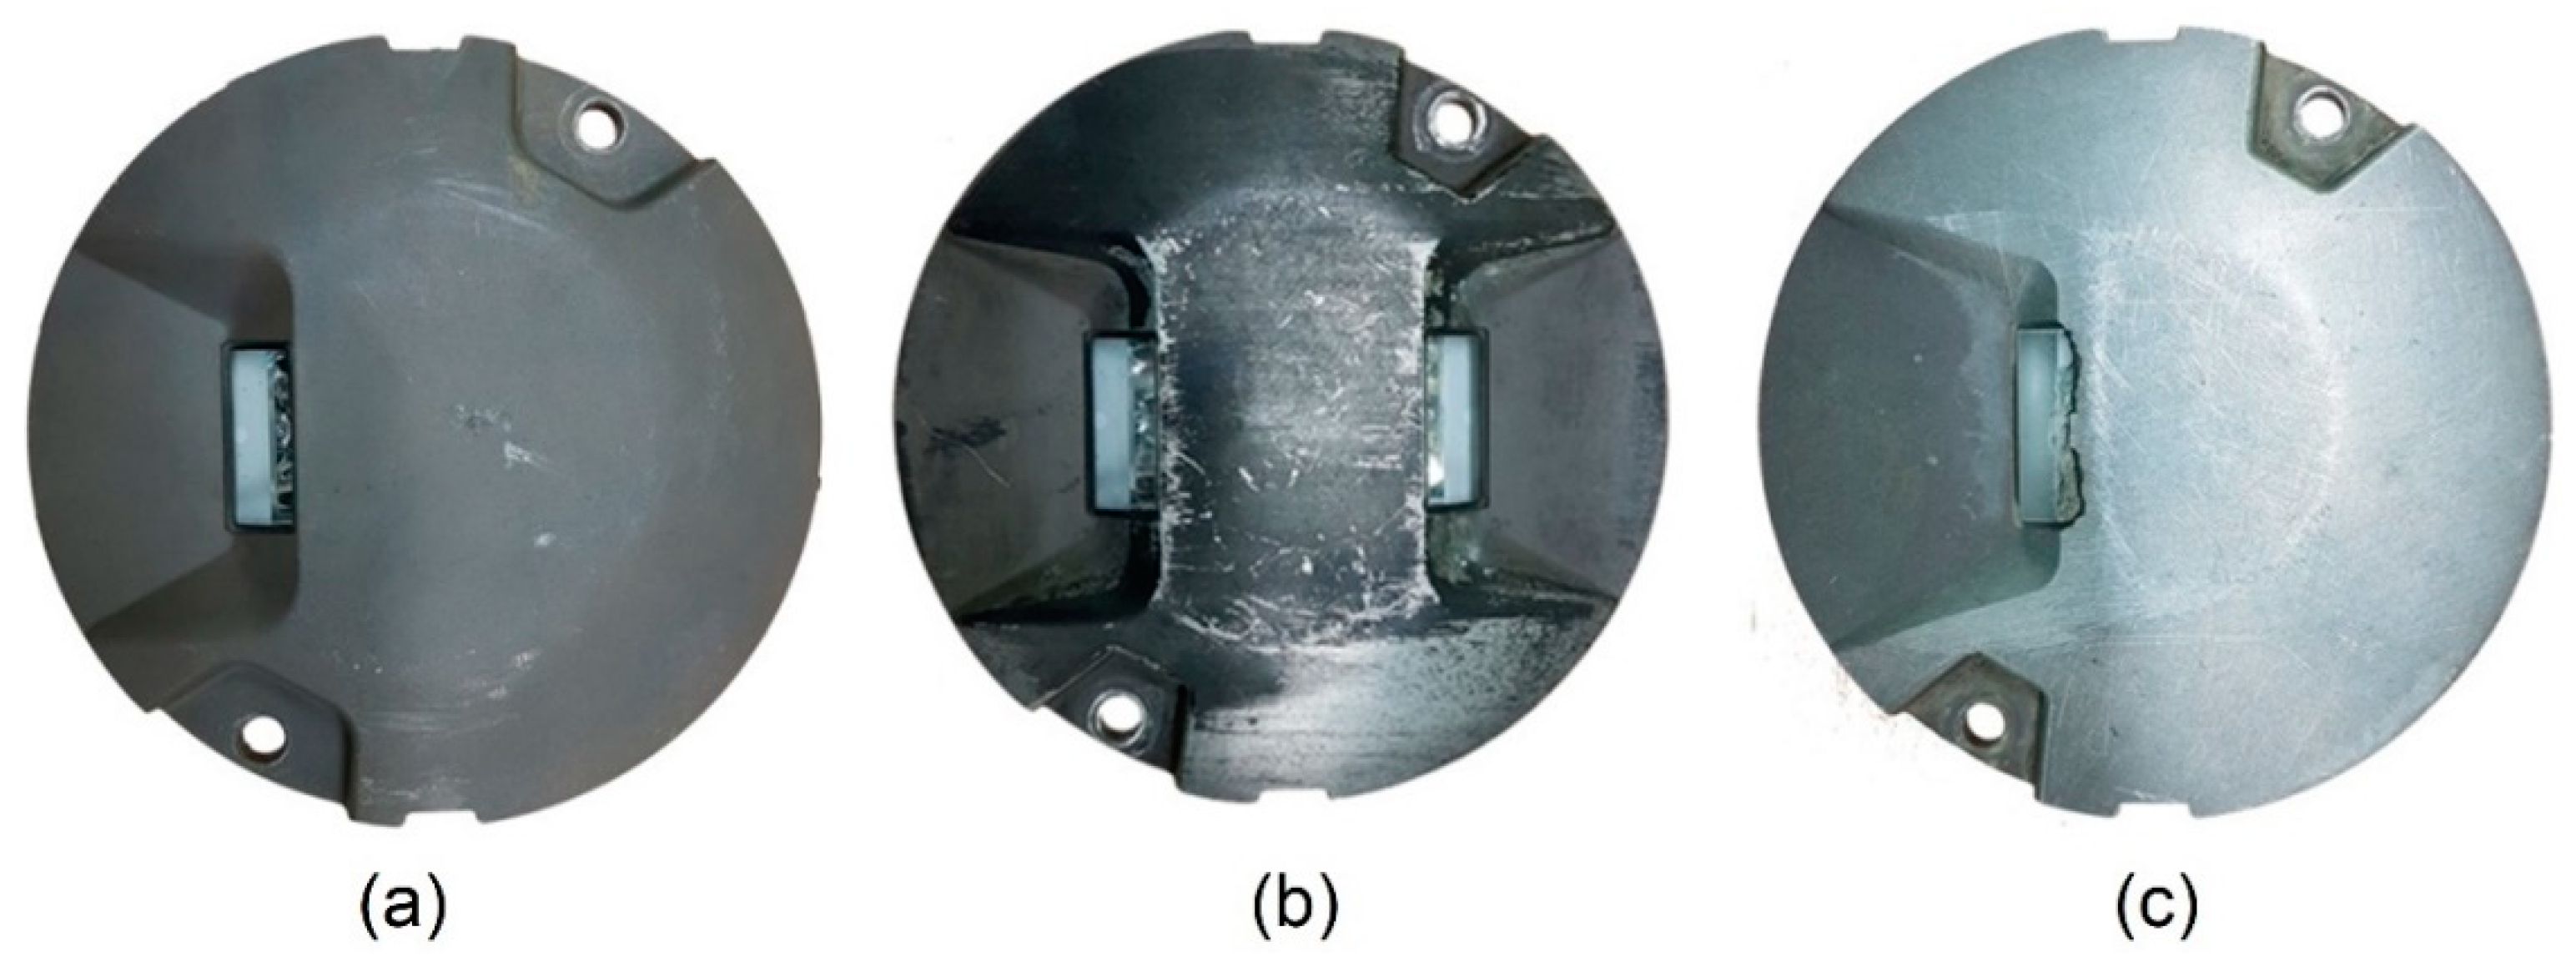
Figure 4a shows a brand-new lamp, which, together with its prism (Figure 5a), serves as a reference point for comparing the state of wear of other lamps already used at the airport. The wear of the housing (Figure 4b) itself is not the same as the wear or damage of the prisms (Figure 5b,c). Significant scratches on the upper surface of the housing do not have the slightest effect on the correct operation of the lamp. Its prisms are practically in the same condition as those in the new lamp. At first glance, the lamp shown in Figure 4c is not badly damaged. However, a closer look shows the damage to the metal edge near the top of the prism that occurred during the lamp operation. Such dents resulted in the lack of adequate protection of the prism glass (Figure 5d), which, being scratched, chipped, and dull, classifies the lamp for replacement.
A very important element during the test is the feedback provided to the driver/operator, from which she/he can learn what needs to be done to maintain the appropriate angle and trajectory over the lamps during the test. In the case of maneuvers on such large areas as the runway, without significant reference points and in the absence of a continuous center line, this is an unmissable difficulty. During the tests at the airport, it turned out to be a very time-consuming task, during which one person had to follow the platform and keep the driver informed about the necessary maneuvers. It was particularly difficult to carry out tests of lamps on runway exits, where the lamps are located at different angles.
Therefore, this article focuses on the analysis of the driving trajectory based on the detection and prediction of the occurrence of runway centerlines and taxiways, but also on the analysis of lamps and an attempt to estimate their wear using a vision system. Thanks to the analysis of the central lines, the algorithm will in the future be able to estimate the probable occurrence of the lamp and properly instruct the operator to choose the optimal path. When building the platform, the authors focused on the universality of the system and the availability of the device. In these studies, sport cameras were used, which are good at stabilizing the image and obtaining acceptable quality images while maintaining resistance to the conditions of use of the equipment (possible changeable weather conditions, unfavorable lighting, etc.).
Due to the use of a trailer, particular difficulties in maintaining the correct track occur on long, straight sections (no fixed point of reference, no continuous center line) and on corners, where the driver/operator cannot see the exact track of the measuring platform behind the car.
The contributions of this article can be summarized as follows:
  • Modification of algorithms for the detection of public road markings in the form of lines for the use of the lane detection on airport areas;
  • Development of our own unique database in the form of recordings of driving along a real runway;
  • Analysis of modified line detection algorithm performance with the use of two different embedded devices.

2. Related Research

As was mentioned in the Introduction, the task of detecting lines and lanes was mainly developed for cars running on normal roads. There exist many different methods and algorithms for road detection research. They mainly focus on road models, edge detection, vanishing point detection, color segmentation and Hough transform. There are many different variations of these approaches as well as their combinations. As stated in the article [10], one of the most robust methods is still the Hough transform and basic image processing. The road boundaries detection algorithm is based on edge detection. Additional processing into a bird’s eye on car roads makes great sense due to the relatively small size of the markings. Considering the use of a vision system to monitor the trajectory of the measurement platform for testing airport lamps, such an operation does not make sense due to the very large size of the lines. However, the idea of detecting horizontal markings by edge detection after, e.g., a color filtration operation is helpful in algorithm development.
The methodology of determining the direction of correction of the trajectory of the measurement platform for testing the quality of airport lamps may be similar to that described in the article [11]. Positioning is done by detecting the lane lines. Then, according to the relative position of these detected features and the vehicle, the lane change is assessed. In the case of the measurement platform, the reference point will be the runway center line. After the camera system has been calibrated, a line will be set in the program responsible for the driver’s guidance, the crossing of which on either side of the frame will result in displaying an appropriate command for the operator to change the direction of movement.
More advanced solutions can be based on the assessment of environmental objects and the training of Bayesian network models [12]. In the case of the airport and its areas, this solution is not the best due to the small number of details of the surroundings that change during the ride on a runway. The best method of determining the trajectory of the measuring platform for testing airport lamps is by reference to the markings on the surface.
Another interesting way of positioning the measurement platform on the airport areas is landmark-based vehicle localization [13], which presents the way of using runway end points that can be used as landmarks. This article describes two important elements when using lane endpoints as reference points: the detection of lane endpoints and the evaluation of the estimation accuracy. In this case, a single camera was used. The next step in improving the algorithm may be adding a tool that can automatically deal with incorrect reading of road markings [14] with the help of a convolutional neural network (CNN).
One of the modern solutions of line detection for car assistance can be found in [15], where the method of predicting the occurrence of lines and estimating distances with their help is presented. They are based on the detection of the VP (vanishing point) that should be found in the area where edge directional feature information is concentrated. The next requirement is the intersection of two straight lines in this area. Such a point can determine the optimal trajectory for a vehicle because, in most cases, it is the center of the lane. The method used for edge detection is based on the Hough transform.
A very interesting algorithm for detecting not very readable road markings has been described in detail in the article [16]. It is resistant to interferences resulting from lighting and environmental conditions. Its principle of operation is based on live video processing with charge-coupled device (CCD) cameras, which is passed through an original mask. The presented examples show its significant advantage over Prewitt and Canny algorithms. The use of the original mask suggests a similar approach to the topic of detecting the central axis of the runway.
Line detection can be executed with the usage of solutions requiring more computational power according to higher complexity of deep learning methods. The article [17] describes the methodology for detecting lane lines based on object feature distillation. The authors used different decoders for feature detection to improve the effectiveness of a neural network-based framework without additional costs, which was verified with methods such as SCNN, DeepLabv1, ResNet. Changes in the stage of preparing models were enough to achieve better performance of the F1Measure parameter on the CuLane dataset. The article uses a workstation with the following parameters: Intel @ CoreTM i7-6800K [email protected] GHz, NVIDIA 2080 Ti graphics card [17], which is not possible in the mobile concerned, and determines the use of smaller units with weaker calculating parameters.

3. Horizontal and Light Markings Used in Airport Areas

At the airport areas, various types of horizontal markings in the form of multi-colored lines are used, as well as light navigation points. Their task is to enable the proper conduct of the procedures necessary to perform air operations. They assist pilots in determining the central axis of the runways and taxiways, the touchdown point, the beginning and the end of the runway, but it is also possible to read from the horizontal markings the place in which the aircraft is located in relation to the end of the runway. Despite increasingly sophisticated on-board instruments, the flight personnel must still rely on sight and visual aids. 
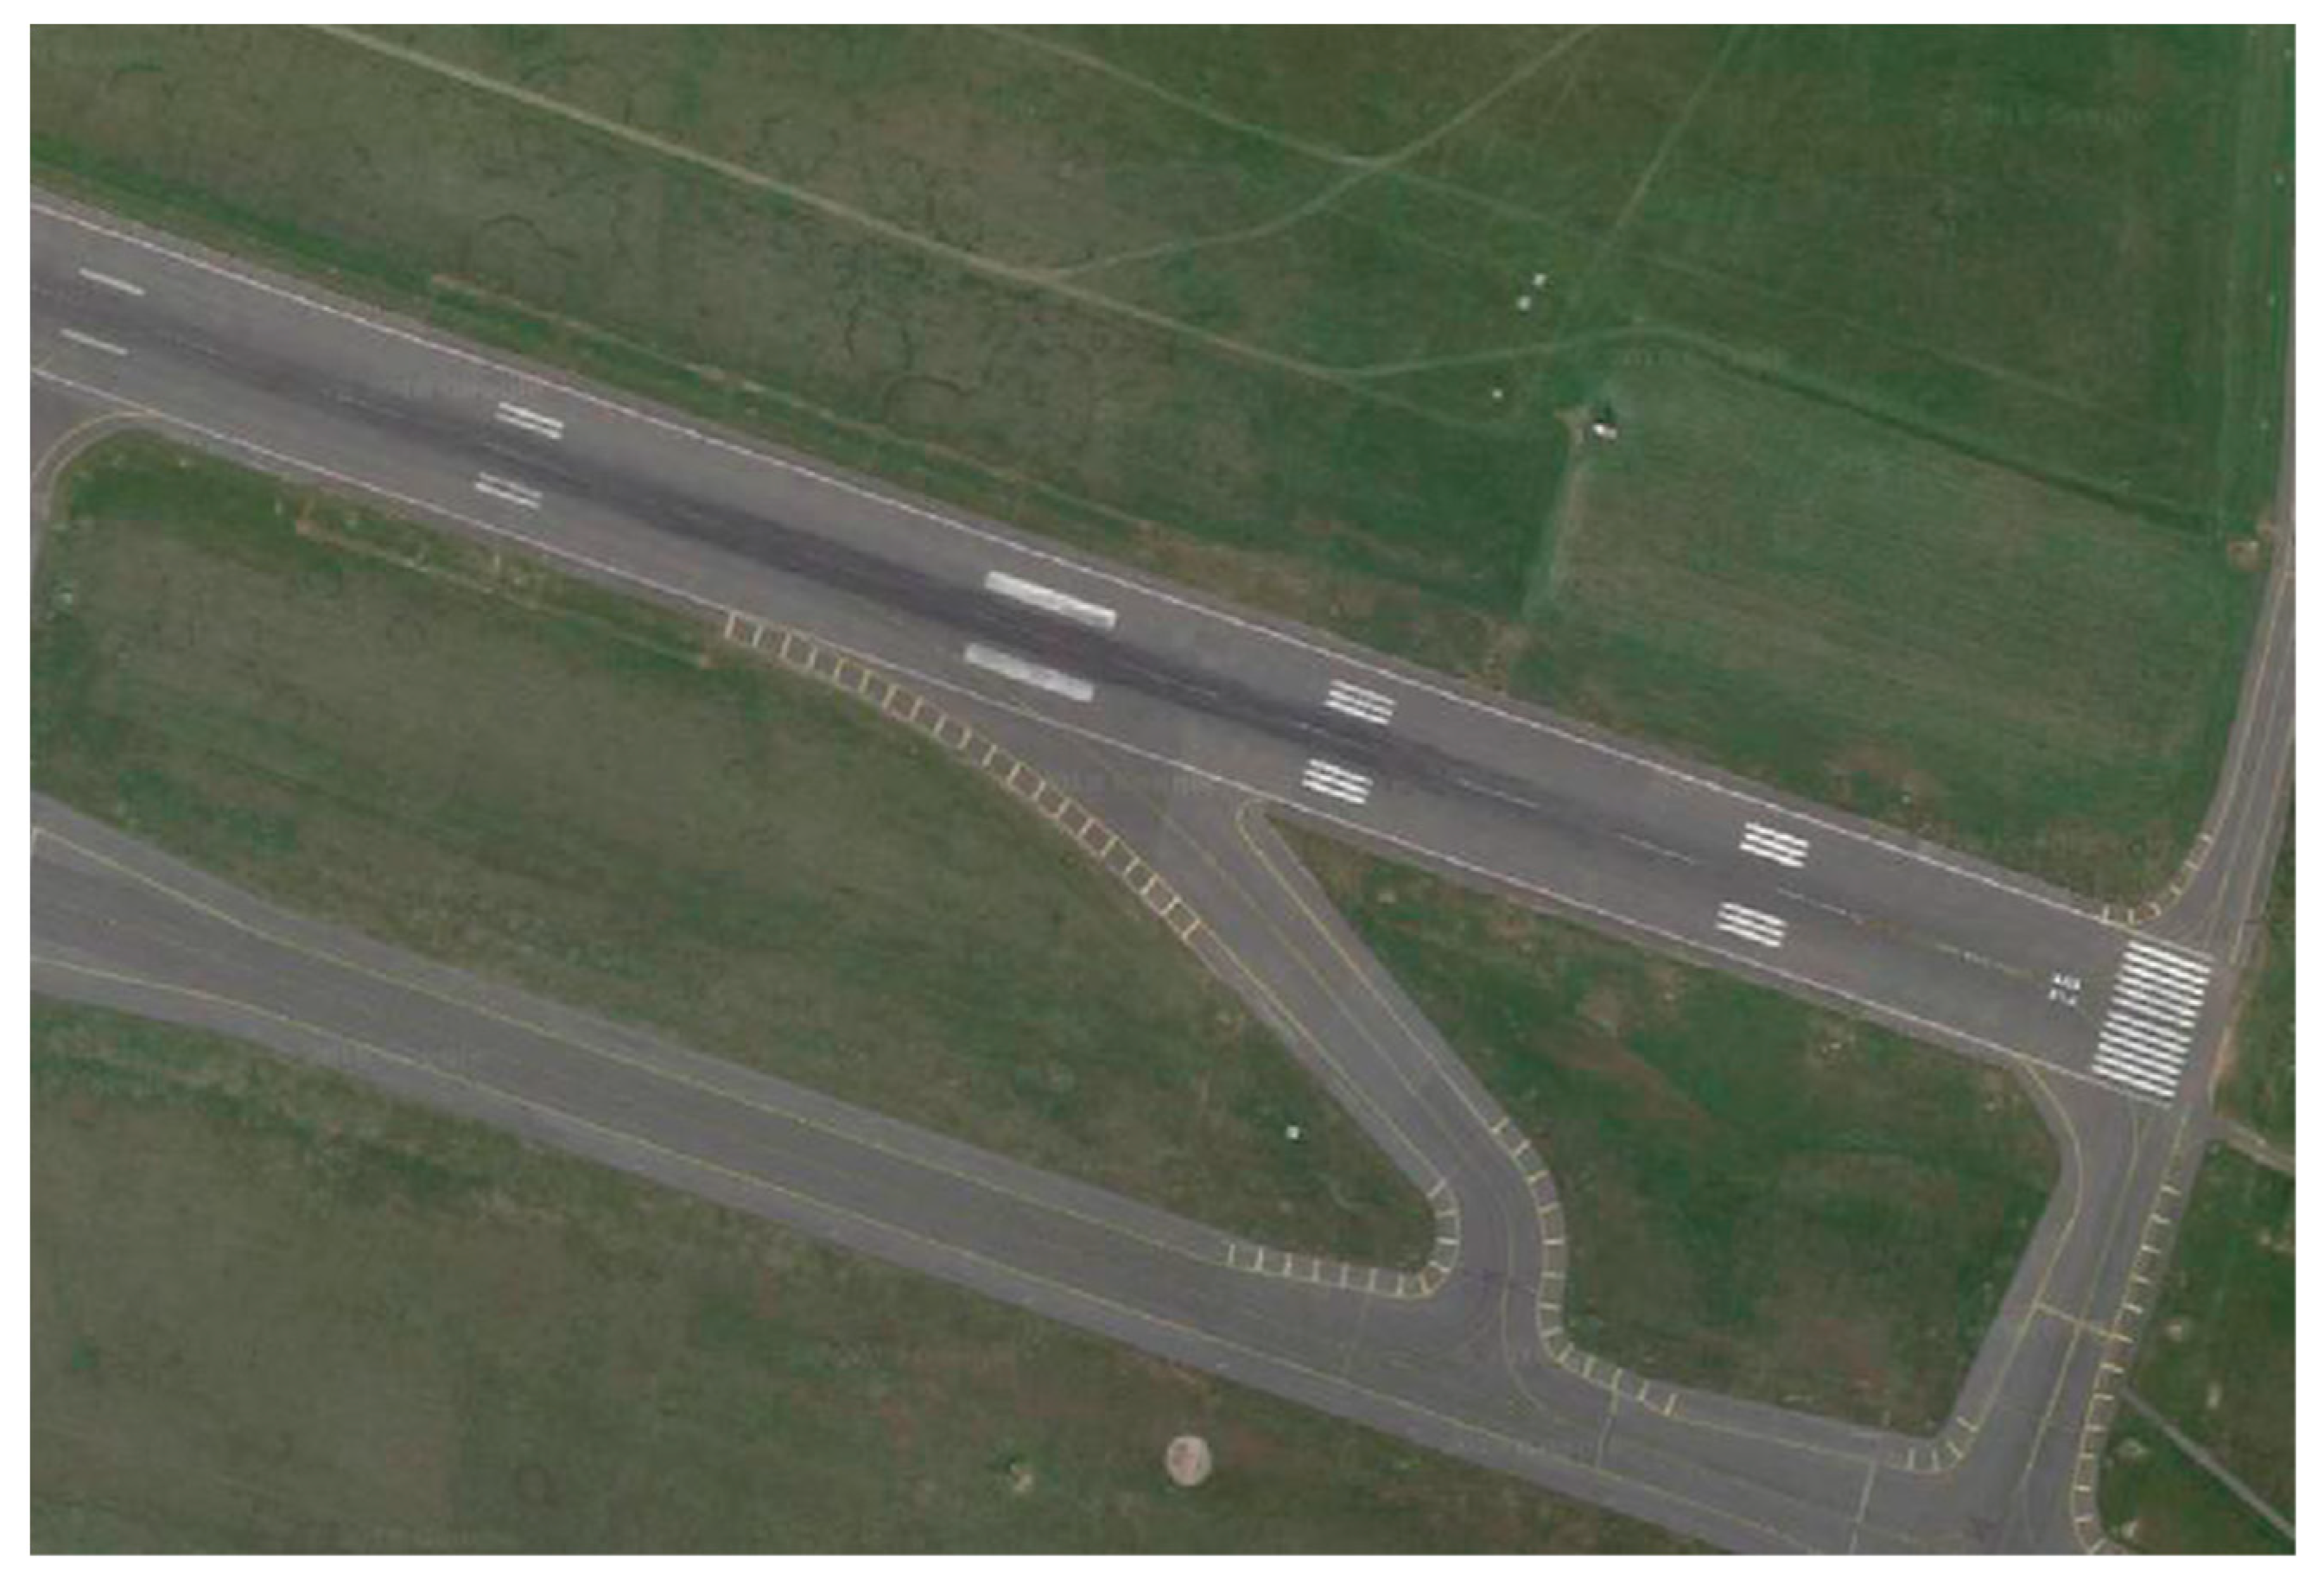
Figure 6 shows a fragment of a satellite image and a view of the runway of the Poznań Airport, Poland.
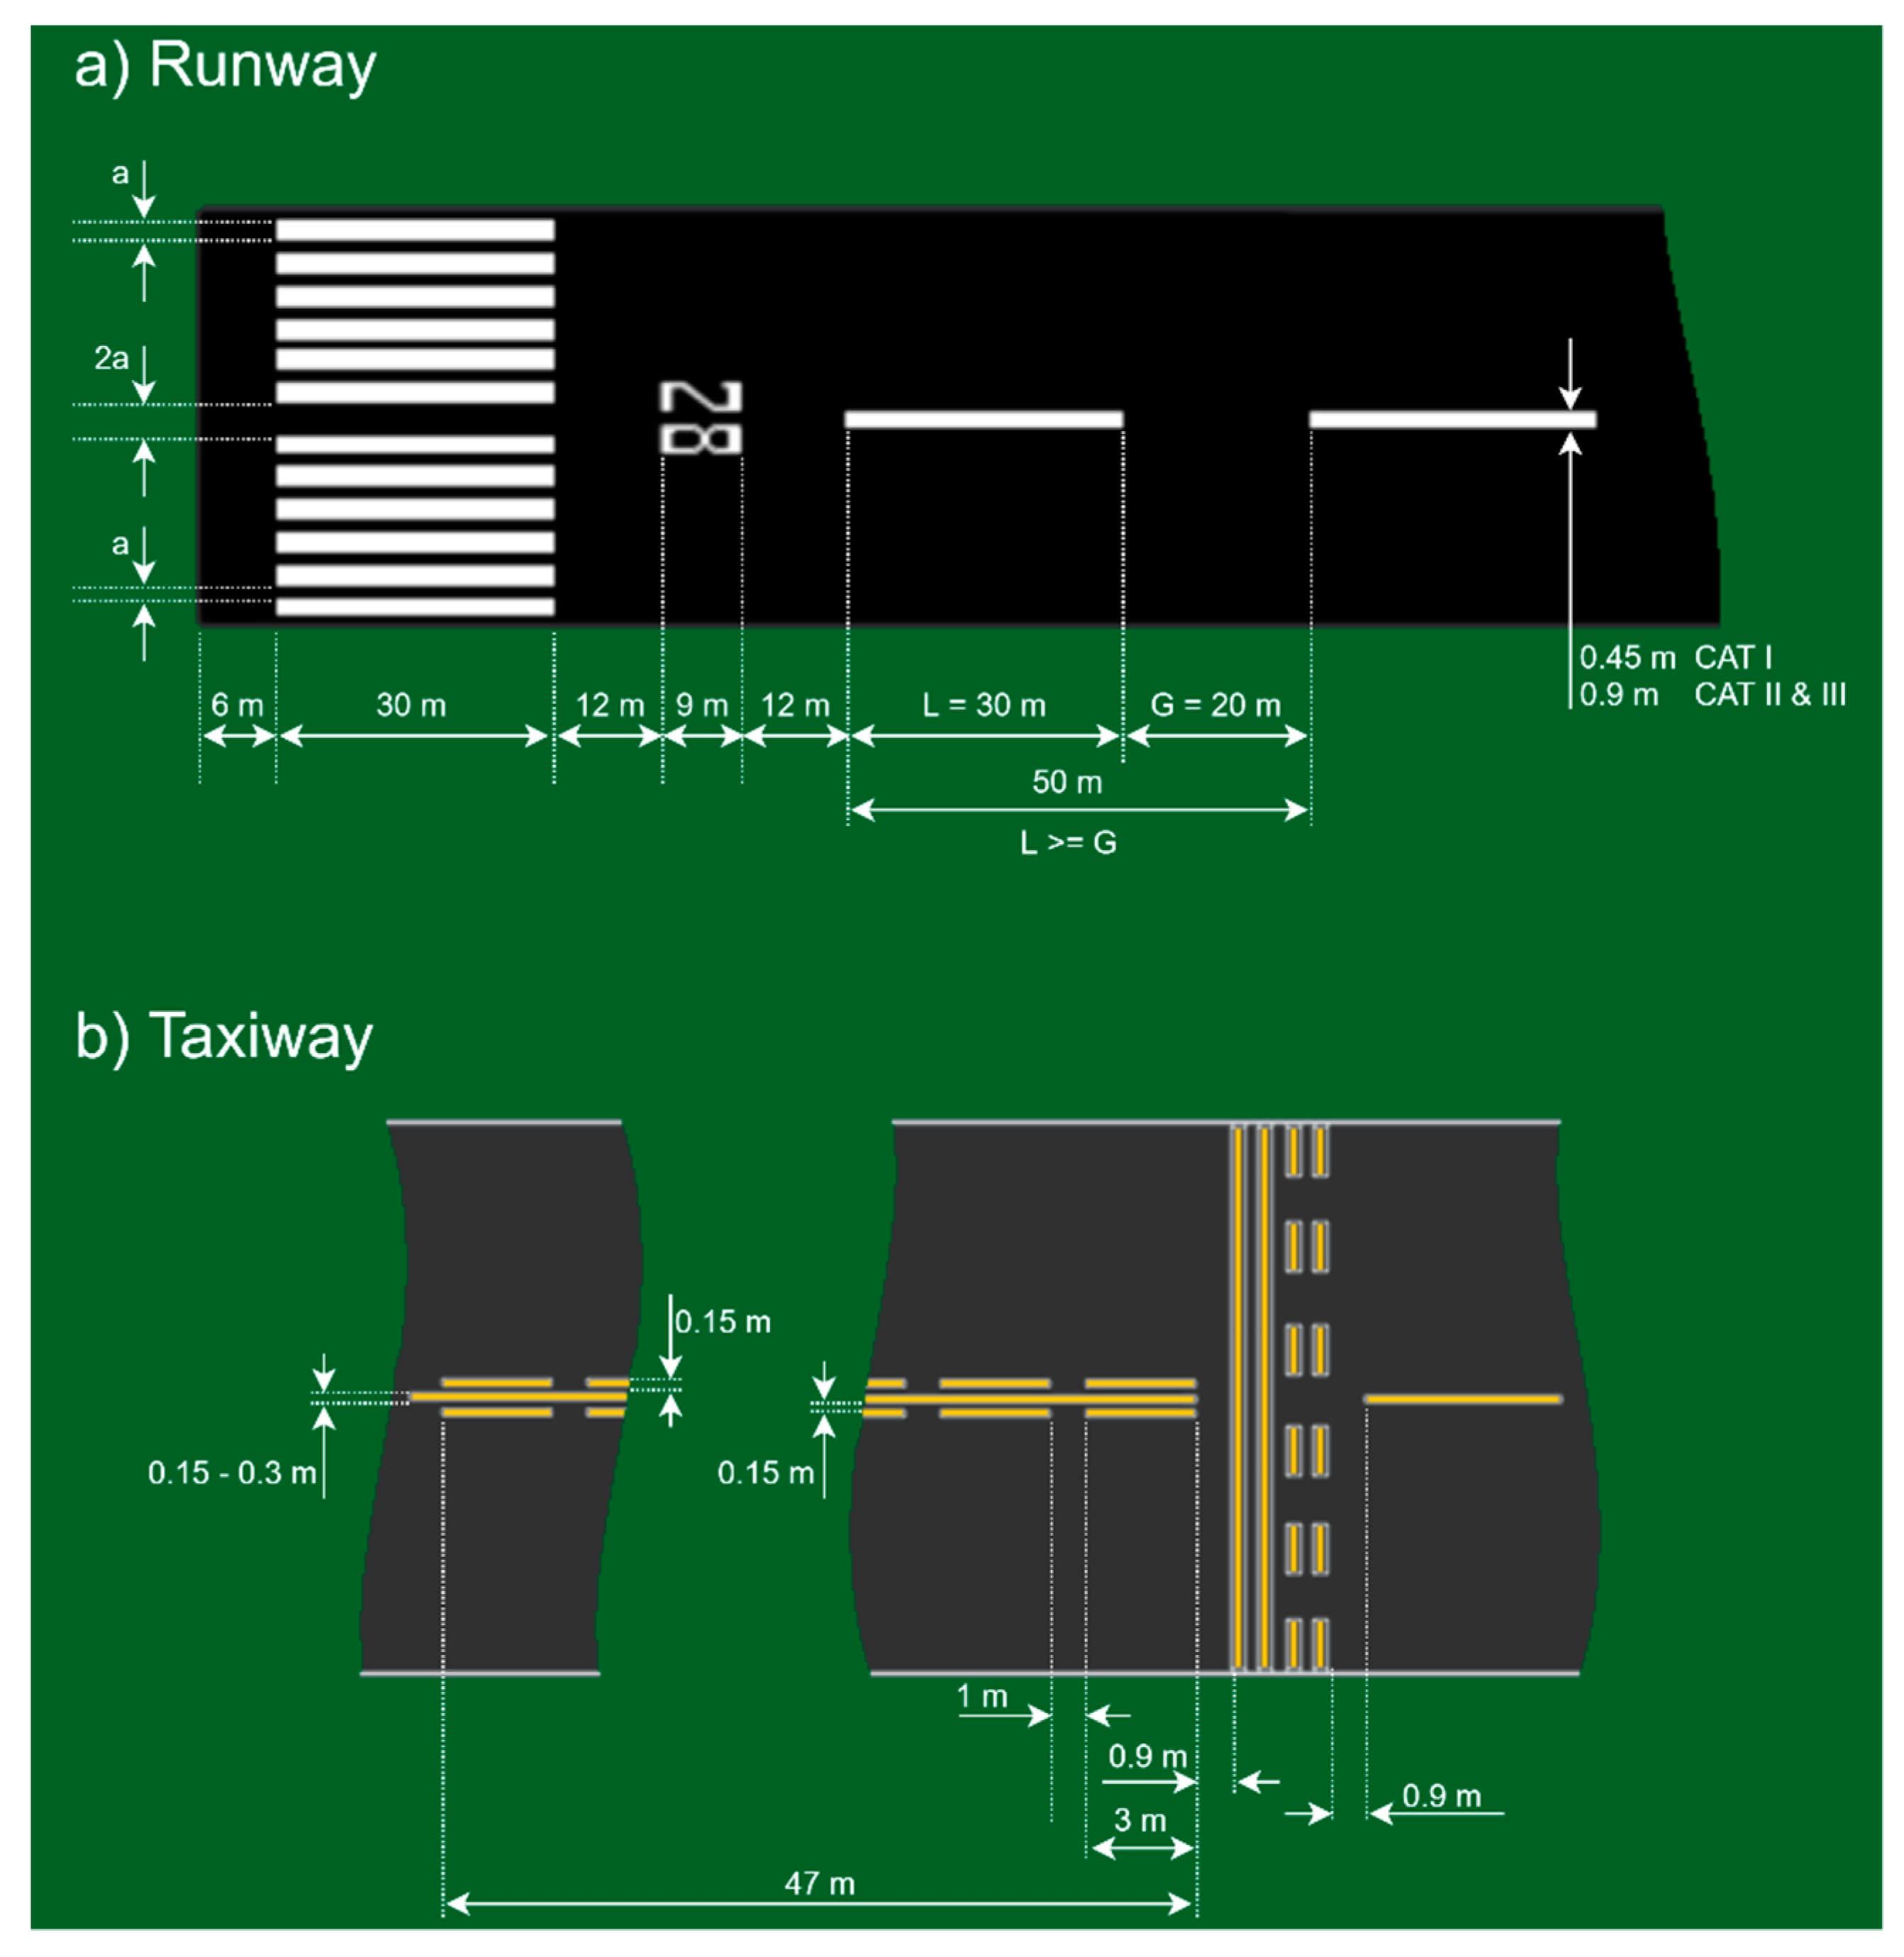
The most important markings, when looking at the implementation of this operator assist system, are the markings of the runway center line in the form of white stripes: 0.9 m wide, 30 m long and with a mutual distance of 20 m. They are located, as the name suggests, in the runway axis, and thus they constitute reference points for the measurement platform for testing the performance quality of center line lamps. Figure 7 shows an example of horizontal road markings on an airfield runway and taxiway with descriptions.
As can be seen, these markings are very extensive. There are both dashed and continuous lines, sometimes side by side. This is determined by the location of the marking, which may indicate runway exits, holding points, stops, intersections, or unsafe sections. However, all markings are strictly described and appear in yellow. A black outline is used when such a marking does not contrast sufficiently with the pavement.
A very important observation during the tests and recordings was the wear of airport markings by the rubber from the aircraft tires sticking to the surface. It has a significant impact on the visibility of horizontal signs as well as recessed light points.

4. Video Materials

The airport areas, in which the tested lamps are located, can be compared to roads intended for cars. Thus, specificity of the airport sign detection is similar to that solved with the algorithms that enable operation of lane keeping assistants in modern passenger cars. With the current development of technology and automation, the automotive industry has already been subject to many changes. Thanks to this, numerous databases for checking algorithms, such as KITTI [18], were created. They enable laboratory testing of methods that can be implemented in real situations. The existing systems are focused on collision avoidance and warning about possible obstacles on the road with the use of vision systems [19].
Another aspect is estimation of the distance between vehicles using algorithms for detecting vehicle lights at night and normalizing the angle of their lighting [20]. Subsequent systems are also based on the omnidirectional monitoring of the area around the vehicle [21], which is extremely important on car roads, but not always effective for other applications. In areas of considerable width and often invisible central lines, it may be helpful to navigate by combining fusing semantic segmentation and monocular depth estimation [22] or with the use of other algorithms allowing for a very good reproduction and denoising of the obtained images [23]. The currently available monocular camera assessment and driving assistance systems [24] may be equally helpful in assessing the driving style, but they are not fully effective due to the much larger distances between the lines on the runways. The next stage of research may be the identification of additional markings on airport roads, similarly to public roads [25].
An obvious difference between public roads and airport areas is in their scale, because the plane areas are much larger. This determined to us the need to create our own video database. The recordings were made using two cameras in full HD resolution. Videos from the GoPro HERO + WiFi camera have a total length of 1 h, 13 min and 10 s and occupy 12.8 GB. Recordings from the XIAOYI YI ACTION camera have a total length of 2 h, 20 min and 50 s. Despite almost twice as long recordings, they occupy only 6.21 GB. During the recordings, a difference in the length of the operation of the cameras on a single charge was noticed, which is synonymous with the length of the recordings. Both cameras use the H.264/MPEG-4 AVC codec based on Context-Adaptive Binary Arithmetic Coding (CABAC). However, they differ in the levels used in the AVC standard. This term defines a set of constraints that indicate the degree of decoder performance required to read a given file. The device of the American manufacturer has the L4.1 level, and the Chinese one L4. This results in differences in the maximum allowable data transmission rate, which was noticed on the basis of the memory consumption of the received files. It is worth noting that after making test recordings with the GoPro HERO + and XIAOYI YI ACTION cameras, more details were found from the GoPro camera.

5. The Proposed Methods for Runway Line Markings Detection

5.1. Line Detection Using Scharr Mask Edge Detection and Hough Transform

The algorithm was prepared using basic operations performed on the images, the task of which was to improve the quality and precision of line detection. The key element was to process the frame in such a way that the horizontal marks were separated from other objects and the background. The other important aspects were associated with filtering of noise and incorrect detections, looking for vertical edges and minimizing the influence of others present in the frame, and finally, the proper parameters for the Hough transform. The programming environment used in the project was Python 3.7.6 and the OpenCV library, version 4.2.0. Figure 8 shows the scheme of the program.
In order to speed up the execution of individual stages of the program while maintaining a sufficient number of details, in the first step, after loading the frame, its resolution is changed. Then, thanks to the median filter function cv2.medianBlur(input, 3), the noise in the image is removed, but due to the type of filtering, the visible edges are not distorted as it is very important for line detection. In order to make them visible, sharpening is performed in the next step. Using kernel in the shape of array:
k e r n e l = [ 0 1 0 1 5 1 0 1 0 ]
and function cv2.filter2D(input, −1, kernel), satisfactory results were obtained. Then the transition from the RGB space to the grayscale is made with standard OpenCV function cv2.cvtColor(input, cv2.COLOR_BGR2GRAY). Considering that the lines painted on the airport areas are exposed to intensive wear due to seizure (especially in the touchdown zone, where large amounts of rubber from landing aircraft tires remain on the asphalt), the histogram equalization function cv2.equalizeHIST(input) was used to emphasize the details that are hardly visible due to small original contrast. The image prepared in this way is ready to apply the Canny algorithm to edge detection with the use of cv2.Canny(input, minVal, maxVal) with parameters minVal = 400 and maxVal = 500. The most interesting for the centerline detection task is finding the vertical edges. Rejecting all the remaining edges found with the Canny algorithm was possible thanks to the use of the Scharr mask for an angle of 0 degrees with kernel array:
k e r n e l = [ 3 0 3 10 0 10 3 0 3 ]
and cv2.filter2D(input, –1, kernel). The last step before the end of the algorithm is line detection, which was performed with the Hough transform, using Probabilistic Hough Line Transform from the OpenCV library. The final frame, which is given by the program at the end of the algorithm operation, has the lines of the central axis drawn on the original image. They constitute a point of reference for which it is possible to further develop the measurement platform for testing the quality of the airport lighting operation, by increasing the measurement precision, having more accurate information about the position of the matrix in relation to the tested lamp. Figure 9 shows the result of the program operation.
One of the techniques that were used to implement the algorithm was the autonomous method of recognizing road markings, which is very important for the research of an intelligent vehicle, which is used both in navigation and in the advanced driver assistance system [26]. In most previous studies, markings such as lanes have been used to locate and operate the vehicle along the road. In reality, however, signs such as arrows and warnings are essential for car navigation. The method was based on the support vector machine (SVM) to reduce the influence of the external environment such as point of view, brightness, and external background. The presented method was tested using experimental images. The results show that the recognition accuracy can be achieved over 97% and the time consumption per frame is 0.26 s [26].
Another problem that inspired the improvement of the discussed algorithm is the recognition of the position on the runway [27]. It has been noticed that the signs and individual lines are important for the safety of avoiding runway incursions. It is an important complement to pilot education and airport ground radar to increase safety, especially in complex, large airports. In this project, the standard airport signs and markings were used to detect and recognize individual places. The Canny transform was applied for the line detection, and the Hough transform was used to recognize major lines in images and to identify short lines between them. Ultimately, the authors achieved an accuracy of 95.1% for runway sign detection, and the wait position recognition was correct in 89.2% of cases [27].

5.2. Line Detection Algorithm Based on Hyperbolas Fitting

This is a different way of implementing the line detection algorithm, which interferes with the input form of the image to a lesser extent, and focuses on performing calculations, which is an alternative technique in construction of the image analysis-based algorithms [28]. The same programming environment was used with support of the OpenCV library, version 4.2.0. Due to the computational complexity, the NumPy and math libraries were also used. During these operations, the functions of maximum values, rounding, calculating mean and creating zero matrices were used, which were then completed to obtain the final result based on the input image array. The first operation after loading the frame and reducing its resolution is the standard transition from RGB to grayscale. Then, the global variables necessary for further calculations are initialized. An array of the left and right threshold intensity values is created. In the next step, specific left and right threshold values are determined, and then the global variables for lane extraction are initialized. Thanks to the previously calculated threshold values, it is possible to identify points in the left and right lanes. Finally, at the exit of the program, an image appears with marked identified points that correspond to the course of the lines painted on the airport areas. Figure 10 shows a block diagram of this program. The Hough transform is used for searching the lines in a specific area (Figure 11a) according to expression (1), where ρ is the value of distance from the origin to the closest point on the searched line, and θ is the angle between the X axis and the line connecting the origin with that closest point. The range of ρ is determined by dependence −R< ρ <+R, where R is image diagonal and the value of θ is limited between −90° to 90°. The variables needed to calculate the diagonal R are rows and cols, which correspond to the numbers of rows and columns of the image being processed.
ρ ( θ ) = x cos ( θ ) + y sin ( θ ) r o w s 2 + c o l s 2 < ρ < r o w s 2 + c o l s 2
In the case of the start condition, the search will be on the left or right boundary, so the maximum range will be the boundary itself (Figure 11b). An additional search zone makes it easy to track the outer lane boundary curves. The lane points are divided into two lists (L(l)—left line, L(r)—right line) expressed as in Equations (2) and (3), where u and v are the x- and y-coordinate in the image reference frame [29].
L ( l ) = { ( u 1 ( l ) , v 1 ( l ) ) ,   ( u 2 ( l ) , v 2 ( l ) ) ,   , ( u m ( l ) , v m ( l ) ) }
L ( r ) = { ( u 1 ( r ) , v 1 ( r ) ) ,   ( u 2 ( r ) , v 2 ( r ) ) ,   , ( u m ( r ) , v m ( r ) ) }
The proposed solution is also applicable to the general obstacle and lane detection system, using stereo vision architecture in order to increase the road safety [30]. Based on fully custom devices, it can detect both general obstacles (without symmetry or shape constraints) and the position of the belt. Due to the geometric transformation supported by a specific hardware module, the perspective effect is removed from both the left and right stereo images. The left one is used to detect lane markings using a series of morphological filters, while both mapped stereo images are used to detect clearance in front of the vehicle. The processing output is displayed on both the Control Display and Control Panel to provide visual feedback to the driver [30].
Among the complex and difficult tasks is the detection of road lanes and road borders [31]. The current solutions are based on lane detection, which is used for road location, determination of the relative position between the vehicle and road and for the analysis of the vehicle direction of travel. One of the main approaches to detecting road and lane boundaries is with the in-vehicle vision system, but lane detection is a difficult problem due to the various road conditions that may be encountered while driving [31].
The developed method of detecting airport plane lines based on edge detection represents a vision-based approach to runway detection, enabling real-time operation with resistance to changes in lighting and shadows. The system obtains a front view using a camera mounted on the vehicle and then uses several processes to detect the lanes. By using a pair of hyperbolas that match the edges of the lane, these paths are extracted using the Hough transform. The proposed lane detection system can be used on both painted and unpainted roads, as well as curved and straight roads in various weather conditions. This approach has been tested, and the experimental results show that the proposed scheme is robust and fast enough for real-time operation. Ultimately, a critical review of the methods was discussed and their potential for future implementation was helpful. Figure 12 shows the result of the prepared program.

5.3. Line Detection Algorithm Using Color-Based Image Segmentation in the HSV Color Space

The third algorithm designed to detect lines in airport areas was based on different assumptions than the first two algorithms, but the programming environment used in the project was also Python 3.7.6 and the OpenCV library, version 4.2.0. The main idea was to isolate the color shades of the lines from the image, which in the case of airport markings are white or yellow, which is a good contrast with the gray or dark gray background of the pavement. The isolation of yellow and white areas from the image was preceded by changing the resolution and color space from RGB to HSV to avoid distortions in the form of uneven lighting that could result in the appearance of a darker or lighter color scale [32]. After defining the shades responsible for these two colors, appropriate saturation thresholds and the component being the power of white light were also set. The mask obtained in this way, in which the detected colors are pixels with a value of 255, i.e., they are white, and the rest of the frame has a value of 0, i.e., is black. Such a table can be used as an input to the Canny algorithm for edge detection. In this algorithm, dedicated functions were responsible for individual actions. The division was made as follows: color separation, ROI determination, lines detection, and supervision programs. Figure 13 shows a block diagram of the program operation.
The wide angle of view of the camera has advantages but also disadvantages. In addition to the fact that almost the entire width of the runway is visible, which is an extraordinary merit, the camera lens also contained many irrelevant elements that may introduce interference to the algorithm. In order to get rid of their influence, it was decided to manually determine the ROI, which covers the area in the central part of the cage (where the central lines should be located) plus a safe margin of error. Its border also runs just below the horizon to eliminate any horizontal lines that could be detected. After such preparation, the processed image undergoes the Hough transform for line detection. This part of the algorithm was implemented with Probabilistic Hough Line Transform: cv2.HoughLinesP(input, 1, np.pi/180, 10, 50, 10). At the exit of the program, there is an original painting with lines marked on the edges of the stripes painted on the airport areas. It is worth noting here that this algorithm is the only one that is very good at detecting both white (in range from [0, 0, 150] to [60, 40, 255]) and yellow (in range from [10, 60, 140] to [30, 255, 255]) lines at the same time, which was possible thanks to the approach based on the use of a different color space. The mask was calculated separately for yellow and white with function cv2.inRange(input, minVal, maxVal) and then a standard adding operation. Figure 14 shows the effect of the program.
A similar approach to line detection has been used to determine the trajectory of the motion of the mobile robot [33]. The impact of image segmentation in the form of transferring colors to another color space on the improvement of the classification of objects in the image was shown. In the case of a mobile robot, this task was facilitated because it was located in the environment specially prepared for this purpose. The lines had a color contrasting with the surroundings and the lighting was even, which greatly simplified the selection of the appropriate color scale range [33]. In the case of outdoor spaces such as an airport, lighting and weather conditions are variable. The same is also true for the color of the lines, which is never the same everywhere, not least because of the wear of the pavement. The use of the HSV color space is a solution that eliminates this problem due to the hue parameter that determines the so-called shade of light that is to some extent the same for the line of a given color. A combination of all the colors of markings on the airport areas made it possible to designate a mask that segmented the areas where the line edge detection takes place.

6. Results and Discussion

6.1. Testing the Effectiveness of Individual Algorithms

During the tests of each of the prepared algorithms, individual result frames were recorded. The experiment was carried out for 100 frames from various recordings acquired during the airport lighting control. In addition, the line detection efficiency and the speed of the following algorithms were compared:
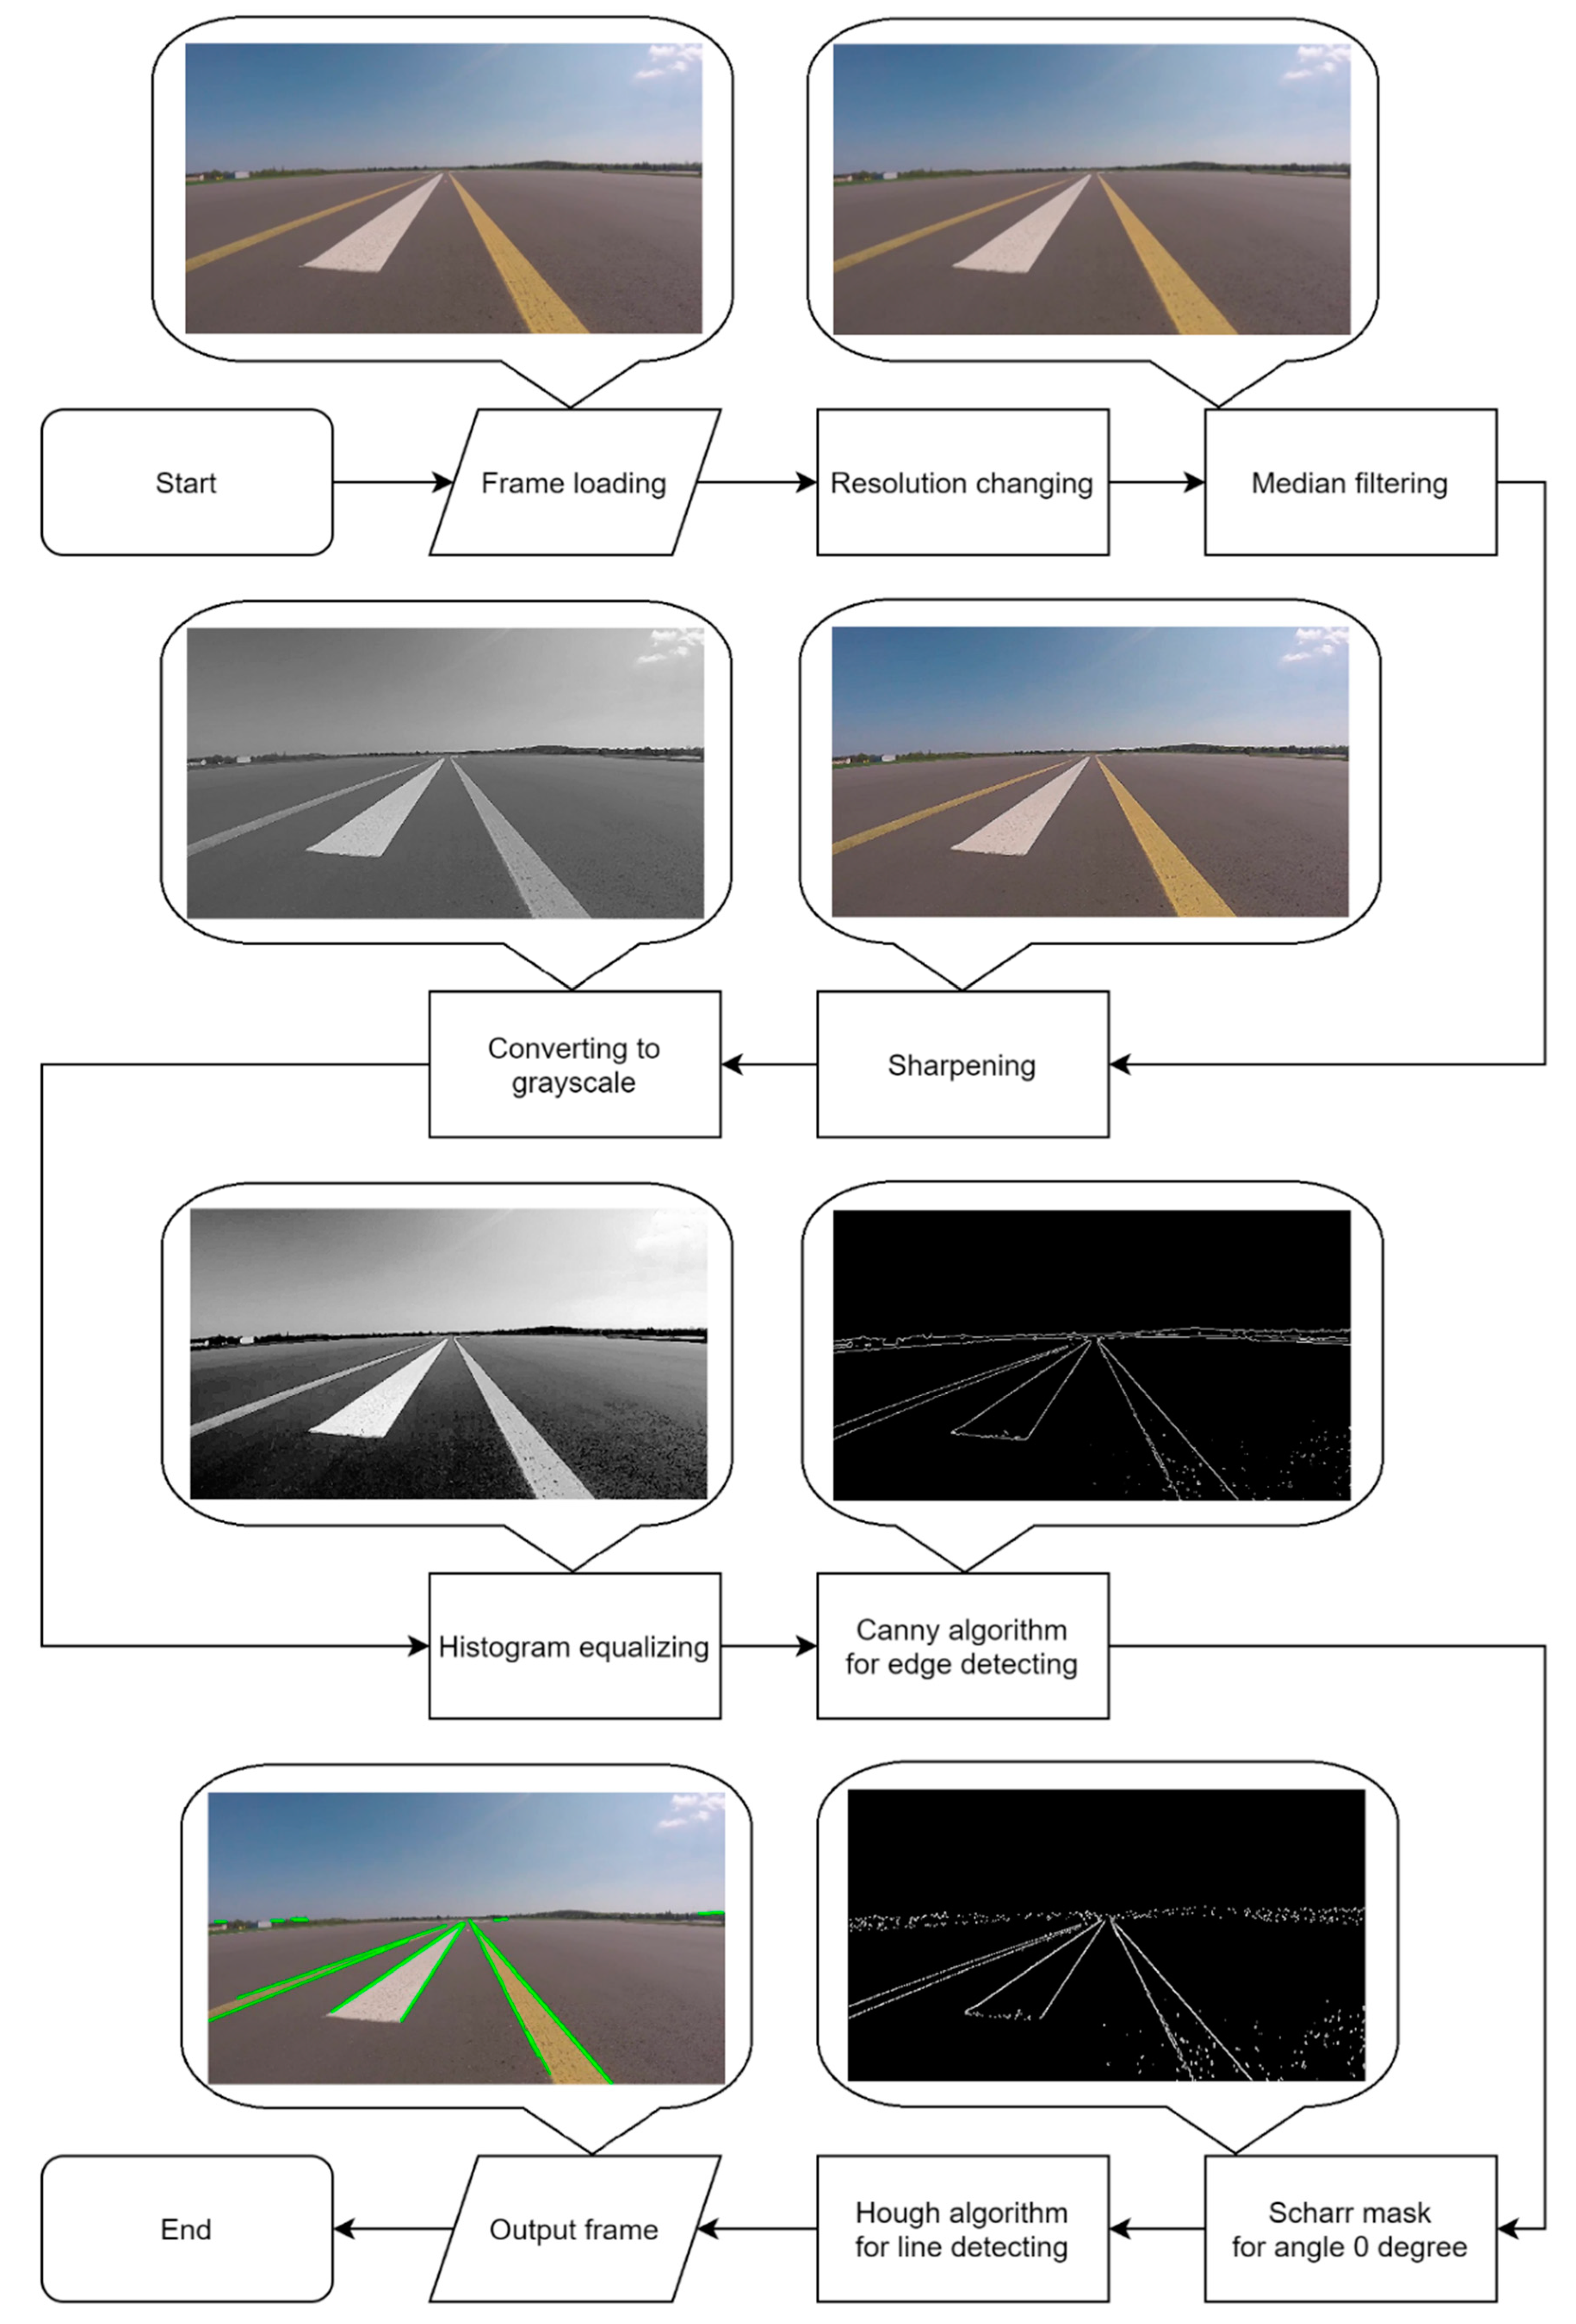
  • Algorithm 1-cf. 5.1 (preprocessing + histogram EQ + Canny + Scharr + Hough)
  • Algorithm 2-cf. 5.2 (preprocessing + threshold + Canny + Hough + hyperbolas fitting)
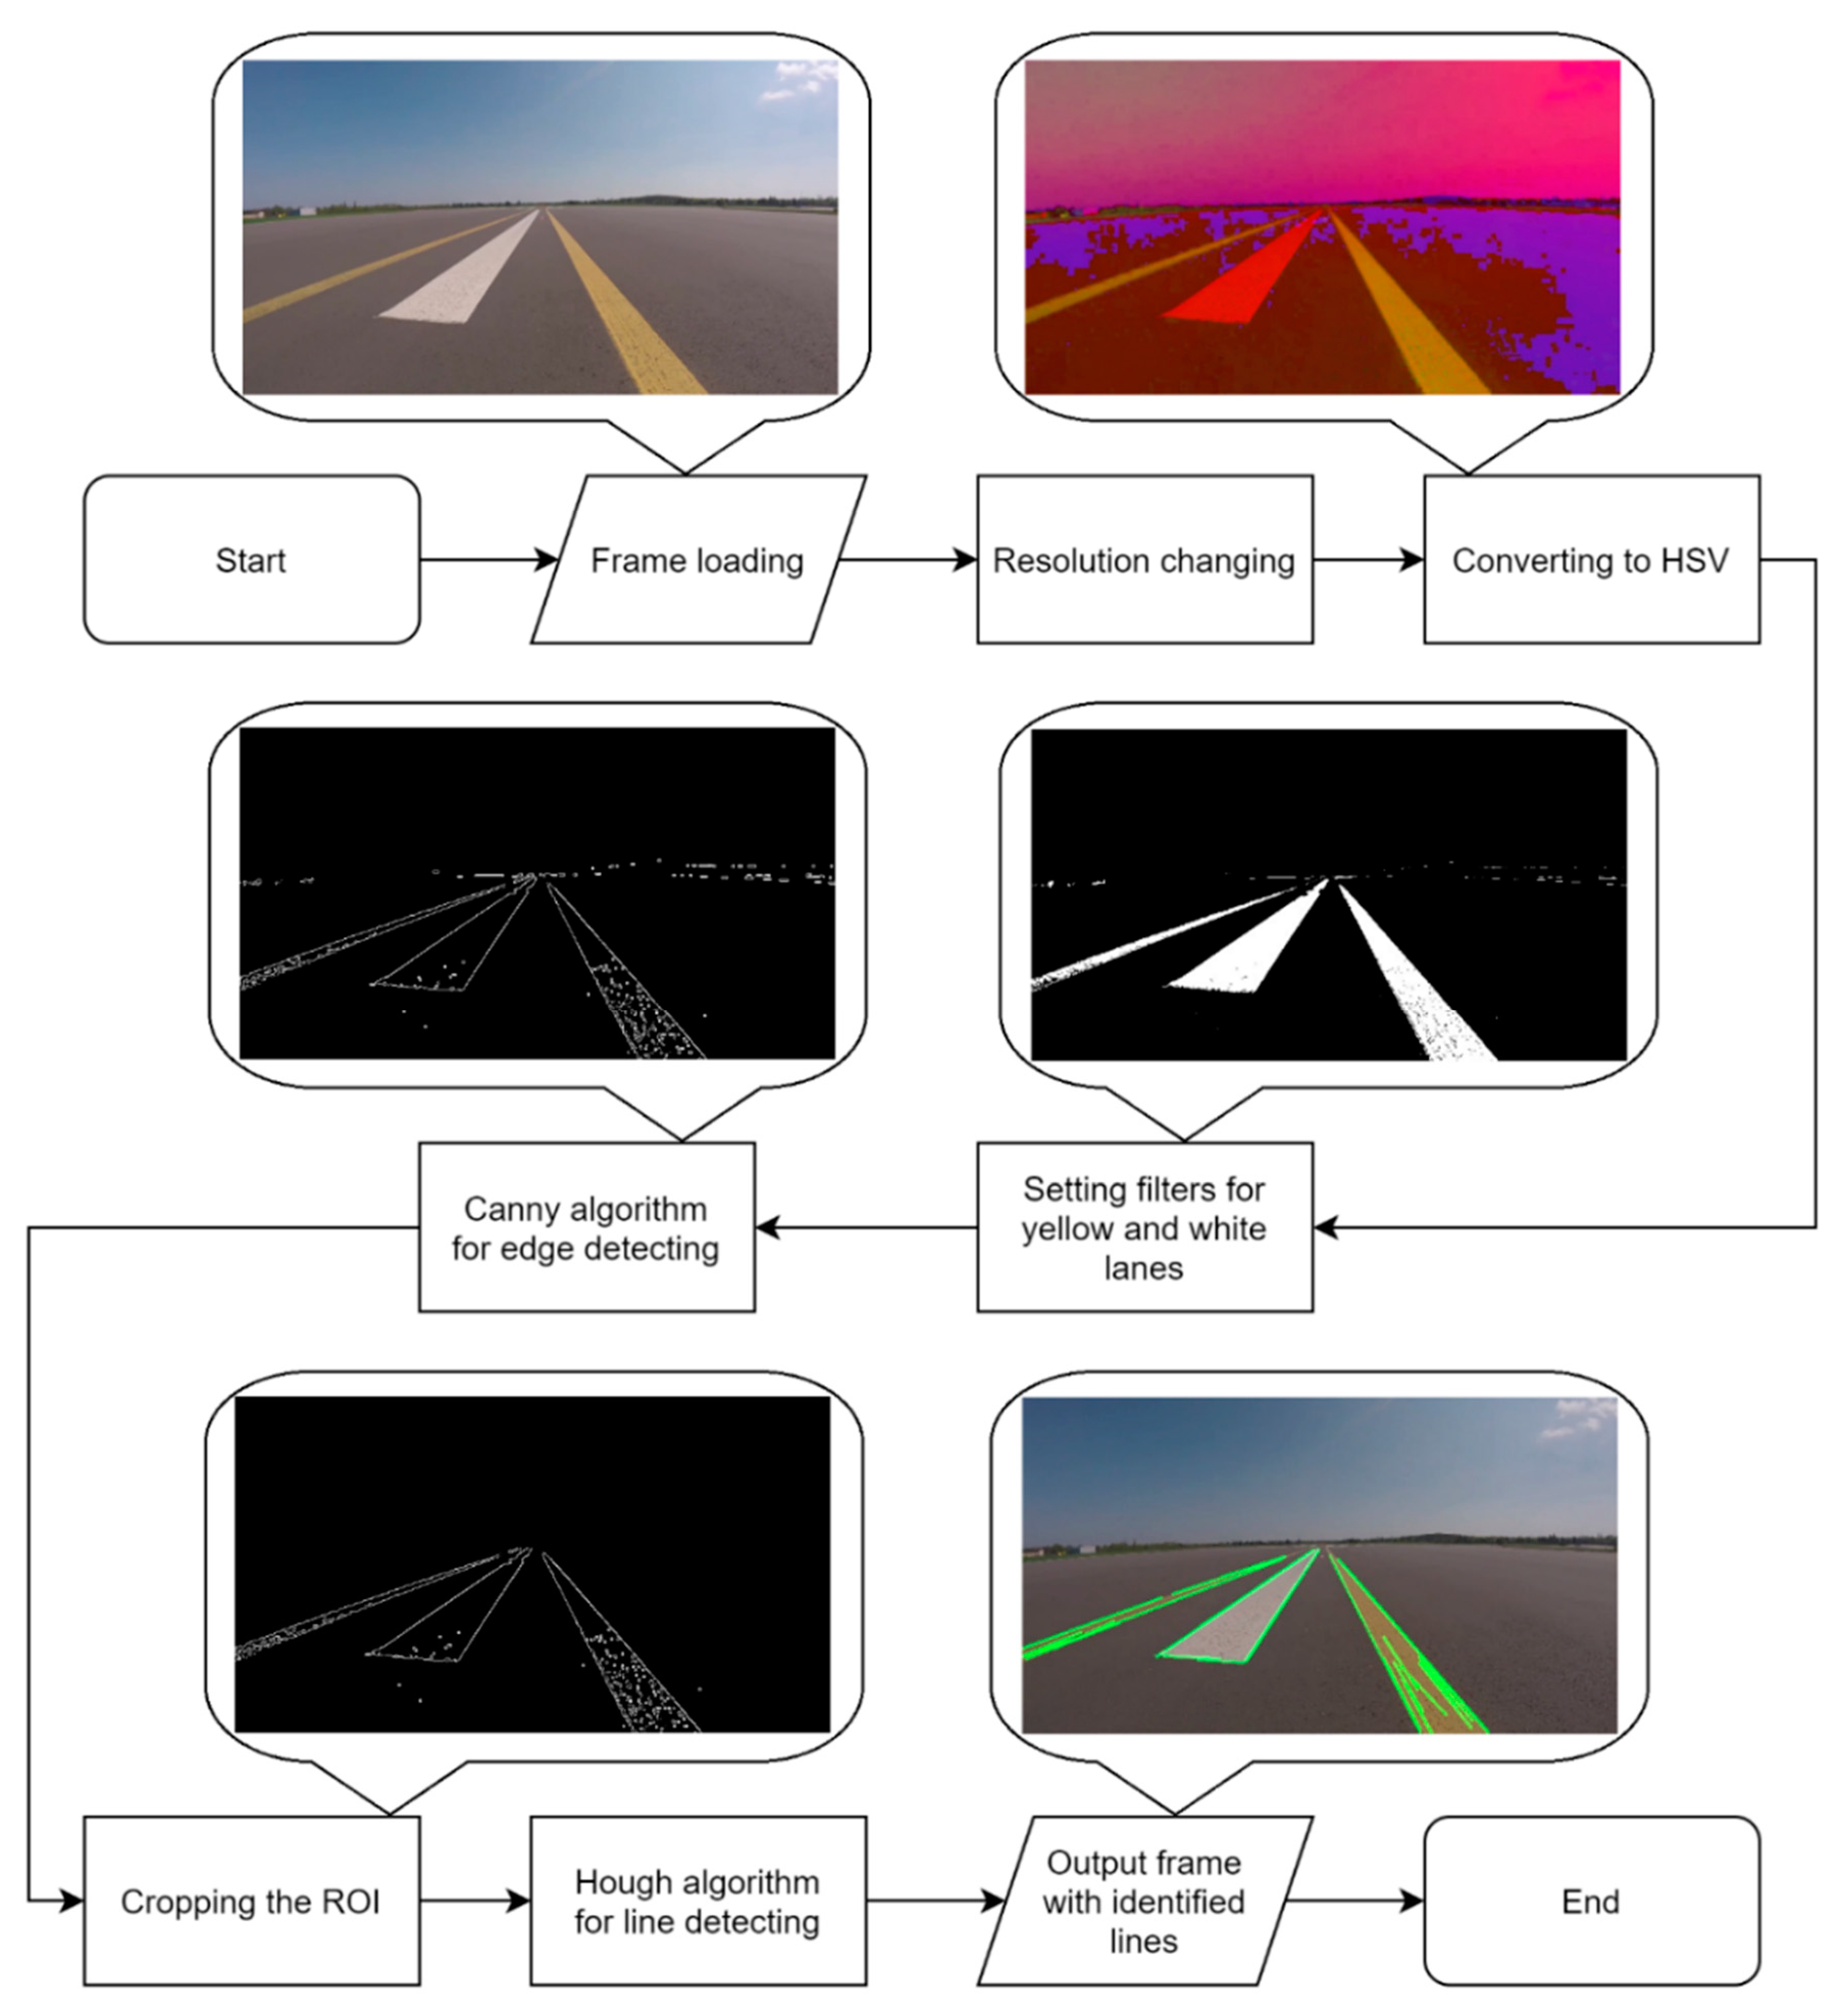
  • Algorithm 3-cf. 5.3 (preprocessing + HSV + Canny + Hough).
Tests were performed for six different resolutions:
  • FHD (1920 × 1080)
  • HD+ (1600 × 900)
  • HD (1366 × 768)
  • WXGA (1280 × 720)
  • nHD (640 × 360)
  • 320 × 180.
As a result, every algorithm provided an output of 600 frames with marked lines, but the differences among preprocessing stages and methods used meant that there were not any identical images at the end of detection. Each frame was assessed in two categories. First, it concerned the detection of any line on the airport areas.
r % = i = 1 n r i n × 100
The percentage value categorizing the results of the algorithms’ operation was determined by Formula (4). The variable r means the result of manual classification in a given category, while n means the number of samples-video frames.
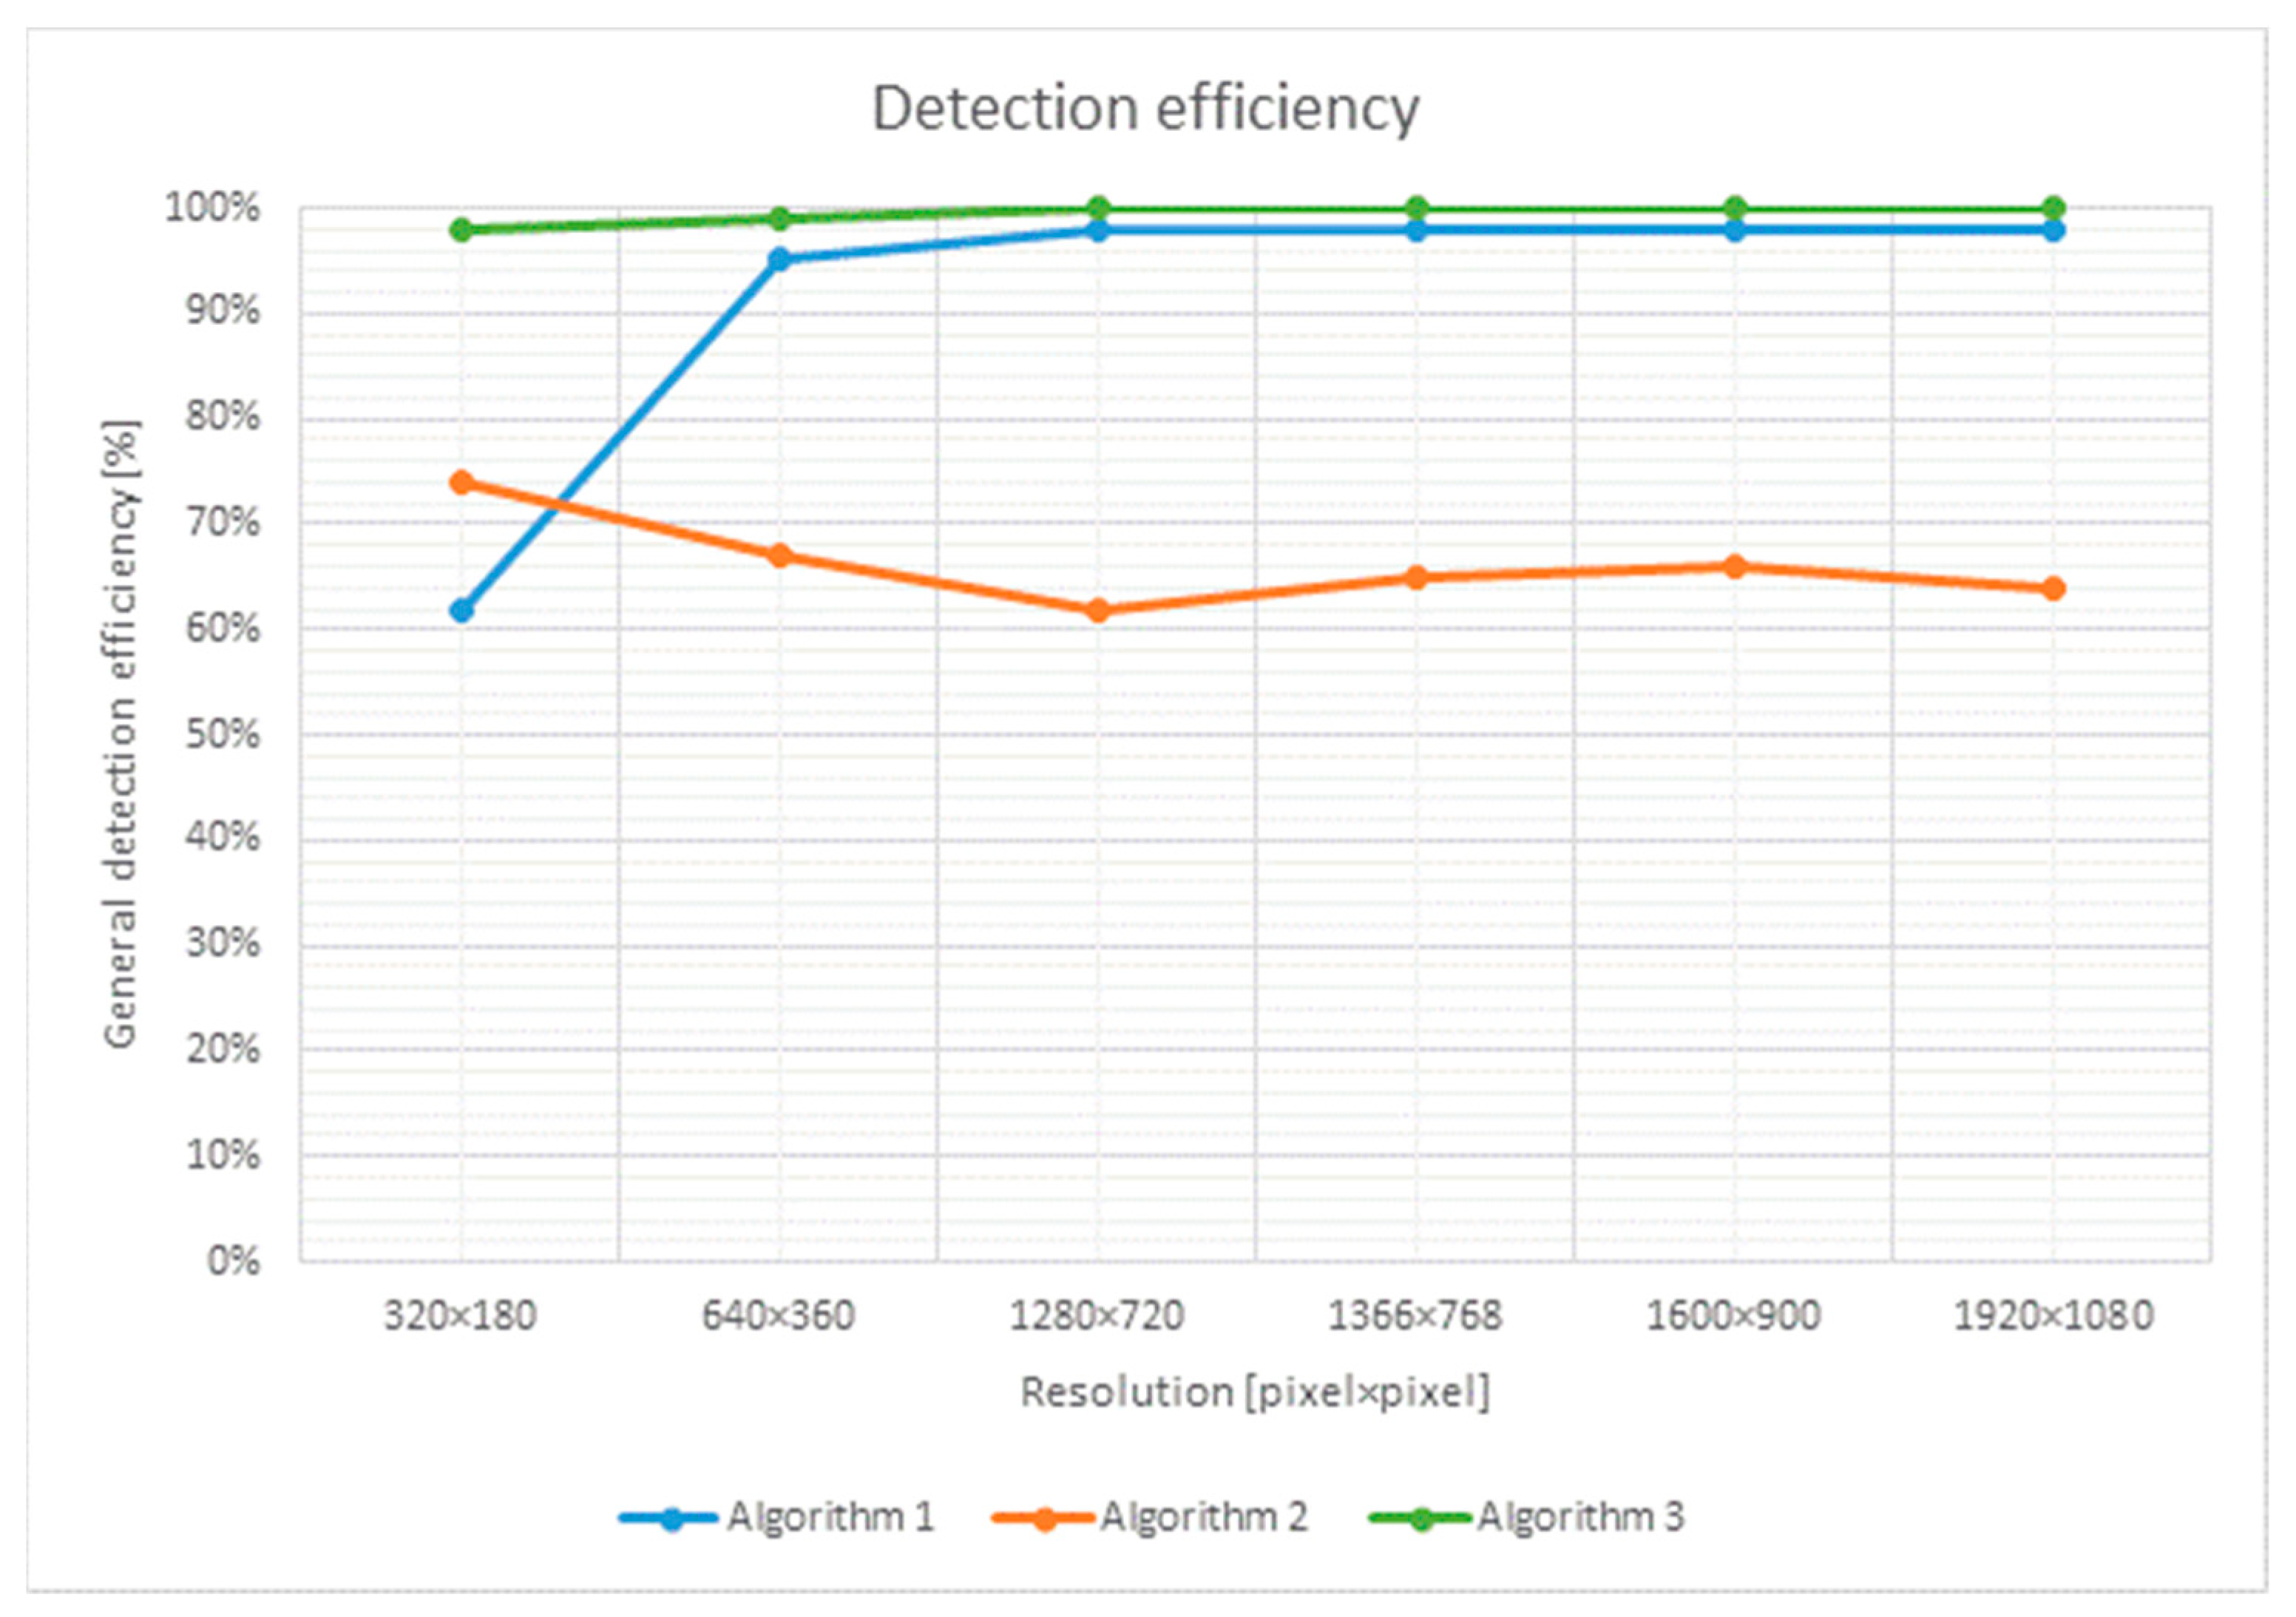
The effectiveness expressed as a percentage for the individual algorithms is presented in Figure 15. It can be seen that Algorithm 2 significantly differs from the results of the other two. The main reason is certainly the way the program works, which is based on mathematical calculations, not on image processing operations. Interestingly, the algorithm achieved the greatest efficiency at the lowest tested resolution. This could be due to the lower detail of the frames, which simplified the calculations and improved the line detection efficiency. Algorithms 1 and 3 show the opposite tendency, i.e., the higher the resolution, the better the efficiency, which in the first case remains at a high level of over 90%, and for method 3, it reaches even 100%.
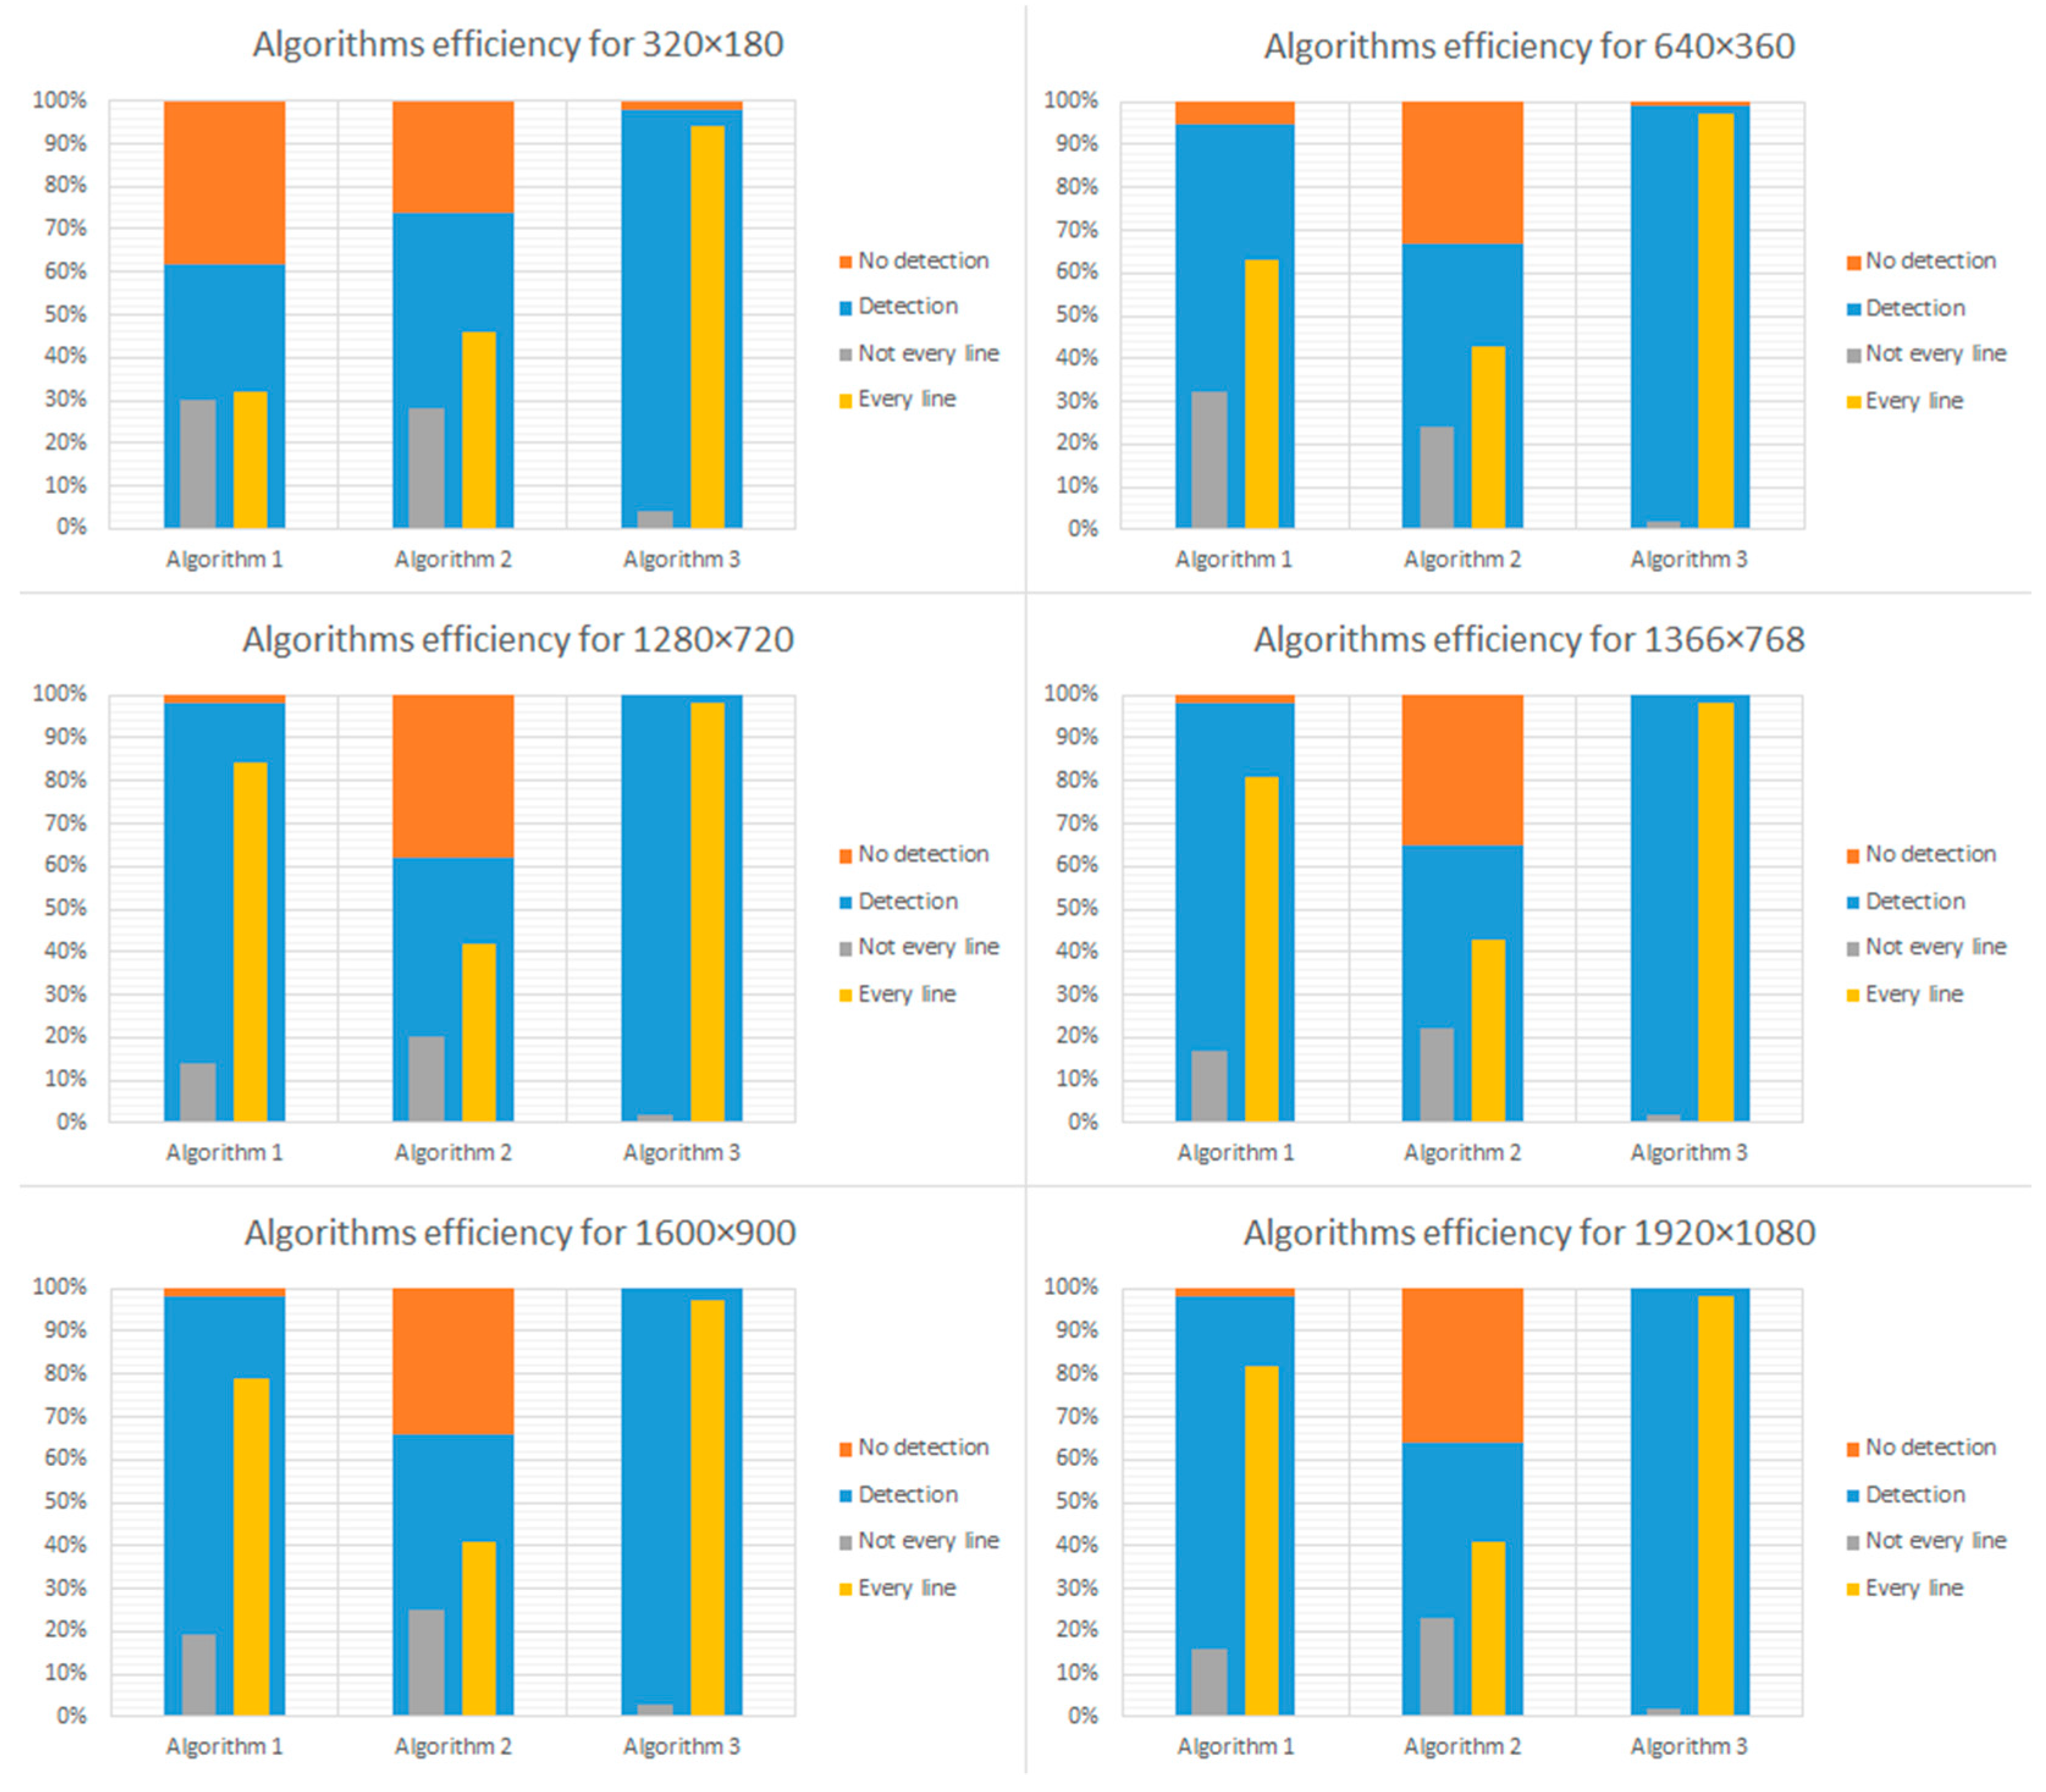
The second step in classifying the effectiveness of the algorithms was to determine whether the image detected all lines and markings visible in the critical area of the frame (just in front of the lens, roughly in the center of the image) or not. A list of the detailed parameters determining the degree of the line detection efficiency depending on the frame resolution is presented in Figure 16. The efficiency of Algorithms 1 and 3 remained at about the same level, taking into account the effectiveness of detecting all lines in the area just in front of the camera lens, roughly in the center of the image for resolutions above WXGA. The decrease in effectiveness was visible for the lower resolutions for Algorithm 1, but the algorithms worked much faster. It should be noted that Algorithm 2, which is based mainly on calculations and not on image processing, is the worst, classifying its effectiveness at the level of 40–45%.
It can be seen that Algorithm 1 makes erroneous identification of both edges of the painted line. During classification, it was interpreted as a failure of detection of all lines. At higher resolutions, i.e., from WXGA up, there was also a lot of background noise, i.e., edge detection in the middle of the black asphalt, which was not the case with the other two algorithms. Another problem of Algorithm 1 manifested itself with lines that were further away from the camera lens, i.e., about half the height of the frame. The edges were not detected at all or were incorrectly detected.
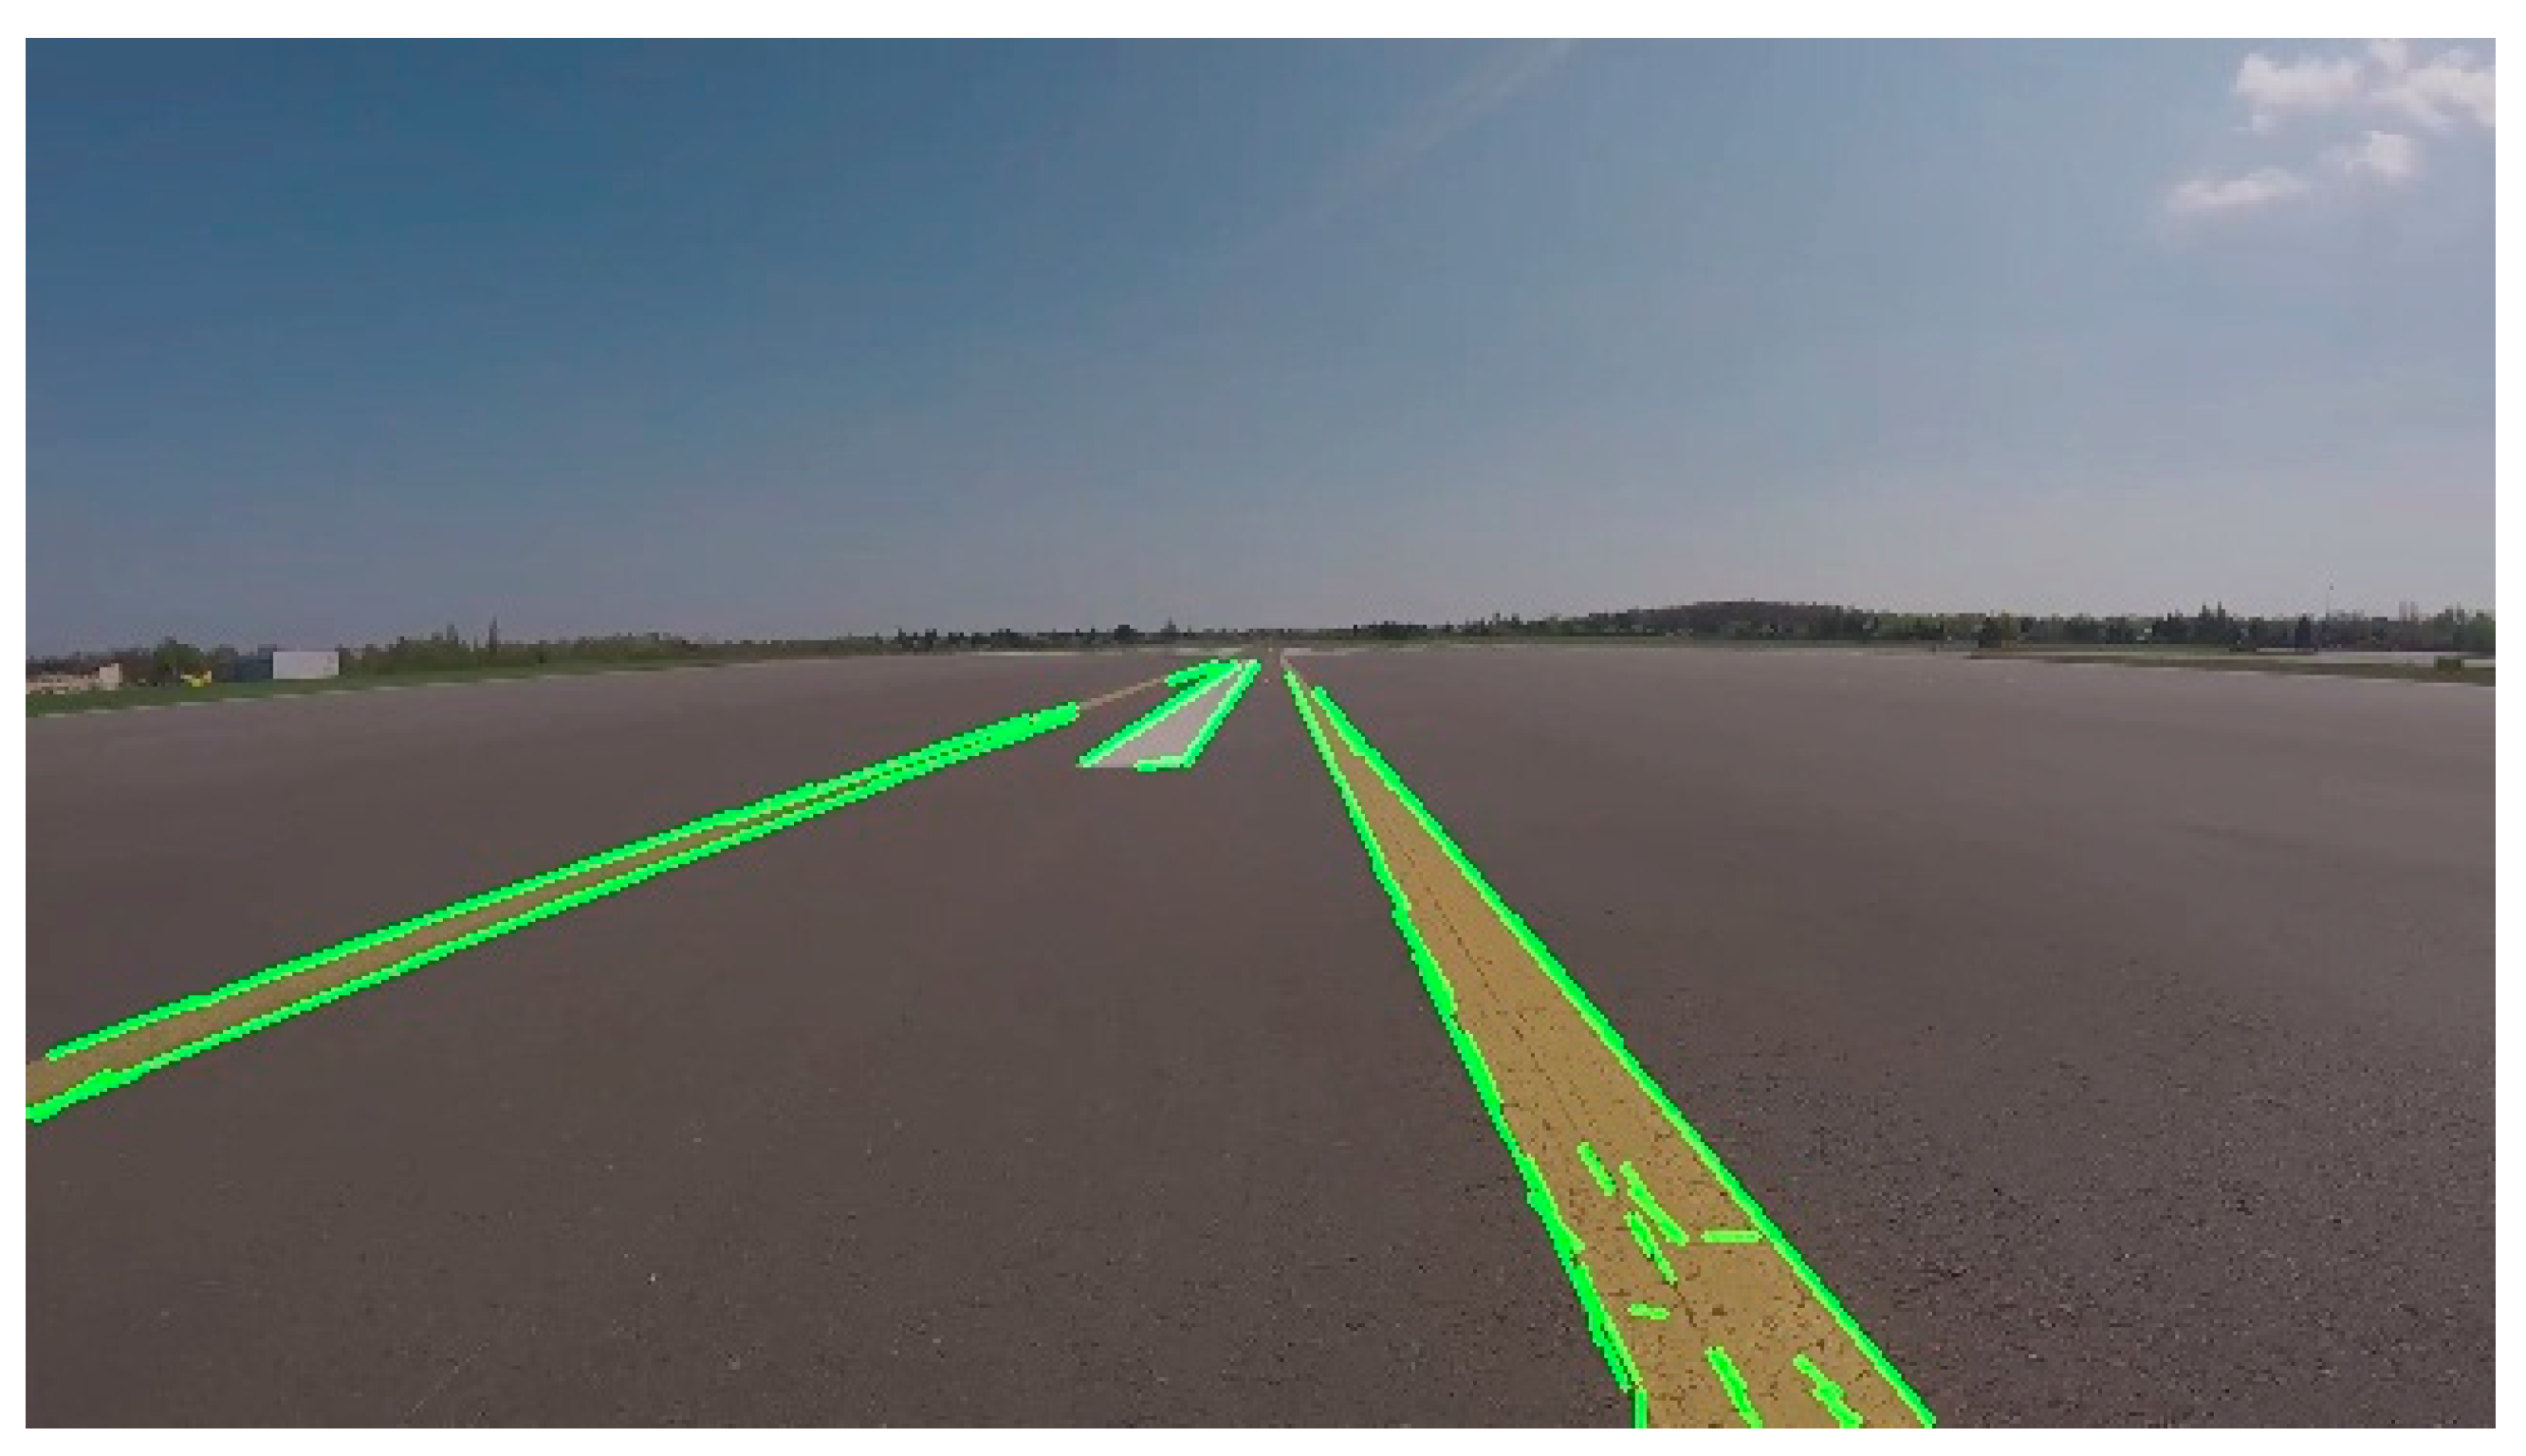
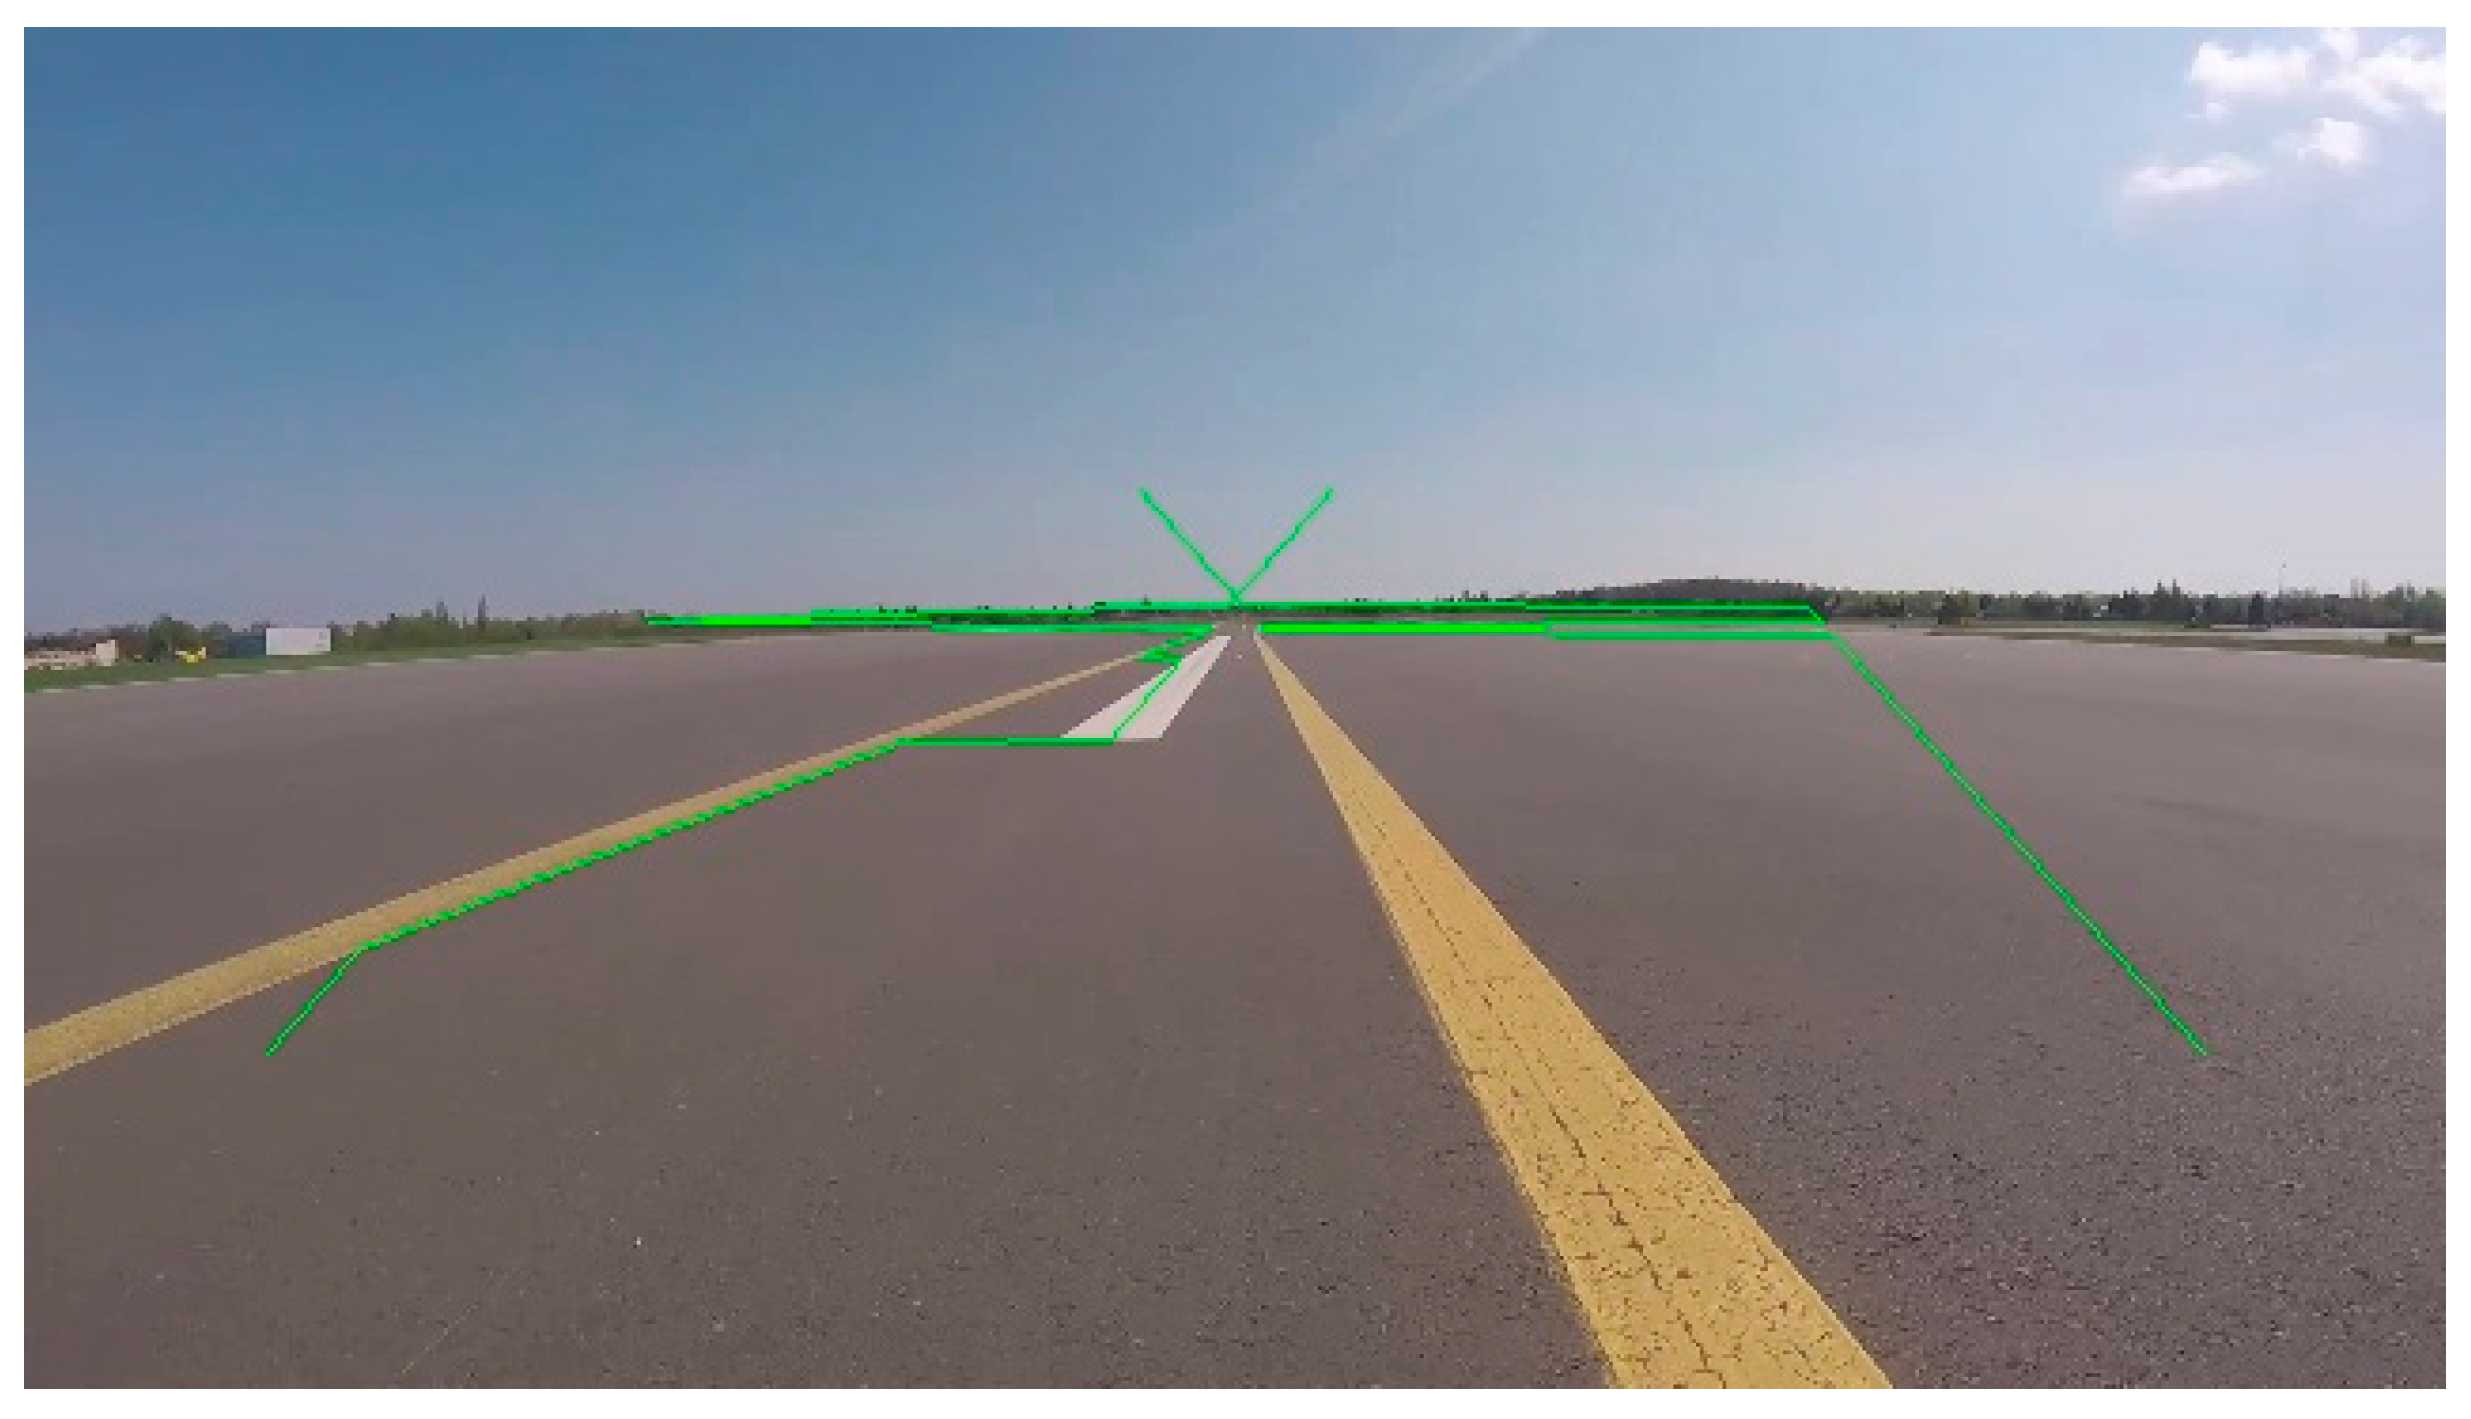
On the contrary, Algorithm 2 works very well in situations where there is one white line (central line) in the frame. The line detection efficiency is also satisfactory for up to two lines in the field of the camera view. This is the result of adapting this algorithm to determining the lane between two lines. The complete problem with detecting any line is especially visible for yellow color, which is largely unrecognized by this algorithm. In this case, fragmentary line detection is noticeable only in turns and at a far distance from the camera (above half the height of the cage), which, from the point of view of using this algorithm to support the approach of the measurement platform to test the quality of the airport lighting, definitely disqualifies it.
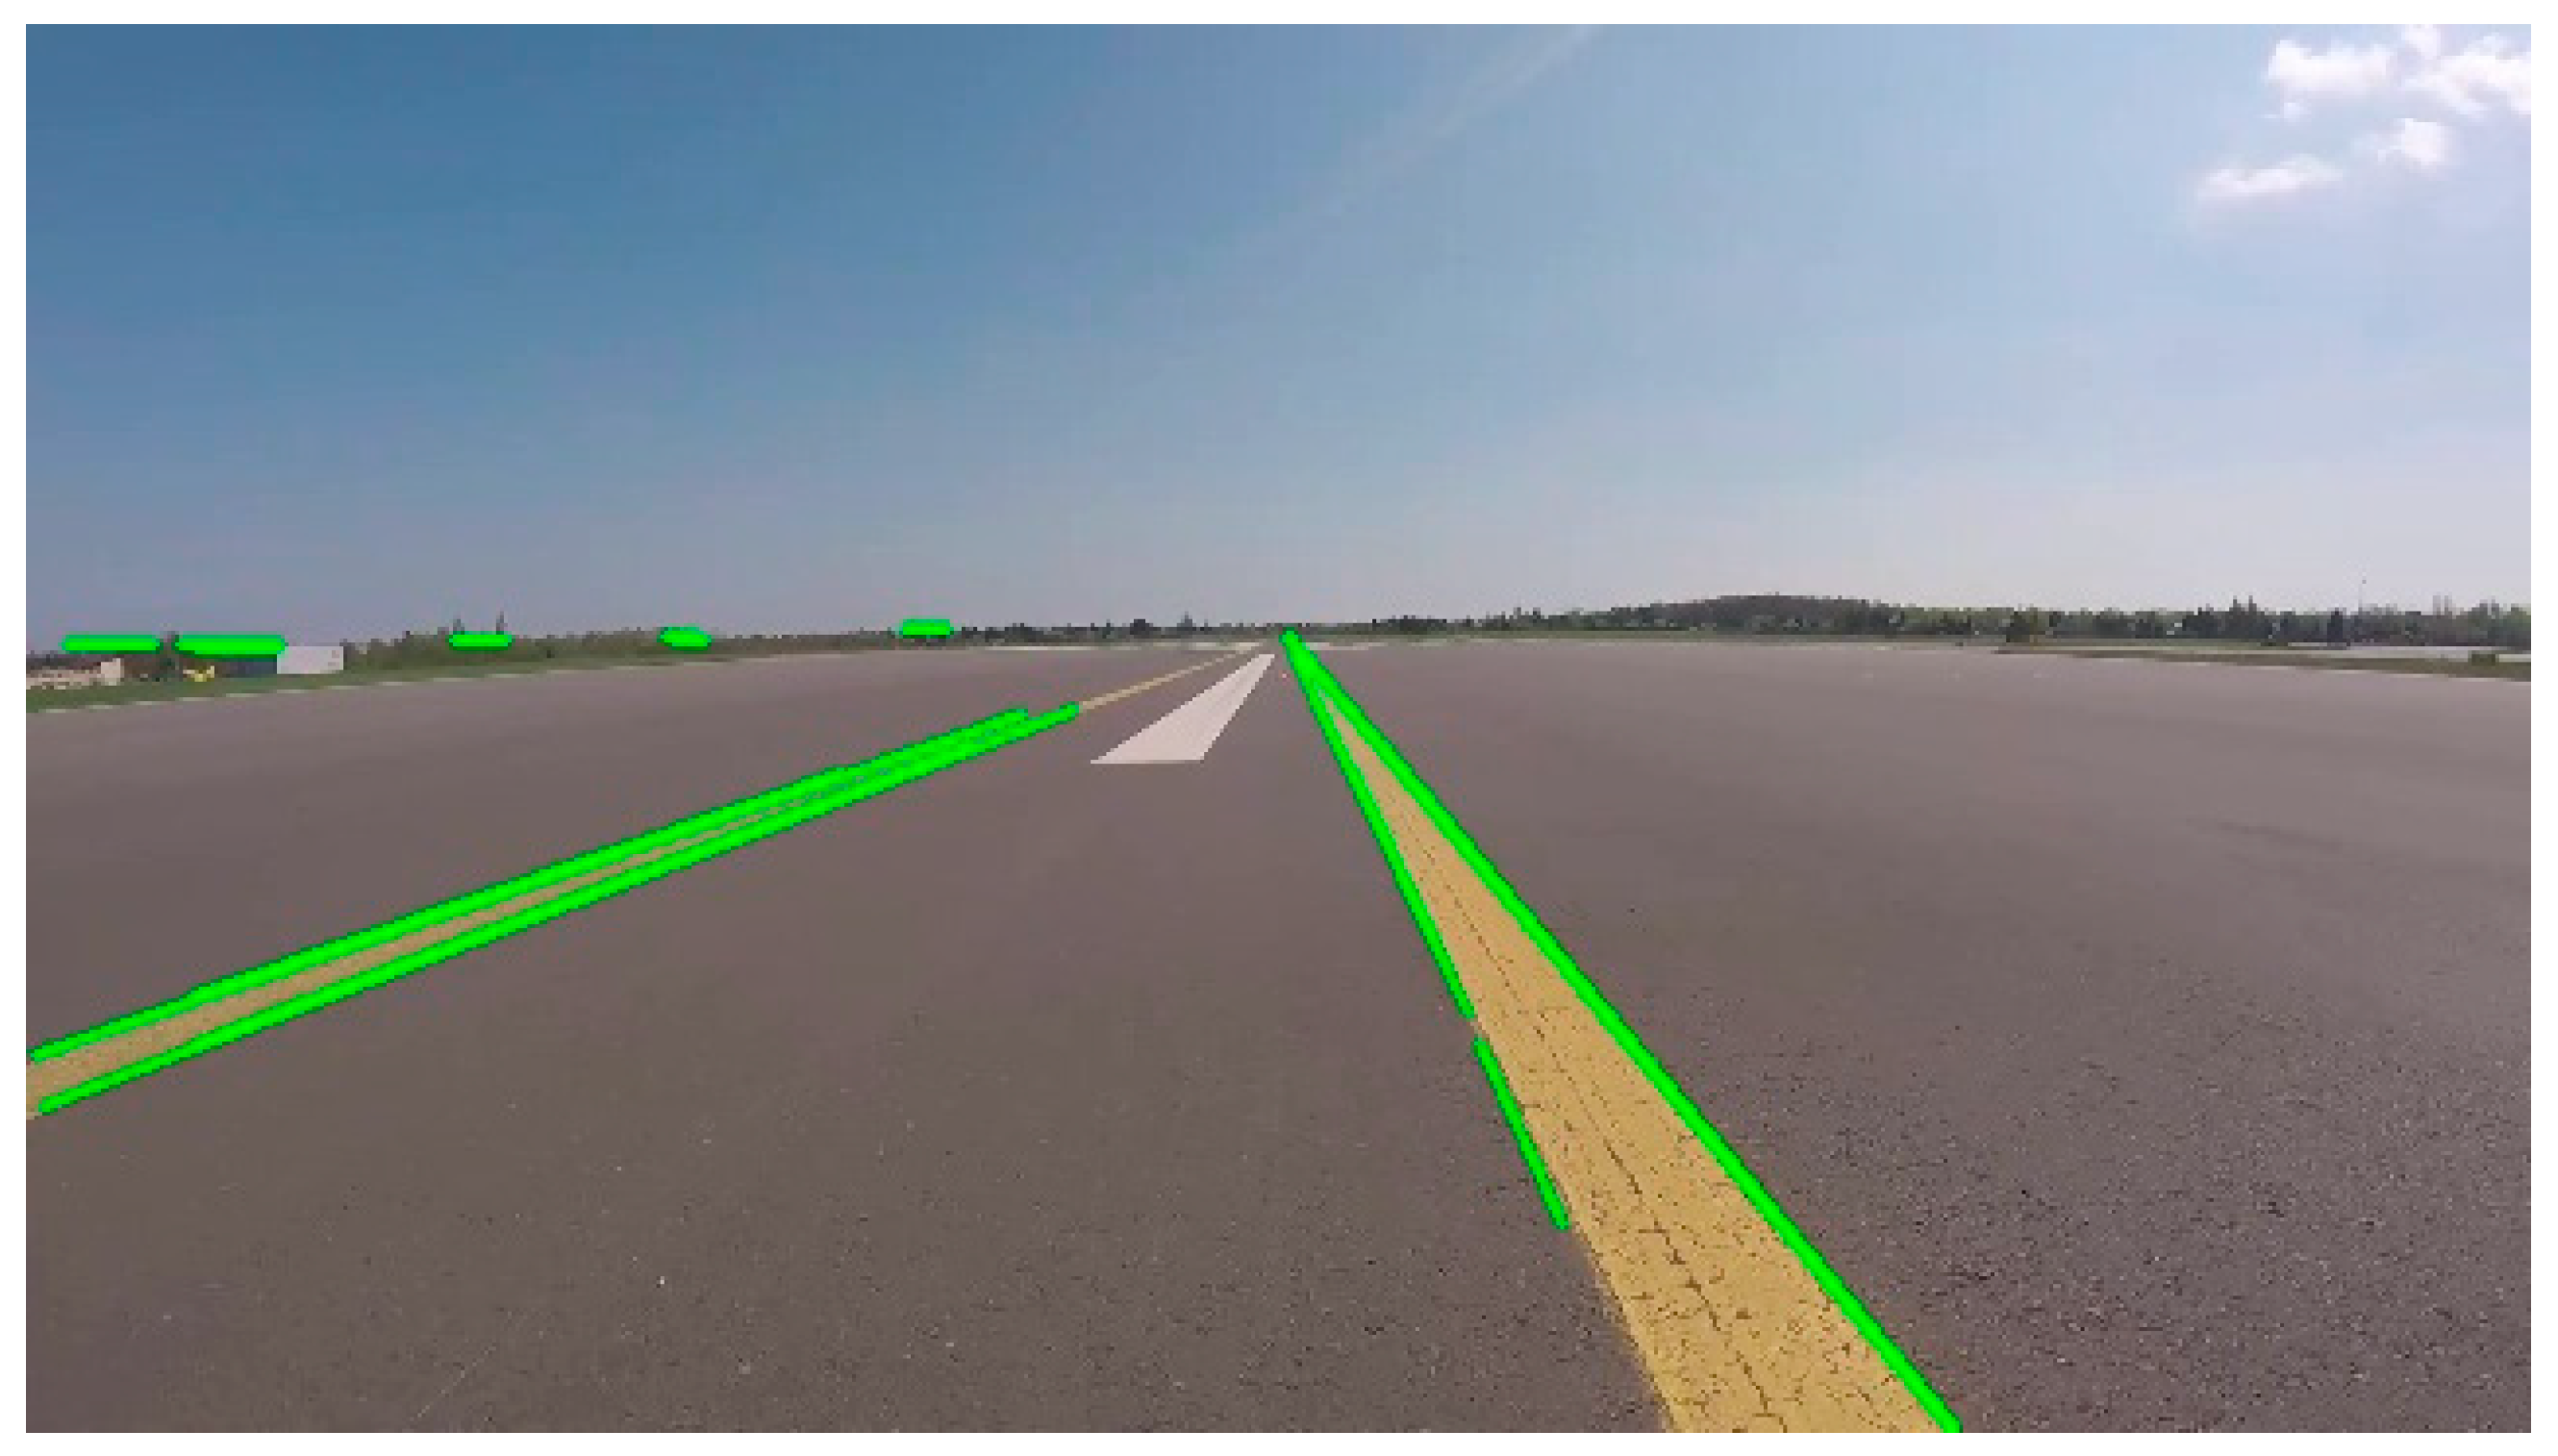
The definite favorite is Algorithm 3, which does a great job of detecting airport plane markings. During testing, it detected almost all edges of all lines visible in the cage in almost every case. This applies to both white and yellow stripes. Admittedly, for higher resolutions, there are noises from nHD upwards, but thanks to the use of color segmentation, they are only inside the outlines of the lines, which does not have any impact on the correct interpretation of the results. These noises are very small edges detected, for example, due to the texture of the surface, which is not perfectly smooth, and thus the line itself is not an area of uniform color or there are even places of no paint. Changing the length parameters of the detected lines could potentially eliminate this problem, but due to the need to identify lines seized by tire rubber in the touchdown zone, this is impossible. Algorithm 3 did the best among those proposed, detecting all lines in this area without any problems.

6.2. Testing the Effectiveness of Individual Algorithms

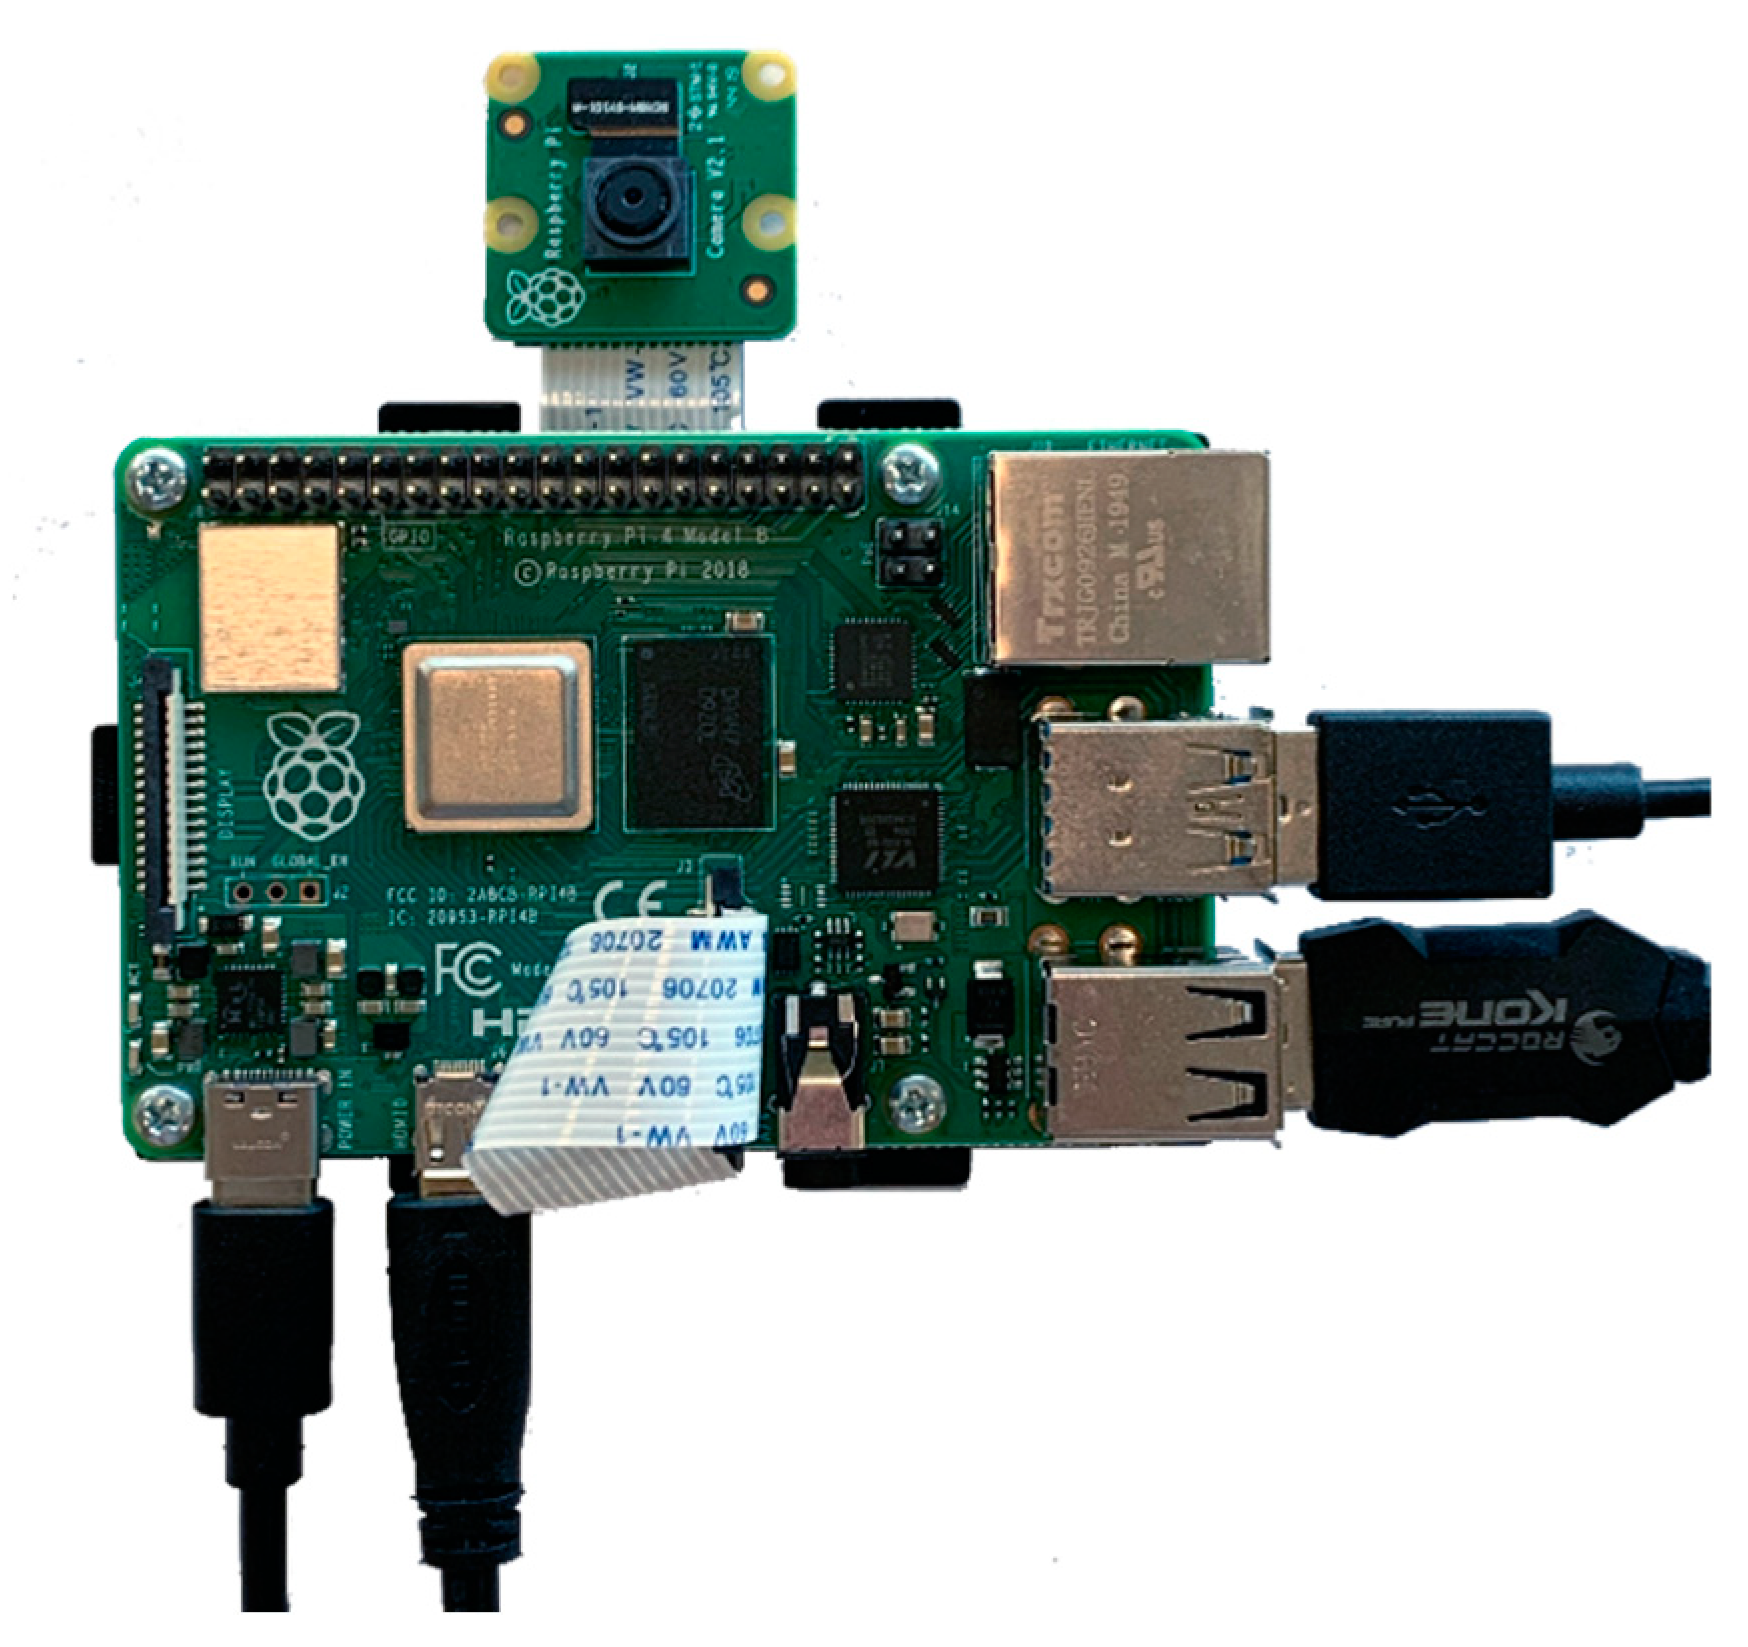
In order to check the performance of individual algorithms depending on the resolution, it was decided to run the programs on various devices: virtual machine with Ubuntu, Raspberry Pi 4 model B (
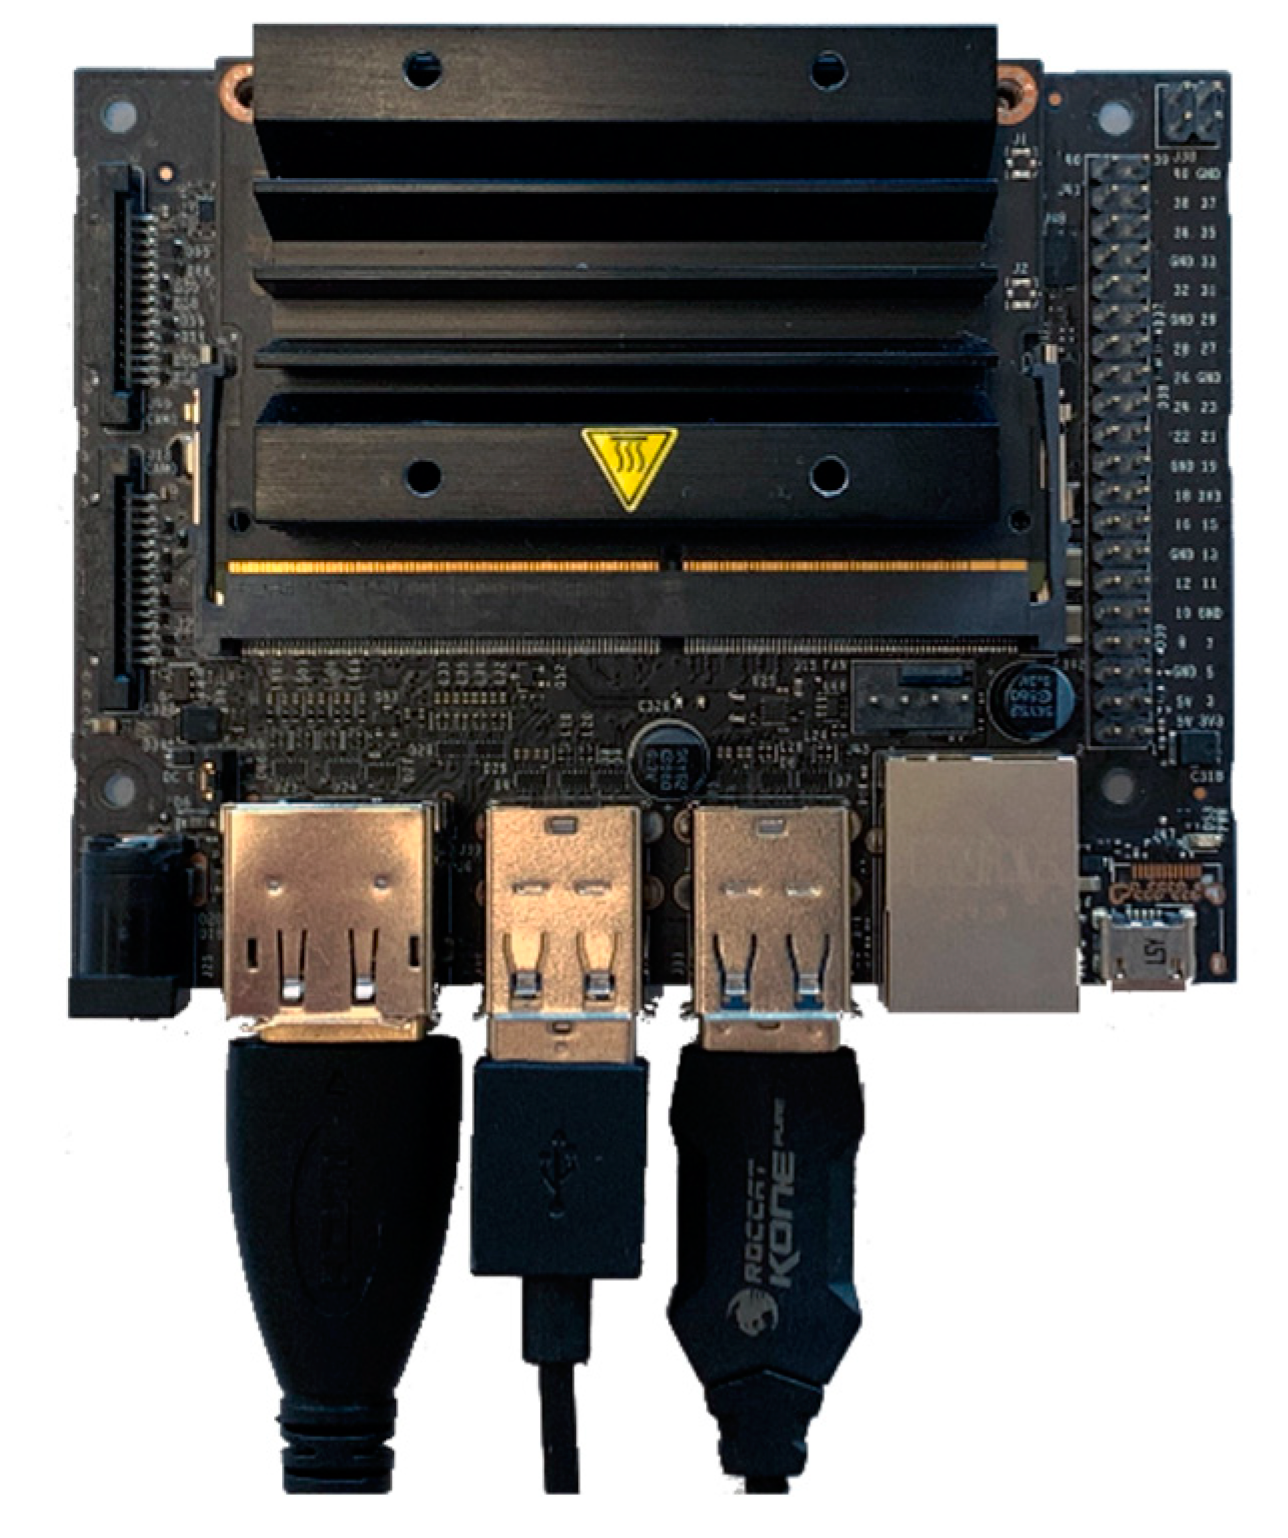
Figure 17) and NVIDIA Jetson Nano (Figure 18) [34,35].
The parameters of the equipment are summarized in Table 1. This test was designed to select a device that can be used in the development of the measurement platform for testing the quality of operation of airport lamps. The main criteria were small size and good performance. To compare the performance of three used devices, benchmarks were carried out using the TTSIOD 3D Renderer algorithm (Phong Rendering With Soft-Shadow Mapping) and PyBench (Total For Average Test Times). In the former, an increase in the FPS value means a better result, and in the latter, an increase in computing time means a worse result. In both cases, a virtual machine performed best; however, it was used to represent a benchmark for workstation performance. Nvidia Jetson Nano, due to the better graphics processor, obtained a better result in TTSIOD 3D Renderer, and the Raspberry Pi 4 model B has a more efficient CPU processor, which was presented in the PyBench benchmark.
f p s ¯ = n T
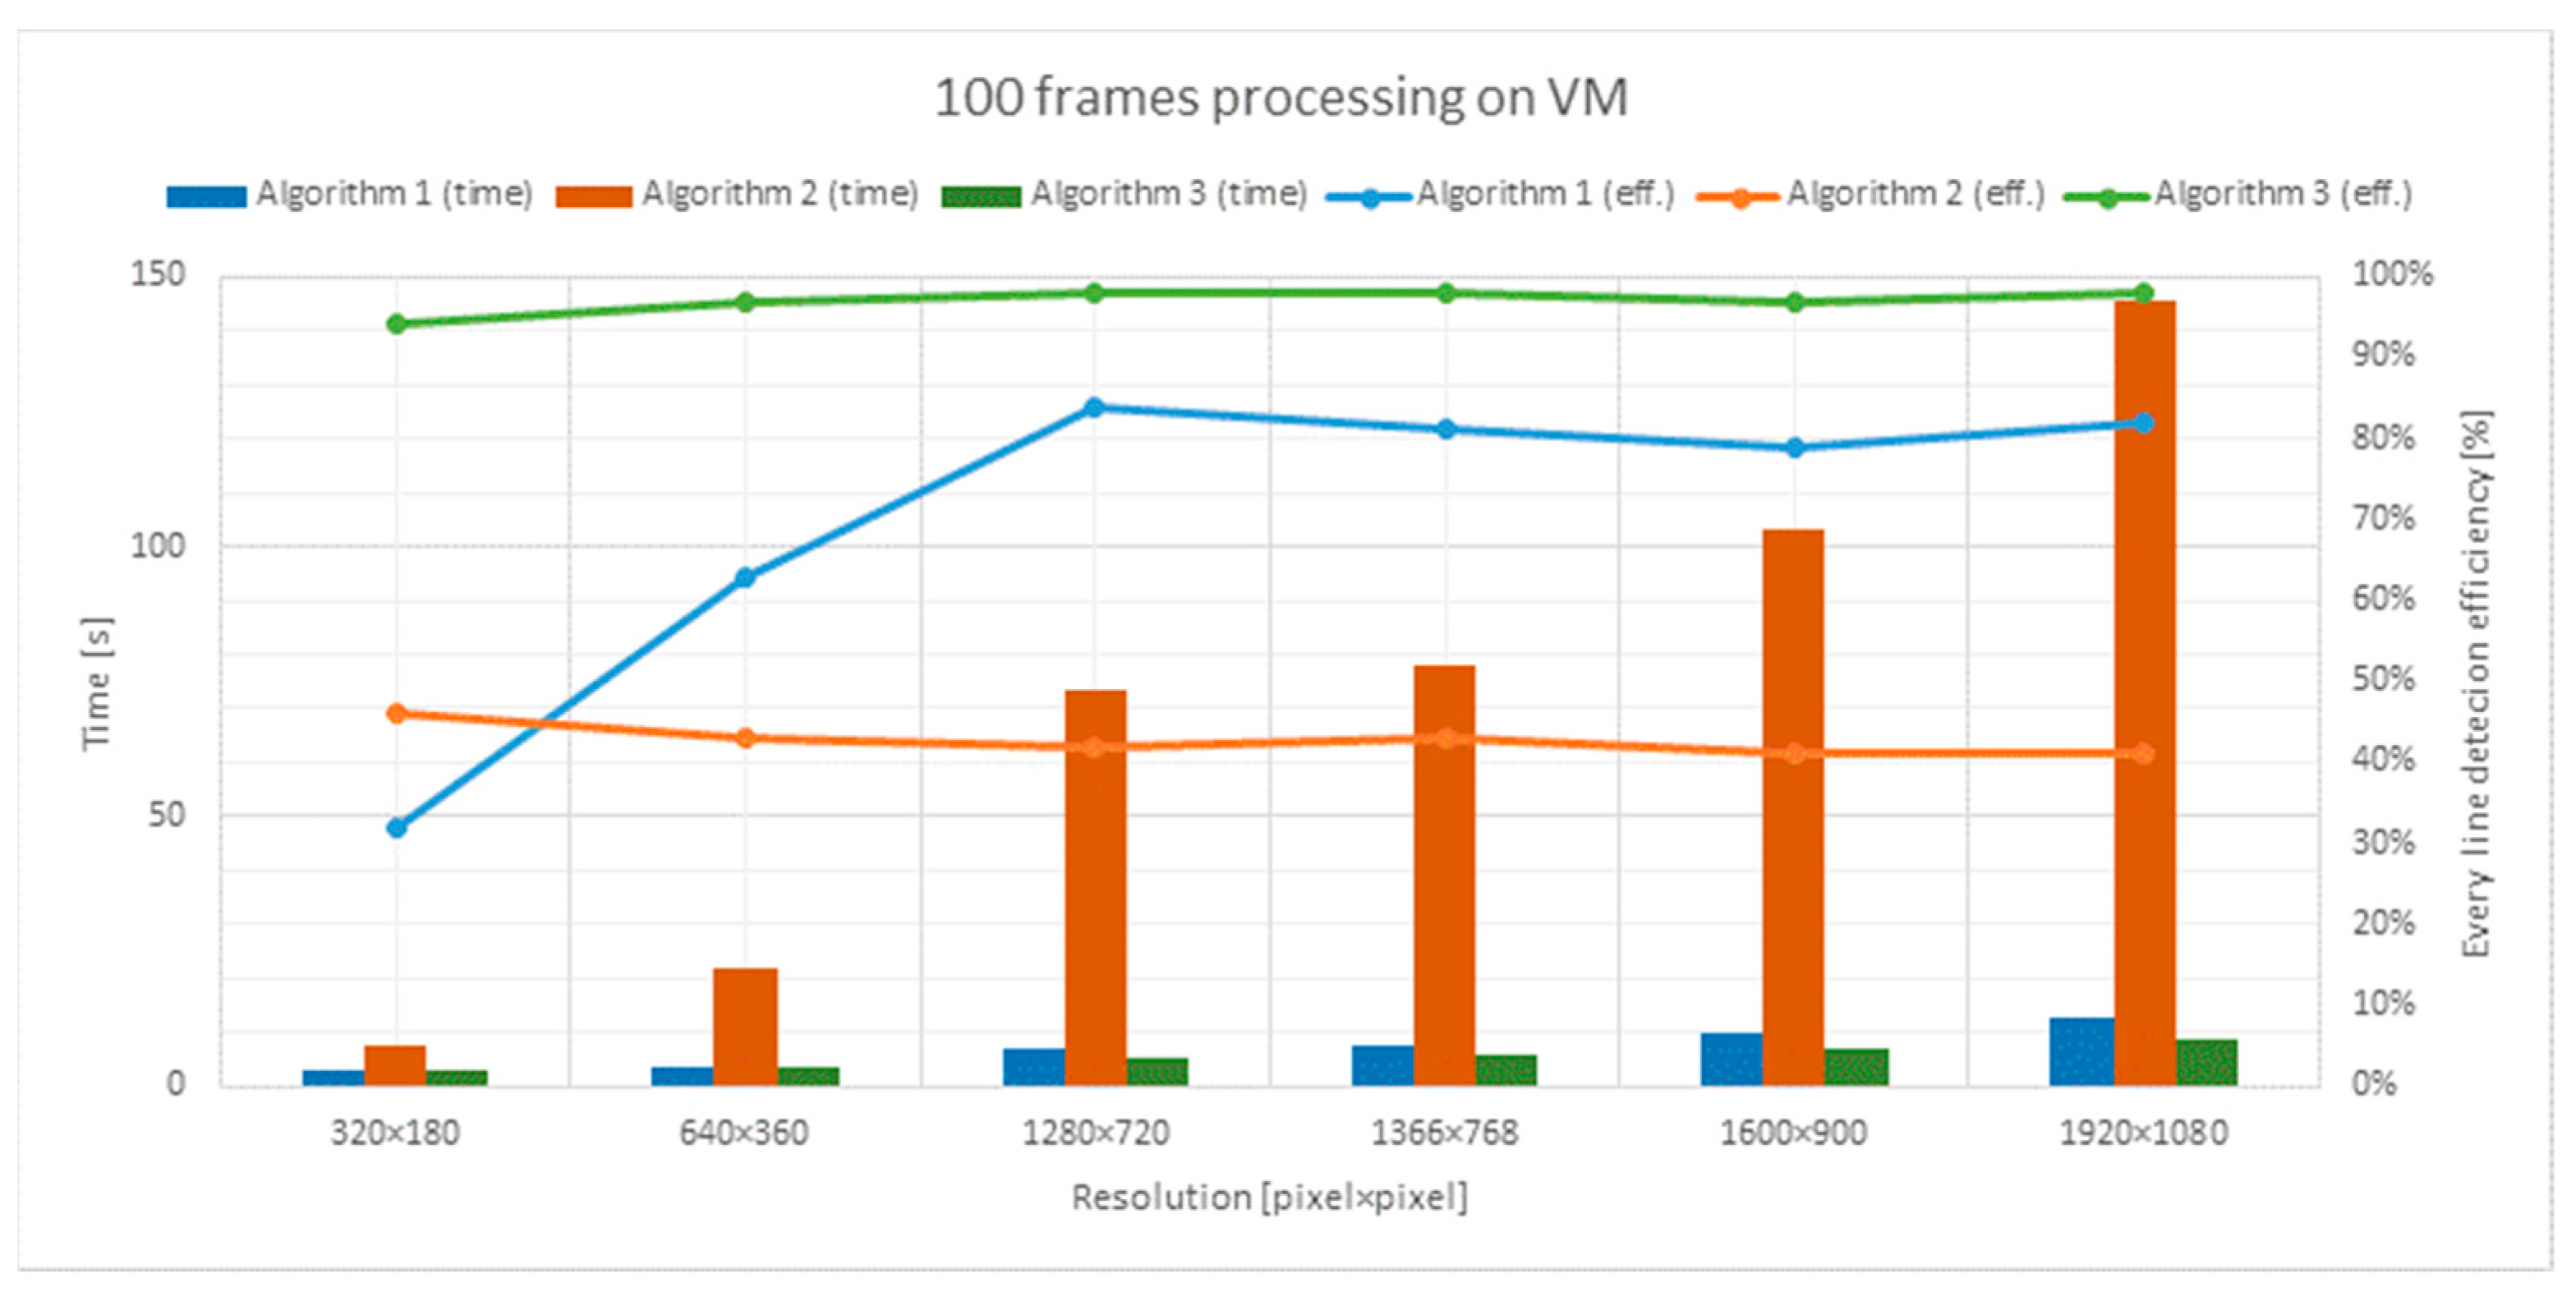
The mean number of frames per second was calculated using Formula (5). The frames per second variable is the result, n is the total number of video frames statistically measured, and T is the total processing time for whole set of n frames done by the algorithm. The dependence of the input frame resolution change on the efficiency of detection of all lines and the program execution time for 100 frames is shown in Figure 19, which includes data obtained in a virtual machine. The conclusion from this analysis is that changing the resolution primarily affects the program execution time, but does not significantly affect the correct line detection for resolutions from WXGA up. The time bar graph shows that the performance of Algorithms 1 and 3 is similar, although Algorithm 3 is advantageous. Algorithm 2, due to the complexity of the computations necessary for image analysis, takes a very long time to complete the line detection task. As expected, program execution time increases with increasing resolution.
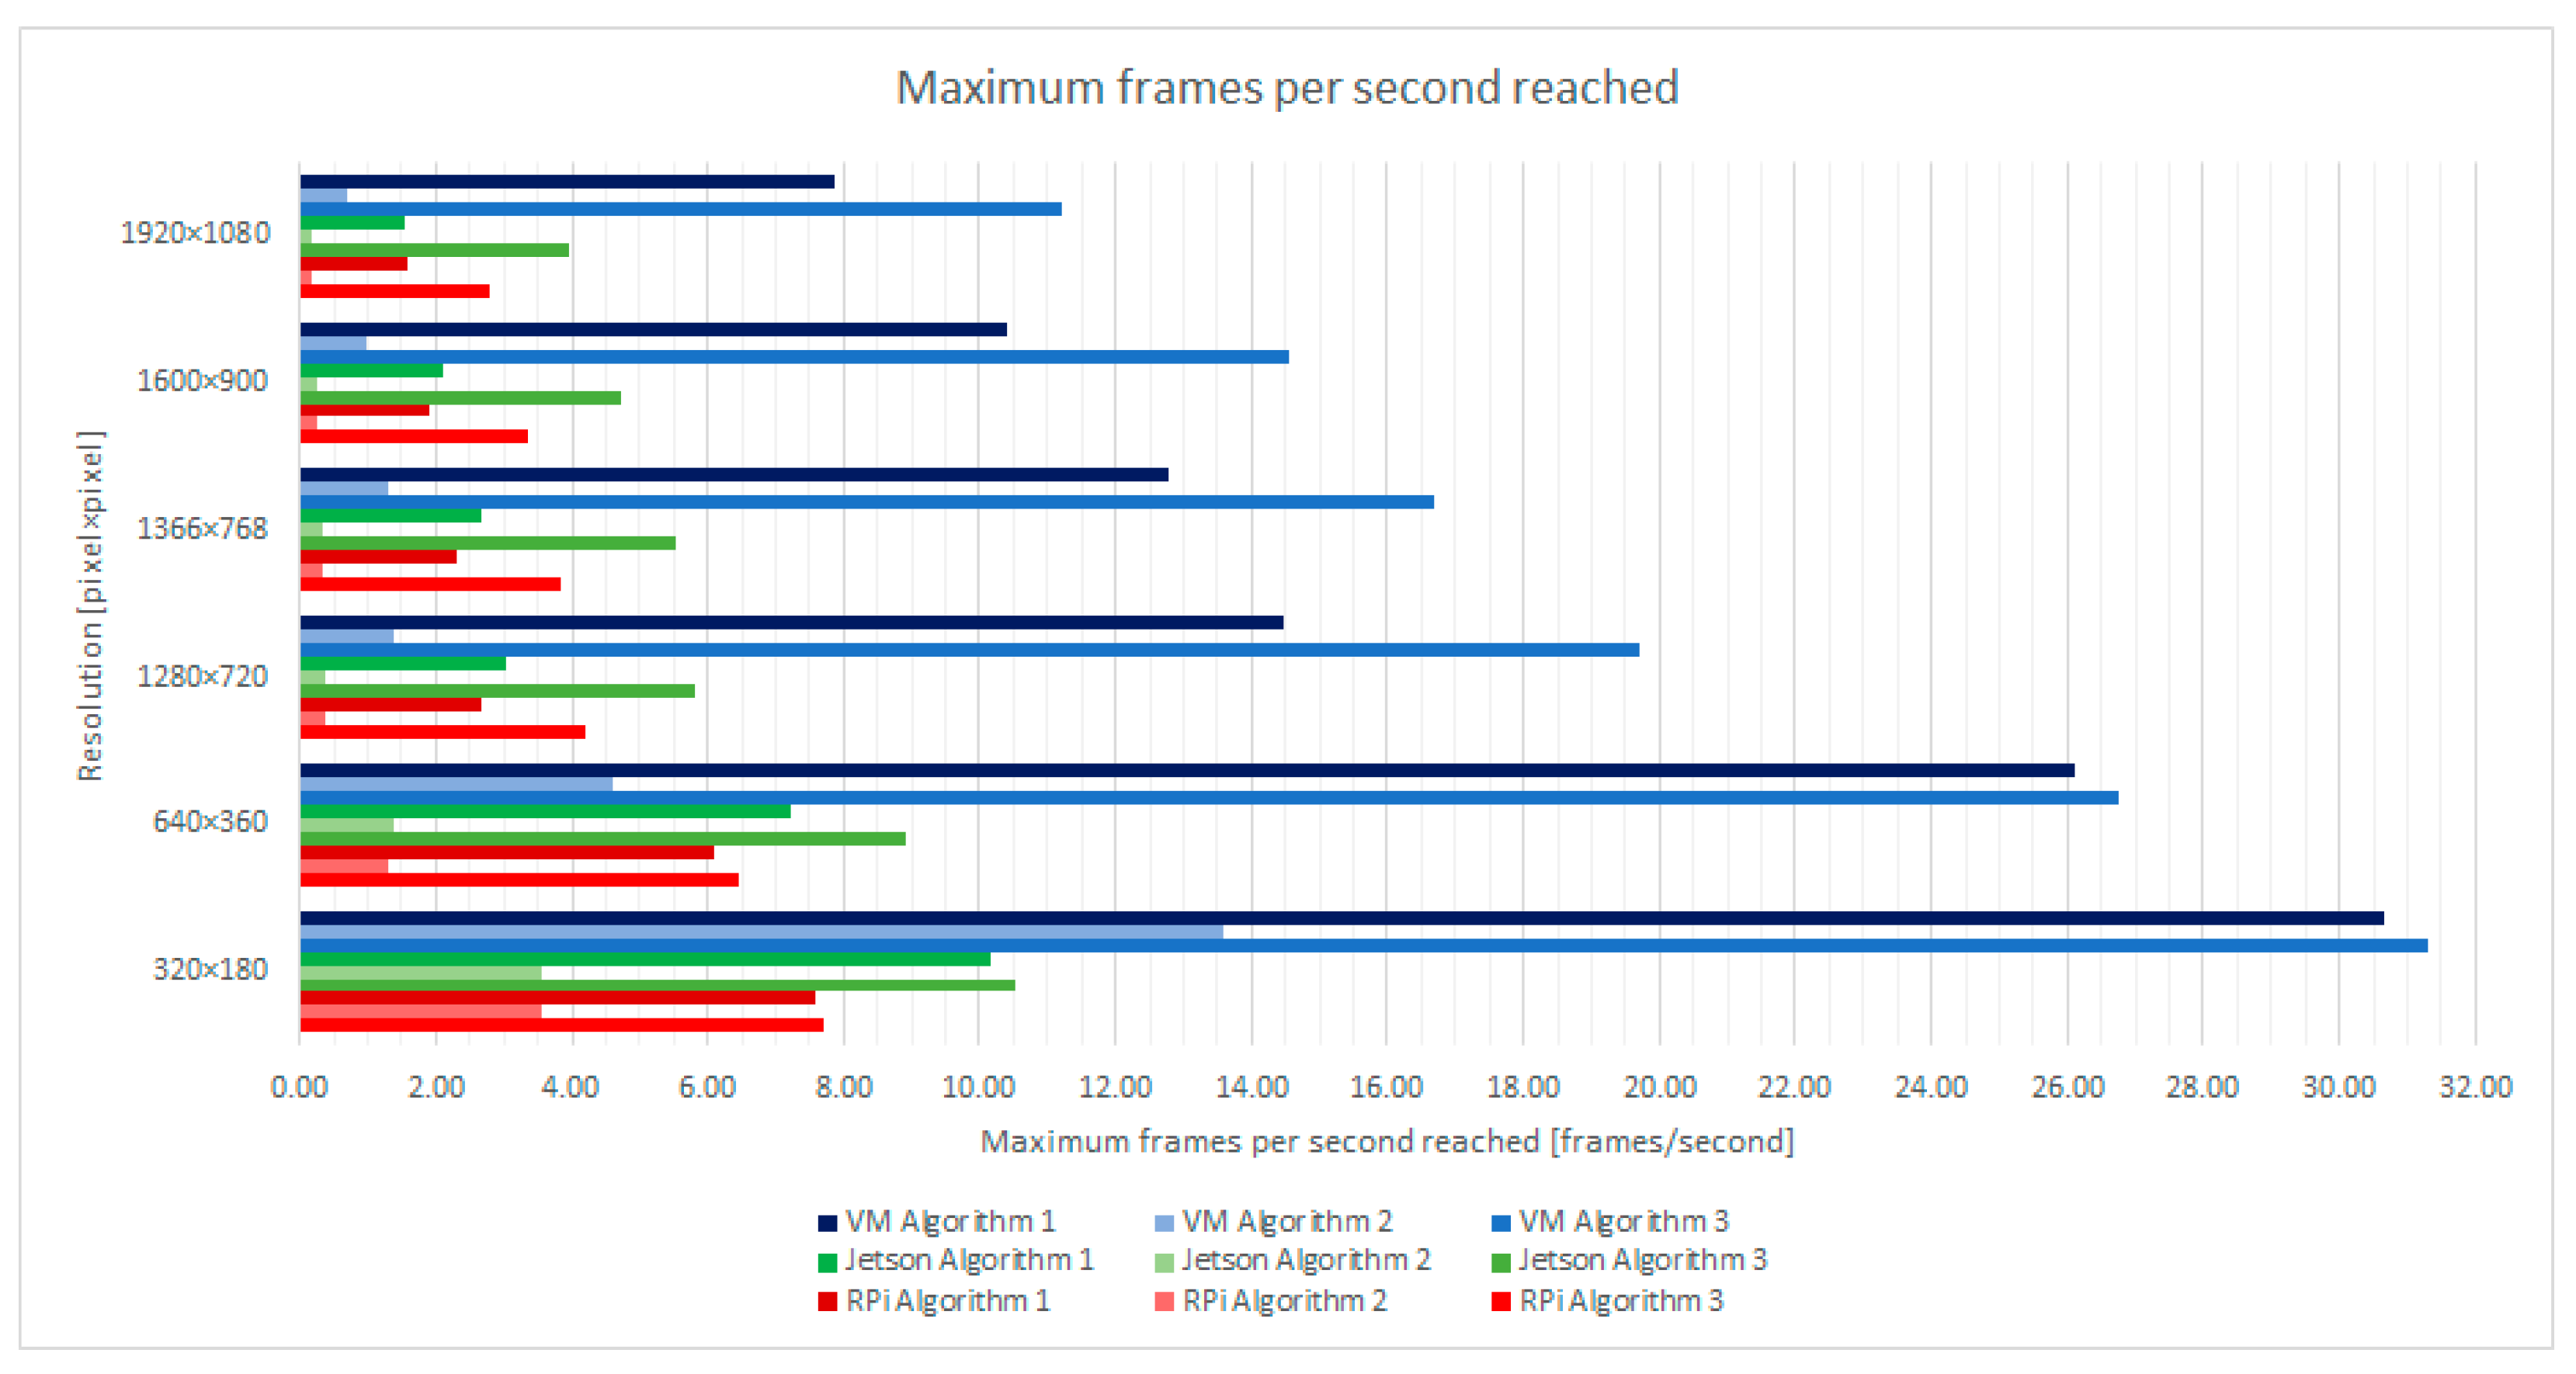
The same observations apply to the hardware issue. The graph showing the dependence of the input frame resolution on the number of frames per second for the tested devices is presented in Figure 20. The weaker the specification, the worse the performance, although it should be noted that both microcomputer modules for small resolutions coped with this task decently for Algorithms 1 and 3. The computing power requirements for Algorithm 2 exceeded them significantly. The best results, over 30 fps, were achieved on the most efficient virtual machine in the list. The NVIDIA Jetson Nano microcomputer has slightly higher performance than the best Raspberry Pi 4 model B currently available on the market.
For the line detection task for the airport performance measurement platform, the best solution is to use Algorithm 3 for nHD resolution using the NVIDIA Jetson Nano microcomputer. Tests have shown that with such a selection of equipment and parameters, it is possible to achieve detection of all lines at the level of 98% while maintaining the processing efficiency of approx. 9 fps. This result is the golden mean in the choice that should be made considering the extension of the airport lamp tester.

7. Conclusions and Future Work

The analysis of the proposed solutions shows that the limitation of the use of individual algorithms is the possibility of their use in embedded systems. Proper driving requires a minimum rate of 10 frames per second, but the high resolution of the image is not the foreground. Studies have shown that the best performance is obtained by the algorithm that uses the Hough transform with appropriately changed images in the preprocessing stage. The main goal reached was the adaptation of algorithms for line detection on public roads in specific, difficult environmental conditions in airport areas and the comparison of their performance.
As a result of the obtained experimental research, the embedded platform based on Nvidia Jetson Nano is characterized by higher efficiency and enables the processing of more frames per second using the proposed tools. Moreover, it seems to be adequate to use Algorithm 3, i.e., based on the change of the color space to HSV and filtering on the basis of the color. With this assumption, this system is able to achieve a performance of 10.5 fps for the smallest resolution, i.e., 320 × 180. The next stage of work is the analysis of the possibility of using neural networks for line detection, as was the case in the examples provided [17]. However, such learning requires adaptation and a much larger database due to the lack of characteristics and the unusual working environment of the airport runway.

Author Contributions

Conceptualization, J.S., K.P. and T.M.; formal analysis, J.S., K.P., T.M. and A.D.; investigation, J.S., K.P. and T.M.; methodology, J.S. and K.P.; software, J.S. and K.P.; supervision, A.D.; validation, J.S. and K.P.; writing—original draft, J.S. and K.P.; writing—review and editing, J.S., K.P., T.M. and A.D. All authors have read and agreed to the published version of the manuscript.

Funding

This research was funded partly by the 2020 subvention and partly with the SMART4ALL EU Horizon 2020 project, Grant Agreement No 872614.

Conflicts of Interest

The authors declare no conflict of interest.

References

  1. Lu, S.; Luo, Z.; Gao, F.; Liu, M.; Chang, K.; Piao, C. A Fast and Robust Lane Detection Method Based on Semantic Segmentation and Optical Flow Estimation. Sensors 2021, 21, 400. [Google Scholar] [CrossRef] [PubMed]
  2. Liu, W.; Yan, F.; Zhang, J.; Deng, T. A Robust Lane Detection Model Using Vertical Spatial Features and Contextual Driving Information. Sensors 2021, 21, 708. [Google Scholar] [CrossRef]
  3. Suder, J.; Maciejewski, P.; Podbucki, K.; Marciniak, T.; Dąbrowski, A. Measuring Platform for Quality Testing of Airport Lamps. Pomiary Autom. Robot. 2019, 23, 5–13. [Google Scholar] [CrossRef] [Green Version]
  4. Podbucki, K.; Suder, J.; Marciniak, T.; Dąbrowski, A. Electronic Measuring Matrix for Testing Airport Lamps. Przegląd Elektrotechniczny 2021, 1, 47–51. [Google Scholar] [CrossRef]
  5. Certification Specifications (CS) and Guideline Material (GM) for Aerodrome Design Edition 3, Annex to Decision No. 2016/027/R of the EASA Executive Director, European Aviation Safety Agency. Available online: https://www.easa.europa.eu/sites/default/files/dfu/Annex%20to%20EDD%202016-027-R%20-%20CS-ADR-DSN%20Issue%203%20%281%29.pdf (accessed on 12 July 2021).
  6. Novak, T.; Dudek, J.; Kolar, V.; Sokansky, K.; Baleja, R. Solution of problems with short lifetime of airfield halogen lamps. In Proceedings of the 2017 18th International Scientific Conference on Electric Power Engineering (EPE), Kouty nad Desnou, Czech Republic, 17–19 May 2017; pp. 1–5. [Google Scholar]
  7. Raggiunto, S.; Belli, A.; Palma, L.; Ceregioli, P.; Gattari, M.; Pierleoni, P. An Efficient Method for LED Light Sources Characterization. Electronics 2019, 8, 1089. [Google Scholar] [CrossRef] [Green Version]
  8. Sitompul, D.-S.-D.; Surya, F.-E.; Suhandi, F.-P.; Zakaria, H. Runway Edge Light Photometry System by Using Drone-Mounted Instrument. In Proceedings of the 2019 International Symposium on Electronics and Smart Devices (ISESD), Badung, Indonesia, 8–9 October 2019; pp. 1–5. [Google Scholar] [CrossRef]
  9. Sitompul, D.-S.-D.; Surya, F.-E.; Suhandi, F.-P.; Zakaria, H. Runway Edge Light Photometry by Vertical Scanning Method Using Drone Mounted Photodiode Array. In Proceedings of the 2019 International Conference on Electrical Engineering and Informatics (ICEEI), Bandung, Indonesia, 9–10 July 2019; pp. 301–305. [Google Scholar] [CrossRef]
  10. Rebai, K.; Achour, N.; Azouaoui, A. Road intersection detection and classification using hierarchical SVM classifier. Adv. Robot. 2014, 28, 929–941. [Google Scholar] [CrossRef]
  11. Cao, L.; Chen, Z.; Yan, L.; Qin, Q.; Zhang, R. A proposed vision and vehicle-to-infrastructure communication-based vehicle positioning approach. J. Intell. Transp. Syst. 2017, 21, 123–135. [Google Scholar] [CrossRef]
  12. Popescu, V.; Nedevschi, S.; Danescu, R.; Marita, T. A Lane Assessment Method Using Visual Information Based on a Dynamic Bayesian Network. J. Intell. Transp. Syst. 2015, 19, 225–239. [Google Scholar] [CrossRef]
  13. Jang, E.S.; Suhr, J.K.; Jung, H.G. Lane Endpoint Detection and Position Accuracy Evaluation for Sensor Fusion-Based Vehicle Localization on Highways. Sensors 2018, 18, 4389. [Google Scholar] [CrossRef] [Green Version]
  14. Vokhidov, H.; Hong, H.G.; Kang, J.K.; Hoang, T.M.; Park, K.R. Recognition of Damaged Arrow-Road Markings by Visible Light Camera Sensor Based on Convolutional Neural Network. Sensors 2016, 16, 2160. [Google Scholar] [CrossRef] [Green Version]
  15. Kim, J. Efficient Vanishing Point Detection for Driving Assistance Based on Visual Saliency Map and Image Segmentation from a Vehicle Black-Box Camera. Symmetry 2019, 11, 1492. [Google Scholar] [CrossRef] [Green Version]
  16. Kyoung-Ho, C.; Soon-Youn, P.; Seong-Hoon, K.; Ki-Sung, L.; Jeong-Ho, P.; Seong-Ik, C.; Jong-Hyun, P. Methods to Detect Road Features for Video-Based In-Vehicle Navigation Systems. J. Intell. Transp. Syst. 2010, 14, 13–26. [Google Scholar] [CrossRef]
  17. Haris, M.; Glowacz, A. Lane Line Detection Based on Object Feature Distillation. Electronics 2021, 10, 1102. [Google Scholar] [CrossRef]
  18. Tian, Y.; Gelernter, J.; Wang, X. Lane Marking Detection via Deep Convolutional Neural Network. Neurocomputing 2018, 280, 46–55. [Google Scholar] [CrossRef] [PubMed]
  19. Lin, H.-Y.; Dai, J.-M.; Wu, L.-T.; Chen, L.-Q. A Vision-Based Driver Assistance System with Forward Collision and Overtaking Detection. Sensors 2020, 20, 5139. [Google Scholar] [CrossRef]
  20. Kim, H.; Kwon, S.; Kim, S. Hyperspectral Image-Based Night-Time Vehicle Light Detection Using Spectral Normalization and Distance Mapper for Intelligent Headlight Control. Sensors 2016, 16, 1058. [Google Scholar] [CrossRef] [PubMed] [Green Version]
  21. Choi, K.; Jung, H.-G.; Suhr, J.-K. Automatic Calibration of an Around View Monitor System Exploiting Lane Markings. Sensors 2018, 18, 2956. [Google Scholar] [CrossRef] [Green Version]
  22. Palafox, P.R.; Betz, J.; Nobis, F.; Riedl, K.; Lienkamp, M. SemanticDepth: Fusing Semantic Segmentation and Monocular Depth Estimation for Enabling Autonomous Driving in Roads without Lane Lines. Sensors 2019, 19, 3224. [Google Scholar] [CrossRef] [Green Version]
  23. Wolters, D.; Koch, R. Precise and Robust Line Detection for Highly Distorted and Noisy Images. In Pattern Recognition; Lecture Notes in Computer Science; Rosenhahn, B., Andres, B., Eds.; Springer: Cham, Switzerland, 2016; Volume 9796. [Google Scholar] [CrossRef]
  24. Bae, G.-H.; Lee, S.-B. A Study on the Evaluation Method of Highway Driving Assist System Using Monocular Camera. Appl. Sci. 2020, 10, 6443. [Google Scholar] [CrossRef]
  25. Gruyer, D.; Belaroussi, R.; Revilloud, M. Accurate lateral positioning from map data and road marking detection. Expert Syst. Appl. 2016, 43, 1–8. [Google Scholar] [CrossRef]
  26. Gang, L.; Zhang, M.; Zhang, L.; Hu, J. Automatic road marking recognition for intelligent vehicle systems application. Adv. Mech. Eng. 2017, 9, 1687814017706267. [Google Scholar] [CrossRef] [Green Version]
  27. Wang, H. Airport Signs and Markings Recognition for Enhanced Runway Incursion Avoidance. 2015. Available online: https://web.stanford.edu/class/ee368/Project_Spring_1415/Reports/Wang_Wang.pdf (accessed on 12 July 2021).
  28. Wang, Y.; Shen, D.; Teoh, E. Lane detection using spline model. Pattern Recognit. Lett. 2000, 21, 677–689. [Google Scholar] [CrossRef]
  29. Chen, Q.; Wang, H. A Real-time Lane Detection Algorithm Based on a Hyperbola-Pair Model. In Proceedings of the 2006 IEEE Intelligent Vehicles Symposium, Meguro-Ku, Japan, 13–15 June 2006; pp. 510–515. [Google Scholar] [CrossRef]
  30. Bertozzi, M.; Broggi, A. GOLD: A Parallel Real-Time Stereo Vision System for Generic Obstacle and Lane Detection. IEEE Trans. Image Process. 1998, 7, 62–81. [Google Scholar] [CrossRef] [PubMed] [Green Version]
  31. Assidiq, A.-A.; Khalifa, O.-O.; Islam, M.-R.; Khan, S. Real time lane detection for autonomous vehicles. In Proceedings of the 2008 International Conference on Computer and Communication Engineering, Kuala Lumpur, Malaysia, 13–15 May 2008; pp. 82–88. [Google Scholar] [CrossRef]
  32. Kwon, T.-H.; Kim, J.-E.; Kim, Y.-H.; Kim, K.-D. Color-Independent Visible Light Communications Based on Color Space: State of the Art and Potentials. Electronics 2018, 7, 190. [Google Scholar] [CrossRef] [Green Version]
  33. DeepPiCar—Part 4: Autonomous Lane Navigation via Open CV. Available online: https://towardsdatascience.com/deeppicar-part-4-lane-following-via-opencv-737dd9e47c96 (accessed on 3 November 2020).
  34. Raspberry Pi (Trading) Ltd. Raspberry Pi 4 model B DATASHEET Release 1. 2019. Available online: https://static.raspberrypi.org/files/product-briefs/Raspberry-Pi-4-Product-Brief.pdf (accessed on 1 July 2021).
  35. NVIDIA Corporation. Data Sheet NVIDIA Jetson Nano System-on-Module. Available online: https://www.realtimes.cn/Uploads/download/JetsonNano_DataSheet.pdf (accessed on 1 July 2021).
Figure 1. Block diagram of proposed electronic measurement system.
Electronics 10 01665 g001
Figure 2. Authors’ measurement platform for testing the quality of the operation of airport lamps.
Electronics 10 01665 g002
Figure 3. A frame from the video sequence (runway center line—white, runway center line lamp—red and white, taxiway center line—yellow).
Electronics 10 01665 g003
Figure 4. Lamps built into airport areas: factory new (a), worn housing but prism in good condition (b), worn housing and prism (c).
Electronics 10 01665 g004
Figure 5. Prisms of lamps built into airport areas: suitable for further use (ac), to be replaced (d).
Electronics 10 01665 g005
Figure 6. A fragment of the runway markings visible in the satellite image of the Poznań Airport, Poland (Google Maps).
Electronics 10 01665 g006
Figure 7. Basic road markings on the runway (a) and taxiway (b).
Electronics 10 01665 g007
Figure 8. Schematic diagram of the program based on line detection using Scharr mask edge detection and Hough transform.
Electronics 10 01665 g008
Figure 9. Result of program based on line detection using Scharr mask edge detection and Hough transform.
Electronics 10 01665 g009
Figure 10. Diagram of program for line detection based on hyperbola fitting.
Electronics 10 01665 g010
Figure 11. Hough transform (a) and image coordinates (b).
Electronics 10 01665 g011
Figure 12. Result of running a program for line detection based on an edge detection algorithm.
Electronics 10 01665 g012
Figure 13. Scheme of program based on line detection algorithm using image segmentation based on colors in HSV color space.
Electronics 10 01665 g013
Figure 14. Result of program based on a line detection algorithm using image segmentation based on colors in HSV space.
Electronics 10 01665 g014
Figure 15. Overall detection efficiency depending on resolution and algorithm used.
Electronics 10 01665 g015
Figure 16. Summary of detection performance details for different resolutions.
Electronics 10 01665 g016
Figure 17. Raspberry Pi 4B microcomputer.
Electronics 10 01665 g017
Figure 18. NVIDIA Jetson Nano Development Kit.
Electronics 10 01665 g018
Figure 19. Result of program based on the line detection algorithm using image segmentation with colors in HSV space.
Electronics 10 01665 g019
Figure 20. Maximum frames per second depending on the device and algorithm.
Electronics 10 01665 g020
Table 1. Parameters of devices used for tests.
Virtual MachineRaspberry Pi 4 Model BNVIDIA Jetson Nano
ProcessorIntel Core i7-7700HQ CPU 2.80–3.8 GHz × 4BCM2711 Cortex A72
Quad Core
1.5 GHz
ARM Cortex A57 1.43GHz
RAM15.6 GB8 GB4 GB
GraphicsSVGA3D (host: NVIDIA GeForce GTX 1050Ti (4096 MB memory)Broadcom VideoCore VIGPU NVIDIA Maxwell 128-core
NVIDIA CUDA
Operating systemUbuntu 18.04.5 LTS 64-bitRaspbian Buster 10Ubuntu 18.04 LTS 64-bit
TTSIOD 3D Renderer
Phong Rendering With Soft-Shadow Mapping
146.04 FPS32.75 FPS41.25 FPS
PyBench
Total For Average Test Times
1345 milliseconds5679 milliseconds7084 milliseconds
Publisher’s Note: MDPI stays neutral with regard to jurisdictional claims in published maps and institutional affiliations.

