Article

An Empirical Performance Evaluation of Multiple Intel Optane Solid-State Drives

School of Computer Science and Engineering, Chung-Ang University, Seoul 06974, Korea
*
Author to whom correspondence should be addressed.
Electronics 2021, 10(11), 1325; https://doi.org/10.3390/electronics10111325
Submission received: 13 April 2021 / Revised: 26 May 2021 / Accepted: 27 May 2021 / Published: 31 May 2021
(This article belongs to the Special Issue Ultra-Intelligent Computing and Communication for B5G and 6G Networks)

Abstract

:
Cloud computing as a service-on-demand architecture has grown in importance over the last few years. The storage subsystem in cloud computing has undergone enormous innovation to provide high-quality cloud services. Emerging Non-Volatile Memory Express (NVMe) technology has attracted considerable attention in cloud computing by delivering high I/O performance in latency and bandwidth. Specifically, multiple NVMe solid-state drives (SSDs) can provide higher performance, fault tolerance, and storage capacity in the cloud computing environment. In this paper, we performed an empirical evaluation study of performance on recent NVMe SSDs (i.e., Intel Optane SSDs) with different redundant array of independent disks (RAID) environments. We analyzed multiple NVMe SSDs with RAID in terms of different performance metrics via synthesis and database benchmarks. We anticipate that our experimental results and performance analysis will have implications for various storage systems. Experimental results showed that the software stack overhead reduced the performance by up to 75%, 52%, 76%, 91%, and 92% in RAID 0, 1, 10, 5, and 6, respectively, compared with theoretical and expected performance.

1. Introduction

Cloud computing is widely used since it provides flexibility to users and increases system utilization [1,2,3]. Clouds, or clusters of distributed computers, provide on-demand resources and services over a network [4]. Cloud computing systems provide various, high-performance, and large-scale clustered storage devices to handle a large amount of data [5]. In addition, emerging Non-Volatile Memory Express (NVMe) technology has garnered considerable attention in cloud and enterprise storage subsystems to deliver higher I/O performance in terms of latency and bandwidth [6,7]. With this development, industries have begun to adopt NVMe SSDs in various places. For example, because of its performance benefits compared with SSDs that use traditional interfaces (e.g., SATA, SAS), cloud platforms (e.g., Cloud Platform [8], Amazon Web Service (AWS) [9]) provide NVMe options for their storage solutions. Table 1 shows a simple benchmark result with Flash-based SATA SSDs, Flash-based NVMe SSDs, and Optane SSDs. We used a Flash-based SATA SSD (Micron CT250MX500SSD1), Flash-based NVMe SSD (Intel P3700), and Optane SSD (Intel Optane 900P). As shown in the table, the Optane SSD outperformed the Flash-based SATA SSD by up to 10 times. The read performance of the Flash-based NVMe SSD was close to that of the Optane SSD; however, the write performance of the Optane SSD outperformed the performance of the Flash-based NVMe SSD. The Optane SSD supports consistent performance on both a buffered and direct I/O path, sequential and random patterns, and even read and write operations. Moreover, the Optane SSD performs in-place updates in 3D XPoint memory that do not incur GC overheads.
In this article, we evaluated and analyzed the performance of Optane SSDs developed by Intel, focusing on the environment of RAID via synthesis and database benchmarks. The Optane SSD has a capacity of 480 GB and a performance of up to 2.5 GB/s for both read and write operations in the case of 512 KB with multiple threads. We compared the performance of Optane SSDs with various RAID schemes, which have different characteristics. Moreover, we analyzed the results of the synthesis and database benchmarks. By doing so, we identified software bottlenecks that were exposed by the rapid storage growth. (This article is an extended version of our paper published in the International Conference on Information Networking (ICOIN’21) in January 2021 [10].)
The contributions of our work are the following: (1) the results of our performance study on a real Optane SSDs array, (2) the performance analysis of the Optane SSD array according to workload behavior to show the feasibility and benefits of the Optane SSD array, and (3) identifying bottlenecks in the storage stack. The rest of this article is organized as follows: Section 2 discusses the background and related work. Section 3 explains the experimental setup. Section 4 evaluates and analyzes the performance using a synthesis benchmark and database benchmark. Section 5 provides the summary and implications of the research. Finally, Section 6 concludes this article.

2. Related Work

2.1. Performance Evaluation of Fast Storage Devices

There have been several research efforts to optimize and evaluate the performance of non-volatile memory storage devices. Some works have optimized and evaluated the file systems and memory management for fast storage devices [6,11,12,13]. Wu et al. [14] analyzed a popular NVM-based block device: the Intel Optane SSD. They formalized the rules that Optane SSD users need to follow. They provided experiments to present the impact when violating each rule and examined the internals of the Optane SSD to provide insights for each rule. The unwritten contract provided implications and pointed to directions for potential research on NVM-based devices. Kim et al. [15] explored the opportunities for PCM technology within enterprise storage systems. They compared the latest PCM SSD prototype to an eMLC Flash SSD to understand the performance characteristics of the PCM SSD as another storage tier, given the right workload mixture. They conducted a modeling study to analyze the feasibility of PCM devices in a tiered storage environment. Xu et al. [7] presented the analysis and characterization of SSDs based on the the Non-Volatile Memory Express standard for storage subsystem. They showed that there was a benefit to be gained from re-architecting the existing I/O stack of the operating system. They also verified the rated, raw performance of the NVMe SSDs using synthetic and DB benchmarks. Son et al. [6] evaluated the NVMe SSD’s performance with micro benchmarks and database workloads in a number of different I/O configurations and compared it with the SATA SSD’s performance. Bhimani et al. [16] investigated the performance effect of increasing the number of simultaneously operating docker containers that were supported by the docker data volume on a stripped logical volume of multiple SSDs.
Our study was in line with these studies in terms of evaluating fast storage devices. In contrast, we focused on evaluating and analyzing the performance of fast storage devices in different RAID schemes.

2.2. Study on Redundant Array of Independent Disks Schemes

There have been many studies on RAID schemes [17,18,19,20]. Menon et al. [17] described their approach that supported compression and cached RAIDS called log-structured arrays (LSA). They gave some performance comparisons of RAID-5 designs that support compression only in the cache (not on disk) versus LSA, which supports compression on disk and in cache. Chen et al. [19] contributed a study of the design issues, the development of mathematical models, and an examination of the performance of different disk array architectures in both small I/O and large I/O environments. Le et al. [20] proposed the analytical model to quantify the reliability dynamics of an SSD RAID array. They compared the reliability dynamics of the traditional RAID-5 schemes and the new Diff-RAID scheme under different error patterns and different array configurations. Our study is similar to these studies in terms of evaluating the RAID environment. In contrast, we focused on evaluating and analyzing the performance of fast storage devices with different RAID schemes.

3. Experimental Setup

3.1. NVMe SSD

Compared with conventional SATA SSDs, the current generation of peripheral component interconnect express (PCIe) Flash SSDs is immensely popular in modern industrial environments due to their higher bandwidth and faster random access [21]. However, PCIe-based SSDs have also used non-standard specification interfaces. For faster adoption and interoperability of PCIe SSDs, industry leaders have defined the NVM Express standard, arguing that standardized drivers reduce verification time. NVMe is a specification for accessing SSDs connected to PCIe buses. It defines optimized register interfaces, command sets, and function sets [6]. These NVM technologies provide significant performance levels for persistent storage. One example is Intel’s 3D XPoint memory [22,23] from Intel and Micron, available on the open market under the brand name Optane [24]. The Optane SSD is based on 3D XPoint memory, which is claimed to provide up to 1000 times lower latency than NAND Flash [23]. The influence of this extremely low-latency and high-bandwidth storage on computing is significant.

3.2. Redundant Array of Independent Disks

Initially, RAID [18] was designed to use relatively inexpensive disks as a disk array due to the rapid increase of CPU and memory performance. However, these RAID schemes have been popular in cloud computing and big data environments because of their characteristics, providing higher fault tolerance, performance, and other benefits [25,26,27].
Moreover, RAID has three main strategies. First, striping divides the flow of data into blocks of a specified chunk size and writes one on RAID. These strategies improve the performance of RAID. Second, mirroring stores the same copy of the requested data simultaneously on a RAID member. These strategies improve fault tolerance and performance. Finally, parity is calculated for a specific parity function for a block of data. The parity strategy recalculates data via the checksum method to provide RAID fault tolerance. In addition, RAID has various characteristics depending on the level. We chose five of the RAID types that are used in general. The selected RAID types are briefly described as follows:
  • Raid 0 provides a striping strategy;
  • Raid 1 provides a mirroring strategy;
  • Raid 5 provides striping with parity;
  • Raid 6 provides striping with double-parity;
  • Raid 10 provides a stripe of mirrors (a combination of RAID 1 and 0).

3.3. Setup

For the experimental setup, we used servers equipped with an Intel(R) Xeon(R) Gold 6242 (2.8 GHz) CPU, which has 64 physical cores and 64 GB of memory. For the storage devices, we used eight Intel Optane SSD 900P (480 GB) with RAID-0, 1, 5, 6, and 10 [18]. Our server had eight PCIe sockets, so we could use up to eight Optane SSDs. We used Linux Kernel 5.4.1, Ubuntu 20.04 LTS, and EXT4 [28] for the filesystem. We evaluated the performance of Optane SSDs in different RAID environments via synthesis and database benchmarks. We used the FIO benchmark [29] for the synthesis benchmark. For the database benchmark, we used DBbench with RocksDB v.6.1.18 and TPC-C [30] with MySQL 5.7 InnoDB [31] to evaluate the Intel Optane SSDs in terms of bandwidth and latency. Note that all experimental results were the average of five runs.
Table 1 shows the baseline performance of a single Intel Optane SSD via the FIO benchmark. The configuration of the FIO benchmark is explained in Section 4.1. As shown in Table 1, no significant difference existed in performance across the direct I/O, buffered I/O, read operation, and write operation. Note that the maximum throughput of the Intel Optane SSD 900P was 2.5 GB/s for sequential read and 2.4 GB/s for sequential write in the case of direct I/O, respectively. The maximum throughput of buffered I/O was 2.5 GB/s for sequential read and 2.4 GB/s for sequential write.

4. Experiment

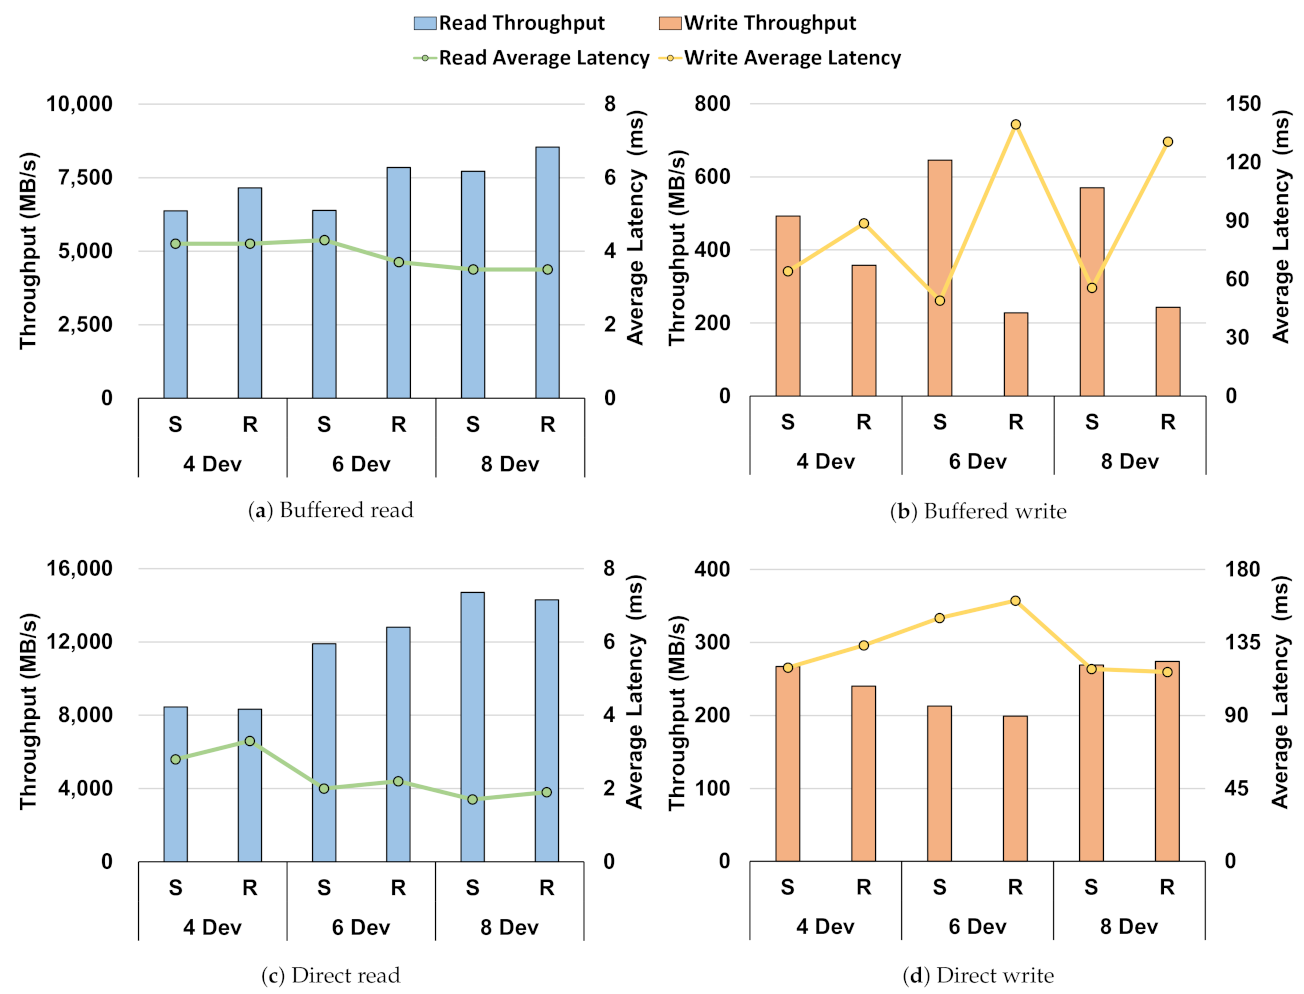
4.1. Synthesis Benchmark

As mentioned earlier, we used the FIO benchmarking tool as the synthesis benchmark. We executed 64 threads that wrote 4 GB files each with a 512 KB block size, the default chunk size for RAID using the FIO benchmark. We evaluated both buffered and direct I/O to analyze different paths of I/O.
Figure 1 shows the throughput and the latency for different numbers of devices in a RAID 0-level environment for different options. Theoretically, when constructing RAID 0 with N devices, the capacity of RAID 0 is ( N × o n e d e v i c e c a p a c i t y ), the expected write performance is ( N × w r i t e p e r f o r m a n c e o f o n e d e v i c e ), and the expected read performance is ( N × r e a d p e r f o r m a n c e o f o n e d e v i c e ). Figure 1a shows experimental results with the buffered read operation. In this configuration, no significant difference existed in the read performance between random and sequential access patterns. Moreover, the read throughput increased and the latency decreased as the number of devices increased. As shown in the figure, the read performance of RAID 0 showed up to 4.8 GB/s, 7.2 GB/s, 8.1 GB/s, and 9 GB/s in the case of 2, 4, 6, and 8 devices, respectively. This result was because the RAID 0 level uses a striping strategy, as mentioned, resulting in improved performance as the number of devices increases. However, the read throughput was still lower than the expected read performance of RAID 0. Figure 1b shows experiment results with the buffered write operation. As shown in the figure, the write performance according to the number of devices was similar. Even if the number of devices increased, no significant difference existed in the write performance. There was also no significant performance difference between sequential and random writes.
Figure 1c shows experimental results with the direct read operation. As shown in the figure, the performance increased as the number of devices increased. The read performance showed up to 5.1 GB/s, 9.9 GB/s, 12.4 GB/s, and 16.5 GB/s in the case of 2, 4, 6, and 8 devices, respectively. Figure 1d shows experimental results with the direct write operation. As shown in the figure, the write performance also increased as the number of devices increased. The write performance improved from 4.5 GB/s for two devices to 16.9 GB/s for eight devices. Since the direct I/O bypasses the Linux kernel page caching layer, it can reduce the influence of the OS. With less influence of the OS, direct I/O performance outperformed buffered I/O performance. Moreover, the direct I/O performance was close to the expected performance of RAID 0.
Figure 2 show the throughput and the latency for different numbers of devices in a RAID 1-level environment with different options. Theoretically, when constructing RAID 1 with N devices, the capacity of RAID 1 is ( 1 × o n e d e v i c e c a p a c i t y ), the expected write performance is ( 1 × w r i t e p e r f o r m a n c e o f o n e d e v i c e ), and the expected read performance is ( N × r e a d p e r f o r m a n c e o f o n e d e v i c e ). Figure 2a shows experimental results with the buffered read operation. In this scheme, the performance of sequential reads was similar to that of random reads. It also shows that the read throughput increased and the latency decreased as the number of devices increased. As shown in the figure, the read performance of RAID 1 showed up to 4 GB/s, 6.8 GB/s, 7.1 GB/s, and 7.7 GB/s in the case of 2, 4, 6, and 8 devices, respectively. This outcome was because the RAID 1 level used a mirroring strategy as mentioned above, resulting in improved read performance as the number of devices increased. Figure 2b shows experimental results with the buffered write operation. The write performance of two devices was lower than that of a single device (1.7 GB/s). Furthermore, the performance did not change even if the number of devices increased (1.5 GB/s for eight devices). As the write operations were conducted using a mirroring strategy, the data were written to one device, and the copies of the data were written to all other devices. Even though this mirroring strategy reduced the write performance, the strategy increased the fault tolerance and read performance.
Figure 2c shows experimental results with the direct read operation. As shown in the figure, the read performance increased as the number of devices increased. The read performance showed up to 5.1 GB/s, 9.8 GB/s, 13.3 GB/s, and 15.2 GB/s in the case of 2, 4, 6, and 8 devices, respectively. The read performance of direct I/O was significantly higher than that of the buffered read. However, the read performance of direct I/O did not reach the expected read performance of RAID 1.
Figure 2d shows experimental results with the direct write operation. As Figure 2b, the write performance did not increase as the number of devices increased. The write performance showed 2.3 GB/s for two devices to 1.9 GB/s for eight devices. Since the copies of the data were written to all other devices, the write performance decreased slightly as the number of devices increased. In the case of the write performance, we could not observe the upper-bound of the performance. Since the mirroring strategy used one data device and other devices to mirror devices, RAID 1 could not reach the upper-bound of the buffered I/O write performance (4.2 to 4.6 GB/s in Figure 1).
Figure 3 shows the throughput and the latency for different numbers of devices in a RAID 10-level environment with different options. Theoretically, when constructing RAID 10 with N devices, the capacity of RAID 10 is ( N × o n e d e v i c e c a p a c i t y ÷ 2 ), the expected write performance is ( N × w r i t e p e r f o r m a n c e o f o n e d e v i c e ÷ 2 ), and the expected read performance is ( N × r e a d p e r f o r m a n c e o f o n e d e v i c e ). Note that RAID 10 requires a combination of RAID 0 and 1; therefore, RAID 10 included at least four devices. Thus, we configured the number of devices as 4, 6, and 8 devices.
Figure 3a shows experimental results with the buffered read operation. As shown in the figure, the read performance showed up to 7 GB/s, 8.3 GB/s, and 8.3 GB/s in the case of 4, 6, and 8 devices, respectively. Contrary to expectations, the read performance did not scale enough as the number of devices increased. The results were similar to RAID 1’s buffered read result. Figure 3b shows experimental results with the buffered write operation. From the experimental results, the write performance was affected by the redundant write operations of the RAID 1 scheme. The write performance of RAID 10 was very similar to that of RAID 1 in terms of throughput and latency. The write performance did not increase as the number of devices increased.
Figure 3c shows the experimental results with the direct read operation. As shown in the figure, the read performance showed up to 9.0 GB/s, 10.9 GB/s, and 13.9 GB/s in the case of 4, 6, and 8 devices, respectively. The read performance of direct I/O was higher than that of the buffered read performance. Since the RAID 10 scheme was nested and consisted of RAID 0 and 1, the read performance showed results similar to RAID 1 and RAID 0. The experimental results revealed that the read performance was affected by the overhead from the page cache (as the results of the RAID 0 and 1 schemes).
Figure 3d shows the experimental results with the direct write operation. As shown in the figure, the write performance showed up to 4.4 GB/s, 6.4 GB/s, and 7.9 GB/s in the case of 4, 6, and 8 devices, respectively. Compared to Figure 3b, we could observe differences in the performance between buffered write and direct write. The write performance of buffered I/O showed results similar to RAID 1; however, the write performance of direct I/O showed results similar to RAID 0.
Figure 4 shows the throughput and the latency for different numbers of devices in a RAID 5-level environment with different options. Theoretically, when constructing RAID 5 with N devices, the capacity of RAID 5 is ( ( N 1 ) × o n e d e v i c e c a p a c i t y ) , the expected write performance is ( ( N 1 ) × w r i t e p e r f o r m a n c e o f o n e d e v i c e ÷ 4 ) , and the expected read performance is ( ( N 1 ) × r e a d p e r f o r m a n c e o f o n e d e v i c e ) . Figure 4a shows experimental results with the buffered read operation. In this scheme, the performance of the random read was higher than the performance of sequential reads. Moreover, the read throughput increased and the latency decreased as the number of devices increased. As shown in the figure, the read performance of RAID 5 showed up to 6.1 GB/s, 7 GB/s, 8 GB/s, and 8.7 GB/s in the case of 3, 4, 6, and 8 devices, respectively. Note that RAID 5 should include at least three devices. Thus, we configured the number of devices as 3, 4, 6, and 8 devices.
Figure 4b shows experimental results with the buffered write operation. The write performance for all the cases in RAID 5 was significantly lower than that of a single device. The write performance of RAID 5 showed up to 499 MB/s, 611 MB/s, 750 MB/s, and 672 MB/s in the case of three, 4, 6, and 8 devices, respectively. This was because the write operation was performed with block-interleaved distributed parity. This scheme needs to perform the parity operations to increase fault tolerance for every write operation, and the computational results are also stored on other devices. This result demonstrated that these operations can significantly reduce the performance.
Figure 4c shows the experimental results with the direct read operation. Similar to the previous experimental results (RAID 0, 1, and 10), the read performance increased as the number of devices increased. The difference in the read performance between buffered I/O and direct I/O was also similar to previous experiments.
Figure 4d shows the experimental results with the direct write operation. The write performance showed up to 329 MB/s, 321 MB/s, 342 MB/s, and 384 MB/s in the case of 3, 4, 6, and 8 devices, respectively. For the write performance, the direct write performance was lower than that for the buffered write. Since the RAID 5 write operation was performed with block-interleaved distributed parity, RAID 5 should calculate the parity when processing the write operation. Buffered I/O uses the page cache, which can accelerate the parity calculation by the page hit. Thus, for the parity strategy, the buffered write can outperform the direct write.
With the results of Figure 1, Figure 2 and Figure 3, the performance of direct I/O was significantly higher than that of buffered I/O even if, in the general cases, the buffered I/O performance was higher than the direct I/O [32]. According to our observation, a page caching issue occurred within the Linux kernel. Therefore, as the issue did not depend on the file system, when direct I/O was used, page cache overhead could be avoided since direct I/O bypassed the page cache.
Figure 5 shows the throughput and the latency for different numbers of devices in a RAID 6-level environment with different options. Theoretically, when constructing RAID 6 with N devices, the capacity of RAID 6 is ( ( N 2 ) × o n e d e v i c e c a p a c i t y ) , the expected write performance is ( ( N 2 ) × w r i t e p e r f o r m a n c e o f o n e d e v i c e ÷ 6 ) , and the expected read performance is ( ( N 2 ) × r e a d p e r f o r m a n c e o f o n e d e v i c e ). Note that RAID 6 should include at least four devices. Thus, we configured the number of devices as 4, 6, and 8 devices. Figure 5a shows experimental results with the buffered read operation. As shown in the figure, the read performance of RAID 6 showed up to 7.1 GB/s, 7.8 GB/s, and 8.5 GB/s in the case of 4, 6, and 8 devices, respectively.
Figure 5b shows experimental results with the buffered write operation. The write performance for all cases in RAID 6 was significantly lower than that for the single device write performance similar to RAID 5. The write performance of RAID 6 showed up to 493 MB/s, 646 MB/s, and 570 MB/s in the case of 4, 6, and 8 devices, respectively, because the write operation was performed by striping with double-parity. Each write operation in this scheme must read the data, read the first parity, read the second parity, write the data, write the first parity, and then, finally, write the second parity.
Figure 5c,d show experimental results with the direct read operation. For direct I/O, the results were very similar to RAID 5 in terms of throughput and latency. As shown in the figure, the read performance of RAID 6 showed up to 8.4 GB/s, 12.8 GB/s, and 14.7 GB/s, and the write performance showed up to 267 MB/s, 213 MB/s, and 274 MB/s in the case of 4, 6, and 8 devices, respectively. The difference in performance was similar to the experimental results for RAID 5. As mentioned above, the direct write performance was lower than the buffered write performance due to page caching.

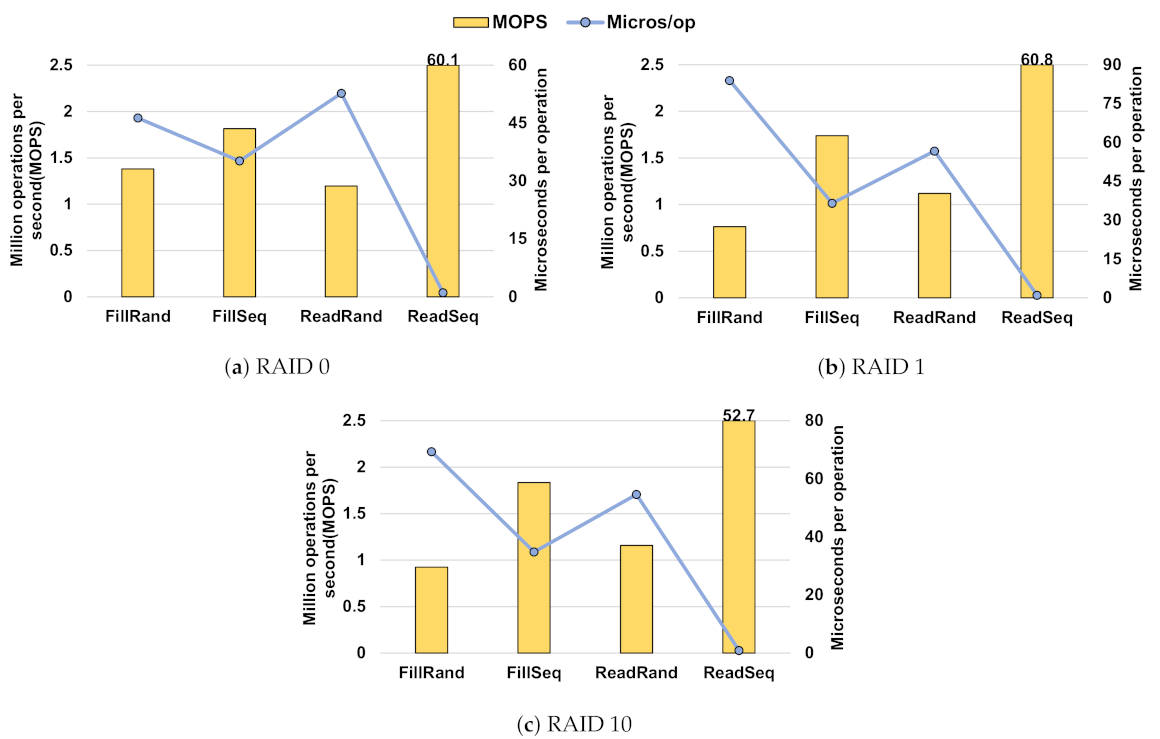
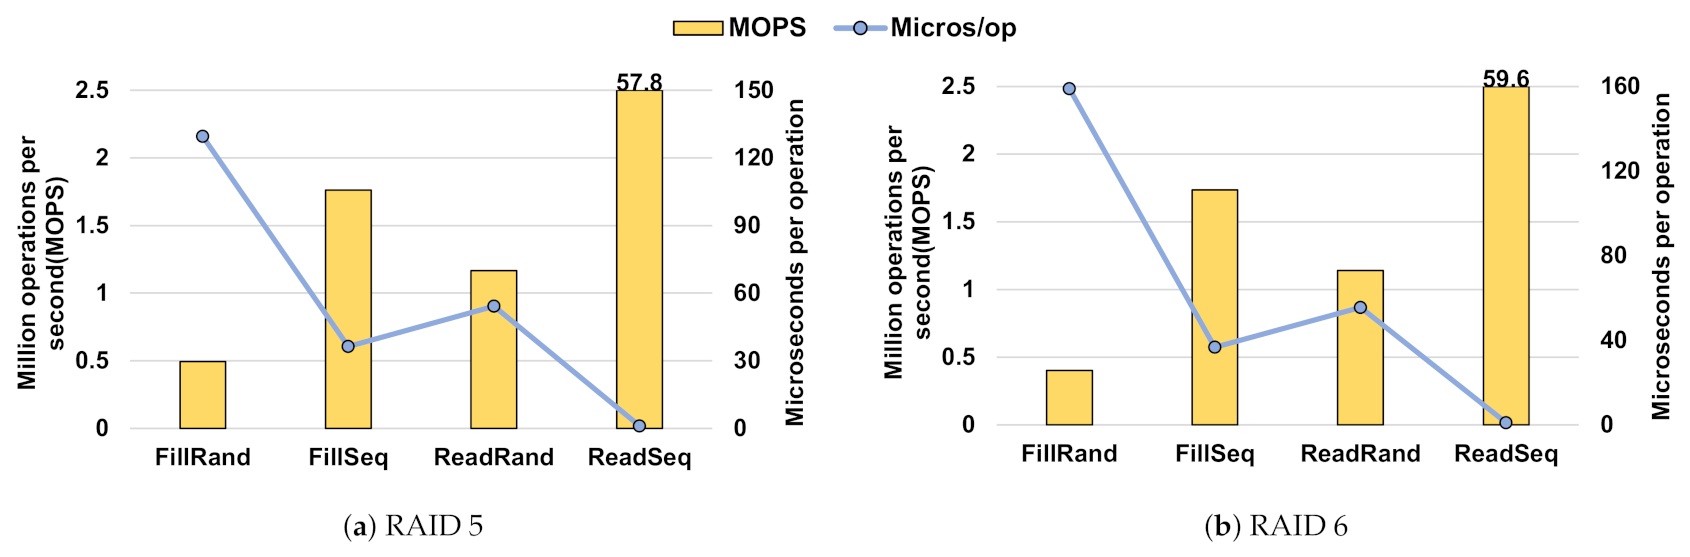
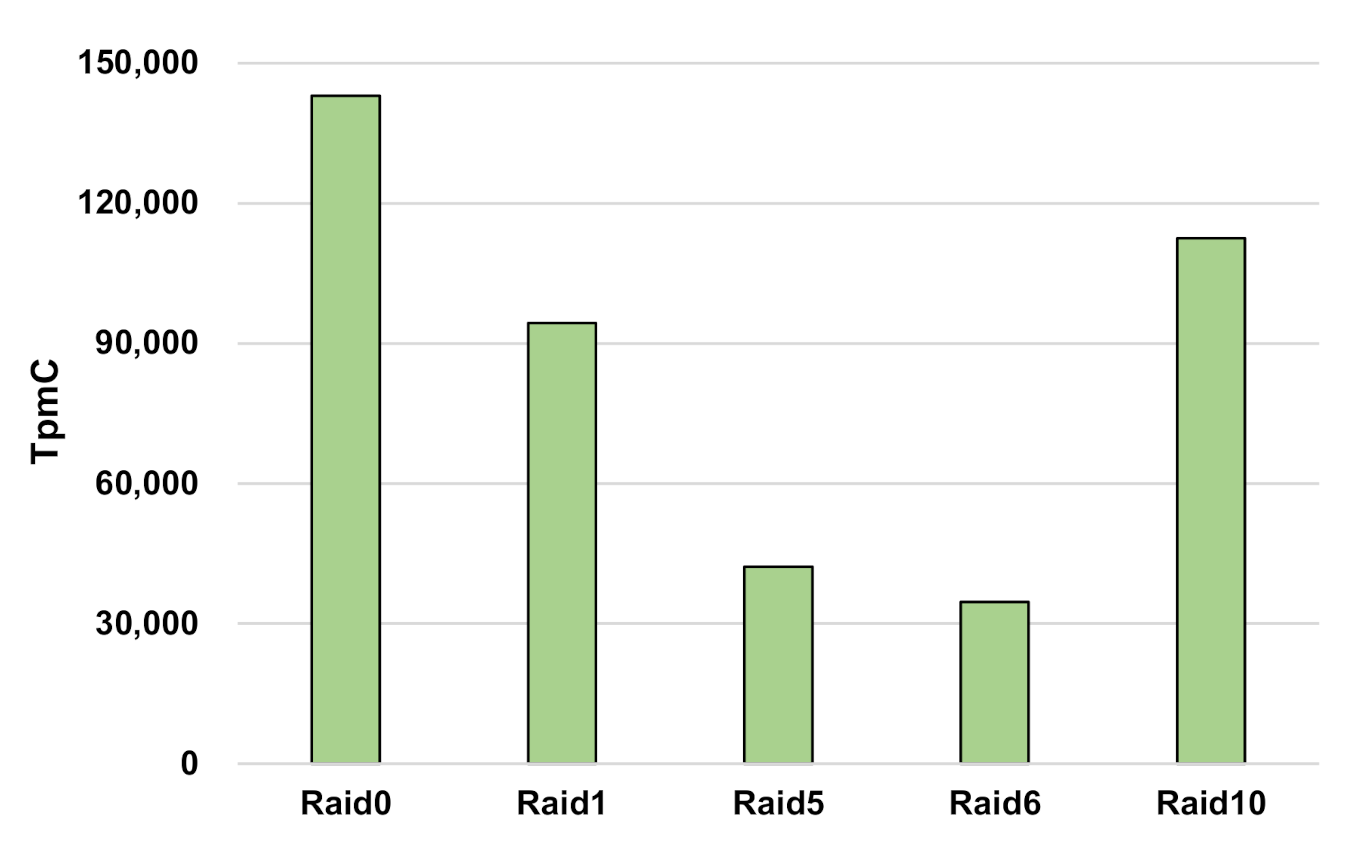
4.2. Database Benchmark

As mentioned earlier, we used DBbench and TPC-C [30] to evaluate the Intel Optane SSDs. DBbench is a popular benchmark provided by RocksDB to evaluate the KV stores, and it provides various I/O operations. We evaluated four operations fill random (FillRand), fill sequential (FillSeq), read random (ReadRand), and read sequential (ReadSeq). We configured the maximum read/write buffer number at sixty-four and the batch size at eight and used one-hundred million read and write operations. We also used direct I/O for the flush, compaction, and write and read operations. Figure 6 and Figure 7 show experimental results under various RAID schemes.
Figure 6 shows the DBbench results on the Intel Optane SSDs under different RAID schemes such as RAID 0, 1, and 10. Figure 6a shows the performance results for RAID 0. Each operation showed 1.3 MOPS, 1.8 MOPS, 1.1 MOPS, and 60.1 MOPS and 46.3 ms, 35.2 ms, 52.7 ms, 1.06 ms for fill random, fill sequential, read random, and read sequential, respectively. Figure 6b shows the performance results for RAID 1. The MOPS for each operation were 0.7 MOPS, 1.74 MOPS, 1.1 MOPS, and 60.8 MOPS, and the microseconds per operation of each operation were 83.9 ms, 36.5 ms, 56.6 ms, and 1.05 ms for fill random, fill sequential, read random, and read sequential, respectively. Figure 6c shows the performance results for RAID 10. The MOPS of each operation were 0.9 MOPS, 1.8 MOPS, 1.1 MOPS, and 52.7 MOPS, and the microseconds per operation of each operation were 69.3 ms, 34.8 ms, 54.5 ms, and 1.2 ms for fill random, fill sequential, read random, and read sequential, respectively. As we expected, similar strategies showed similar results. Thus, RAID 0 was fastest in most operations. Since there a transaction overhead existed in the database application, the performance of DBbench could not reach the full performance of the storage array (Figure 1, Figure 2 and Figure 3).
Figure 7 shows the DBbench results on the Intel Optane SSDs under different RAID schemes. Figure 7a shows the performance results for RAID 5. The MOPS of each operation were 0.49 MOPS, 1.7 MOPS, 1.1 MOPS, and 57.8 MOPS, and the microseconds per operation of each operation were 129.5 ms, 36.3 ms, 54.2 ms, and 1.1 ms for fill random, fill sequential, read random, and read sequential, respectively. Figure 7b shows the performance results for RAID 6. The MOPS of each operation were 0.9 MOPS, 1.8 MOPS, 1.1 MOPS, and 59.6 MOPS, and the microseconds per operation of each operation were 159 ms, 36.8 ms, 55.5 ms, and 1.07 ms for fill random, fill sequential, read random, and read sequential, respectively. Comparing Figure 6 with Figure 7, no significant difference in performance existed among various RAID schemes, and almost all performance except for the sequential read workload was in the range of 84.4 to 214.8MB/s. The performance overhead from the database concealed the characteristics of various RAID schemes that were observed in the previous experiments (Figure 1, Figure 2, Figure 3, Figure 4 and Figure 5).
The TPC-C benchmark is a mixture of read and write (1.9:1) transactions [30] that simulates online transaction processing (i.e., OLTP) application environments. We configured the user buffer size to 1 GB, page size to 16KB, flushing method to direct I/O (O_DIRECT), ramp-up time to 180 s, and execution time to 10 min.
Figure 8 shows the TPC-C results on the Intel Optane SSDs under different RAID environments. The performance of each scheme was 143,027, 94,375, 42,183, 34,581, and 112,536 tmpC for RAID 0, 1, 5, 6, and 10, respectively. In the case of RAID 0, tmpC was the highest because all data were only striped. The second-highest performance was RAID 10, which was due to the advantages of striping (RAID 0) and the increased read performance through mirroring (RAID 1). For RAID 1, the results showed high performance due to the increased read performance, although the write performance was very low because the TPC-C benchmark for OLTP workloads had a larger ratio of reads than writes (the read-to-write ratio was 1.9:1). As mentioned earlier, RAID 5 exhibited lower performance than other RAID schemes due to the overhead from parity operations. Moreover, RAID 6 also had lower performance than RAID 5 due to the overhead of the double-parity operations.

4.3. Performance Comparison under Multiple OSes and SSDs

We performed the evaluation and compared the results on multiple OSes (i.e., Ubuntu 20.04 and CentOS 7) and multiple SSDs (i.e., Intel Optane SSDs (900P) and Intel Flash-based NVMe SSDs (P3700)). Figure 9 shows experimental results on multiple OSes and SSDs in the case of RAID 0. Note that the single-device performance is depicted in Table 1. Figure 9a shows experimental results of RAID 0 under the Intel Optane SSD (900P) and the OSes. As shown in the figure, there was almost no significant performance difference between Ubuntu and CentOS since both CentOS and Ubuntu have a similar I/O path (e.g., page cache layer).
Figure 9b shows the experimental results of RAID 0 under the Intel Flash-based NVMe SSD (P3700) and the OSes. As shown in the figure, there was still no significant performance difference between Ubuntu and CentOS. In the case of the performance comparison between the two SSDs, the Flash-based NVMe SSDs had better performance by up to 22.1% compared to the Optane SSDs in the case of read operations. This showed that the Flash-based NVMe SSDs can outperform the Optane SSDs in terms of the read operations and the RAID configuration. Meanwhile, the Optane SSD had better performance by up to 18.4% compared with the Flash-based NVMe SSD in the case of the write operations. As mentioned earlier, the 3D Xpoint technology of Optane SSD does not incur GC overhead, so that it can provide a higher and consistent write performance. Though the experimental results, we can recommend the Optane SSD (900P) for write-intensive workloads, and we also can recommend the Flash-based NVNe SSD (P3700) for read-intensive workloads.

4.4. Comparison with Related Works

In this section, we provide a comparison of our results and those of related works in the case of a single device, as shown in Table 2. All the works used the same Intel Optane SSD (900P), but they used different configurations. Each experiment configuration was as follows: Zhang et al. [33] used two Intel Xeon E5-2609s (1.70 GHz 8 cores), 128GB DRAM, RHEL 7.0, Kernel Version 4.14, and the FIO benchmark. Yang et al. [34] used two Intel Xeon E5-2680s v4 (2.4GHz, 14 cores), 64GB DRAM, Ubuntu 16.04, Kernel Version 4.11.0-rc6, and the FIO benchmark.
For the FIO configuration, Zhang et al. [33] ran FIO during 30s and stored the fixed-size data (i.e., 20 GB) in the SSD before the performance evaluation. Yang et al. [34] ran FIO with a 4K block size, four threads, and a 32 iodepth. Our experimental setup was described in Section 3. As shown in the table, there was no significant difference except for the latency. We assumed that the larger number of iodepths in Yang et al. [34] could increase the latency compared with other works. Since the number of cores in our setup was larger than those of related works, we could assume that our evaluation results provided slightly higher throughput and lower latency compared with others due to the higher parallelism.

5. Summary and Implication

In this section, we summarize the implications of our evaluation study performed in this article. Our main findings and insights were as follows:
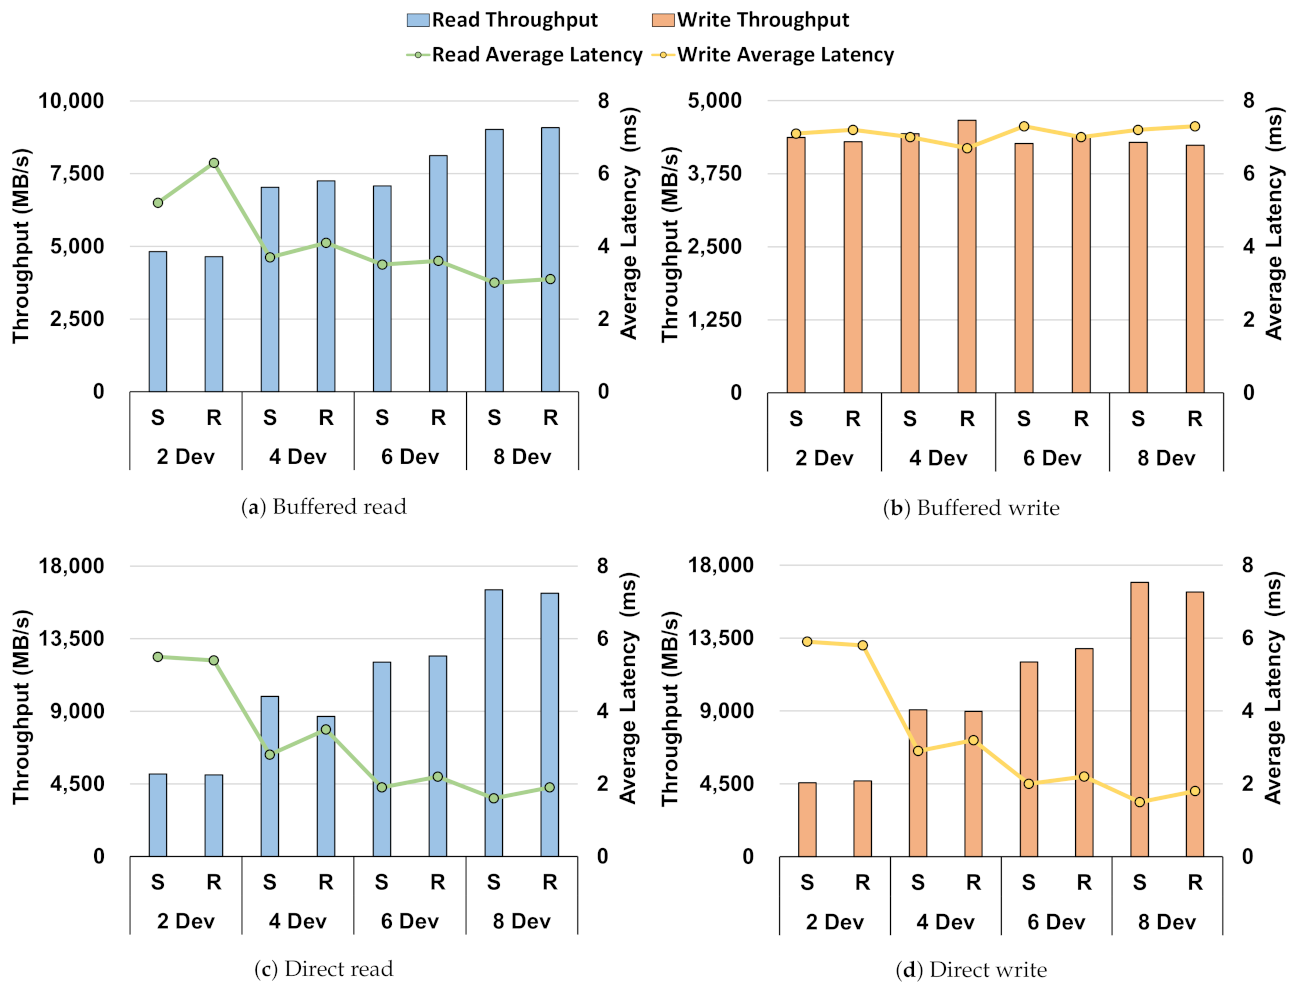
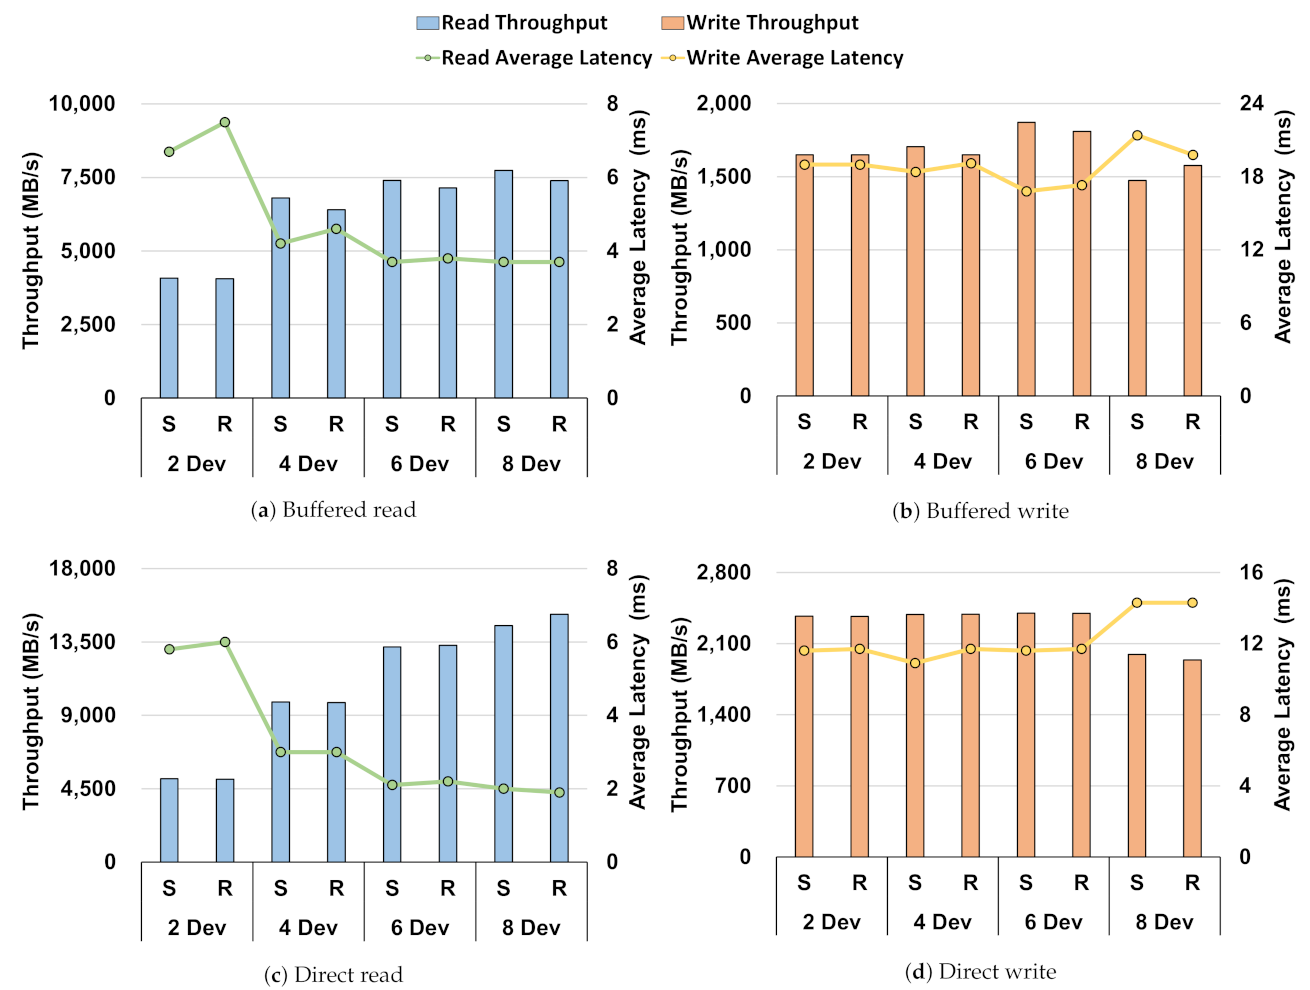
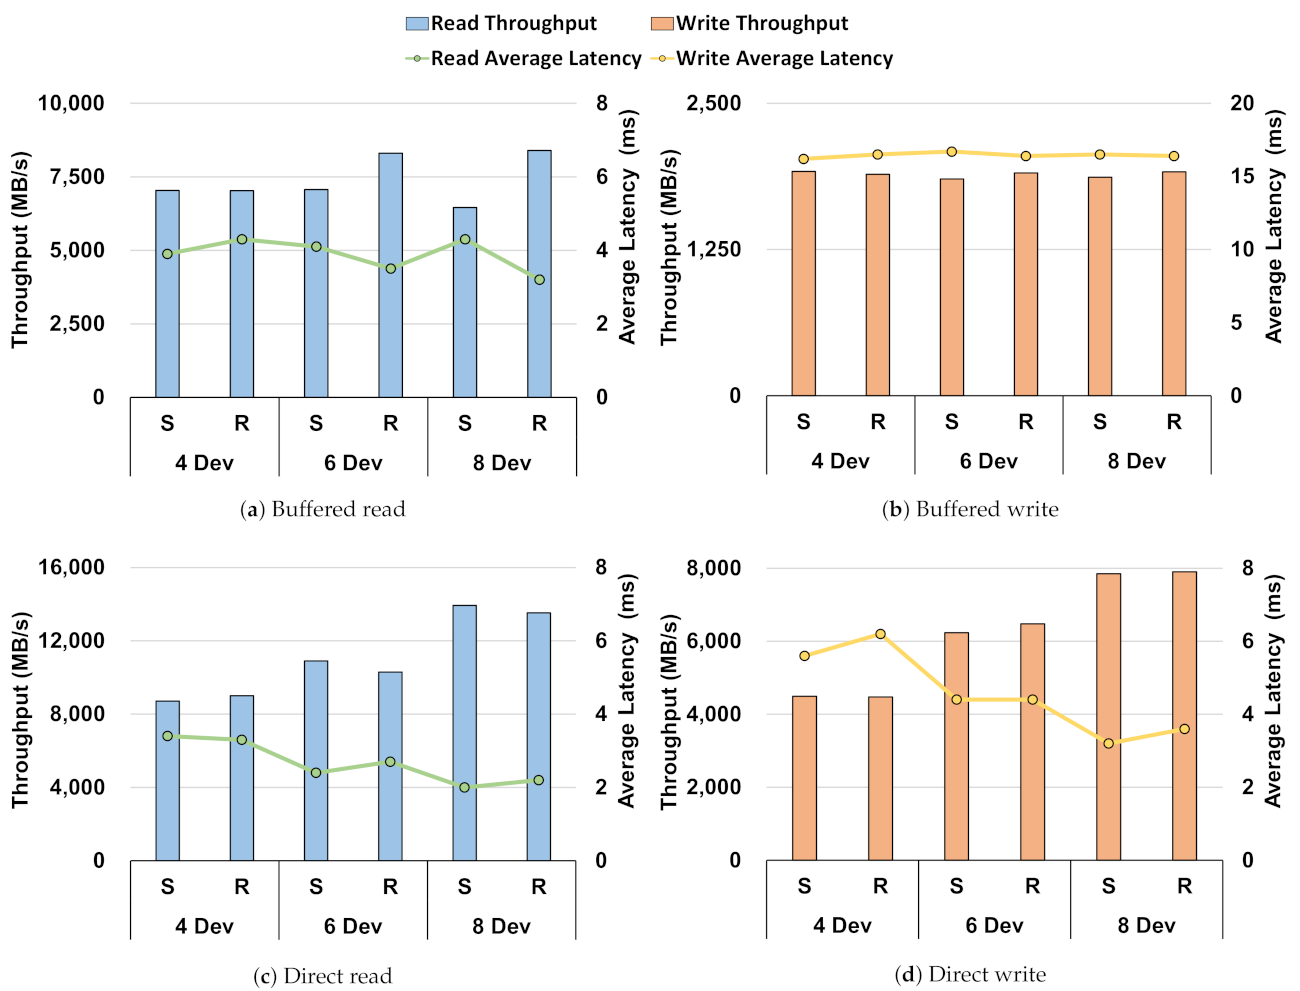
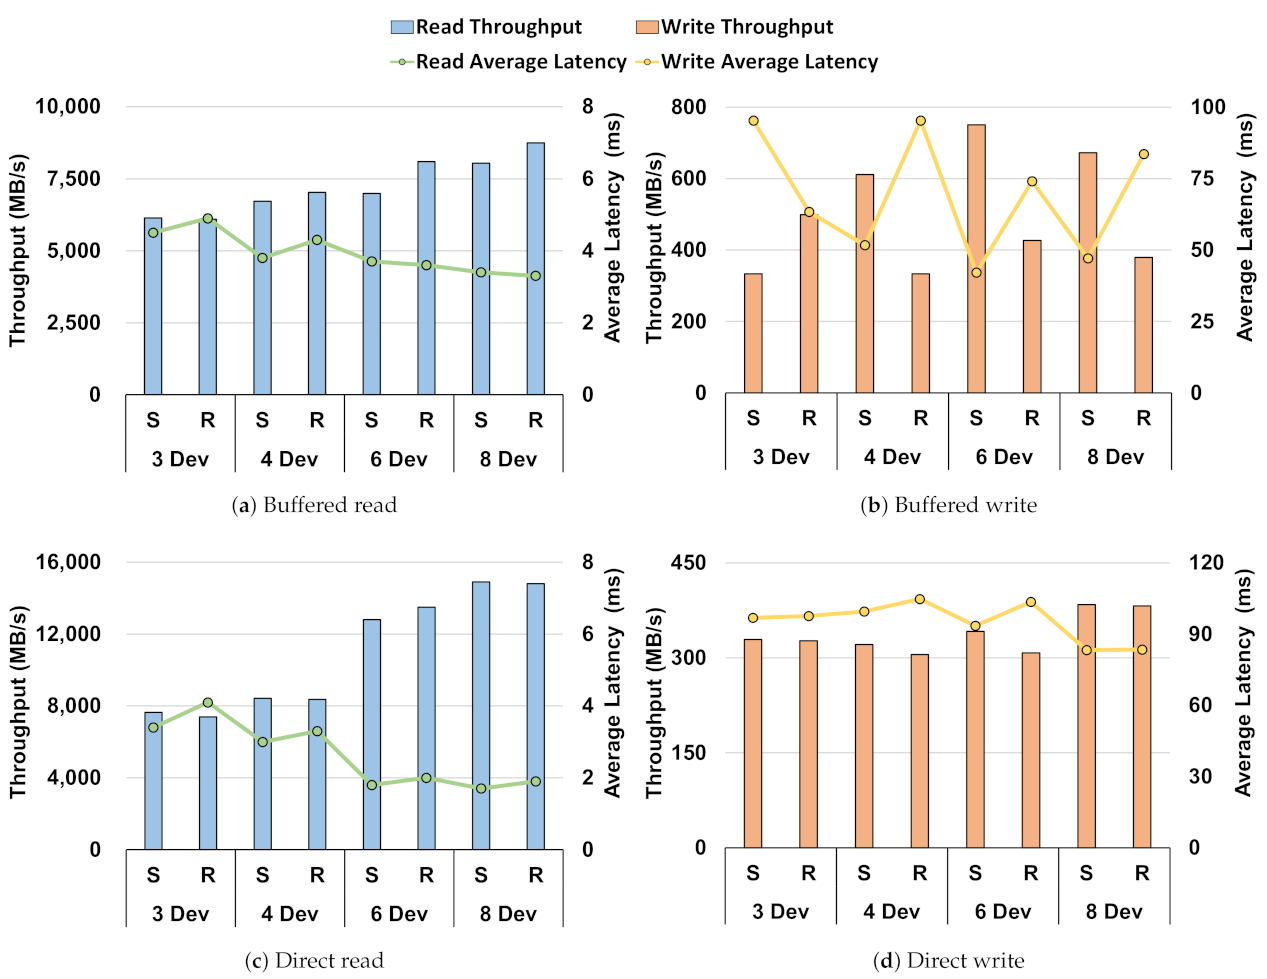
  • Through the performance baseline of the Intel Optane SSD in the Section 3, we showed no difference in performance between direct I/O and buffered I/O in a single-device environment. However, when compared in a RAID environment, through Figure 1, Figure 2, Figure 3, Figure 4 and Figure 5, there was a difference in performance. This showed that the storage stack had an overhead;
  • As shown in Figure 3, nested RAID (RAID 10) showed that the performance was similar to RAID 1 (Figure 2). This means that there were certain bottlenecks in the software RAID environment;
  • As shown in Figure 4 and Figure 5, the parity operations caused serious overhead to the write performance in RAID. This was because the parity operation should read the data, read the parity, write the data, and, finally, write the parity.

6. Conclusions and Future Work

In this paper, we evaluated and analyzed the Optane SSDs’ performance via synthesis and database benchmarks in different RAID schemes. First, we presented the results of our performance study on a real Optane SSD array. Second, we analyzed the performance of the Optane SSD array according to the workload behavior to examine the feasibility and benefits of the Optane SSD array. Finally, we identify bottlenecks in the storage stack. Our experimental results showed that the software stack overhead reduced the performance by up to 75%, 52%, 76%, 91%, and 92% for RAID 0, 1, 10, 5, and 6, respectively, compared to the expected performance. This result showed the bottleneck of the OS software stack, which came from the result of the significant performance improvement of the storage devices. In the future, we will plan to analyze and optimize the storage stack to improve the performance in different RAID schemes.

Author Contributions

J.H. were the main researcher who initiated and organized the research reported in the paper. G.Z. were contribute to conceptualization, and S.L. were contribute to Formal analysis. Y.S. were responsible for writing the paper and analyzing the experiment results. All authors have read and agreed to the published version of the manuscript.

Funding

This work was supported by the National Research Foundation of Korea (NRF) grant funded by the Korean government (MSIT) (No. 2018R1C1B5085640, 2021R1C1C1010861). This work was supported in part by the Korea Institute for Advancement of Technology (KIAT) grant funded by the Korean government (MOTIE) (P0012724, The Competency Development Program for Industry Specialist) (Corresponding Author: Yongseok Son).

Conflicts of Interest

The authors declare no conflict of interest.

References

  1. Venkatesh, M.; Sumalatha, M.; SelvaKumar, C. Improving public auditability, data possession in data storage security for cloud computing. In Proceedings of the 2012 International Conference on Recent Trends in Information Technology, Chennai, India, 19–21 April 2012; pp. 463–467. [Google Scholar]
  2. Aceto, G.; Botta, A.; De Donato, W.; Pescapè, A. Cloud monitoring: A survey. Comput. Netw. 2013, 57, 2093–2115. [Google Scholar] [CrossRef]
  3. Yang, T.; Shia, B.C.; Wei, J.; Fang, K. Mass data analysis and forecasting based on cloud computing. JSW 2012, 7, 2189–2195. [Google Scholar] [CrossRef]
  4. Grossman, R.L. The case for cloud computing. IT Prof. 2009, 11, 23–27. [Google Scholar] [CrossRef]
  5. Jian-Hua, Z.; Nan, Z. Cloud computing-based data storage and disaster recovery. In Proceedings of the 2011 International Conference on Future Computer Science and Education, Xi’an, China, 20–21 October 2011; pp. 629–632. [Google Scholar]
  6. Son, Y.; Kang, H.; Han, H.; Yeom, H.Y. An empirical evaluation and analysis of the performance of NVM express solid state drive. Clust. Comput. 2016, 19, 1541–1553. [Google Scholar] [CrossRef]
  7. Xu, Q.; Siyamwala, H.; Ghosh, M.; Suri, T.; Awasthi, M.; Guz, Z.; Shayesteh, A.; Balakrishnan, V. Performance analysis of NVMe SSDs and their implication on real world databases. In Proceedings of the 8th ACM International Systems and Storage Conference, Haifa, Israel, 26–28 May 2015; pp. 1–11. [Google Scholar]
  8. Google Cloud Platform. Available online: https://cloud.google.com/compute/docs/disks/local-ssd (accessed on 10 April 2021).
  9. Amazon Web Service. Available online: https://docs.aws.amazon.com/ko_kr/AWSEC2/latest/UserGuide/ssd-instance-store.html (accessed on 10 April 2021).
  10. Han, J.; Zhu, G.; Lee, E.; Lee, S.; Son, Y. An Empirical Evaluation and Analysis of Performance of Multiple Optane SSDs. In Proceedings of the 2021 International Conference on Information Networking (ICOIN), Jeju Island, Korea, 13–16 January 2021; pp. 541–545. [Google Scholar]
  11. Son, Y.; Choi, J.W.; Eom, H.; Yeom, H.Y. Optimizing the file system with variable-length I/O for fast storage devices. In Proceedings of the 4th Asia-Pacific Workshop on Systems, Singapore, 29–30 July 2013; pp. 1–6. [Google Scholar]
  12. Son, Y.; Song, N.Y.; Han, H.; Eom, H.; Yeom, H.Y. A user-level file system for fast storage devices. In Proceedings of the 2014 International Conference on Cloud and Autonomic Computing, London, UK, 8–12 September 2014; pp. 258–264. [Google Scholar]
  13. Son, Y.; Han, H.; Yeom, H.Y. Optimizing file systems for fast storage devices. In Proceedings of the 8th ACM International Systems and Storage Conference, Haifa, Israel, 26–28 May 2015; pp. 1–6. [Google Scholar]
  14. Wu, K.; Arpaci-Dusseau, A.; Arpaci-Dusseau, R. Towards an Unwritten Contract of Intel Optane {SSD}. In Proceedings of the 11th {USENIX} Workshop on Hot Topics in Storage and File Systems (HotStorage 19), Renton, WA, USA, 8–9 July 2019. [Google Scholar]
  15. Kim, H.; Seshadri, S.; Dickey, C.L.; Chiu, L. Evaluating phase change memory for enterprise storage systems: A study of caching and tiering approaches. In Proceedings of the 12th {USENIX} Conference on File and Storage Technologies ({FAST} 14), Santa Clara, CA, 16–19 February 2014; pp. 33–45. [Google Scholar]
  16. Bhimani, J.; Yang, J.; Yang, Z.; Mi, N.; Xu, Q.; Awasthi, M.; Pandurangan, R.; Balakrishnan, V. Understanding performance of I/O intensive containerized applications for NVMe SSDs. In Proceedings of the 2016 IEEE 35th International Performance Computing and Communications Conference (IPCCC), Las Vegas, NV, USA, 9–11 December 2016; pp. 1–8. [Google Scholar]
  17. Menon, J. A performance comparison of RAID-5 and log-structured arrays. In Proceedings of the Fourth IEEE International Symposium on High Performance Distributed Computing, Washington, DC, USA, 2–4 August 1995; pp. 167–178. [Google Scholar]
  18. Patterson, D.A.; Gibson, G.; Katz, R.H. A case for redundant arrays of inexpensive disks (RAID). In Proceedings of the 1988 ACM SIGMOD International Conference on Management of Data, Chicago, IL, USA, 1–3 June 1988; pp. 109–116. [Google Scholar]
  19. Chen, S.; Towsley, D. A performance evaluation of RAID architectures. IEEE Trans. Comput. 1996, 45, 1116–1130. [Google Scholar] [CrossRef] [Green Version]
  20. Li, Y.; Lee, P.P.; Lui, J.C. Stochastic analysis on RAID reliability for solid-state drives. In Proceedings of the 2013 IEEE 32nd International Symposium on Reliable Distributed Systems, Braga, Portugal, 30 September–3 October 2013; pp. 71–80. [Google Scholar]
  21. Islam, N.S.; Wasi-ur Rahman, M.; Lu, X.; Panda, D.K. High performance design for HDFS with byte-addressability of NVM and RDMA. In Proceedings of the 2016 International Conference on Supercomputing, Istanbul, Turkey, 1–3 June 2016; pp. 1–14. [Google Scholar]
  22. Hady, F.T.; Foong, A.; Veal, B.; Williams, D. Platform storage performance with 3D XPoint technology. Proc. IEEE 2017, 105, 1822–1833. [Google Scholar] [CrossRef]
  23. 3D XPoint Technology. Available online: https://www.micron.com/products/advanced-solutions/3d-xpoint-technology (accessed on 10 April 2021).
  24. Intel Optane Technology. Available online: https://www.intel.com/content/www/us/en/architecture-and-technology/intel-optane-technology.html/ (accessed on 10 April 2021).
  25. Schnjakin, M.; Meinel, C. Evaluation of cloud-raid: A secure and reliable storage above the clouds. In Proceedings of the 2013 22nd International Conference on Computer Communication and Networks (ICCCN), Nassau, Bahamas, 30 July–2 August 2013; pp. 1–9. [Google Scholar]
  26. Fitch, D.; Xu, H. A RAID-based secure and fault-tolerant model for cloud information storage. Int. J. Softw. Eng. Knowl. Eng. 2013, 23, 627–654. [Google Scholar] [CrossRef]
  27. Pirahandeh, M.; Kim, D.H. Energy-aware GPU-RAID scheduling for reducing energy consumption in cloud storage systems. In Computer Science and its Applications; Springer: Berlin/Heidelberg, Germany, 2015; pp. 705–711. [Google Scholar]
  28. Mathur, A.; Cao, M.; Bhattacharya, S.; Dilger, A.; Tomas, A.; Vivier, L. The new ext4 filesystem: Current status and future plans. In Proceedings of the Linux Symposium, Citeseer, Ottawa, Ontario, Canada 27–30 June 2007; Volume 2, pp. 21–33. [Google Scholar]
  29. FIO Benchmark. Available online: https://github.com/axboe/fio (accessed on 10 April 2021).
  30. Chen, S.; Ailamaki, A.; Athanassoulis, M.; Gibbons, P.B.; Johnson, R.; Pandis, I.; Stoica, R. TPC-E vs. TPC-C: Characterizing the new TPC-E benchmark via an I/O comparison study. ACM Sigmod Rec. 2011, 39, 5–10. [Google Scholar] [CrossRef]
  31. Ahmed, M.; Uddin, M.M.; Azad, M.S.; Haseeb, S. MySQL performance analysis on a limited resource server: Fedora vs. Ubuntu Linux. In Proceedings of the 2010 Spring Simulation Multiconference, Orlando, FL, USA, 11–15 April 2010; pp. 1–7. [Google Scholar]
  32. Ghoshal, D.; Canon, R.S.; Ramakrishnan, L. I/o performance of virtualized cloud environments. In Proceedings of the Second International Workshop on Data Intensive Computing in the Clouds, Seattle, WA, USA, 14 November 2011; pp. 71–80. [Google Scholar]
  33. Zhang, J.; Li, P.; Liu, B.; Marbach, T.G.; Liu, X.; Wang, G. Performance analysis of 3D XPoint SSDs in virtualized and non-virtualized environments. In Proceedings of the 2018 IEEE 24th International Conference on Parallel and Distributed Systems (ICPADS), Singapore, 11–13 December 2018; pp. 1–10. [Google Scholar]
  34. Yang, M.; Peng, B.; Yao, J.; Guan, H. A Throughput-Oriented NVMe Storage Virtualization with Workload-Aware Management. IEEE Trans. Comput. 2020. [Google Scholar] [CrossRef]
Figure 1. Experimental results under RAID 0 (S: sequential, R: random, Dev: number of devices).
Electronics 10 01325 g001
Figure 2. Experimental results under RAID 1 (S: sequential, R: random, Dev: number of devices).
Electronics 10 01325 g002
Figure 3. Experimental results under RAID 10 (S: sequential, R: random, Dev: number of devices).
Electronics 10 01325 g003
Figure 4. Experimental results under RAID 5 (S: sequential, R: random, Dev: number of devices).
Electronics 10 01325 g004
Figure 5. Experimental results under RAID 6 (S: sequential, R: random, Dev: number of devices).
Electronics 10 01325 g005
Figure 6. Experimental results under different RAID schemes (RAID 0, 1, and 10) via DBbench.
Electronics 10 01325 g006
Figure 7. Experimental results under different RAID schemes (RAID 5 and 6) via DBbench.
Electronics 10 01325 g007
Figure 8. Experimental results under the TPC-C benchmark.
Electronics 10 01325 g008
Figure 9. Experimental results of RAID 0 under multiple OSes and SSDs (S: sequential, R: random, Dev: number of devices).
Electronics 10 01325 g009
Table 1. Comparison among SATA SSDs, NVMe SSDs, and Optane SSDs.
Flash-Based SATA SSDFlash-Based NVMe SSDOptane SSD
Buffered I/ODirect I/OBuffered I/ODirect I/OBuffered I/ODirect I/O
Sequential Read220 MB/s211 MB/s2485 MB/s2563 MB/s2558 MB/s2553 MB/s
Random Read194 MB/s207 MB/s2478 MB/s2585 MB/s2554 MB/s2556 MB/s
Sequential Write256 MB/s170 MB/s2011 MB/s1925 MB/s2499 MB/s2445 MB/s
Random Write194 MB/s162 MB/s1995 MB/s1953 MB/s2468 MB/s2445 MB/s
Table 2. Comparison to related works.
ReadWrite
Read ThroughputRead LatencyWrite ThroughputWrite Latency
Zhang et al. [33]2557 MB/s13.8 μs2185 MB/s15.7 μs
Yang et al. [34]2383 MB/s219.5 μs2241 MB/s230.1 μs
Our result2580 MB/s9.7 μs2559 MB/s10.1 μs
Publisher’s Note: MDPI stays neutral with regard to jurisdictional claims in published maps and institutional affiliations.

