Abstract
It is widely believed that the incorporation of renewable energy to the current power grid is the way forward in achieving sustainable power generation. Currently, with the reduction of PV prices, many countries have started connecting PV systems into their grid network, hence leading to a sharp increase of the penetration levels of renewable electricity production. This will bring significant change in the load pattern and the ramping requirements of the grid’s conventional generation system due to the varying nature of the renewable energy generation. This significant change affects the stability of the grid frequency because it becomes more challenging for the system operators to maintain the equilibrium between the generation and load. Additionally, this significant change affects the PV system potential hosting capacity of the traditional grid because of the PV system’s curtailment in order to comply with the constraints of the grid’s conventional generation system. In this paper, the net load, grid frequency stability, and grid potential hosting capacity are evaluated in the situation of increasing the penetration level of large-scale PV systems generation into the grid. The results show that the grid operators will face increasingly variable net load patterns and steeper ramping events as the PV system penetration level increases. Additionally, the results show the requirement of having flexibility measures that target each grid constraint as the PV system penetration level increases.
1. Introduction
Energy access, decarbonization, and energy security are some of the driving triggers for the growing penetration of the renewable energy in the electric grids around the world. The earth’s surface collects an average energy of approximately 1.2 × 10¹⁷ W of solar power; this could meet the demand of the earth’s whole population for a whole year in less than an hour of that energy harnessing [1]. Since the photovoltaic (PV) technology has no limitation in supply, it is considered one of the major contributors in distributed renewable energy share [2,3]. By 2040, it is predicted that PV technology will become the most dominant contributor in electricity generation among all other sources of renewable energy [4]. However, integrating large-scale PV systems into the grid will bring up a new set of technical and grid stability challenges because of their uncontrollable varying generation output [5].
Grid stability is a core requirement to ensure the security and reliability of the grid’s operation. The large-scale integration of PV systems would bring a significant change in the load pattern, which affects the stability of the grid’s frequency. This is because it becomes more challenging for the system operators to maintain equilibrium between the generation and load. The authors of [6] studied the effects of four PV power plants, 50 MW each, as well as four conventional power plants, 700 MW each, on the frequency stability of the grid and concluded that the frequency stability is not drastically affected by the PV power plants. However, the aforementioned study did not consider any reduction of the conventional power plants. The research conducted in [7] illustrates the impact of both large PV and wind power plants on the voltage and frequency stability of the Jordan’s grid. Additionally, the frequency stability analysis showed that the grid can withstand the penetration of the renewables up to 40% of the total generation. The authors of [8] performed a power system stability analysis under increased penetration of PV power with synchronous power controllers (SPCs), in which the frequency deviations were limited due to the usage of SPCs in the PV power plants. The research in [9] evaluated the impact of high penetration levels of PV power plants on Egypt’s unified grid stability, and the frequency stability analysis showed that the grid can withstand a PV power output of up to 3 GW of total demand.
Hosting capacity can be defined as the amount of new generation that can be integrated into the grid without endangering its reliability [10]. The authors of [11] examined the hosting capacity of a distorted distribution system with PV units, in which the designed C-type passive filter managed to achieve a higher hosting capacity in comparison to other conventional filter designs. The research conducted in [12] illustrated the PV hosting capacity effect on the harmonic voltage distortion of a low-voltage side, and it was concluded that there are significant risks in determining the hosting capacity without having information on background distortion. The research in [13] investigated the PV hosting capacity for Switzerland’s medium voltage distribution grid, in which a battery energy storage was used to extend the PV hosting capacity. The authors of [14] evaluated the PV hosting capacity using integrated grid planning modelling approaches, in which a two-stage transmission and generation expansion model was combined with the distribution network PV hosting capacity assessment.
As the electrical grid evolves to allow the integration of large volumes of renewable energy in respect to the generation mix portfolio, the system’s operators must address the insurance of flexibility across all parts of the grid system. Currently, the generation mix portfolio is capable of providing the source of flexibility to deal with the variability of the electricity demand. However, as the penetration level of the renewable energy to the grid increases, it changes the net load pattern, which it will become very crucial to plan for the impact of uncertainty and variability. Therefore, an assessment of the net load after applying the grid’s constraints in terms of the baseload constraint and ramping constraint of the conventional generation system of the grid can provide insight on the impact of variability on the grid that accompanies the renewable energy generation of different capacities. Furthermore, the frequency stability of the grid senses the variation between the generation and demand, which can also provide insight on the impact of variability on the grid that accompanies the renewable energy generation of different capacities.
Most of the prior studies that examined the grid’s frequency stability, due to increasing the penetration level of PV generation into the grid, lacked investigation into the effect of the size of the PV disturbance on the grid’s frequency. Additionally, the prior studies lacked analysis of the net load that aids in illustrating the change in load pattern effect and the ramping requirements needed by the grid’s conventional generation system in the situation of increasing the penetration level of the PV power into the grid. Furthermore, the prior studies on PV hosting capacity lacked the analysis of the effects that each grid constraint has on the performance of the PV system in terms of PV curtailment in the situation of increasing the penetration level of the PV generation into the grid. Therefore, this paper aims to provide a useful framework in the assessment of the frequency stability representation of the grid and PV hosting capacity for researchers to further exploit the operational reliability of the grid system and aid the development of methods to mitigate the adverse effects of large-scale PV system integration.
The present paper is organized as follows: Section 2 presents a detailed description of the methodology employed, which includes data collation, PV system modelling, grid frequency modelling, and PV curtailment modelling; Section 3 illustrates the results of the net load analysis in terms of assessing the net load’s pattern and ramping in the situation of increasing penetration level of PV power into the grid. Section 3 also shows the results of the frequency stability analysis of the grid at increased penetration level of large-scale PV systems and the results of the grid’s potential hosting capacity evaluation, with large-scale PV plants at various penetration levels to the grid. The paper concludes by discussing the results and summarizing the key aspects facing the frequency stability and PV hosting capacity from the integration of the PV systems, depending on their size scale into the grid.
2. Methodology
This section will present a detailed description of the steps undertaken to design and model the PV system, which includes the sizing of the PV array, the performance of the inverter, other miscellaneous system losses, and the PV array mathematical representation. In addition, the collected data from the case study location in the form of the hourly load profile and hourly solar irradiance data at various seasons of the year are presented. This enables the study to illustrate the change in load pattern effect due to increasing the PV penetration level into the electrical grid. Furthermore, this section will present the method used to calculate the grid’s frequency and illustrate the PV curtailment method, which is applied to comply with the grid’s constraints. In doing so, this enables us to assess the grid’s potential hosting capacity with large-scale integrated PV plants. Figure 1 presents a flowchart of the methodology employed to assess the grid’s potential hosting capacity of large-scale integrated PV plants at various penetration levels.
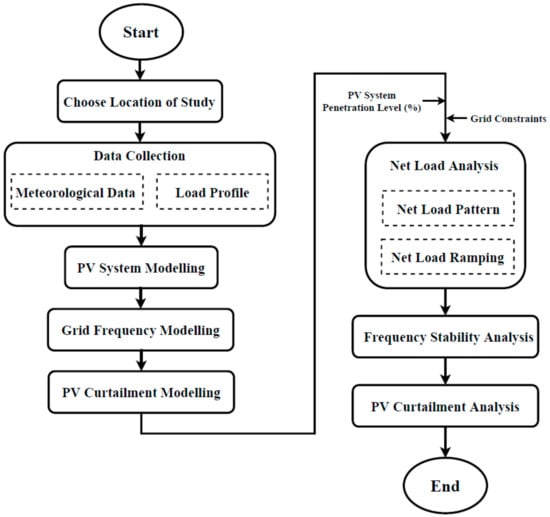
Figure 1.
Flowchart of the methodology used to assess the grid’s potential hosting capacity of large-scale integrated PV plants at various penetration levels.
2.1. Data Collection
The case study location is in the region of Riyadh, Saudi Arabia, with a latitude of 24.91° N and a longitude of 46.41° E. The chosen location is on the eastern part of the Najd plateau, which is characterized by an arid environment with low annual rainfall and high temperature variability. This section will showcase the collected hourly load profile and meteorological data. The chosen months for winter, spring, summer, and autumn correspond respectively to January, April, June, and October. The reason for choosing these months is to provide a clearer evaluation during seasonal variations of change in the shape of the net load, which will alter the ramping requirements needed by the grid’s conventional generation system.
2.1.1. Load Profile
The hourly load profile for the city of Riyadh has been collected for the year 2017 from the Saudi Electricity Company (SEC) and was organized into average hourly daily load profiles for each month of the year. This will show a clearer representation of the pattern for the load profile and the seasonal variation that the load profile experiences throughout the year. The average representation might not give an accurate result because the peak load will be slightly higher than the value used for average data. However, since the aim here is to show a clearer representation of the pattern for the load profile and the seasonal variation that the load profile experiences throughout the year, the average hourly daily load profile for each chosen month is used. Figure 2 shows the 2017 Riyadh average hourly daily load profile for the different seasons. Figure 3 shows the 2017 monthly sum of electricity load in Riyadh.
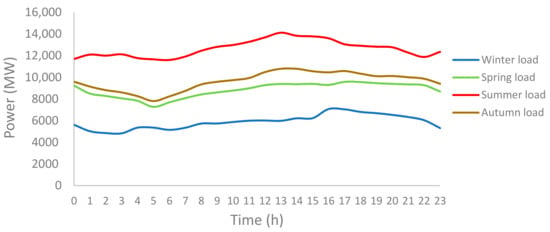
Figure 2.
The 2017 average hourly daily load profile for the different seasons in Riyadh [15].
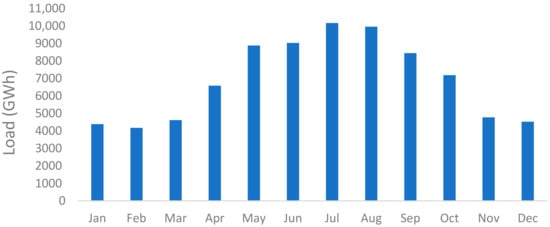
Figure 3.
The 2017 monthly sum of electricity load in Riyadh [15].
2.1.2. Meteorological Data
The hourly Global Horizontal Irradiance (GHI) data and the ambient temperature data were obtained from King Abdullah City for Atomic and Renewable Energy (K.A.CARE). The collected hourly Global Horizontal Irradiance (GHI) data and the ambient temperature data are shown in Figure 4 and Figure 5, respectively.
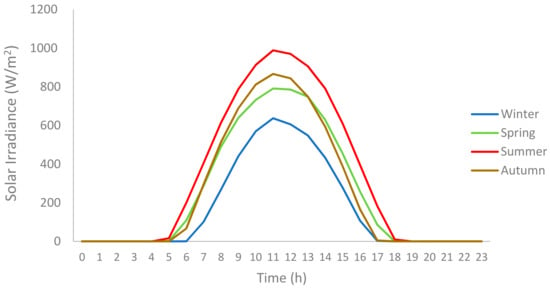
Figure 4.
Average hourly solar irradiance for the different seasons in Riyadh, 2017 [16].
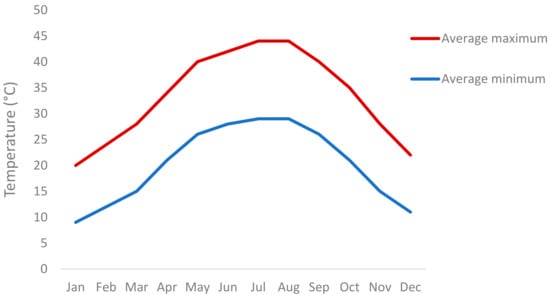
Figure 5.
The average monthly maximum and minimum temperatures in Riyadh, 2017 [16].
2.2. PV System Modelling
The PVSYST software was used to estimate the performance of the PV plant, as this software is very accurate in the estimation of the PV system’s performance by offering PV cell-level parametric analysis. However, the PVSYST model may not be suitable for assessing the performance of the electrical grid system with the inclusion of the PV system because of the complexity and because it is beyond the scope of the model [17]. Furthermore, such studies involve only calculating the PV power over extended time frames at different weather conditions. Therefore, more appropriate mathematical models are required for this kind of analysis, as the amount of calculations is minimized [18]. Additionally, there are some simplified models that directly relate to any instant of temperature and irradiance with the PV’s maximum generation [19,20]. These models are appropriate for use when the goal is to investigate the behavior of the electrical grid with the inclusion of the PV system.
The solar cells are usually connected in series, forming a solar module, and the formed panels are further interconnected in series and parallel, forming PV strings and PV arrays. It is worth mentioning that PV arrays include design power diodes in their circuit, such as the bypass diode and blocking diodes. The bypass diode is connected in parallel to several modules in order to conduct the current in the event of some modules being damaged or shaded. The blocking diodes are interconnected in series with each string in order to protect the modules from reverse current flow [21].
This following section will describe the details of the steps undertaken to design and model the PV array, which includes the sizing of the PV array, the performance of the inverter, the other miscellaneous system losses, and the PV array mathematical representation.
2.2.1. PV Array Sizing
The quantity of modules in each string is limited to the mandatory voltage level of the array; meanwhile, the quantity of parallel strings in the array is determined by the mandatory current rating of the array. Step by step procedures and algorithms used to accurately estimate the number of modules and strings for designing and configuring a PV system are detailed in [22]. The system’s DC side operating voltage and the number of the panels are related as follows:
where Uminmp is the minimum MPPT controller operating voltage, Umaxmp is the maximum MPPT controller operating voltage, and Uimp is the optimum inverter MPPT controller operating voltage and represents the mean of the inverter’s voltage ranges.
where Nmodules is the number of solar modules that are placed in series and Vmp is the PV module’s maximum power voltage. The number of solar modules that are placed in series (Nmodules) should be at least equal to the following:
The number of strings in parallel (Nstrings) in the array is equal to the following:
The maximum number of strings that are necessary for preventing current limitation is estimated as:
The output of the PV system should be equal or closely related to the inverter’s rated power. Moreover, in Europe, the inverter’s power could be in the following range in respect to the PV generation [22]:
where Pinv is the inverter’s rated power and PPV is the rated power of the PV array. It is important to ensure that the voltage does not go above the permissible value of the inverter’s operating voltage during extreme conditions, both at low and high temperatures, which it may result in the destruction of the device. The following shows the method of relating the voltage at extreme low temperatures (VTmin):
where Voc is the open circuit voltage, Tlow is the extreme low temperature, Tstc is the PV cell temperature at standard test conditions, and TCVoc is the open circuit voltage temperature coefficient of the PV panel. Additionally, it is important to ensure that the voltage does not go below the minimum voltage of the inverter’s MPPT controller in extremely high temperatures. The following shows the method of ensuring the voltage at an extremely high temperature (VTmax):
where Thigh is the extremely high temperature and TCVmp is the maximum power voltage temperature coefficient of the PV panel.
2.2.2. Inverter Efficiency
The efficiency of the inverter is dependent on the DC input from the PV array, which means that the efficiency of the inverter will vary as the DC input from the PV array varies. Furthermore, the term “inverter loading ratio” (ILR) is used to describe the ratio of the PV array’s DC power in relation to the inverter’s peak AC power [23].
where ɲILR is the inverter loading ratio (ILR) in percent, Parray,dc is the PV array’s DC power, and Pinv,ac is the inverter’s peak AC power. To estimate the efficiency of the inverter, the ɲILR will be used when the Parray,dc is increased, while keeping the Pinv,ac constant. Additionally, the inverter’s efficiency curve is essential in the estimation of the inverter’s instantaneous efficiency (ɲinv), and so the PVSYST database for inverters may be used to obtain the inverter’s efficiency curve. The ABB central 500 kW efficiency curve and the DC to AC power relationship are shown in Figure 6.
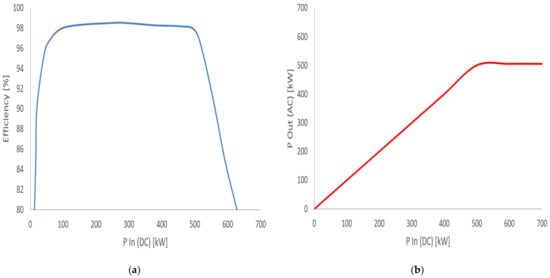
Figure 6.
(a) ABB central 500 kW inverter DC efficiency curve; (b) ABB central 500 kW inverter DC to AC power curve [24].
Thus, using Equation (11) and Figure 6 enables the estimation of the efficiency of the inverter, as shown in Table 1. It is worth mentioning that the power factor of 1 is considered for the solar PV inverters. The inverter configurations for the PV system should be known. The work presented in [25] provides a detailed review for the inverter’s configurations in relation to the PV technologies and systems.

Table 1.
The estimated inverter efficiency.
2.2.3. Other Miscellaneous PV System Losses
The energy converted from the PV array undergoes several processes, in which the energy may be lost from the system. Figure 7 presents the factors that lead to the PV system’s power losses [26]. The study reported in [27] showcased that the PV system performs at a 67% performance ratio due to the PV system losses and these losses account to 1% incident angle losses, 4% shading losses, 4% array temperature losses, 6% mismatch and MPPT losses, 9% inverter losses, and 9% other losses. Another study reported in [28] used the PVSYST software to simulate the performance ratio of a 20 MW grid-connected PV system, in which the performance ratio was 75% due to the PV system losses, excluding the inverter losses. Therefore, a performance ratio (Plosses) of 75% was set for the PV system due to PV system losses, excluding the inverter losses, since they were accounted for.

Figure 7.
Factors in the power losses of the PV system [26].
2.2.4. PV Array Mathematical Representation
This section describes a simplified mathematical model for calculating the PV array output. The simplified mathematical model used is based on work published in [19,20], which computes the PV-generated power based on the total area of the PV array (Aarray) and the PV system conversion efficiency (ɲconversion).
where Nmodules is the number of modules in series in a string, Nstrings is the number of strings in parallel in the array, Pnominal is the single PV module’s nominal power in watts, Gstc is the global horizontal irradiance (GHI) for standard test conditions, and ɲmodule is the single PV module’s efficiency.
where Tcell is the cell temperature, G is the global solar irradiance data on PV surface, and Tnoct is the nominal operating cell temperature of the PV cell. The PV system conversion efficiency (ɲconversion) is estimated using the following Equation (14):
where Tstc is the cell temperature used for standard test conditions and Tcoef is the temperature coefficient of the PV module in percentage. The array output power can be estimated as follows:
where Parray is power of the PV array, ɲinv is the inverter’s efficiency, and Plosses is the system’s performance ratio due to the miscellaneous power losses.
The minimum number of modules in series and the maximum number of strings in parallel were calculated to design the correct maximum PV array based on the technical specification data of the mentioned components. Therefore, the calculations show that the number of modules in a series string should equal 17, while the number of strings in parallel in an array should equal 101. Since the STC nominal power of the PV module was 320 W, the maximum array output was equal to 549 kW. The PV and inverter type that was used in this study were:
- PV module: SolarWorld Pro SW 320 XL Mono
- Inverter: ABB central inverters PVS800 500 kW
The number of PV (plants) arrays (Narray) were deduced from the desired percentage of the PV share to the peak load, better known as the penetration levels of the PV system. The identified peak load point can be interpreted as an indicator to the size of the system. This is because the conventional generation system of the grid is traditionally sized to meet the annual peak load whilst keeping a reserve margin to deal with outages and extreme load events [29]. Thus, using Equations (16) and (17) enables the calculation of the PV system’s capacity based on the desired penetration level to the peak load.
2.3. Grid Frequency Modelling
The demand for electricity continuously varies over time due to the consumer’s habits and weather conditions; thus, the load of the power system is always fluctuating. It is fundamental that the generation matches these variations precisely through a function called load frequency control (LFC) in order to maintain the power system frequency [30]. At the same time, it is necessary that the generation units are economically dispatched so that these functions can be referred together as the automatic generation control (AGC) [30]. Accordingly, all modern grid systems run energy management system (EMS) software through their centralized control centers, which together with other functions, monitor the generators’ output and frequency levels.
Regulation is a practice that is used to ensure power balance and can be sensed by the variations in the system’s frequency. If the load exceeds the generation input, it results in the energy exiting the system overtime, leading to the extraction of energy from the kinetic energy of the generators rotating masses. Thus, the rotating masses of the generators rotate slowly, leading to a decrease in the system frequency. On the other hand, if the generation exceeds the load, it results in an increase in the systems frequency. An excellent illustration of the grid’s frequency stability concept using the water-level in a container analogy is shown in Figure 8.
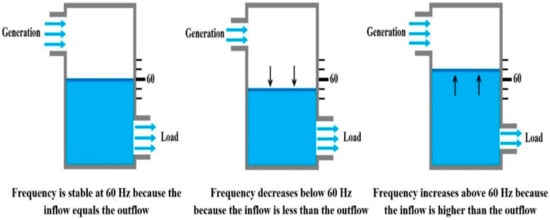
Figure 8.
Concept of grid’s frequency stability, using the water-level in a container analogy [5].
The governor of the generator is responsible of detecting the speed of deviations, which adjusts the power input via the opening and closure of the valves, as appropriate. The governor alters the input power in proportion to the speed deviation. The drop or speed regulation (R) is measured in Hz/MW or as a percentage of the unit’s rated capacity. In practice, typical drops were in the range of 5–10%, and if no further action was taken, it would result in the system operating at this new frequency [31]. The research in [31] illustrates the method of calculating the grid’s frequency, in which the grid’s frequency can be expressed using Equations (18)–(21). The drop or speed regulation (R) can be expressed as:
The frequency deviation (∆ƒ) due to change in load can be expressed as:
where ∆P can be defined as the change of power or power ramp in a specific time interval, which can be represented by the following [29]:
where P(t) is the power at the time (t). Thus, the frequency can be deduced as:
In this paper, after collecting the hourly load profile, global irradiance data, and the ambient temperature data in order to calculate the output of the PV system, we were able to perform the grid frequency stability analysis. An assumption was made that the collected hourly load was constant throughout this hour interval.
2.4. PV Curtailment Modelling
The grid’s connection and dispatching regulations for integrated renewable energy in most countries, depending on their Power Purchase Agreement (PPA), is to oblige the grid operators to take in all the electricity produced by the renewables. However, the curtailment regulations or rules for the renewables needs to be clearer addressed in the PPA. Furthermore, in countries with high penetration levels of renewable energy, such as Germany, curtailment might be due to the volume of that intermittent energy; if not, it can be expected as a routine operation for the grid in order to balance the load [32]. Additionally, curtailment of renewable energy can be expected to be high in emerging economies because of the transmission network limitations. It is a common practice for the PPAs to allow up to a certain level or threshold of curtailment, for which the solar PV plant owner does not get compensated for reducing their output. However, above that threshold, the PPA might include the terms of payment, in which the PV plant owner will be compensated for that curtailment; but in this case, clean energy is wasted and not being utilized.
2.4.1. PV Curtailment for Baseload Constraint
In this paper, the baseload constraint is expressed as the minimum operational output of the conventional generation system, which implies that the grid’s operational output of the conventional generation system cannot be furtherly lowered, and it is difficult to switch them completely off or on. Therefore, PV curtailment, in this case, was the only method viable to consider, since there were no other sources of grid flexibility, such as energy storage, resulting into PV over-generation events. The PV over-generation phenomena can be explained as the instant of time when the PV system’s output exceeds the required demand, which may occur when the net load falls below the baseload point. A new variable defined as the difference between the load profile and the baseload point (DLB) is be introduced to aid the identification of a PV over-generation event caused by the grid’s baseload constraint. DLB was calculated using Equation (22). Equation (23) illustrates the PV curtailment method applied for a baseload constraint, in which the PV system’s output (PVOut) is curtailed to a value equal to the DLB when the PV system’s output is higher than the DLB value.
2.4.2. PV Curtailment for Ramping Constraint
A ramp event can be described as the interval’s deviation between the start and end point, being larger than the set threshold value, as was suggested in [33] to neglect ramping events occurring in the midpoint of an interval. Generally, for the power system operators, the down ramping events of the renewables are much more challenging than the up ramping events of the renewables. This is due to the requirement in the down ramping events of filling the shortage of supply by means of increasing other generation capacities rather than being managed by means of generation scheduling and renewable curtailment [34]. Therefore, at the current time, the main source of the grid’s operational flexibility comes from the cycling of the conventional generation system. Cycling is a term defined as the alteration of the conventional power plant output by means of starting up, turning off, or ramping [35]. The conventional generations operate between a minimum limit and a maximum limit, and this is restricted by the ramping limits.
The increase share of the PV system tends to increase towards these conventional generation technical cycling data. In particular, the ramping constraint that exceeds the ramping constraint threshold leads to the loss of the load phenomena [36]. The Loss of Load Probability (LOLP) is defined as the probability of the available generation capacity that is unable to meet the load during a given period [37]. Furthermore, the loss of load event (LLE) in this research can be defined as the moment when the absolute net load power ramp (|NLPR|) exceeded the grid’s ramping constraint (GRC) of its conventional generation system. In this paper, the GRC is based on the maximum power ramp of the original load profile without the inclusion of the PV system. In doing so, a more realistic assessment of the current ramping requirement of the grid’s conventional generation system is given.
The occurrence of the loss of load event (LLE) resulted in the disconnection of the conventional generation system from the grid. Thus, these loss of load events must be dealt with in order to ensure the stability of the grid system. The ramping constraint implies that the grid’s operational output of the conventional generation system cannot be furtherly ramped up or down in order to follow the change in the net load. Therefore, PV curtailment in this case was the only method viable to deal with these loss of load events, since there were not any other sources of grid flexibility, such as energy storage.
The PV curtailment method applied differed based on the period of the day. since the PV system’s output increased rapidly during the morning period and similarly dropped during the afternoon period. Therefore, the PV curtailment method was divided into the morning period method and the afternoon period method. In the morning period, the earliest loss of load event was identified first, and the PV curtailment method was applied before advancing forward in time, since there were other loss of load events in the morning period until they were dealt with. In the afternoon period, the latest loss of load event was identified first, and the PV curtailment method was applied before advancing backward in time, since there were other loss of load events in the afternoon period until they were dealt with. Equations (24) and (25) presents the PV curtailment methods depending on the period of the day where the loss of load event was located.
where PVPR is the PV system’s power ramp and NLPR is the net load power ramp.
3. Results
This section illustrates the net load analysis in terms of assessing the net load’s pattern and ramping in the situation of increasing penetration level of PV power into the grid. Furthermore, this section presents the frequency stability analysis of the grid at an increased penetration level of large-scale PV systems and the grid’s potential hosting capacity evaluation with large-scale PV plants at various penetration levels to the grid.
3.1. Net Load Analysis
Net load can be defined as the load profile minus the renewable energy generated, and, in this case, it accounts for the PV system’s output. The net load is a useful metric to analyze the impact of integrating large-scale renewable energy into the grid as it gives an insight into the ramping requirements needed to accommodate both the variability and the availability of the renewable energy. It can also aid the calculations and measures used to minimize the impact on the grid, such as the curtailment of the renewables. Therefore, this section showcases the net load analysis to see the effect of increasing the PV system’s penetration level by up to the maximum possible (in this study, this is limited to 50%) peak load of the year. Furthermore, an assumption was made that the PV system’s output had priority over the output of the grid’s conventional generation system in the participation of meeting the load. This meant that the minimum operational output of the conventional generation system, ramping constraint, and transmission constraints were ignored in this case. Table 2 shows the PV system capacity based on the desired penetration level to the peak load. Figure 9 shows the sum of the PV system’s output at various capacities in Riyadh, 2017.

Table 2.
PV system capacity based on the desired penetration level to the peak load.
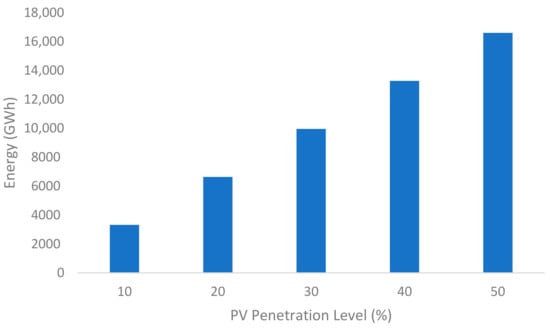
Figure 9.
The total PV system’s output at various penetration levels for the Riyadh, 2017, load.
3.1.1. Net Load Pattern
The grid operators faced increasingly variable net load shapes due to the increase in the share of the intermittent renewable energy. Usually, in countries with a hot climate, the power generated from the PV units coincided with the electricity demand in the summer period, as there was an increased need for cooling. This happened in the early mid-afternoon time of the day, which corresponded to the peak generation time of the PV units, leading to the reduction of the peak load. On the other hand, in winter, there was a lower cooling demand than summer. This leads to a different net load shape, as the peak load tended to be much lower. Additionally, the occurrence of the peak demand was in the early evening time when people tended to come back home from their workplace. This did not correspond to the peak generation time of the PV units, leading to a steeper net load ramping requirement to meet the peak load in the early evening. Therefore, in this part, the shape of the hourly net load in Riyadh, 2017, during the winter (January), spring (April), summer (June), and autumn (October) months was analyzed to see the effect of increasing the PV system penetration level by up to 50% of the peak load, as shown in Figure 10, Figure 11, Figure 12 and Figure 13. The reason for choosing the aforementioned months in the analysis was because they represented different load patterns due to the seasonal load variations in the year.
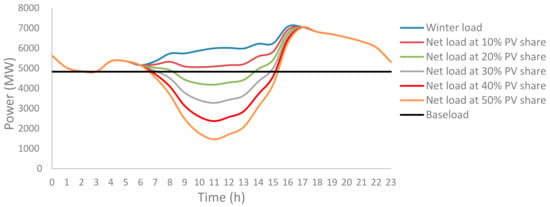
Figure 10.
The impact of the PV system penetration level on the grid in terms of net load during the winter season.
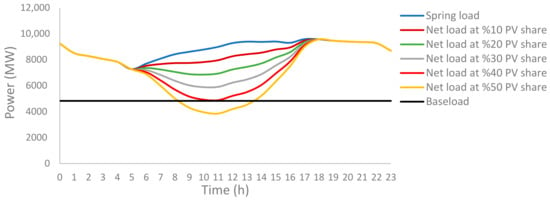
Figure 11.
The impact of the PV system penetration level on the grid in terms of net load during the spring season.
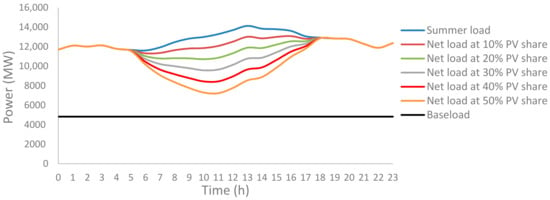
Figure 12.
The impact of the PV system penetration level on the grid in terms of net load during the summer season.
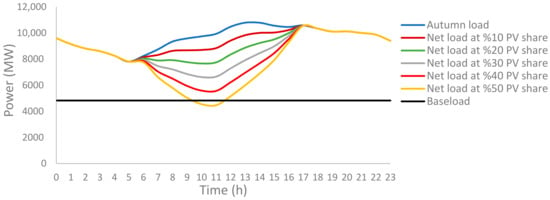
Figure 13.
The impact of the PV system penetration level on the grid in terms of net load during the autumn season.
According to Figure 10, the well-known California Independent System Operator (CAISO) duck curve [38] was visible in the winter load when the PV system’s penetration level was 20% and above. The PV over-generation phenomena could be observed in the case when the net load fell below the baseload point set, which enabled us to determine the applicable penetration level of the PV system, which could be integrated to the grid without causing stability issues. Therefore, in Figure 10, the only case when the PV penetration level did not result in over-generation was at 10%. Meanwhile, the penetration levels from 20% to 50% needed a flexibility measure from the grid to avoid the PV over-generation phenomena. Such grid flexibility measures can be in the form energy storage, renewable energy curtailment, and flexible generation [39]. The authors of [40] illustrated that, in recent years, two solutions were developed in order to aid the integration of the large-scale PV into the transmission network of the grid, which are the addition of energy storage and the development of smart controls for the large-scale PV system.
Furthermore, it is worth mentioning that the net load pattern in the spring and autumn seasons were slightly similar, according to Figure 11 and Figure 13. This can be due to having a slightly similar temperature. The only case when the PV penetration level did lead to over-generation was at 50%. On the other hand, during the summer season, when the load was much higher than the winter season, the PV penetration levels did not cause any over-generation phenomena, which can be observed in Figure 12. It is worth mentioning that the reason for the different net load pattern in terms of the over-generation phenomena was that the size of the PV system compared to the load profile in winter was much smaller when compared to the summer load profile. This was because penetration level was dependent on the peak load point that occurred in the summer season.
3.1.2. Net Load Ramping
In this part, the most important factor assessed was the power ramps at different time horizons, rather than the power production profile. The net load ramps were chosen as a metric to assess the ramping requirements of the grid system, and every alteration in the net load had to be maintained by the grid’s conventional generation system to ensure the stability of the grid’s system. The ramping requirements of the net load are clearly shown or represented by the ramp duration curve [41]. Therefore, the power ramps of the net load at different PV penetrations levels to the grid were compared to the power ramps of the original load. This was represented in a duration curve in terms of the ramping requirements per hour, which is shown in Figure 14. The duration curve in Figure 14 can be furtherly analyzed to showcase the ramping requirements for the grid’s conventional generation system at various PV penetration levels to the grid. Table 3 showcases the ramping requirements for the grid’s conventional generation system at various PV penetration levels to the grid in order to fully eliminate the curtailment of the PV energy due to the grid’s ramping constraint.
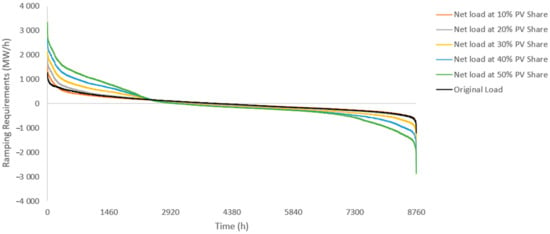
Figure 14.
Duration curve of the net load ramping requirements at various PV penetration levels to the grid in Riyadh, 2017.

Table 3.
Ramping requirements for the grid’s conventional generation system at various PV penetration levels to the grid in Riyadh, 2017.
According to Figure 14, the period from 1 to 1460 h coincided with the up ramping of the grid’s conventional generation system due to the down ramping of the PV system. Generally, most of this period coincided with the afternoon period. Meanwhile, the period from 7300 to 8760 h coincided with the down ramping of the grid’s conventional generation system due to the up ramping of the PV system. Generally, most of this period coincided with the morning period of the day. It can be deduced that, as the penetration level of the PV system increased, the ramping requirement of the grid’s conventional generation system increased significantly, and this can be seen clearly in Table 3. For example, this can be demonstrated when comparing the original load with the net load at 50% PV share, in which the magnitude of the ramping requirement increased considerably from 1268–3338 MW/h. This means that the system operators of the grid needed more than double their current ramping magnitude to deal with the PV system share. Furthermore, the up ramping of the grid’s conventional generation system was generally higher in the winter months when compared to the summer months. The reason for this may be due to the peak load point of the winter months, occurring in the early evening period, which did not correspond to the peak generation of the PV system.
3.2. Frequency Stability Analysis
This section analyzes the grid’s frequency against the size of the PV system and the size of the PV disturbance, with or without applying the grid constraints to the PV system. The location that was investigated was in the region of the city of Riyadh, Saudi Arabia, with a latitude of 24.91° N and a longitude of 46.41° E. According to [42], the available generation capacity in the central region of the Saudi grid is at a rated capacity of 16 GW, which will be used throughout this study. The city of Riyadh is part of the central region of the grid system, the generation type supplying the load is mainly thermal and, specifically, a gas turbine, with a smaller share of combined cycle [43]. According to the grid code of Saudi Arabia [44], the following points were applied to the conventional generation system of the grid in order to determine the frequency change:
- The nominal frequency was at 60 Hz.
- All generating units must be capable of supplying their rated active output power within the system frequency range of 59.5–60.5 at the connection point.
- Each synchronous generation unit was fitted with a fast-acting speed governor system to aid with the control of the power and frequency.
- The governor drop setting must have an adjustable value within 2% to 8% to regulate the frequency of the system. However, the normal set point of governor drop setting is generally set at 5%, which was used throughout this paper.
From the earlier mentioned points of the grid code, it can be deduced that when the frequency change or deviation was higher than ±0.5 Hz it caused the conventional generation system to be disconnected from the grid; thus, the loss of load phenomena occurred. For this scenario, the drop or speed regulation (R) at the normal set point of the governor droop setting (5%) was equal to 1.875 × 10⁻⁴ Hz/MW. The grid’s frequency (Hz) stability representation throughout the year without the inclusion of the PV system is shown in Figure 15. Overall assessment of the grid’s frequency stability in terms of the highest and lowest frequency, due to integrating the PV system without applying the grid constraints on the PV system, is shown in Table 4.
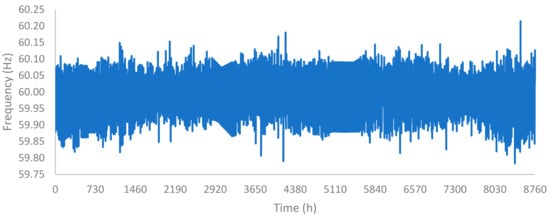
Figure 15.
Grid’s frequency (Hz) stability representation throughout the year without the inclusion of the PV system.

Table 4.
Overall assessment of the grid’s frequency stability due to integrating the PV system, without applying the grid constraints on the PV system.
Figure 15 shows that the frequency of the grid throughout the year was well maintained. However, as the PV system’s penetration level to the grid increased, the frequency stability deviated more, according to Table 4. This could be a result of the higher power ramps that accompanied the increase in the PV system’s penetration level to the grid. It is worth mentioning that the grid’s frequency experienced instability throughout the year when the PV system’s penetration level was 40% or higher. This was due to having a frequency deviation higher than the ±0.5 Hz allowable range. Furthermore, a clearer representation of the grid’s frequency deviation, due to being subjected to the inclusion of PV system with different penetration levels, could be showcased via a single day analysis, as shown in Figure 16.
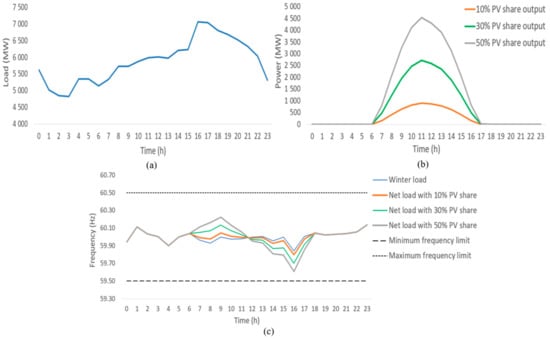
Figure 16.
(a) January’s average hourly daily load profile of Riyadh, 2017; (b) January’s PV output at various share capacities in Riyadh, 2017; (c) grid frequency representation of the January load of Riyadh, 2017, with the inclusion of the PV system at various capacities without grid constraints.
Figure 16 shows that the frequency stability was dependent on the net load’s pattern in terms of the netload power ramp, the size of the PV system, and the PV system’s output in terms of the magnitude of the solar irradiance. The sharp decrease in the frequency was due to the sharp increase of the load in the afternoon period, which coincided with the depletion of the PV system’s power. However, when the grid constraints were applied in this case, the frequency changed for the better, which is clearly shown in Figure 17. This positive affect on the frequency stability was due to the reduced participation of the PV system.
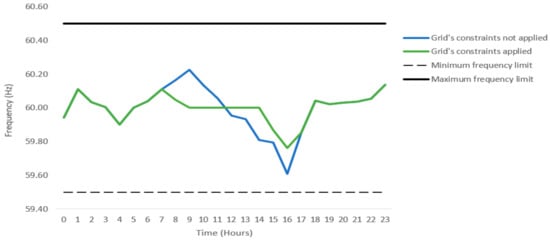
Figure 17.
Grid constraints effect on the grid frequency representation of the January load of Riyadh, 2017, with the inclusion of the PV system at 50% share.
The cause of the increase in the frequency was due to the increase in the negative net load power ramp, which could be a result of lowering the output of the conventional generation system. On the other hand, the cause of decrease in the frequency was due to the increase in the positive netload power ramp, which could be a result of increasing the output of the conventional generation system. The increase share of the PV output and the following load pattern were the reasons for alternating the output of the conventional generation system. So far, it is assumed that there was no disturbance occurring on the PV system. It is advised to investigate the effect of the size of the disturbance on the PV system with various PV capacities share, in which the frequency stability will be monitored at that disturbance instant. Thus, in this case, an assumption was made that a disturbance to the PV system with various sizes occurred at 12:00; therefore, the frequency stability was monitored at that instant of time, and this is presented in Figure 18.
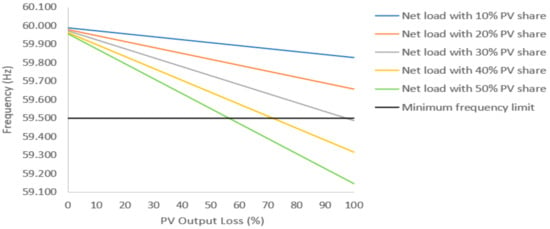
Figure 18.
Grid frequency representation of the effect of the size of PV disturbance on the January load of Riyadh, 2017, at 12:00, with the inclusion of the PV system at various capacities without grid constraint.
Figure 18 shows that the frequency stable during the winter (January) load at all various PV disturbance sizes when the PV share capacity was lower than 30%. Meanwhile, the frequency withstood a PV disturbance of a size no more than 50% when the goal was to increase the share to 50% of the PV capacity to the winter load. However, if the grid constraints were applied in this case the frequency would change for the better because the participation of the PV system would be reduced.
3.3. Grid’s Potential Hosting Capacity with Large-Scale Integrated PV Plants
This section presents the evaluation of the grid’s current potential hosting capacity with large-scale PV plants at various penetration levels to the grid. This evaluation focuses on showing the substantial affects that each grid constraint had on the performance of the PV system in terms of PV curtailment. PV curtailment is the grid’s traditional method of dealing with its constraints being violated by the large-scale PV system’s variable generation. The PV system’s performance in terms of the PV curtailment sum and the PV curtailment percentage is assessed here, only applying the PV curtailment method to abide with the grid’s constraints. In doing so, this section will show that this method that can be used to establish the appropriate flexibility measures to ensure both the reduction of the PV curtailment and minimize the impact of integrating large-scale PV into the grid. Furthermore, it is worth mentioning that, since we were trying to assess the current potential hosting capacity of the grid, the GRC was based on the maximum power ramp of the original load profile, without the inclusion of the PV system. Therefore, the applied grid constraints were 4282 MW for the baseload constraint and 1268 MW for the ramping constraint. Additionally, it was assumed that there were no transmission constraints in terms of congestion or interconnected capability to import or export power from neighboring grids. Table 5 shows the PV system’s performance in terms of the PV curtailment sum and PV curtailment percentage at various PV penetration levels to the grid.

Table 5.
PV system’s performance in terms of curtailing the PV system due to the grid’s constraints at various PV penetration levels to the grid in Riyadh, 2017.
The PV system’s performance throughout the year, as shown in Table 5, showcased the significant difference that each grid constraint had on performance of the PV system at various PV penetration levels to the grid. In particular, the baseload constraint resulted in the majority share of PV curtailment when compared to the results of the ramping constraint. Furthermore, it can be deduced that, as the PV penetration level to the grid increased, the PV curtailment dramatically increased, as well. An example of this can be seen, in which the PV curtailment percentage increased from 0.08% to 21.99% as the PV penetration level to the grid increased from 10% to 50%. It is also worth mentioning that, since the load profile and the PV system output varied throughout the year, it is important to show the PV system performance of each month to illustrate the seasonal variations effects on the PV system’s performance. Thus, a specific PV penetration level of 50% to the grid was chosen to clearly illustrate the seasonal variations effects on the PV system’s performance, which is shown in Figure 19.
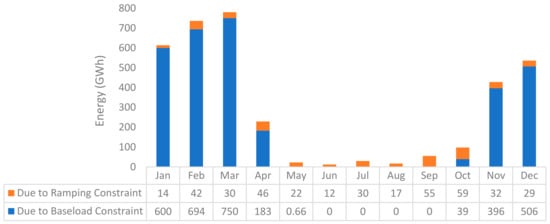
Figure 19.
Sum of the PV system’s curtailed energy in GWh for each month due to the grid’s constraints at 50% PV penetration level to the grid in Riyadh, 2017.
According to the PV system performance of each month, as shown in Figure 19, the effects of the ramping constraint were present throughout the year, while the baseload constraint effects were only present in the winter season, when the load profile was at its lowest. Hence, the potential flexibility measure applied might not be optimally or economically suitable to tackle at the same instance, leading to the point of having flexibility measures that target each grid constraint on itself. Therefore, a diurnal source of flexibility is required to manage the ramping constraint effects, while a seasonal source of flexibility is required to manage the baseload constraint effects.
4. Discussion
Mitigating the variability of the PV system can be easily done when the grid is able to match the supply of the renewable to the demand [45]. However, it is very costly to accommodate the supply of the PV system when it moves in the opposite direction of the demand, for example, in the case of having a high supply of PV energy when there is a low demand. This means that the surplus PV energy can be only utilized if the conventional baseload generators are curtailed, which will be a costly and inefficient method that might lead to considerable reliability issues. On the other hand, there is the case of having a low supply of PV energy when there is a high demand. This means that the conventional generation system must completely reach the peak demand, which will require it to have a reserve that can successfully replicate the capacity of the renewable energy. Therefore, reducing the cost of dealing with the two cases is a major challenge facing the integration of renewables to the grid.
A debate can be made on whether the curtailment of the PV system can be seen as either a problem or a solution. On the other hand, curtailing the PV system can be problematic because it reduces the capacity factor, which can potentially decrease the revenue of that generation. This may weaken the confidence of the investors since the PV technology has low operating costs but has high capital costs that can be retrieved by maximizing the energy output. Similarly, when the conventional generation system in the grid is not able to be switched down to a lower output that will enable the accommodation of more available PV energy, negative wholesale prices are sustained, which reduces the attractiveness of the investment into renewable generation [46]. The authors of [47] illustrated that the owners face significant risks of not being able pay off the existing project loans when increasing the curtailment beyond a specific threshold; in this case, 5%.
Currently, the operators of the grid deal with the variability of the renewable generation almost exclusively via cycling its conventional generation system according to the forecasting of the weather. However, the grid will soon go through high shares of renewables, making this current method costly and unreliable in some cases. This can be observed in the results, when the PV curtailment percentage increased from 0.08% to 21.99% as the PV penetration level to the grid increased from 10% to 50%. In particular, the effects of the baseload constraint were only present during the winter period when the demand was at its lowest and contributed to 89% of the overall PV curtailed energy throughout the year at 50% PV penetration level to the grid. Meanwhile, the effects of the ramping constraint were present throughout the year at 50% PV penetration level to the grid. This is a quite wasteful approach for utilizing clean energy and limits the grid’s hosting capacity for the PV system. Therefore, this leads to the need for a more reliable and cost-effective approach from the generation side in dealing with this matter, which can be implemented by applying flexibility measures, such as energy storage. It is worth mentioning that there are various types of energy storage technologies that can be application specific. This means that energy storage as a concept can be applied to both the required diurnal source of flexibility, to manage the ramping constraint effects, and the required seasonal source of flexibility, to manage the baseload constraint effects.
Batteries could be used as the required diurnal source of flexibility to manage the ramping constraint effects. In particular, lithium-ion batteries would be the ideal candidate, due to their higher energy density, higher efficiency, and quicker charging/discharging cycles, compared to other types of batteries [48]. Furthermore, the increase demand of energy storage technologies, innovations in the material’s science, and the improvement in the manufacturing process are the attributes reducing the cost of the lithium-ion batteries, which are predicted to hit 100 USD/kWh in the next decade [49]. There might be other energy storage technologies that may fall below the 100 USD/kWh cost, but they will lack the lithium-ion batteries applicability, which is the main reason for their market demand gain despite their higher costs.
Seasonal storage has limited energy storage technologies that can achieve its requirements at the current time. Pumped Hydroelectric Storage (PHS) and Compressed Air Energy Storage (CAES) are currently the two systems closest to ideal technology candidates for seasonal storage. However, in this case, they lack the cost effectiveness and non-geographical constraint aspects. On the other hand, emerging storage technology called Liquid Air Energy Storage (LAES) represents an intriguing solution that can replace the current two systems closest to ideal candidates by outweighing their disadvantages, since LAES has no geographical constraints and has a significantly higher energy density [50]. Furthermore, green ammonia might be a future perfect candidate for seasonal storage due to its high energy density, simple storage requirements, likelihood of a large future global supply chain, and potential of being a zero carbon option with the lowest costs [51]. It is worth mentioning that there is great interest in exporting energy via green ammonia at Saudi Arabia, and plans are being formed to have a 4 GW green ammonia plant operational by 2025 [52].
The applied grid constraints were based on what the grid currently deals with, since the goal was to minimize the large-scale PV system’s impact on the grid. The Kingdom of Saudi Arabia generates all its electricity from fossil fuel energy sources, such as crude oil, diesel oil, heavy fuel oil, and natural gas [53]. This type of generation mix provides the grid with more flexibility in accommodating more PV generation shares when compared to other less flexible generation sources, such as coal and nuclear plants. Therefore, the grid may be able to be more PV accommodating without applying the flexibility measures by reducing the baseload constraint and increasing the ramping constraint. However, this will increase the stress and wear of the grid’s conventional generation system and does not take into account the country’s future plans of incorporating nuclear baseload plants to its generation mix.
5. Conclusions
This paper presents a detailed description of the aspects undertaken to design and model the PV system, which includes the sizing of the PV array, the efficiency of the inverter, the other system losses, and the PV array mathematical representation. In doing so, the net load analysis was performed to illustrate the change in load pattern effect and ramping requirements due to the increase of the large-scale PV penetration level into the electrical grid in Riyadh, 2017. The PV over-generation phenomena can be observed when the net load falls below the baseload point set. This enables the determination of the applicable penetration level for the PV system, which can be integrated into the grid without causing stability issues. The net load was also used to analyze the impact of integrating large-scale PV into the grid, because it gave an insight into the ramping requirements needed by the grid’s conventional generation system to accommodate both the variability and availability of the renewable. Furthermore, under some circumstances of up ramping the grid’s conventional generation system, while down ramping the renewable, and vice versa, severe net load ramp events can occur that are beyond the grid’s technical capability. It can be deduced that, as the penetration level of the PV system increases, the ramping requirement of the grid’s conventional generation system increases dramatically. This was observed when the ramping requirement of the original load was compared with the net load at 50% PV penetration level, while the magnitude of the ramping requirement increased considerably from 1268–3338 MW/h.
In addition, this paper presents the method used to calculate the grid’s frequency and illustrates the PV curtailment method, which was applied to comply with the grid’s constraints. This enabled the assessment of the grid’s potential hosting capacity with large-scale integrated PV plants. The highest frequency reached was 60.54 Hz, and the lowest frequency reached was 59.37 Hz when the PV penetration level to the grid was at 50%. The cause of the increase in the frequency was the increase in the negative net load power ramp, which could be a result of lowering the output of the conventional generation system. On the other hand, the cause of decrease in the frequency the increase in the positive net load power ramp, which could be a result of increasing the output of the conventional generation system. Furthermore, increasing the penetration level of the large-scale PV into the grid causes the grid operators to face increasingly variable net load patterns and steeper ramping events. This is a major concern for the grid operators and requires grid flexibility measures to be applied in the form of energy storage. The evaluation of the grid’s current potential hosting capacity with large-scale PV plants at various PV penetration levels to the grid showcased that the potential flexibility measure applied might not be optimally or economically suitable to tackle both constraints at the same instance. This was observed when the PV curtailment percentage reached 21.99% at 50% PV penetration level to the grid, in which the PV curtailment percentage accounted for 19.1% due to baseload constraint and 2.89% due to ramping constraint. This leads to the discussion of having flexibility measures that target each grid constraint on itself. Therefore, a diurnal source of flexibility is required to manage the ramping constraint effects, while a seasonal source of flexibility is required to manage the baseload constraint effects. In doing so, it will ensure the reduction of the PV curtailment and minimize the impact of integrating large-scale PV into the grid.
Author Contributions
S.O. and A.A. comprehended the presented idea. A.A. developed models, carried out simulations, analyzed with interpreting the results, and took the lead in writing the manuscript. S.O. and Y.S. contributed to the revision of the draft and the final version of the manuscript and supervised the project. All authors have read and agreed to the published version of the manuscript.
Funding
This research received no external funding.
Conflicts of Interest
The authors declare no conflict of interest.
References
- Markvart, T. Solar Electricity; John Wiley & Sons: Chichester, UK, 2000; Volume 6. [Google Scholar]
- Ackermann, T.; Andersson, G.; Söder, L. Distributed generation: A definition. Electr. Power Syst. Res. 2001, 57, 195–204. [Google Scholar] [CrossRef]
- Zhang, H.L.; Baeyens, J.; Degrève, J.; Cacères, G. Concentrated solar power plants: Review and design methodology. Renew. Sustain. Energy Rev. 2013, 22, 466–481. [Google Scholar] [CrossRef]
- Li, Q.; Wolfs, P. A Review of the Single Phase Photovoltaic Module Integrated Converter Topologies With Three Different DC Link Configurations. IEEE Trans. Power Electron. 2008, 23, 1320–1333. [Google Scholar] [CrossRef]
- Alshahrani, A.; Omer, S.; Su, Y.; Mohamed, E.; Alotaibi, S. The Technical Challenges Facing the Integration of Small-Scale and Large-scale PV Systems into the Grid: A Critical Review. Electronics 2019, 8, 1443. [Google Scholar] [CrossRef]
- Abdlrahem, A.; Venayagamoorthy, G.K.; Corzine, K.A. Frequency stability and control of a power system with large PV plants using PMU information. In Proceedings of the 2013 North American Power Symposium (NAPS), Manhattan, KS, USA, 22–24 September 2013; pp. 1–6. [Google Scholar]
- Feilat, E.A.; Azzam, S.; Al-Salaymeh, A. Impact of large PV and wind power plants on voltage and frequency stability of Jordan’s national grid. Sustain. Cities Soc. 2018, 36, 257–271. [Google Scholar] [CrossRef]
- Remon, D.; Cantarellas, A.M.; Mauricio, J.M.; Rodriguez, P. Power system stability analysis under increasing penetration of photovoltaic power plants with synchronous power controllers. IET Renew. Power Gener. 2017, 11, 733–741. [Google Scholar] [CrossRef]
- Sultan, M.H.; Diab, A.A.; Kuznetsov, N.O.; Ali, M.Z.; Abdalla, O. Evaluation of the Impact of High Penetration Levels of PV Power Plants on the Capacity, Frequency and Voltage Stability of Egypt’s Unified Grid. Energies 2019, 12, 552. [Google Scholar] [CrossRef]
- Bollen, M.H.J.; Rönnberg, S.K. Hosting Capacity of the Power Grid for Renewable Electricity Production and New Large Consumption Equipment. Energies 2017, 10, 1325. [Google Scholar] [CrossRef]
- Sakar, S.; Balci, M.E.; Abdel Aleem, S.H.E.; Zobaa, A.F. Increasing PV hosting capacity in distorted distribution systems using passive harmonic filtering. Electr. Power Syst. Res. 2017, 148, 74–86. [Google Scholar] [CrossRef]
- Oliveira, T.E.C.d.; Carvalho, P.M.S.; Ribeiro, P.F.; Bonatto, B.D. PV Hosting Capacity Dependence on Harmonic Voltage Distortion in Low-Voltage Grids: Model Validation with Experimental Data. Energies 2018, 11, 465. [Google Scholar] [CrossRef]
- Gupta, R.; Sossan, F.; Paolone, M. Countrywide PV hosting capacity and energy storage requirements for distribution networks: The case of Switzerland. Appl. Energy 2021, 281, 116010. [Google Scholar] [CrossRef]
- Md Saad, S.N.; van der Weijde, A.H. Evaluating the Potential of Hosting Capacity Enhancement Using Integrated Grid Planning modeling Methods. Energies 2019, 12, 3610. [Google Scholar] [CrossRef]
- Saudi Electricity Company. Load Profile. Riyadh, Saudi Arabia, 2017. Available online: https://www.se.com.sa/en-us/Pages/AnnualReports.aspx (accessed on 25 April 2021).
- King Abdullah City for Atomic and Renewable Energy. Station Report: Renewable Resource Atlas. Riyadh, Saudi Arabia, 2017. Available online: https://rratlas.energy.gov.sa/RRMMPublicPortal/?q=en/Home (accessed on 25 April 2021).
- Ortiz-Rivera, E.I.; Peng, F.Z. Analytical model for a photovoltaic module using the electrical characteristics provided by the manufacturer data sheet. In Proceedings of the Power Electronics Specialists Conference, PESC′05. IEEE 36th, Dresden, Germany, 16 June 2005; pp. 2087–2091. [Google Scholar]
- Quezada, V.M.; Abbad, J.R.; Roman, T.G.S. Assessment of energy distribution losses for increasing penetration of distributed generation. IEEE Trans. power Syst. 2006, 21, 533–540. [Google Scholar]
- Paatero, J.V.; Lund, P.D. Effects of large-scale photovoltaic power integration on electricity distribution networks. Renew. Energy 2007, 32, 216–234. [Google Scholar] [CrossRef]
- Ropp, M.; Begovic, M.; Rohatgi, A. Determination of the curvature derating factor for the Georgia Tech Aquatic Center photovoltaic array. In Proceedings of the Photovoltaic Specialists Conference, Conference Record of the Twenty-Sixth IEEE, Anaheim, CA, USA, 29 September–3 October 1997; pp. 1297–1300. [Google Scholar]
- Tang, R.-l.; Wu, Z.; Fang, Y.-j. Topological Structure of Large-scale Photovoltaic Array and its MPPT Controlling Method. Energy Procedia 2017, 105, 113–118. [Google Scholar] [CrossRef]
- Pasc, P.C.; Dumitru, C.D. Software Solution Design for Photovoltaic Solar Applications. Procedia Technol. 2015, 19, 695–702. [Google Scholar] [CrossRef][Green Version]
- Good, J.; Johnson, J.X. Impact of inverter loading ratio on solar photovoltaic system performance. Appl. Energy 2016, 177, 475–486. [Google Scholar] [CrossRef]
- PVsyst Database. ABB Central Inverters PVS800 500 kW. Satigny, Switzerland, 2021. Available online: https://www.pvsyst.com/ (accessed on 25 April 2021).
- Kjaer, S.B.; Pedersen, J.K.; Blaabjerg, F. A review of single-phase grid-connected inverters for photovoltaic modules. IEEE Trans. Ind. Appl. 2005, 41, 1292–1306. [Google Scholar] [CrossRef]
- Chouder, A.; Silvestre, S. Automatic supervision and fault detection of PV systems based on power losses analysis. Energy Convers. Manag. 2010, 51, 1929–1937. [Google Scholar] [CrossRef]
- Oozeki, T.; Izawa, T.; Otani, K.; Kurokawa, K. An evaluation method of PV systems. Sol. Energy Mater. Sol. Cells 2003, 75, 687–695. [Google Scholar] [CrossRef]
- HemanthBabu, N.; Shivashimpiger, S.; Samanvita, N.; Parthasarathy, V. Performance ratio and loss analysis for 20 MW grid connected solar PV system-case study. Int. J. Eng. Adv. Technol. 2019, 8, 20–25. [Google Scholar]
- Huber, M.; Dimkova, D.; Hamacher, T. Integration of wind and solar power in Europe: Assessment of flexibility requirements. Energy 2014, 69, 236–246. [Google Scholar] [CrossRef]
- Venkatasubramanian, M.; Tomsovic, K. 8-Power System Operation and Control. In The Electrical Engineering Handbook; Chen, W.-K., Ed.; Academic Press: Burlington, NJ, USA, 2005; pp. 779–785. [Google Scholar]
- Chen, W.K. The Electrical Engineering Handbook; Elsevier Science: Amsterdam, The Netherlands, 2004. [Google Scholar]
- Renn, O.; Marshall, J.P. Coal, nuclear and renewable energy policies in Germany: From the 1950s to the “Energiewende”. Energy Policy 2016, 99, 224–232. [Google Scholar] [CrossRef]
- Kamath, C. Understanding wind ramp events through analysis of historical data. In Proceedings of the Transmission and Distribution Conference and Exposition, IEEE PES, New Orleans, LA, USA, 19–22 April 2010; pp. 1–6. [Google Scholar]
- Cui, M.; Zhang, J.; Feng, C.; Florita, A.R.; Sun, Y.; Hodge, B.-M. Characterizing and analyzing ramping events in wind power, solar power, load, and netload. Renew. Energy 2017, 111, 227–244. [Google Scholar] [CrossRef]
- Meibom, P.; Weber, C.; Barth, R.; Brand, H. Operational costs induced by fluctuating wind power production in Germany and Scandinavia. IET Renew. Power Gener. 2009, 3, 75–83. [Google Scholar] [CrossRef]
- Van den Bergh, K.; Delarue, E. Cycling of conventional power plants: Technical limits and actual costs. Energy Convers. Manag. 2015, 97, 70–77. [Google Scholar] [CrossRef]
- Khan, K.R.; Abou-Arkoub, A.A.; Newtown, M.J. Evaluation of loss of load probability and expected energy generation in multi-area interconnected systems with wind generating units. In Proceedings of the 2013 IEEE International Conference on Smart Energy Grid Engineering (SEGE), Oshawa, ON, Canada, 28–30 August 2013; pp. 1–8. [Google Scholar]
- Grueneich, D.M. The Next Level of Energy Efficiency: The Five Challenges Ahead. Electr. J. 2015, 28, 44–56. [Google Scholar] [CrossRef]
- Kondziella, H.; Bruckner, T. Flexibility requirements of renewable energy based electricity systems—A review of research results and methodologies. Renew. Sustain. Energy Rev. 2016, 53, 10–22. [Google Scholar] [CrossRef]
- Cabrera-Tobar, A.; Bullich-Massagué, E.; Aragüés-Peñalba, M.; Gomis-Bellmunt, O. Review of advanced grid requirements for the integration of large scale photovoltaic power plants in the transmission system. Renew. Sustain. Energy Rev. 2016, 62, 971–987. [Google Scholar] [CrossRef]
- Wu, Y.-K.; Chang, L.-T.; Su, P.-E.; Hsieh, T.-Y.; Jan, B.-S. Assessment of Potential Variability of Net Load Following the Integration of 3 GW Wind Power in Taiwan. Energy Procedia 2016, 100, 117–121. [Google Scholar] [CrossRef]
- Saudi Electricity & Co-Generation Regulatory Authority (ECRA). 2017 Statistical Booklet. 2017. Available online: https://ecra.gov.sa/en-us/MediaCenter/DocLib2/pages/DocLib.aspx (accessed on 25 April 2021).
- Wogan, D.; Shreekar, P.; Shahad, A. GCC Energy System Overview–2017; KAPSARC: Riyadh, Saudi Arabia, 2017. [Google Scholar]
- Saudi Electricity & Co-Generation Regulatory Authority (ECRA). The Saudi Arabian Grid Code. 2016. Available online: https://www.ecra.gov.sa/en-us/ECRARegulations/Codes/ (accessed on 25 April 2021).
- Jones, J. Balancing Act: How Can We Deal with Variability? Renewable Energy World, 2011; Available online: https://www.renewableenergyworld.com/baseload/balancing-act/#gref (accessed on 25 April 2021).
- Cochran, J.; Miller, M.; Zinaman, O.; Milligan, M.; Arent, D.; Palmintier, B.; O’Malley, M.; Mueller, S.; Lannoye, E.; Tuohy, A. Flexibility in 21st Century Power Systems; National Renewable Energy Lab.(NREL): Golden, CO, USA, 2014. [Google Scholar]
- Golden, R.; Paulos, B. Curtailment of Renewable Energy in California and Beyond. Electr. J. 2015, 28, 36–50. [Google Scholar] [CrossRef]
- Opiyo, N. Energy storage systems for PV-based communal grids. J. Energy Storage 2016, 7, 1–12. [Google Scholar] [CrossRef]
- Penisa, X.N.; Castro, M.T.; Pascasio, J.D.A.; Esparcia, E.A.; Schmidt, O.; Ocon, J.D. Projecting the Price of Lithium-Ion NMC Battery Packs Using a Multifactor Learning Curve Model. Energies 2020, 13, 5276. [Google Scholar] [CrossRef]
- Stöver, B.; Alekseev, A.; Stiller, C. Liquid air energy storage (LAES) development status and benchmarking with other storage technologies. In Proceedings of the Power-Gen Europe, Cologne, Germany, 3 June 2014; pp. 3–5. [Google Scholar]
- Cesaro, Z.; Ives, M.; Nayak-Luke, R.; Mason, M.; Bañares-Alcántara, R. Ammonia to power: Forecasting the levelized cost of electricity from green ammonia in large-scale power plants. Appl. Energy 2021, 282, 116009. [Google Scholar] [CrossRef]
- Jeerh, G.; Zhang, M.; Tao, S. Recent progress on ammonia fuel cells and their potential applications. J. Mater. Chem. A 2020, 9, 727–752. [Google Scholar] [CrossRef]
- Demirbas, A.; Hashem, A.A.; Bakhsh, A.A. The cost analysis of electric power generation in Saudi Arabia. Energy Sources Part B Econ. Plan. Policy 2017, 12, 591–596. [Google Scholar] [CrossRef]
Publisher’s Note: MDPI stays neutral with regard to jurisdictional claims in published maps and institutional affiliations. |
© 2021 by the authors. Licensee MDPI, Basel, Switzerland. This article is an open access article distributed under the terms and conditions of the Creative Commons Attribution (CC BY) license (https://creativecommons.org/licenses/by/4.0/).