Abstract
On the Semantic Web, resources are connected to each other by the IRI. As the basic unit is comprised of linked data, machines can use semantic data and reason their relations without additional intervention on the Semantic Web. However, it is necessary for users who first encounter the Semantic Web to understand its underlying structure and some grammatical rules. This study suggests linking data sets of the Semantic Web through the Euler diagram, which does not require any prior knowledge. We performed a user study with our relationship-building system and verified that users could better understand linked data through the usage of the system. Users can indirectly be guided by using our Euler diagram-based data relationship-building system to understand the Semantic Web and its data linkage system. We also expect that the data sets defined through our system can be used in various applications.
1. Introduction
The Semantic Web [1] is a technology that expresses resources on the web as linked data [2] and processes them with automated machines. The web was proposed by Tim Berners-Lee, the founder of the web, aiming to make computers understand the web better. Linked data is a form of data representation on the web and based on a triple [3] structure. A triple is an expression that defines the relationship among objects. Each element is identified by the IRI (Internationalized Resource Identifier) [4] on the web and can be accessed. The IRI is expressed in a form that can be processed by a machine through the RDF (Resource Description Framework) [3], and in the RDF, triples are also expressed as (entity-attribute-value).
To manage the Semantic Web, general users need to understand the underlying structure and the RDF, the data expression standard. Users can access the linked data with the query language called SPARQL [5] (SPARQL Protocol and RDF Query Language) on the Semantic Web. The Semantic Web itself is widely recognized as having the potential for application value [6]. Still, in reality, it is not being selected by the market or public industry [7] even though a considerable amount of time has passed since the Semantic Web concept was proposed.
There are excellent tools such as [8,9], but for non-expert users who do not have technical backgrounds, it is still difficult to use existing tools. This was the motivation for our work. In this study, we tried to reduce the excessive amount of knowledge required for dealing with the Semantic Web, which can be considered one reason the general users neglected the Semantic Web technology. The Semantic Web Portal [10] argued that the method of displaying, browsing, and querying semantic data is an obstacle to understanding Semantic Web technology as a factor that is not user-friendly.
If an end-user wants to put information with the IRI on the Semantic Web, the user needs a comprehensive understanding of the linked data structure, RDF syntax, and ontology [11], and SPARQL for queries is required. Users can suffer fatigue compared to the traditional web, which supports various browsers and authoring tools for posting documents. Therefore, we proposed a methodology that allows users to establish linkages among data without grammar knowledge of the Semantic Web, especially the RDF OWL [12].
In this study, we suggested building relationships with a Euler diagram concerning two IRIs without additional input. Users of this system can use the program for two purposes. First, it is a simple authoring for linked data. By simply writing the subject-predicate-object, the user can perform the work corresponding to the inclusion and partial overlapping relationship instantly. At this point, the system processes the data dump extracted from DBpedia [13] according to the relationship defined by the user. Second, the user can use the reasoning function. It provides a function to reason whether a relationship between two entities is established. If a relationship created in this program is included, a search can be performed at high speed.
As shown in Table 1, users need to understand the overall Semantic Web layer, the RDF, SPARQL, and OWL detailed concepts, grammatical, and technical detailed knowledge in the existing model.The Euler diagram model proposed in this study is used to understand the overall Semantic Web layer and the triple model. It is enough to understand the structure and query method. In addition, understanding of the overall Semantic Web layer can also be acquired naturally in the process of performing the following relationship definition.

Table 1.
Comparison with traditional requirements.
The main novelty of the current work is as follows. First, our approach can help non-expert users understand linked data without a technical background. It can certainly decrease the entry-level barrier to working with linked data. Second, inferencing with simple linked data can be done quickly based on the model using a Euler diagram.
Our work is related to the following research.
1.1. Similar Cases Using Euler Diagrams for Research
In particular, Euler diagrams have strength in visualizing complex correlations so that they can be recognized at a glance, and there are examples of using Euler diagrams for research. Reference [14] was a study on how to convert FOL (First-Order Logic) to be expressed by reasoning into a Euler diagram. Reasoning is the orientation point of the Semantic Web introduced above and refers to the process by which a machine derives new information through given information. References [15,16] were not Euler diagrams, but have similarities with this study in that they constructed data for use in the Semantic Web by utilizing each structured model. Likewise, there are many studies that try to plot reasoning as a Euler diagram [17,18]. However, in the case of the above studies, this is close to replacing the existing expression language such as the RDF with a Euler diagram form by focusing on viewing the Euler diagram as a single expression style. This is a somewhat different approach from dealing with Euler diagrams as a condensed model of ontology in this study.
1.2. Similar Cases to Improve the Ontology Model in a User-Friendly Way
There has also been an attempt to deliver the ontology model to users as easily as possible. Research exists to provide individualized models to each user [19]. Likewise, in the case of GRAPHOL [20], to provide an entry point in a familiar form to users without Semantic Web background knowledge, an ontology grammar in graphic form was proposed. SWRL [21] tried to expand the extension by improving the Semantic Web language based on OWL. The FOGA framework [22] dealt with the creation of the ontology through fuzzy logic, which is a way to include uncertain values in the information as it deviates from the binary logic of the ontology construction stage. Configuring the ontology using its own framework is related to our study, which standardizes data using presets, but our study focused on the direction of matching the existing standard values rather than newly defining the standardized result values. Similarly, References [23,24,25] focused on the study of constructing an ontology model from text data. Similarly, in [26,27], an ontology model was constructed from a structured schema.
1.3. Existing Reasoner and Comparative Advantage of This Study
There are similarities with the EYE reasoner [28] in the use of the results. In the case of EYE, it is a Semantic Web reasoner that infers the relation using the Euler path. When a query about whether there is a connection relationship with other objects in a specific object is received, the search is performed through backward tracking. Jena [8] is a toolkit that utilizes RDF graphs and attempts to form a triple structure between graphs and graphs using the OWL inference process. Looking at the raw format of linked data, entities are connected based on the predicate as shown in Figure 1. Here, each ellipse is repeatedly connected to other ellipses. Reasoners aim to find a path for how two specific entities are connected. The existing reasoners’ search method introduced above has to search all objects connected to a specific object, so when more than two levels of reasoning are performed, the calculation efficiency gradually decreases. In this method, the computational complexity is O() (n: average number of predicates connected to entity m, the distance from entity A to B (depth)).
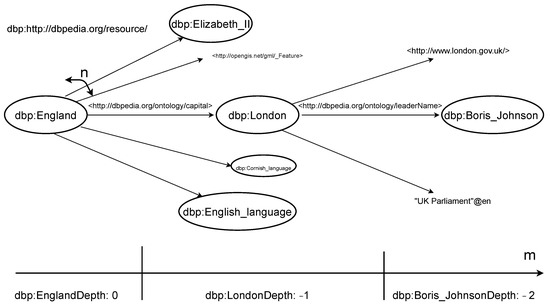
Figure 1.
n: average number of predicates connected to entity m, distance from entity A to B.
1.4. Comparison with State-of-the-Art Approach
As the latest research, Reference [29] provided a model using MDE (Model-Driven Engineering) so that it can be easily proceeded when creating an ontology. Providing a model for easily creating the ontology is similar to this study, but unlike our study targeting non-experts on the Semantic Web, in [29], the user who creates the ontology on the Semantic Web is considered a domain expert. Reference [30] attempted to use the ontology in the healthcare domain, focusing on the fact that the Semantic Web is specialized for handling large and vast data. Likewise, as in [31], various attempts have been made to incorporate the Semantic Web into other state-of-the art fields such as E-learning. In Reference [32], the authoring tool was judged to be insufficient from the user’s point of view, and an experiment using the widely used authoring tool, Protégé, was conducted to study how the authoring tool was utilized in practice.
In this study, the connection relationship of the result can be inquired through the query function as the existing reasoners. Furthermore, in the case of relationships defined through the Euler diagram hierarchy, relationship inferences can be made faster than general reasoners. The calculation of the relationship defined through the Euler diagram is performed as described below.
First, to find if a connection relationship exists between object A and object B, the index of the predicate connected to object A is first searched. If object A and object B share a specific predicate and both have indexes, the predicate is used preferentially to search for the connection relationship. In other words, if there is an index of a predicate shared by A and B, the computational complexity is O(n) (n: total number of entities). References [33,34] showed that models using an ontology can be used in practical fields. Likewise, since the data authored through this model are structured, it is believed that this can be used in conjunction with other semantic systems.
2. Semantic Web Relationship Connection System
This study aimed to reduce the barriers to entry for Semantic Web authoring and improve computational efficiency in retrieving the relations using this authoring tool.
Although a considerable amount of time has passed since the concept of the Semantic Web was proposed, there is the problem that much prior knowledge is required for new users to enter. In order to solve this problem, this study proposes a Semantic Web relation authoring tool using a Euler diagram that enables users who do not know the Semantic Web grammar to perform relation authoring on the Semantic Web smoothly without difficulty. Users who are not familiar with the Semantic Web can define relations between entities without knowledge of the entire Semantic Web by selecting the Euler diagram model preset and contribute to the ecosystem by performing a series of definition processes in accordance with the Semantic Web format. This process of defining helps to create more accurate and productive values for “the web that machines understand”, which does not require human intervention.
In addition, in the process of defining the Euler diagram, the relation contains the upper and lower relations between entities according to the Euler diagram model. In this system, the hierarchical level for each predicate is stored by utilizing this hierarchical relationship, and a computationally efficient approach compared to the existing method was sought when searching for relations according to the hierarchical level. For example, when selecting an inclusion relationship, an index value is assigned to the selected predicate as entities A and B are in a parental relationship, and if the same predicate is used in the relationship between entity B and C in the future, the commonly used index value is stored directly. The main point is that A and C, which are not connected, can also infer their hierarchical relationship through the index value, which increases the computational efficiency.
2.1. Full Proposed Method
- Assume a scenario in which a user selects two entities for which a relationship is to be formed from the linked data dump and the relationship between the entities is configured on the Semantic Web;
- The model most similar to the relationship between the two entities is selected from the Euler diagram model proposed by the system. For example, if each entity corresponds to an apple or fruit, the inclusion relationship model is selected;
- Match the entity’s position within the selected Euler diagram model. In the inclusion model, the fruit selects to which circle on the Euler diagram and to which area the apple belongs;
- The relationship that the user wants to configure through 1–3 is automatically configured, and then, it is checked whether the configured relationship is well searched through the query button. In other words, the connection on the Semantic Web is established by matching the contents of “apples belong to fruit” on the Euler diagram.
The above procedure is largely divided into the following two parts.
- The relationship between entities is defined through the ontology model selected by the user using the Euler diagram.
- The definitions are merged into the main data set for effective calculation.
2.2. Add Rule Using the Euler Diagram
The first part proceeds as follows. The user wants to specify the connection relationship between entity A and entity B in the Semantic Web environment through predicate p. In this situation, the connection relationship that the user wants to create is expressed in a triple format as follows: (entity A—predicate p—entity B). In this study, the user selects the connection relationship by looking at the Euler diagram model defined in advance. For example, assume that a user has a relationship in Figure 2 that entity “Seoul” and entity “Korea” are connected by predicate “belongs to” (entity “Seoul”-predicate “belongs to”-entity “Korea”).
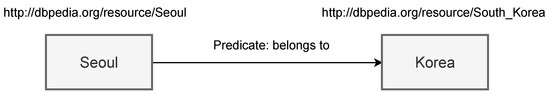
Figure 2.
Triple (Seoul: belongs to Korea).
In this situation, the user is presented with a Euler diagram option and selects a region more suitable for the relationship among the inclusion model and the partial overlap model. In the case of “Seoul”-“belongs to”-“Korea” suggested in the example, the inclusion model is selected because the subject includes the object.
In the existing method, users need a general understanding of the n3 grammar and the linked database in order to compose a triple related to Seoul and Korea. However, in the proposed method, all one has to do is select the Euler diagram that most closely resembles the one meaning predicate: belongs to.
2.3. Euler Diagram Classification
Assume a scenario in which “Seoul belongs to Korea” is expressed as a Euler diagram.
If two groups are expressed on a two-dimensional plane with a Euler diagram, there are only three topologically configurable relationships as expressed in Figure 3: (1) partial overlap; (2) one group included in another; (3) no overlap In the case of “predicate: belongs to”, in this study, it was judged that (2) one group that is included in another group is very close to the relationship. In general, it would be closer to (2) than the other two Euler diagrams. If the user selects (2), for a more rigorous definition, he/she can choose which relationship is closer to “Seoul belongs to Korea”.
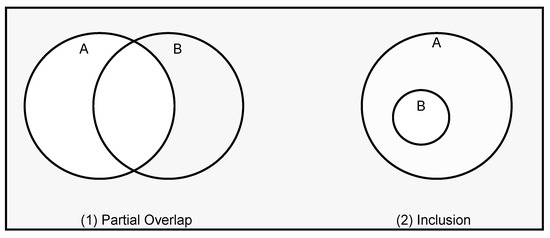
Figure 3.
Euler diagram classification.
2.4. Storage Plan of Defined Relationship and Utilization Plan of Hierarchy
In this study, the method of storing the index for a specific predicate in each entity was adopted. This storage method has the advantage of being computationally efficient when querying for an entity is executed again, for example if entity and predicate p exist in a containment relationship, The index value is assigned in the form of A—predicate index p—“0” inside entity A existing on the linked data.
In other words, in , A has a value of zero, and in B, the reference point A is specified in order to describe the relative inclusion relationship as in (A, −1), while a relative index is also assigned. In some overlapping relationships that are not inclusive relationships, two entities A and B are considered to have the same hierarchy for predicate p, and the same index value is assigned.
When searching for the distance between a specific entity A and B through the above process, if you have the same predicate index, you can check the corresponding value and compare the predicate index to know the hierarchical difference in the relation and whether there is a semantic inclusion relationship between the concepts that can be inferred.
3. Euler Diagram Algorithm
In the case of the Euler diagram, the relationship between entities is roughly expressed and is divided into “partial overlap”, “one group includes the other group”, and “no association”. Here, “no association” should not be considered because the scenario that the current system is not related, but constitutes a relationship does not need to be considered when considering the experimental point that constitutes the relationship between two entities.
3.1. Partial Overlap
Partial overlap in the Euler diagram means a situation as shown in Figure 4. Here, the circle represents an entity, but it should be noted that the entire Euler diagram model represents a relation rather than an entity. The left circle represents entity A, and the crossed “2” represents entity B. Basically, the Euler diagram was designed to correspond directly to the triple structure. For example, assume a scenario where the triple structure of A :loves B is matched to the Euler diagram as shown below.
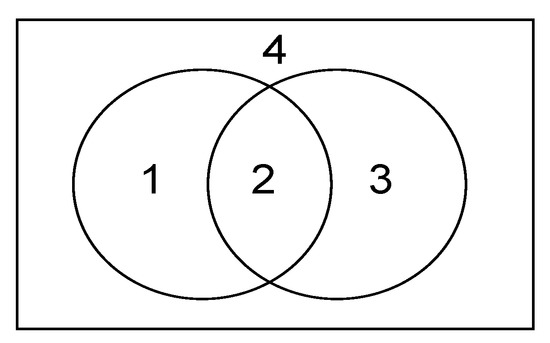
Figure 4.
Partial overlap.
A is an entity, which means the entire left circle as the subject, and B is the person A loves here. In the right circle, it seems natural that a , who may belong to B, comes in. Here, is not a part directly specified in the triple, but it is a set of objects that can be inferred due to the nature of the predicate called :loves. If the corresponding B corresponds to A’s :loves, the system paints the intersection part, otherwise the complement part. That is, depending on what type of group is assumed to be the object of the predicate by the defining user, the group is set as a set of objects corresponding to B, and the Euler diagram is selected.
If we look at the Euler diagram model proposed in this study again, the Euler diagram that can be colored in the “partial overlap” model can be seen as the four areas in Figure 4. In Figure 5, we assumed the case of A-loves-B: “entity A-:loves-entity B”. In general, for entity A, there will be more than one candidate for someone A to love. In this situation, entity B is only a fraction of the people know entity A. Similarly, for entity B, so is entity A. The user selects the model he/she deems best suited to express this situation.
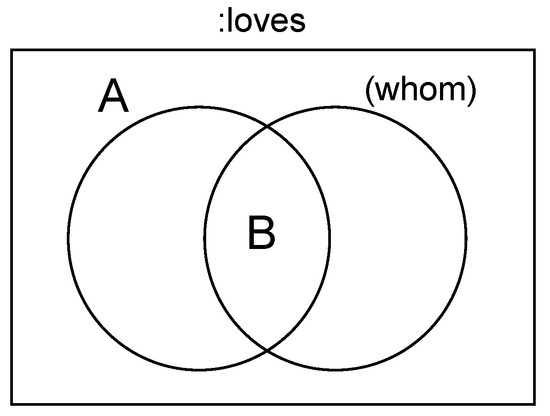
Figure 5.
Triple A :loves B.
Algorithm 1 shows when the user uses some overlapping model. First, for the predicate defined, it checks whether the subject or object has a depth value. If it does not exist, zero is assigned, and if it exists, the depth values of the subject and object are assigned the same as the opposite entity. In other words, the entities defined with some overlapping models are on the same layer.
| Algorithm 1: Partial overlap algorithm. |
 |
3.2. One Group Includes the Other Group (Inclusion)
The case of the included model in the Euler diagram is shown in Figure 6.
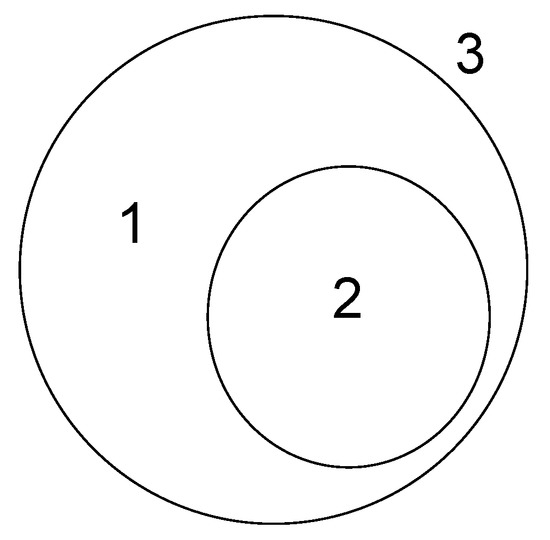
Figure 6.
Inclusion.
Likewise, here, the large circle and the small circle mean each entity A and entity B, and the user can select the colored model where the relation is best represented by considering the shape of the circle above.
For example, assume a scenario that defines the relationship Seoul City–SubDistrict–Seongbuk-gu. In this case, there will be no disagreement that the triple belongs to the inclusion model. Furthermore, it is desirable to select the model colored in 2, since it is the content that expresses . It is easy to understand when considering the situation where -, , etc., which are not part of , are included in the triple. “Seoul City–SubDistrict–(SuwonCity) -” is a false sentence because it is not a sub-administrative district. In other words, the containing model, which constitutes the triple as true, is put in 2, and the non-included part, which is made false, is put in 1. If , an administrative district at the same level as , enters as an object, it can be handled by putting it in 3.
The Algorithm 2 is judged differently depending on the type of depth. For example, if the depth value did not exist, the zero and negative one values would be initialized. However, as long as the depth value is attached to a situation where the depth value already exists, there is a problem that the size of the depth cannot be distinguished.
| Algorithm 2: Inclusion algorithm. |
 |
For example, suppose there is a truth value of and enters the model after . After is defined, is the turn of storing −1; this is not the same as the B value, but there is a risk of storing the same value. Therefore, we need a temporary way to deal with it.
Therefore, to solve this problem, referenceEntity is marked and saved, and later, it is a form of interpolating what the referenceEntity value is through a partial overlapping model. In the example above, in this system, C will store the value of “A-1”.
4. Hierarchy Using Defined Relationships
It is believed that relations created through the above procedure may be utilized in the Semantic Web in the future. This is because, in the case of the Euler diagram “included” model, the set of entities whose relation is defined as the inclusion model can be reorganized into a huge hierarchy map as constituent entities are arranged very systematically. Suppose the following four relations are defined through the inclusion model.
For example, even with different relations, if the inclusion relationship is accumulated as above, the inclusion relationship can be inferred clearly. Here, the relationship between A and D becomes identifiable even though it is not specified. Using this hierarchy map, we can expect the efficiency of calculation and the application of various algorithms in subsequent processing.
The actual linked data environment is a collection of countless nodes and edges. In this situation, in order to find the relationship between specific entities A and C, it is necessary to search for each edge because it is necessary to search for the depth of A and C and the connection relationship from node A to node C. Expressing this as the time complexity, O () (n: average of edge per node m:depth) is expected. This is because all the edges connected to the node are searched, and if not found later, all the edges of the node connected to the edge are searched, and so on. Accordingly, in order to determine whether two specific nodes are connected to each other, the calculation must be repeated as much as the depth. For example, when a connection relationship with a node having a depth of three or more is found, the computational complexity will be O (average connection node per node depth (three in this case)). In addition, this complexity is only a method of obtaining the relationship corresponding to the shortest distance between A and C, and it will require more computational cost to find all the relationships between A and C.
5. The Structure of the Proposed System
Simplifying the structure of the current system is as shown in Figure 7. The proposed program Semantic Web Relationship Connection System using the Euler diagram consists of two buttons, addrule and sendquery. When the user clicks the Add rulebutton, he/she selects the Euler diagram that best fits the relationship between the two entities and the predicate he/she defined. When the user selects the Euler diagram and selects where each entity belongs, information about the relationship is automatically stored by the defined relationship.
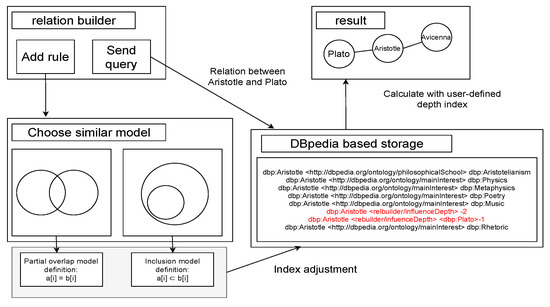
Figure 7.
Entire system configuration.
After this process, when searching for the relationship between the relevant entity by using the send querybutton later, it is possible to search more quickly and efficiently than the existing reasoner.
The input of this system is a triple for which the user wants to define a relationship, and the output is a triple converted to the RDF format. In addition, the user can use the output value obtained in this manner as an input value again to check how it is organically connected with other data. The output value at this time is a diagram of the connection relationship between data. The connection relationship diagram between data is a word that expresses whether the connection relationship between two entities entered by the user is established and, if so, in what order the entities are connected and established. For example, when a connection relationship between entities A and B is established, A-a-b-c-B is expressed as a connection relationship diagram. The reason why such a connection relationship is important is that it can be a reasoning process and a service of linked data to reduce the number of connected data to one level, and in particular, the connection relationship created in this program implies an inclusion relationship.
When this system is executed, as shown in the figure above, a UI with buttons for adding rules and executing queries and a console window showing the output contents appear together.
5.1. Add Rule
The Add rule button is a function for the user to select two entities to form a relation. Here, entity means a single entity that can be in place of a subject or object. It is the most basic unit, and when the Semantic Web is a graph composed of numerous nodes and edges, an entity corresponds to a node. Rule refers to the relationship of how two entities are connected to each other, and in the graph example, it acts as an edge. The format of the rule is subject-predicate-object, and these three elements are called triples. In the Semantic Web, how many entities interact with each other through rules and how they relate to each other are specified, and by using these rules, a web (Semantic Web) that a machine understands itself can be implemented. However, this program does not address these rules in detail, only the establishment of the most basic linking steps. In other words, if a triple is described in the form of subject-predicate-object, this means “subject and object are connected by predicate.”
5.2. Query Execution
In the relationship corresponding to query execution, the user can perform a search for the existence of a connection relationship between two entities in a given data dump. Through this function, the user can search the relationship between the entity established through the rule addition and the relationship between the existing data.
6. Experiment Design and Experiment Contents
As an example that the above-introduced system can be used in a practical field, this study attempted to show that there is an advantage in education when a teacher teaches a specific subject to students while learning class materials through the Semantic Web. In this experiment, a situation experiment was conceived of to aid learning by using the program in class to show how helpful it is to general users to create a triple using the program and to organize and use linked data.
In this experiment, it was assumed that learning progresses by using this program concurrently in class, and the linking function and definition function between the concepts of this program can play a role similar to the memo/writing of class content in class. Students performed the following experiment using the suggested program in parallel while performing learning through the actual social subject textbook file.
6.1. Basic Learning
Students took notes using this system while taking classes as usual. In the case of social studies, various contents were abbreviated in a few sentences in the subsection, and the contents of these sentences could be composed of various triples as understood from the point of view of the accepting user.
From the student’s point of view, in order to construct a triple of the above type, it is possible to perform it only through the step of structuring the concept. For example, in order to compose the content of world climate-type-tropical climate, it is understood that a textbook is a process that introduces world climate by type and explains each climate in order. In this way, students will actively participate in learning, and students are expected to have a deeper understanding in the process of organizing and writing the entire content of the study.
6.2. Linkage with Other Chapters
The “social textbook” used in the experiment consisted of “1 World Climate Region (1p∼3p)” and “3 Temperate Living (4p∼6p)” and was extracted from two different chapters. In the actual class situation, the content spanning several chapters as above was not entirely covered in one session, but the content was often closely related. In particular, the “Temperature Living” chapter, which is presented as an example, is a chapter that provides an overview to the “World Climate Area” chapter and then proceeds to further studies. While studying the “World Climate Area” chapter, a triple as shown in Table 2 can be constructed. Similarly, while studing the ”Temperate Living” chapter a triple as shown in Table 3 can be constructed.
Table 2.
(Chapter 1. World Climate Area) triple example that can be configured while conducting classes.
Table 3.
(Chapter 3. Temperate Living) triple example that can be configured while conducting classes.
The advantage of this study is that the “temperate climate” entity can reuse the content defined while learning the previous unit, so even if the class is disconnected, the learning can proceed in connection.
In addition, entities such as “agriculture” and “rice farming” as examples can be studied together in other units, even in other subjects, if the concept is used later.
6.3. Quiz Problem Solving
In the textbook, there is a quiz to grasp the student’s achievement level at the end of the unit. Students can use this program to solve the above quiz based on the defined data. The triple format of the quiz is organized as shown in Table 4, and the student’s search form for solving the quiz is shown in Table 5.
Table 4.
Quiz form using triples.
Table 5.
Search form for the relation among entities.
7. Results
Figure 8 shows the histogram after analyzing the responses to each query. Users performed an example of defining a relation with the textbook covered in the experimental part and answered some questions about it. Each query was as follows. q1: What is the function of this program? Received a short answer through the question, and evaluated whether they understood the function of the program. q2: Did you experience connectivity? Evaluated whether there was a connection of two or more levels in the cases made by users and whether users themselves understood this. q3: We asked whether the Euler diagram model was effective in this program. q4: Asked about the difficulty of using the program. For each query, q1 and q4 received more than 70% positive answers, and q2 received 80%, and q3 received a positive evaluation of 60%.
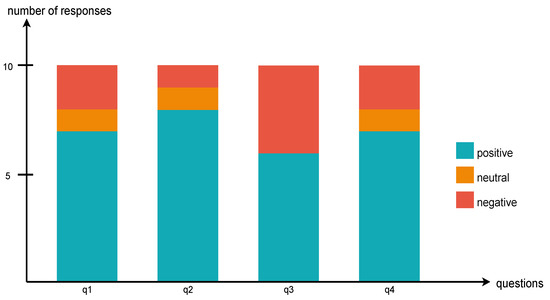
Figure 8.
Participants’ responses to experiments using textbooks.
The following responses were received from the participants who performed this experiment.
- This program aims to help users use information efficiently and conveniently by organizing information and automatically connecting the relationship between input information;
- Even for information that is not directly related, the reasoning is performed to organize the information efficiently if there is a contact point;
- The Euler diagram was as easy as learning in the math basics course, and I think it will be useful to other end users as well;
- In addition to the application usages used in the examples, ideas for other uses came up;
- Based on the information searched or stored by users on the web, it seems that computers will be able to construct an ecosystem in which the computer can determine the connection or relationship between information by itself;
- The query system is intuitive but lacks explanation.
The following disadvantages were also pointed out.
- The relationship between information is defined with respect to only two relationship models, but there may be limitations as information often forms more complex relationships;
- In this experiment, social textbooks were selected as an experimental set, but these textbooks seemed insufficient to show the program’s advantages. An example of adopting a biology textbook and showing a hierarchy such as species-genus-tree would have been more appropriate;
- The query system was difficult to understand;
- We might falsely define incorrect relationships due to a lack of knowledge or thoughts;
- The same information may be defined differently depending on the users;
- In some overlapping models, there is a lot of room for subjectivity to be reflected.
The query execution function is repeatedly used, and the efficiency for depth definition was also verified. Table 6 shows the average of the program execution time repeated 10 times for each condition. Found/not Found in the first column means whether the answer to the query was found. Since this system finishes execution the moment it finds an answer, the time of the Found case came out much smaller.
Table 6.
Average query execution running time.
The meaning of the first row is as follows. Relation distance 2 means a situation where the distance between entities is 2 and there is no depth to which to refer. Relation distance 3 means a situation where the distance between entities is three and there is no depth to which to refer. indicates how quickly the result can be found when the predicate_depth defined in this system exists in both entities in a situation where the distance is 2. means the result in a situation where the distance is three.
As argued in this paper, the search using depth was much faster than the existing search method. However, when the result was not found, it took a little more time as the method using depth in the existing method was performed. However, in the case of (, not Found), it took 241.8 s, which was rather less time than the 264.9 s in the (relation distance 3, not found). This situation is thought to have occurred because the number of average entities connected was small, as the experiment participant made and searched for what was not in the existing data dump in the case of the example with depth.
8. Discussion
The model proposed above was conceived of because the majority of people without specialized knowledge about the web are usually very familiar with dealing with Euler diagrams. Our system allows users to easily create relationships by pre-composing a prototype corresponding to the Semantic Web hierarchy. The function of this program consists of defining relations without Semantic Web-based knowledge and deriving connection functions among the relations. The data created using the proposed Euler relation tool can be used in other practical or Semantic Web systems, and it can be confirmed indirectly through class application experiments (social textbook examples). Data built by our program can be used in Semantic Web applications that require mostly “data dumps” depending on the writing method due to the freeness of its data creation method.
Examples of this are:
- a service that provides the shortest route with respect to time by receiving the dispatch data of Seoul’s public transportation;
- a Semantic Web agent that mediates several Semantic Web services;
- a Semantic Web search engine that searches data according to the relation.
While using the query button among all suggested methods, the user can naturally grasp the role of the relationship she/he conceived of in the Semantic Web structure. To achieve this goal, we conceived of an ecosystem that connects linked data grammatically by simply matching entities to the Euler diagram familiar to most people. Even the relationship defined by this method tends to adhere to the ontology more strictly than the relationship defined by the existing method (because it is defined as a method of selecting a Euler diagram and is automatically proposed by the system presented in this study). It can be said that it has an edge in gender and search performance. However, despite the above merits, the Euler diagram is an oversimplified model to condense the countless analog relationships that exist in the world. As there are many relationships that cannot be covered by the model proposed by this system, users who want to define the relationship are inevitably confused. In addition, due to the difference in perception that exists for each user, the relationship of “partial overlap” for some may become the relationship of “include” for others to feel. It is believed that this may be caused by ideological or other reasons, but this system remains a subject for future research as the difference in reliability by the proposer is not considered.
For example, in the case of a triple such as “A-owns-computer 33”, a person who considers the concept of owning to be close to inclusion will select an “included” relationship, and for a person with the perception that person A and computer 33 are equal objects, it is possible to choose a “partial overlap” relationship.
In this study, the above problem classification was divided into:
- immature use;
- difference in perception about the predicate;
- difference in the assumption about the object group.
Furthermore, the part that deals only with the relationship between two entities can be expanded sufficiently. If one focuses on the characteristics of the Euler diagram, there is plenty of room to deal with more than two entities. If the Euler diagram is limited in further research, other methodological approaches can be considered. After all, the Euler diagram used in this system works as a tool to help reduce the hierarchy. These tools can be changed according to your preferences, and it is believed that any tool that is easy for users to understand can be used.
9. Conclusions
In this paper, we presented a system by which novice users can understand the linked data. It supports building relationships among candidate data without technical backgrounds on the Semantic Web. In addition, the system allows users to perform a reasoning service based on the model of the system. The primary advantage of the proposed system lies in that non-expert users can define relationships easily by simply selecting a Euler diagram-based preset. In addition, reasoning over the data can be done quickly, and it can be easily extended by adding more complex relationships to the current system. One weakness of the system is that the Euler diagram-based model can only support simple types of relationships.
Author Contributions
Writing—original draft, S.O.; Writing—review and editing, S.Y., Y.K., J.S. and S.P., S.O. is the first author and S.P. is the corresponding author, respectively. Other authors contributed equally to the preparation of this manuscript. All authors have read and agreed to the published version of the manuscript.
Funding
This research received no external funding.
Data Availability Statement
Publicly available data sets were analyzed in this study. The data can be found here: https://github.com/kellysolow/vennRelation, accessed on 7 April 2021.
Conflicts of Interest
The authors declare no conflict of interest.
References
- Berners-Lee, T.; Hendler, J.; Lassila, O. The Semantic Web. Sci. Am. 2001, 284, 34–43. [Google Scholar] [CrossRef]
- Bizer, C.; Heath, T.; Berners-Lee, T. Linked data: The story so far. In Semantic Services, Interoperability and Web Applications: Emerging Concepts; IGI Global: Hershey, PA, USA, 2011; pp. 205–227. [Google Scholar]
- Manola, F.; Miller, E.; McBride, B. RDF primer. W3C Recomm. 2004, 10, 6. [Google Scholar]
- Dürst, M.; Suignard, M. Internationalized Resource Identifiers (IRIs); Technical Report, RFC 3987; Internet Engineering Task Force: Fremont, CA, USA, 2005. [Google Scholar]
- Pérez, J.; Arenas, M.; Gutierrez, C. Semantics and complexity of SPARQL. ACM Trans. Database Syst. (TODS) 2009, 34, 1–45. [Google Scholar] [CrossRef]
- Shadbolt, N.; Berners-Lee, T.; Hall, W. The Semantic Web revisited. IEEE Intell. Syst. 2006, 21, 96–101. [Google Scholar] [CrossRef]
- Voigt, M.; Pietschmann, S.; Meißner, K. A semantics-based, end-user-centered information visualization process for Semantic Web data. In Semantic Models for Adaptive Interactive Systems; Springer: New York, NY, USA, 2013; pp. 83–107. [Google Scholar]
- Carroll, J.J.; Dickinson, I.; Dollin, C.; Reynolds, D.; Seaborne, A.; Wilkinson, K. Jena: Implementing the Semantic Web recommendations. In Proceedings of the 13th International World Wide Web Conference on Alternate Track Papers & Posters, New York, NY, USA, 17–20 May 2004; pp. 74–83. [Google Scholar]
- Noy, N.F.; Sintek, M.; Decker, S.; Crubézy, M.; Fergerson, R.W.; Musen, M.A. Creating Semantic Web contents with protege-2000. IEEE Intell. Syst. 2001, 16, 60–71. [Google Scholar] [CrossRef]
- Ding, Y.; Sun, Y.; Chen, B.; Borner, K.; Ding, L.; Wild, D.; Wu, M.; DiFranzo, D.; Fuenzalida, A.G.; Li, D.; et al. Semantic web portal: A platform for better browsing and visualizing semantic data. In Proceedings of the International Conference on Active Media Technology, Toronto, ON, Canada, 28–30 August 2010; pp. 448–460. [Google Scholar]
- Gómez-Pérez, A.; Corcho, O. Ontology languages for the Semantic Web. IEEE Intell. Syst. 2002, 17, 54–60. [Google Scholar] [CrossRef]
- McGuinness, D.L.; Van Harmelen, F. OWL web ontology language overview. W3C Recomm. 2004, 10, 2004. [Google Scholar]
- Bizer, C.; Lehmann, J.; Kobilarov, G.; Auer, S.; Becker, C.; Cyganiak, R.; Hellmann, S. DBpedia—A crystallization point for the Web of Data. J. Web Semant. 2009, 7, 154–165. [Google Scholar] [CrossRef]
- Swoboda, N.; Allwein, G. Heterogeneous reasoning with Euler/Venn diagrams containing named constants and FOL. Electron. Notes Theor. Comput. Sci. 2005, 134, 153–187. [Google Scholar] [CrossRef]
- Martínez-González, M.M.; Alvite-Díez, M.L. The support of constructs in thesaurus tools from a Semantic Web perspective: Framework to assess standard conformance. Comput. Stand. Interfaces 2019, 65, 79–91. [Google Scholar] [CrossRef]
- Gao, W.; Farahani, M.R.; Aslam, A.; Hosamani, S. Distance learning techniques for ontology similarity measuring and ontology mapping. Clust. Comput. 2017, 20, 959–968. [Google Scholar] [CrossRef]
- Allwein, G.; Barwise, J. Logical Reasoning with Diagrams; Oxford University Press: Oxford, UK, 1996. [Google Scholar]
- Howse, J.; Molina, F.; Taylor, J.; Kent, S.; Gil, J.Y. Spider diagrams: A diagrammatic reasoning system. J. Vis. Lang. Comput. 2001, 12, 299–324. [Google Scholar] [CrossRef]
- Tao, X.; Li, Y.; Zhong, N. A personalized ontology model for web information gathering. IEEE Trans. Knowl. Data Eng. 2010, 23, 496–511. [Google Scholar] [CrossRef]
- Lembo, D.; Pantaleone, D.; Santarelli, V.; Savo, D.F. Easy OWL Drawing with the Graphol Visual Ontology Language. In Proceedings of the Fifteenth International Conference on Principles of Knowledge Representation and Reasoning, Cape Town, South Africa, 25–29 April 2016; pp. 573–576. [Google Scholar]
- Horrocks, I.; Patel-Schneider, P.F.; Boley, H.; Tabet, S.; Grosof, B.; Dean, M. SWRL: A Semantic Web rule language combining OWL and RuleML. W3C Memb. Submiss. 2004, 21, 1–31. [Google Scholar]
- Tho, Q.T.; Hui, S.C.; Fong, A.C.M.; Cao, T.H. Automatic fuzzy ontology generation for Semantic Web. IEEE Trans. Knowl. Data Eng. 2006, 18, 842–856. [Google Scholar] [CrossRef]
- Navigli, R.; Velardi, P.; Gangemi, A. Ontology learning and its application to automated terminology translation. IEEE Intell. Syst. 2003, 18, 22–31. [Google Scholar] [CrossRef]
- Yu, B. Research on information retrieval model based on ontology. EURASIP J. Wirel. Commun. Netw. 2019, 2019, 30. [Google Scholar] [CrossRef]
- Kim, J.; Chung, K.Y. Ontology-based healthcare context information model to implement ubiquitous environment. Multimed. Tools Appl. 2014, 71, 873–888. [Google Scholar] [CrossRef]
- Doan, A.; Domingos, P.M.; Levy, A.Y. Learning Source Description for Data Integration. In Proceedings of the Third International Workshop on the Web and Databases, WebDB 2000, Adam’s Mark Hotel, Dallas, TX, USA, 18–19 May 2000; pp. 81–86. [Google Scholar]
- Papatheodorou, C.; Vassiliou, A.; Simon, B. Discovery of Ontologies for Learning Resources Using Word-Based Clustering; Association for the Advancement of Computing in Education (AACE): Waynesville, NC, USA, 2002. [Google Scholar]
- Verborgh, R.; De Roo, J. Drawing conclusions from linked data on the web: The EYE reasoner. IEEE Softw. 2015, 32, 23–27. [Google Scholar] [CrossRef]
- Bouougada, B.; Bouchiha, D. Ontology Authoring from Relational Database: A Model Based Approach. In Proceedings of the 2020 Second International Conference on Embedded & Distributed Systems (EDiS), Oran, Algeria, 3 November 2020; pp. 161–166. [Google Scholar]
- Spoladore, D.; Pessot, E. Collaborative Ontology Engineering Methodologies for the Development of Decision Support Systems: Case Studies in the Healthcare Domain. Electronics 2021, 10, 1060. [Google Scholar] [CrossRef]
- Al-Chalabi, H.K.M.; Hussein, A.M.A. Ontology Applications in E-Learning Systems. In Proceedings of the 2020 12th International Conference on Electronics, Computers and Artificial Intelligence (ECAI), Bucharest, Romania, 25–27 June 2020; pp. 1–6. [Google Scholar]
- Vigo, M.; Matentzoglu, N.; Jay, C.; Stevens, R. Comparing ontology authoring workflows with Protégé: In the laboratory, in the tutorial and in the ‘wild’. J. Web Semant. 2019, 57, 100473. [Google Scholar] [CrossRef]
- Lork, C.; Choudhary, V.; Hassan, N.U.; Tushar, W.; Yuen, C.; Ng, B.K.K.; Wang, X.; Liu, X. An ontology-based framework for building energy management with IoT. Electronics 2019, 8, 485. [Google Scholar] [CrossRef]
- Spoladore, D.; Mahroo, A.; Trombetta, A.; Sacco, M. Comfont: A semantic framework for indoor comfort and energy saving in smart homes. Electronics 2019, 8, 1449. [Google Scholar] [CrossRef]


Publisher’s Note: MDPI stays neutral with regard to jurisdictional claims in published maps and institutional affiliations. |
© 2021 by the authors. Licensee MDPI, Basel, Switzerland. This article is an open access article distributed under the terms and conditions of the Creative Commons Attribution (CC BY) license (https://creativecommons.org/licenses/by/4.0/).