1. Introduction
According to YouGov, a UK international market research firm, the most respondents answered “Longer battery life” to the question “Which one of the following features would you most like your current smartphone to have?” [
1]. Therefore, power management on a smartphone is very important, and we need to carefully analyze the power consumed by each component of the smartphone.
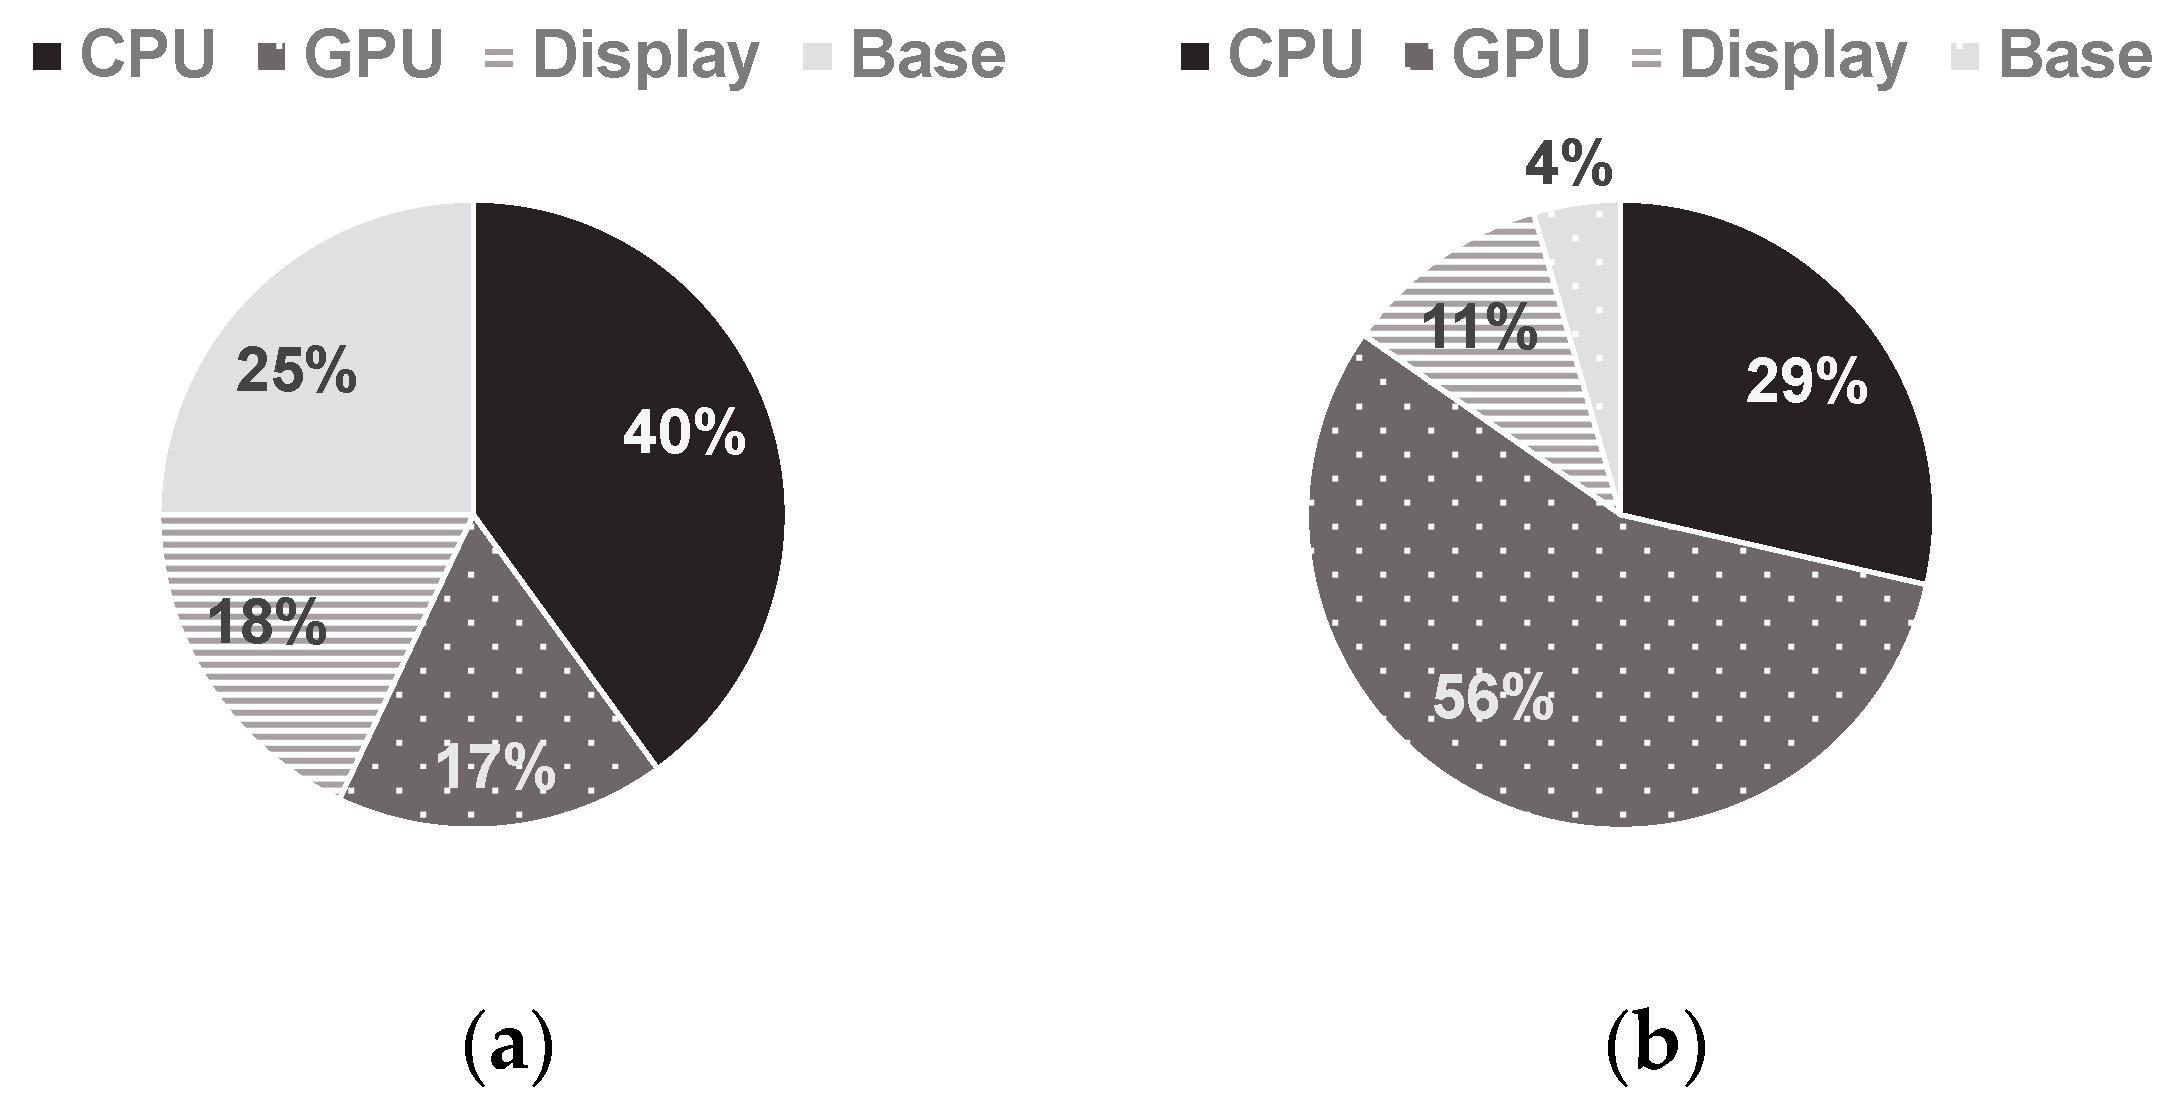
Figure 1 shows the power breakdowns of a Galaxy S3 smartphone [
2] and a Galaxy S7 smartphone, respectively.
Figure 1b shows the result estimated by the power models proposed in this paper while an application processor executes twenty 3D game benchmark applications. As shown in
Figure 1, since the power consumption ratio of CPU+GPU over the total system power has increased from 57% to 85%, it is very important to analyze CPU and GPU power accurately for power management on smartphones. This is because bigger power consumption may give rise to more power estimation error.
This trend makes low-power techniques more important such as dynamic voltage frequency scaling (DVFS). DVFS is a technique that adjusts frequency and voltage to achieve the optimal trade-off point between power and performance. Many DVFS policies, which are implemented in software at the Linux kernel level, employ information like utilization to know the workload of a processor. If DVFS software can get information about power consumption of processors, there will more chances for DVFS policies to make bigger energy efficiency. However, it is very difficult to estimate accurately the power consumption of each processor at run-time without a built-in hardware sensor.
In this paper, we propose new phase-based power models that can estimate the power consumption of CPU and GPU accurately, which are the core components of a mobile application processor (AP), using the performance monitoring counter (PMC) at run-time. Since our proposed power models can provide the power consumption information of each component every time interval, the power management drivers can implement more power-efficient management policies using such information. In addition, a program profiler can provide software engineers with power consumption information of their programs. For example, it could be embedded in a system analyzer program such as ARM DS5-streamline [
3] to show developers the run-time power consumption of each component while applications are running.
In detail, we propose a novel power modeling method which combines phase classification and PMC-based power modeling. In addition, we integrate the proposed CPU and GPU power models with an existing state-of-the-art display power model to derive a holistic power model that can estimate the total power consumption of a smartphone. In extensive experiments, we show how accurately our holistic power model can estimate the system′s power consumption while executing various 3D game benchmarks on a Galaxy S7 smartphone with an Android 7.1 platform. The contributions of our work are summarized as follows.
The proposed power model achieves the accuracy improvement over the existing power models by using multiple PMC-based per-phase power models and proposed phase classification and phase prediction methods for both CPU and GPU.
For the optimal GPU power model, optimal PMC events for linear regression predictors are searched by the genetic algorithm [
4].
A holistic power model is completed, which estimates the smartphone total power consumption accurately, including the power consumption of CPU, GPU, display, and components connected to them.
All the power models have been proven to be practical because all implementations and verifications are conducted on recent smartphones with an Android platform.
The remainder of this paper is organized as follows.
Section 2 introduces previous studies about CPU and GPU power models.
Section 3 describes the motivation of our work. Then,
Section 4 describes an overview of our CPU and GPU power models, and
Section 5 and
Section 6 explain our novel CPU and GPU power modeling approaches in detail.
Section 7 and
Section 8 explain the experimental environment and experimental results, respectively. Finally,
Section 9 concludes this paper.
The terminologies used in the remaining parts of this paper are described as follows. First, an event type means the type of available events that a PMC can count. The PMC needs to be set up about what type of events to count before it starts. Second, an event set means the set of six event types. Finally, an interval vector refers to a vector that consists of counted values for six preset event types and for a clock counter during a time interval.
2. Related Work
2.1. Utilization-Based Power Model
Utilization is the ratio of a non-idle period to a time interval and means the load of a processor. A utilization-based power model builds a power model using a linear regression method and uses utilization as a regression predictor. Yoon et al. [
5] expressed a CPU power model as the sum of power consumed by each core and an uncore (Uncore means the resource of a microprocessor that is not in the core). They used the utilization of each core as predictors and uncore power as a constant to build a CPU power model. Zhang et al. [
6] developed a utilization-based model that is compensated for the transition overhead incurred when the CPU′s idle state changes from deep to shallow. Kim et al. [
7] built a utilization-based GPU power model. They used GPU utilization as a regression predictor and get regression coefficients and constants at each frequency step. The utilization-based model is so basic that it can be implemented quickly on any device, but it cannot predict power consumption of processors accurately. This is because the power consumption varies greatly depending on the type of instruction being executed, even with the same utilization.
Table 1 summarizes the existing power models including utilization-based power models.
2.2. PMC-Based Power Model
PMCs are a set of special-purpose registers built in modern microprocessors to store the counts of hardware-related activities such as cache accesses or the number of executed instructions. PMC events can be used for power estimation, since PMC events covers overall hardware operations in a microprocessor. In addition, a PMC-based power model can be implemented on smartphones because most of their micro-architectures support PMCs. Pricopi et al. [
8] developed a linear regression-based power model. They used PMC events such as cache accesses, memory accesses, clock cycles, and number of instructions, as predictors of linear regression. Jin et al. [
9] analyzed which events represent utilization of each GPU pipeline unit. They built the GPU power model by using these PMC events as predictors. Walker et al. [
10] have done a high-level study by almost fully automating event selection, which considers what events are suitable as predictors. However, their study has a limitation, as they consistently use only six events whatever the running workload is. These events may have good performance on average on 60 workloads, but they are not always best for each workload, since six is insufficient to cover different characteristics of execution behaviors in various workloads.
2.3. Phase Classification and Its Application
A phase is defined to be a set of intervals that have similar execution behavior, where an interval means a time section of continuous execution. Thus, all intervals in the same phase have similar execution behaviors. In order to classify each interval into a phase, Sherwood et al. [
11] used a basic block vector (BBV) which keeps track of the execution frequencies of basic blocks. Then, they computed the similarity of the intervals using a vector distance and classified them into distinct phases using K-means clustering [
12]. However, per-phase patterns of their work are the program patterns because basic blocks are generated by a compiler. In order to use hardware operation patterns rather than patterns of BBV, Kim et al. [
13] and Zheng et al. [
14] used PMC events for phase classification and devised PMC-based phase classification for power estimation. Kim et al. [
13] used phase classification for accurate cross-platform power/performance estimation. They created the cumulative distribution function (CDF) graphs of each event for different phases and different platforms. They observed that different phases for each platform could present very different trends, while the events in the same phase behave very similarly across platforms. They called it as per-phase pattern trained the neural network model to capture pattern within a phase. Zheng et al. [
14] also utilized a program phase based on dynamic basic blocks for cross-platform power/performance estimation. They applied simplex-constrained quadratic programming (SCQP) to obtain a linear predictive model specific for each program phase because they were motivated by program’s homogeneous behavior across platforms at individual phase level. In their work,
denotes unknowns at phase i and are determined by SCQP. Thus, they built a power model for each phase and each of completed models is only used for a corresponding phase.
3. Motivational Studies
For an ARM CPU, the maximum number of events that can be collected simultaneously is six, since its core has 6 PMCs. Thus, Walker et al. [
10] proposed a variable selection method that selects proper six event types to be used as regression predictors of a power model. Then, by eliminating multicollinearity between the six selected events, they tried to build an accurate power model. However, they just used only one event set, which consists of six event types, whatever a running program is. To improve this, we investigated which set of events can produce better results on a specific phase. To this end, we first ran 75 workloads on the Cortex-A53 CPU and calculated the
LDST_inst_rate value for each workload.
LDST_inst_rate is defined as (1).
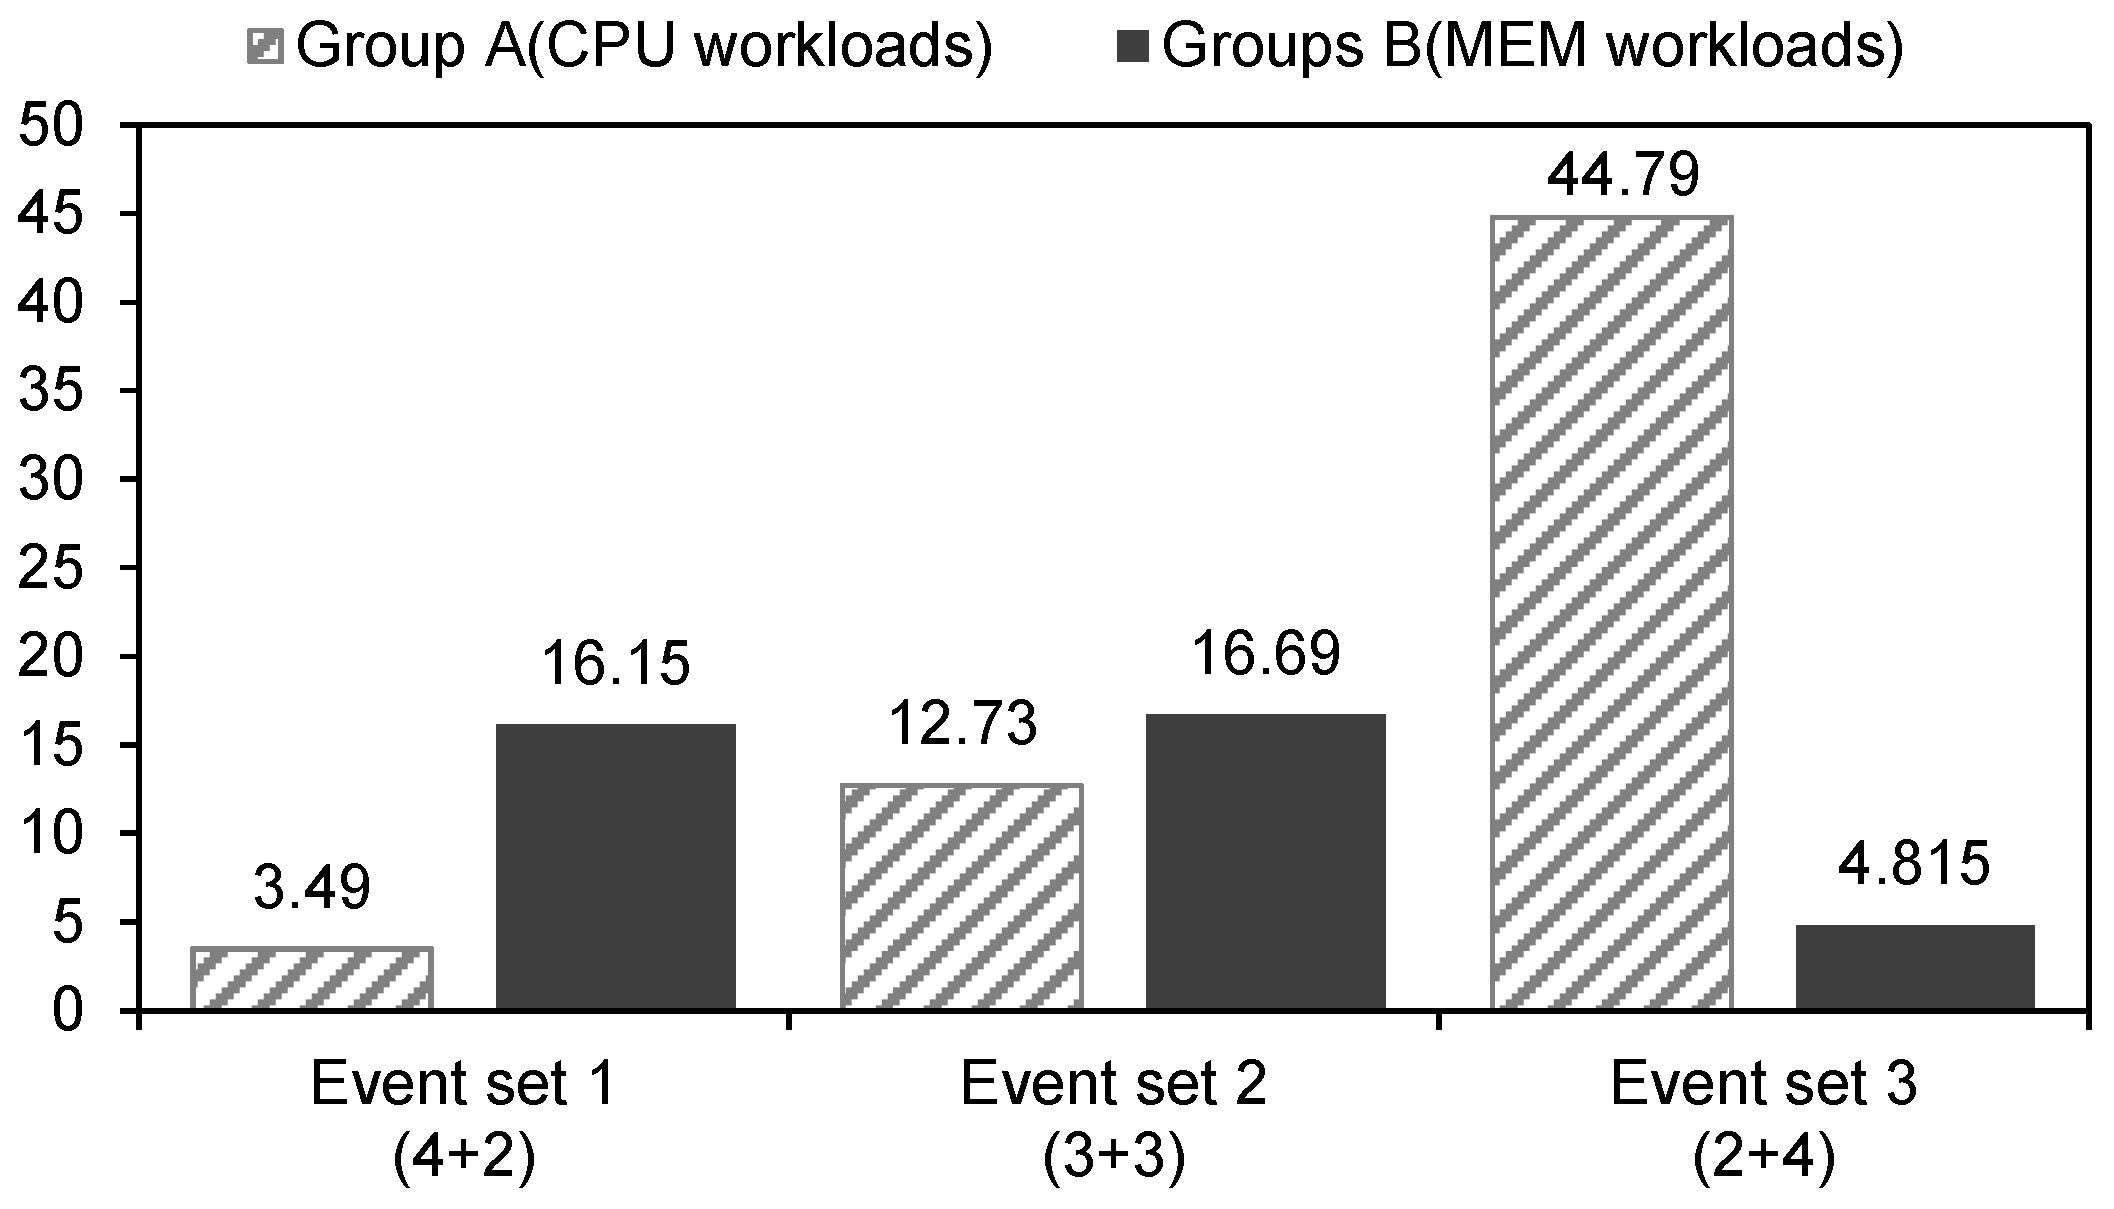
We classified three workloads with the three lowest LDST_inst_rate value as Group A (i.e., CPU bound workloads) and three workloads with the three highest LDST_inst_rate value as Group B (i.e., memory bound workloads).
Table 2 shows the details of the three event sets. The event type related to the CPU pipeline among all events, called CPU_EV, are highlighted in bold, and the event type related to the cache and memory systems, called
MEM_EV, are not highlighted in
Table 2. Event set 2 is the same event set used by Walker et al. [
10] that consists of three CPU_EVs and three MEM_EVs. Unlike Event set 2, Event set 1 consists of four CPU_EVs and two MEM_EVs and is designed to minimize multicollinearity as much as possible. Event set 3 consists of two
CPU_EVs and four MEM_EVs and is also designed to be minimize multicollinearity as much as possible.
Figure 2 shows the mean average percentage errors (MAPEs) of the power models built with each event set on each workload group (i.e., Group A and Group B) over real power measurement. First, the model built with Event set 2 shows acceptable errors for both groups, but the results are not excellent. On the other hand, the model built with Event set 1, which consists of four CPU_EVs and 2 MEM_EVs, shows excellent results in Group A (i.e., CPU bound workloads). In contrast, the model built with Event set 3 shows excellent results in Group B. These results suggest that a specific event set can produce better results on a specific phase. Therefore, by selecting an optimal event type corresponding to a specific phase or workload at run-time, it will be possible to estimate power consumption more accurately.
Kim et al. [
13] classified phases using PMC events and trained a neural network to capture per-phase patterns. However, they used only a single power model for different phases rather than different power models for different phases. Zheng et al. [
14] built per-phase power models and selectively used them according to the phase. However, they used the same event set for all per-phase power models rather than different event sets for different per-phase power models. Therefore, to the best of our knowledge, there has been no study of using different event sets for different phases. We devise per-phase power models based on regression and employ them in an optimally selective manner.
4. Overview of the Proposed Method
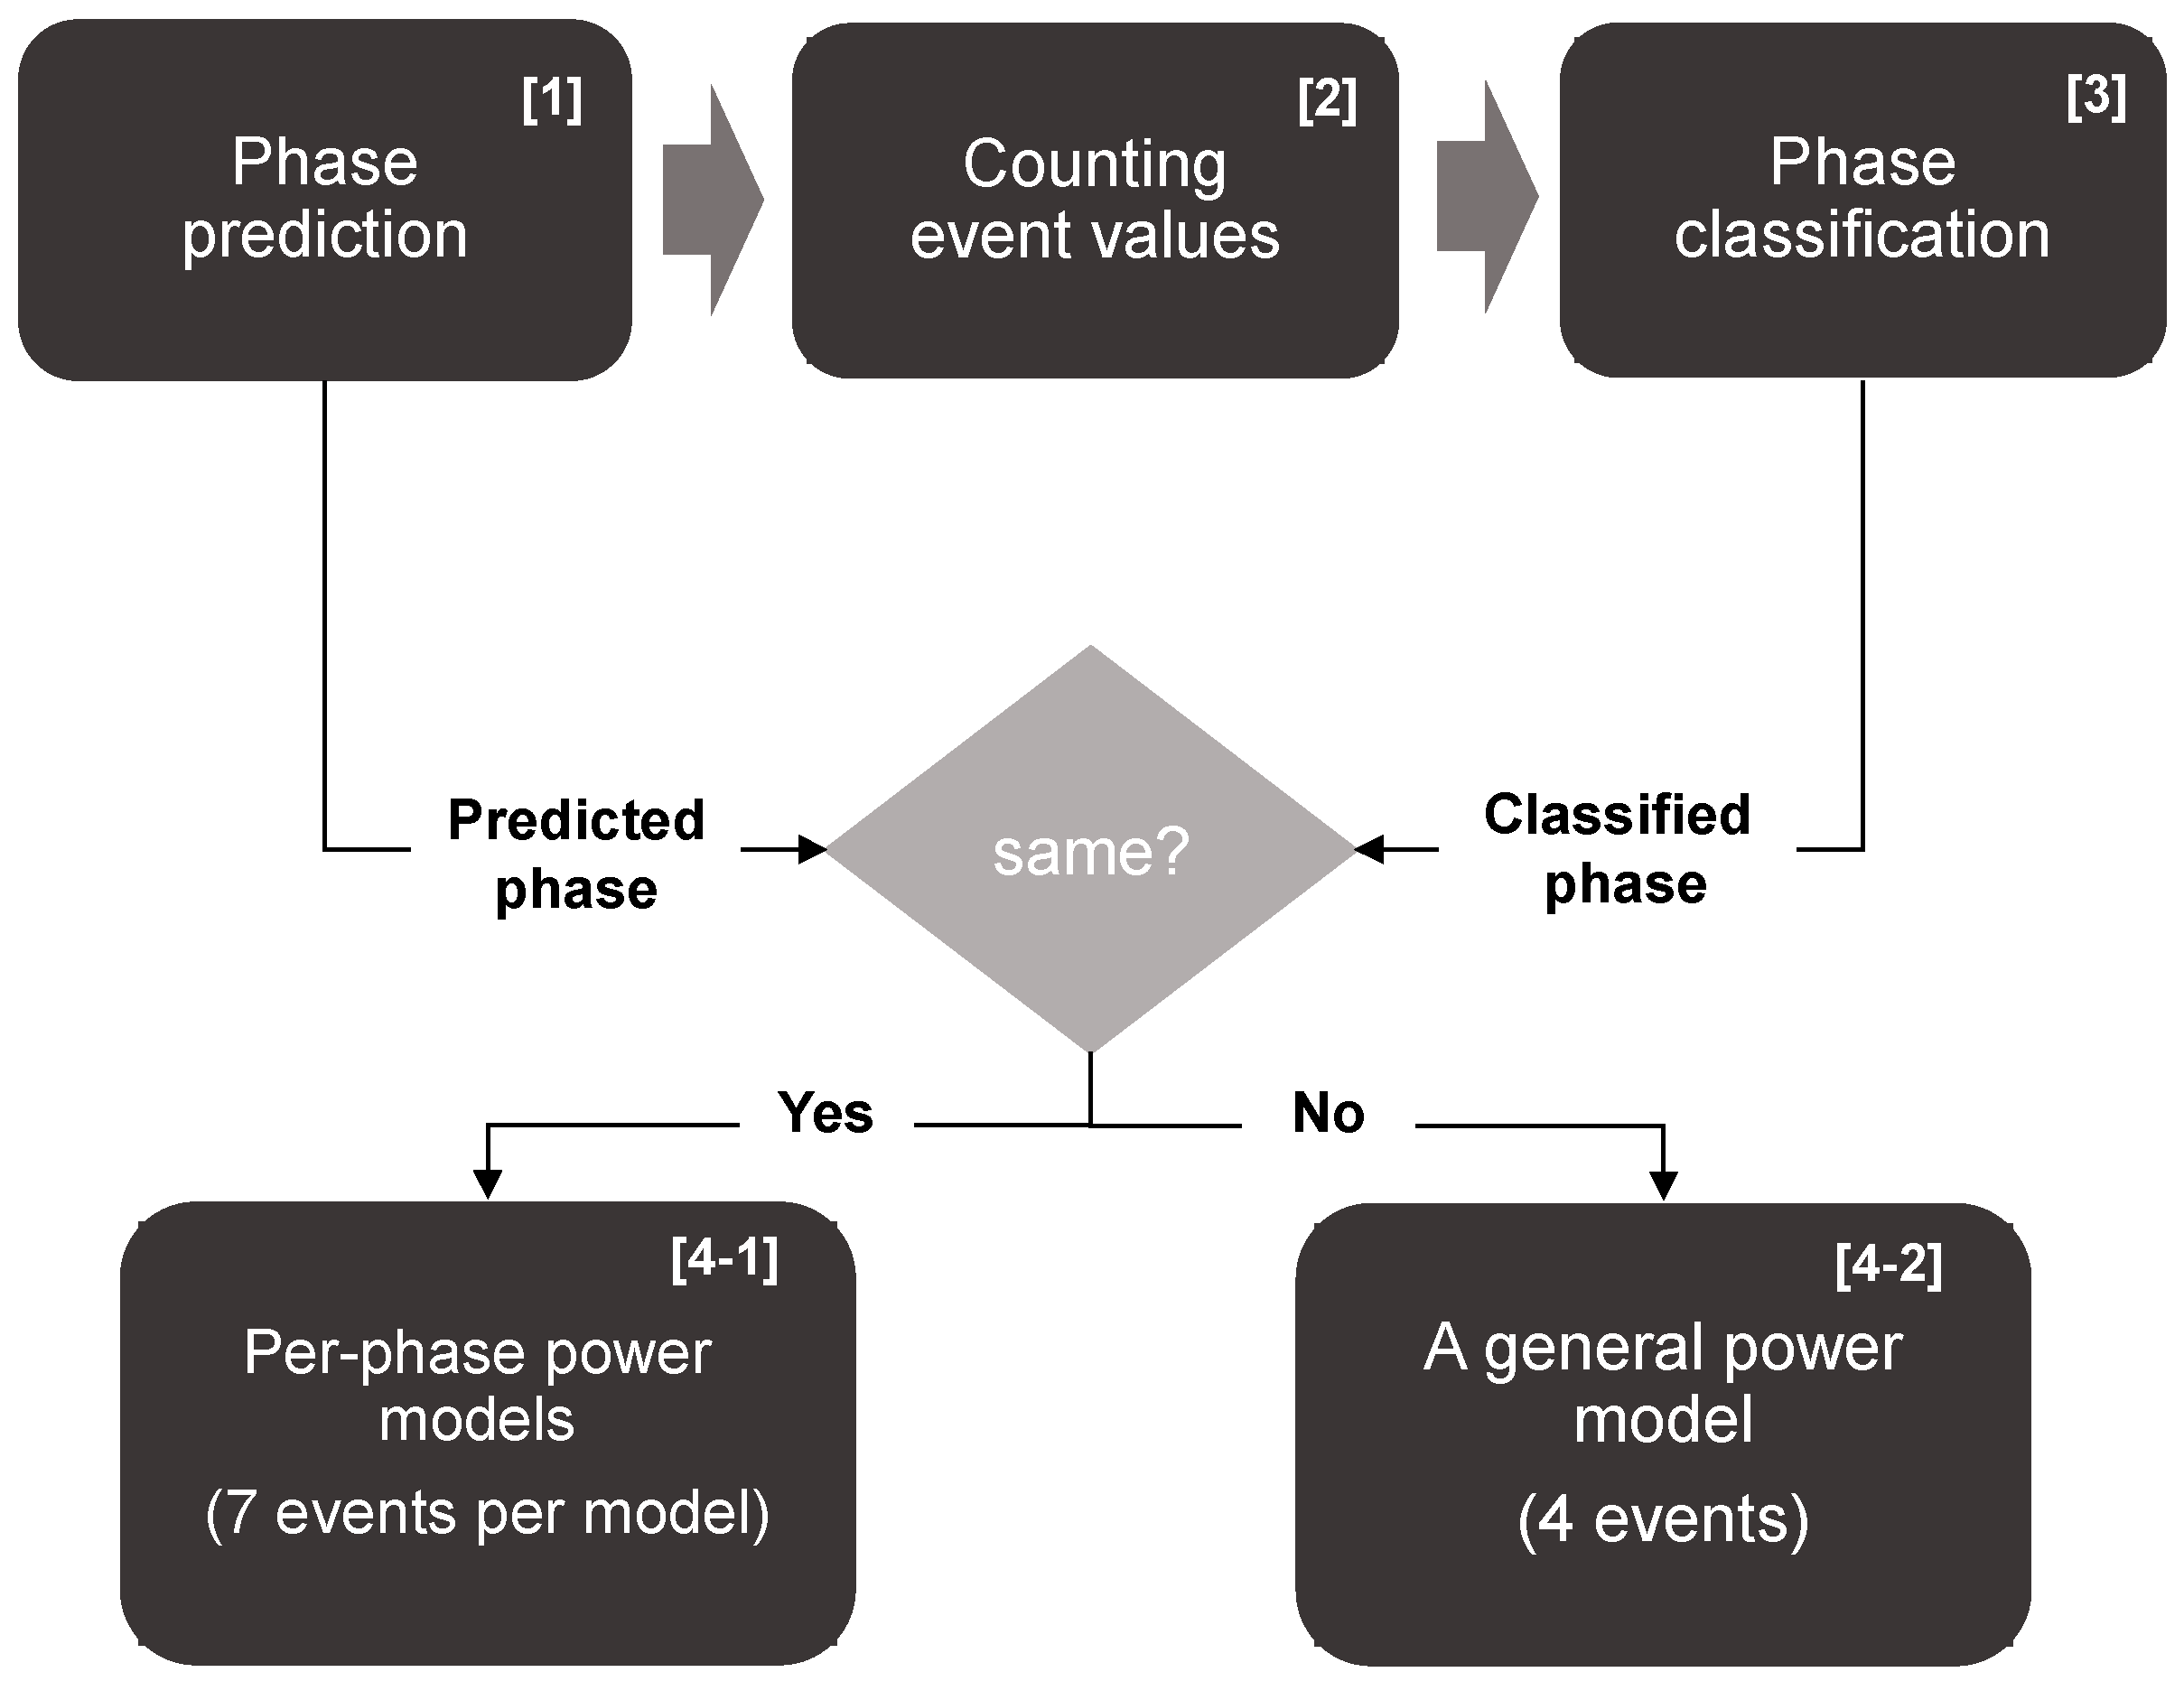
Figure 3 shows the overall process of the proposed CPU power model. The process in
Figure 3 is repeated for every time interval. Our CPU power model proceeds as follows. First, it predicts a phase using a proposed phase prediction method. After the phase is predicted, the second is the event counting step. In this step, PMCs count events corresponding to the predicted phase and an interval vector is made. There is a suitable event set for each phase and how to determine an appropriate event set for each phase is described in
Section 5.3. The third step is phase classification. Our method classifies phases using the interval vector. Thus, it is not until event counting is finished that the phase is classified.
After classifying the phase of the time interval, we compare the classified phase and the predicted phase to determine which power model to use in estimating the processor’s power consumption. If the prediction is correct when comparing the predicted phase and the classified phase, power consumption is estimated using the accurate per-phase power model. However, if the prediction is incorrect, the per-phase power model cannot be used because the event types used the in per-phase power model and the types of collected events do not match. Even if the phase prediction fails, the power consumption during the time interval must be estimated. Thus, we employ a general but relatively inaccurate power model, which can be used even if the phase prediction fails. Meanwhile, the phase prediction step is needed to use more than one per-phase power model because different per-phase power models use different event types. Therefore, it is necessary to predict the phase before event counting and count the events of the phase to be expected. In
Section 5, we describe in detail the phase prediction step, phase classification step, and how to build per-phase power and general power models.
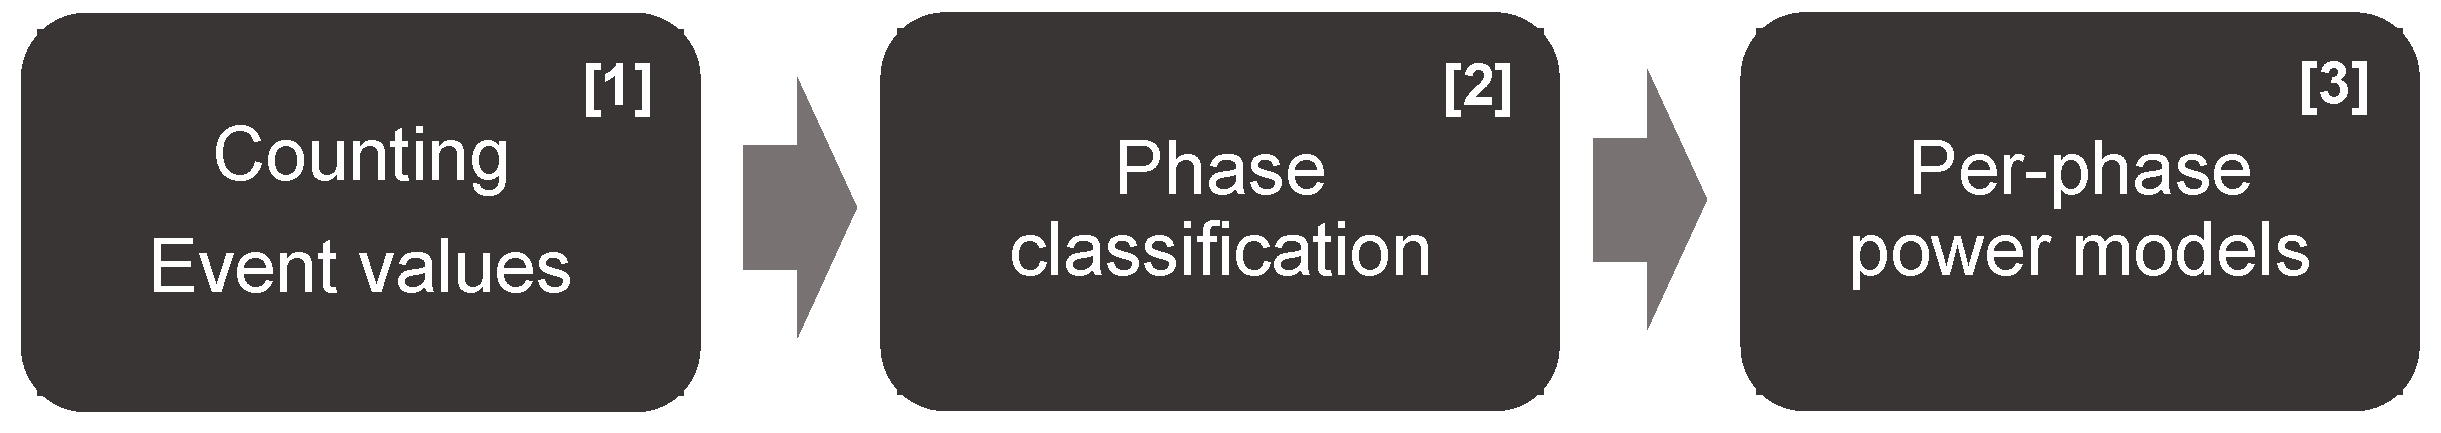
Figure 4 shows the overall process of the proposed GPU power model. There is no phase prediction step because Mali Midgard GPU can collect all event types simultaneously. Thus, all event types of all per-phase power models can be covered by simply counting all available events. Therefore, the GPU power model consists of three steps. First, all events are counted by PMCs, and an interval vector is made. Second, the phase of the time interval is classified by the interval vector. Then, the per-phase power model corresponding to the classified phase is used to estimate power consumption of GPU. In
Section 6, we describe in detail the phase classification step for GPU and how to build a per-phase GPU power model.
5. CPU Power Modeling
5.1. Phase Classification
5.1.1. Motivation
We made two workload groups and performed a simple experiment on a big core. Firstly, workloads of the first group consist of CPU related instructions. We measured the average power consumption of a big core while it executes these workloads. The minimum and maximum power consumptions of the workloads were 2588 mW and 3069 mW, respectively. Secondly, workloads of the second group consist of memory related instructions. The workloads in the second group have different working set sizes (i.e., the domain size of memory addresses) and stride. When we measured each average power consumption of these workloads, the minimum and maximum power consumption of the workloads were 2933 mW and 4415 mW, respectively. These results suggest that when we classify phases, we have to consider how CPU uses memory rather than what CPU instructions are. Therefore, we based our phase classification on how frequently CPU uses memory and what memory device CPU mainly uses.
Figure 5 shows a schematic figure of our CPU phase classification. Our method classifies the behavior of CPU during an interval into five phases using three decision values (
and
for
LDST_inst_rate,
for
Cache_miss_rate).
5.1.2. Phase Classification
LDST_inst_rate and
Cache_miss_rate are used for phase classification. They are shown in
Figure 5 on the x and y axes. Since the
LDST_inst_rate represents the ratio of memory-related instructions to total instructions,
LDST_inst_rate can decide how frequently CPU uses memory. Similarly,
Cache_miss_rate decides what memory device CPU mainly uses. For example, if the value of
LDST_inst_rate is greater than
and the
Cache_miss_rate is less than
, our method determines that the current CPU’s phase is the CACHE phase.
Equations (1) and (2) represent
LDST_inst_rate and
Cache_miss_rate, and we can get them using counted event values.
Table 3 shows Event A, Event B, and Event C used when calculating
LDST_inst_rate and
Cache_miss_rate. These events represent the number of load store instructions, the number of any instructions, and the number of cache misses, respectively. However, they can be replaced with different event types because some event types are not available on a specific microarchitecture. For ARM cortex-A53, we used
BUS_ACCESS (0x19) as Event C instead of
L2D_CACHE_REFILL (0x17). This is because
BUS_ACCESS (0x19) indirectly represents the number of cache misses since once a cache miss occurs, a memory bus access also occurs.
Table 3 also shows the
,
, and
used when deciding the phase. They were set through extensive experiments because proper values for them vary greatly depending on the unit of Event A, Event B, and Event C.
5.2. Per-Phase Power Model
Equation (3) represents the per-phase power model.
In (3),
is the value obtained from the clock counter divided by sampling time, and
is the value obtained from the n-th event counter divided by sampling time. In (3), the first term means constant dynamic power [
10]. It has a constant property in that it is consumed constantly when CPU is in the running state (i.e., P-state), regardless of how many and what activities occur. The second term means dynamic power that depends on how many and what activities occur in CPU [
10]. Each per-phase power model can be built by determining the unknown coefficients
and
using linear regression. We execute all workloads to collect interval vectors used for linear regression, and we classified these interval vectors into five phases using the proposed phase classification method shown in
Section 5.1. Finally, each per-phase power model is built with only interval vectors for the corresponding phase.
5.3. Variable Selection
As is shown in
Section 3, it is important to select proper event types because the performance of the per-phase model depends on which event types are used as predictors. Therefore, each per-phase power model should use proper event types as predictors by a variable selection method for better performance.
An event set consists of 6 event types. The aim of this step is to select the three event types for each event set among 6 event types. This is because the preset three event types should always be included in every event set for phase classification shown in
Section 5.1.
Table 3 shows these three event types for
LDST_inst_rate and
Cache_miss_rate. The three remaining event types, which are not included in event sets yet, must be selected. Depending on how we choose them, there is a room for improving the performance of each per-phase model. Therefore, we aimed to test all combinations of three event types to select an optimal combination. We needed to test
52C3 = 22,100 cases for a big core and
37C3 = 7770 cases for a little core because the number of event types for a big core is 52 and that for a little core is 37. However, all workloads must be executed once for each case. It is time consuming to executing all workloads once per each case. Thus, we make a
data matrix to save experiment time. The data matrix is a matrix that contains approximate event values for all event types at each time interval while all workloads are running. Once we get it, we can test every case without executing every workload per case. Algorithm 1 shows how we make it.
It generates interval vectors with 8 elements (6 event data, 1 clock counter data, 1 power consumption data) to execute all workloads once. In other words, an n by 8 matrix with n interval vectors is made. However, it should be an n by 54 matrix (52 event data, 1 clock counter data, 1 power consumption data) since the data matrix must contain every event value at each time interval. We use the algorithm shown in Algorithm 1 to make this n by 54 data matrix.
First, the algorithm in Algorithm 1 measures the average execution time of k-th workload (lines 4–6). The number of collected event values is
when a workload is executed. Thus, each workload must be executed repeatedly
times to collect all event types (line 7). The algorithm prepares to collect event types corresponding to the subset
(lines 8–9). The algorithm repeats to execute the workload until the execution time is within a certain range of error τ. If the error exceeds the threshold τ, the interval vectors is invalid. It iterates to run the workload and collect event values for a subset
until a valid interval vector is made (lines 10–18). After all interval vectors for all workloads are stored in the matrix M, the algorithm divides the columns of the clock counter and power consumption by
to find the average and returns M (lines 23–24).
| Algorithm 1 building data matrix |
Input: CPU workloads
τ: Tolerance threshold
n: The number of workloads
NEV: The number of available event types
NPMC: The number of PMCs
E: A set of all event types
ESi: i-th Subset of E |
| 1 | = + 1; |
| 2 | = |
| 3 | For (k = 0;; k++) |
| 4 | | c 0; |
| 5 | execute workload k 10 times; |
| 6 | ; |
| 7 | For (i = 0; ; i++) |
| 8 | | configure PMC setting to ; |
| 9 | |
| 10 | WHILE DO |
| 11 | | execute workload k; |
| 12 | start PMC event counting and measure power consumption; |
| 13 | ; |
| 14 | ; |
| 15 | the number of interval vectors; |
| 16 | the no. of events per second; |
| 17 | |
| 18 | END WHILE |
| 19 | ; |
| 20 | END FOR |
| 21 | |
| 22 | END FOR |
| 23 | /= |
| 24 | Return M |
We can quickly test every case using this data matrix. However, the best case may not be best because of inaccuracy of the data matrix. The data matrix just shows an approximate trend, representing approximate values when PMCs collects the event types simultaneously. This is because a building process of data matrix allows a certain error in the program execution time. Thus, we select the top five cases as candidates and retest these cases using the newly counted event values that is collected simultaneously. This allows to evaluate the candidates accurately. Finally, a candidate showing the top results is used to build the per-phase model. In this way, we can find a suboptimal combination of event types quickly.
5.4. Phase Prediction
In this paper, we predict the CPU phase using the following two methods. The first is the past method. In this method, an upcoming phase is predicted to be the same as the previous classified phase as shown in (4).
In (4), represents the predicted phase at time interval t and represents the classified phase at time interval t − 1.
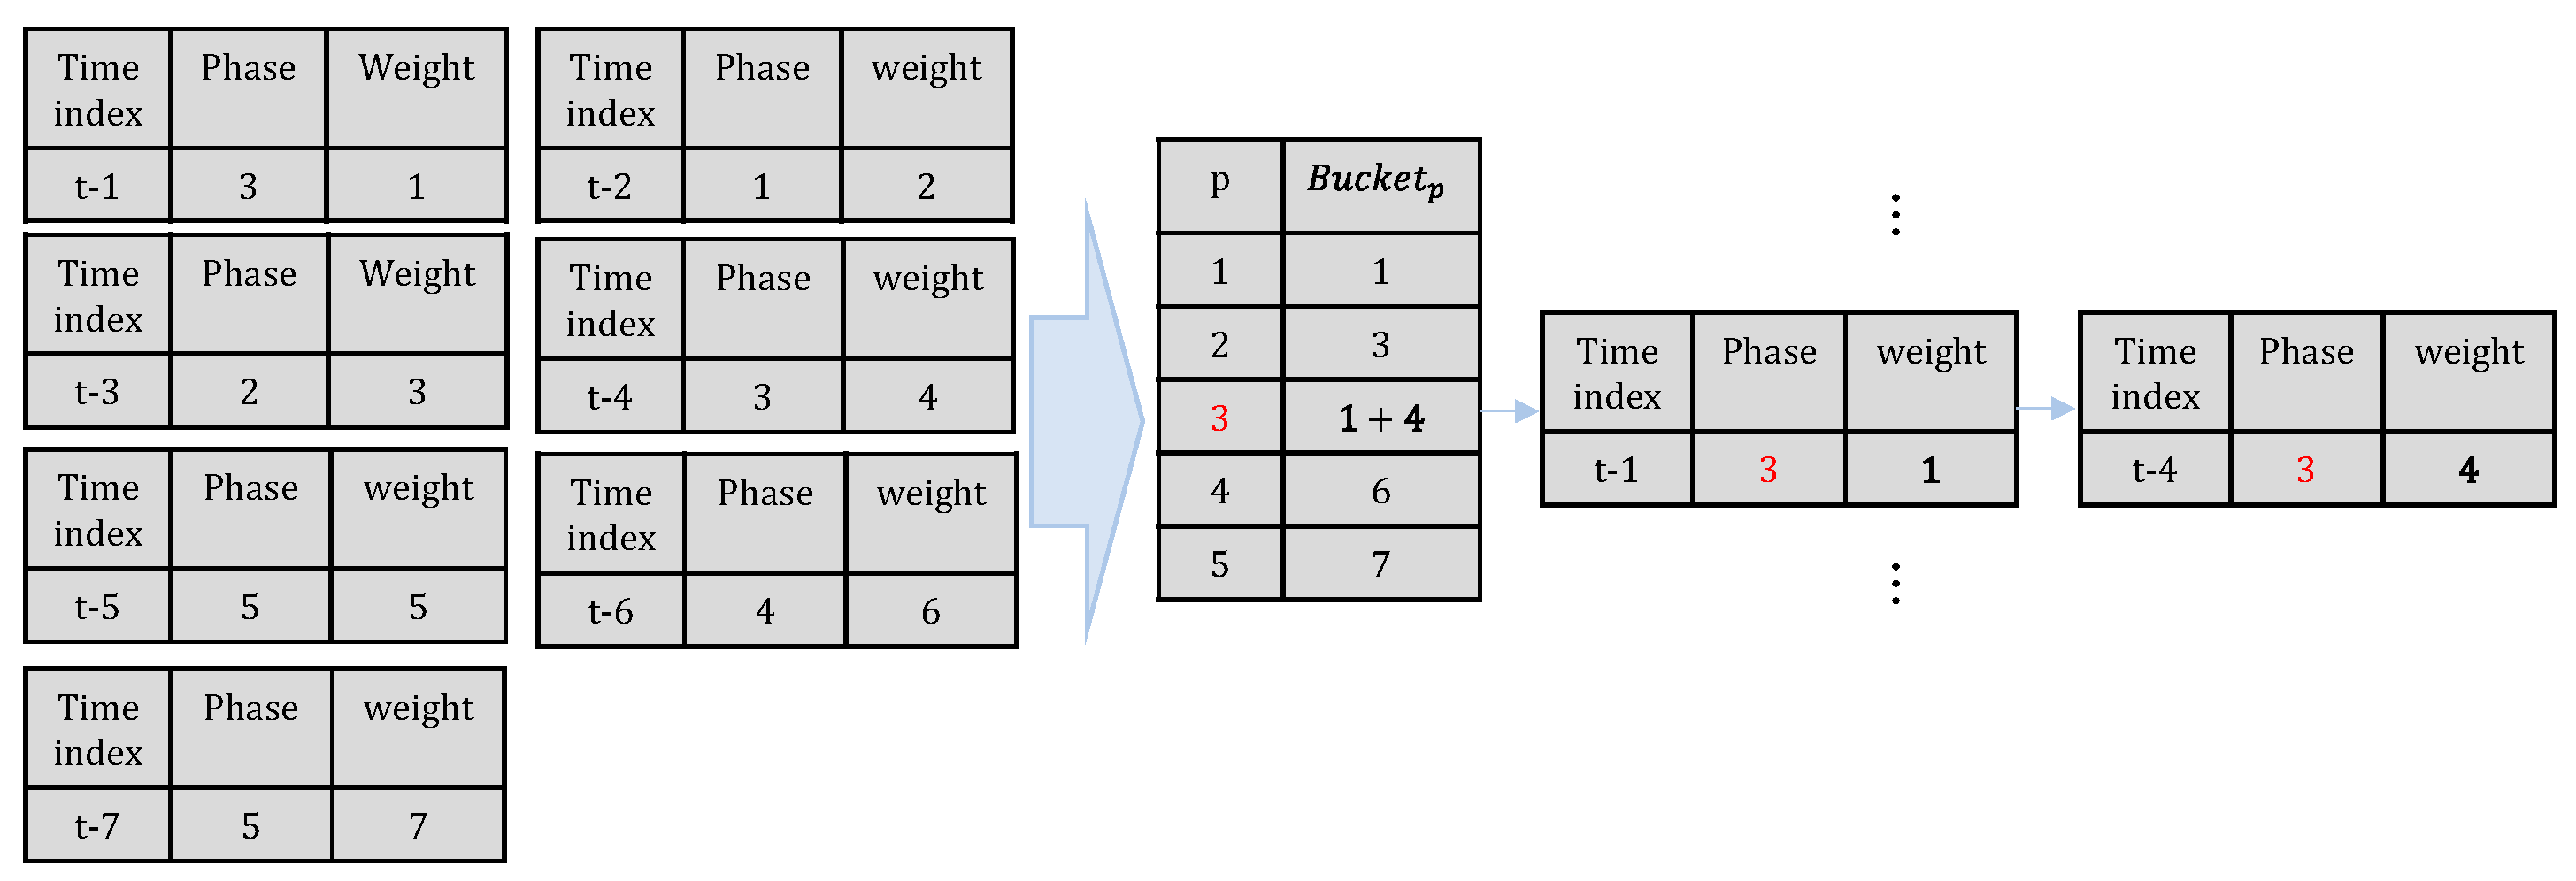
The second is the deep-past method. In order to predict an upcoming phase, this method analyzes the recent 7 phases (i.e.,
,
, …,
). In this method, each phase has a weight w as shown in (5).
In this method,
is the sum of the weights as shown in
Figure 6.
determines which bucket the weight is added to. For example, the weight of time index t-1 is added to the third bucket because phase is 3. After the 7 weights have been added to the 5 buckets, we can determine the upcoming phase.
Equation (6) shows our deep-past method. It decides the upcoming phase as the phase of the bucket with the largest value.
There is a need to set the initial phase since both methods are history-based methods. We set phase 2 (CPU + cache) as the initial phase because phase 2 was the most common phase when we executed 75 workloads and classified each interval vectors in
Section 5.3. In the case of the deep-past method, the method cannot predict until the 7th phase decision is done, since it considers the recent 7 phases for prediction. Therefore, we set the initial 7 phases as phase 2 in the case of the deep-past method.
5.5. General Power Model
If
and
are not same, the prediction is failed. In this case, we cannot use one of the per-phase power models because the collected event types are not matched to
used in the power model.
Equation (7) represents the general power model for the prediction miss case. The general power model is built with
and three
which are values of three events shown in
Table 3 divided by sampling time. These three events are always included in every event sets to calculate
LDST_inst_rate and
Cache_miss_rate. Even though a prediction fails, we can use this general power model because the clock counter value and the three events values are always collected regardless of which phase is.
6. GPU Power Modeling
6.1. Phase Classification
Unlike the CPU’s phase classification, which focused on how CPU uses external memory in connection with its internal behavior, this section focuses more on GPU internal behavior because the power consumption of GPU is much larger than that of external memory. Jin et al. [
9] and Nah et al. [
15] analyzed the GPU pipeline and used utilizations of its unit for their research. Jin et al. [
9] analyzed what hardware units exist on the GPU microarchitecture and used the utilizations of each unit as a predictor of their linear regression power model. Nah et al. [
15] used the utilizations of each unit to characterize various kinds GPU workloads. Prior research suggest that the utilizations of each unit can be used to build a phase-based power model since the usage of hardware resource varies from workload to workload. Therefore, in this paper, we analyze what units are in the Mali T-880 microarchitecture and employ the utilizations of each unit to classify the GPU phase.
Our phase classification method for GPU classifies interval vectors into four phases. They are called Fixed function unit phase, Tiler phase, Tripipe phase, and Memory phase, respectively. The name of each phase means which unit is used most at a time interval. Additionally, the reasons for choosing these 4 units are as follows.
Figure 7 shows an abstracted block diagram of the T-880 microarchitecture. As is shown in
Figure 7, there are three types of units (i.e., tiler, L2 cache, shader core). Tiler divides the screen into tiles of 16 × 16 pixels and the L2 cache connects with external memory systems. Meanwhile, a shader core can be used as both a vertex shader and a fragment shader.
Figure 8 shows the internal structure of a shader core. Fixed function units (FFUs) surround a programmable tripipe unit that runs a shader program, and they are responsible for the preparation of shader operations such as rasterizing and depth testing, or for the post-processing of shader operations [
16]. Therefore, a shader core needs to be divided into two parts: the fixed function units and a tripipe unit. Since GPU consists of four units: FFU, tiler, tripipe, and memory system, we classify interval vectors into four phases corresponding 4 units: FFU phase, Tiler phase, Tripipe phase, and Memory phase.
We use utilizations of each unit for phase classification. The utilization can be calculated using counted event values. In this paper, we suggest two methods for phase classification described in the following subsections.
6.1.1. Maximum Selection Method
In order to decide the phase for an interval vector, this method selects the phase with highest utilization among four units. For instance, if the utilization of FFU unit is larger than the others, FFU phase is selected for . Otherwise, if the utilization of Tier unit is larger than the others, Tiler phase is selected for .
6.1.2. K-Means Clustering Method
This method is based on K-means clustering [
12]. We can cluster all interval vectors in the
data matrix using K-means clustering. New vectors are used for K-means clustering instead of the interval vectors. Each of these new vectors corresponds to each interval vector and has a utilization value of four units. For the initial centroid of K-means clustering, the vector with the highest unit utilization value is selected for each unit, and a total of four interval vectors are selected. (i.e., one with the highest
, one with the highest
, one with the highest
, one with the highest
). The entire interval vectors are divided into 4 clusters by K-means clustering, and each cluster means a corresponding phase. For example, the phase of a vector belonging to a cluster formed by the initial centroid with the highest FFU utilization becomes the FFU phase.
6.2. Per-Phase Power Model
Equation (8) represents the per-phase power model of GPU. In (8), some variables are used as predictors after log conversion (
), and the others are used as predictors without log conversion (
).
The reason for log conversion is the nonlinear characteristic found by Isci et al. [
17]. It is that, when the number of events per second is relatively small, its small increase causes to a large increase in power consumption. On the contrary, when the value is large, its small increase causes to a small increase in power consumption. Hong [
18] solved this problem by converting the values using a log function. Thus, we decide to use log-transformed values as predictors for linear regression. However, since not all variables have nonlinear characteristics, the log transformation was only applied to some events.
6.3. Variable Selection
The PMC, implemented in the ARM Mali-T880 GPU, can collect all 185 events types simultaneously. Thus, it is possible to know all 185 events values at any time interval without the
data matrix shown in Algorithm 1. However, it is undesirable to use all 185 event types as predictors, because it adversely affects the regression performance. Thus, we need to decide which events to use and which events not to use. Considering the number of cases for 185 event types, we need to explore
cases since there are 3 cases for every event type (i.e., one for
, one for
, one for not used). Therefore, in this paper, we employ the genetic algorithm [
4] to search the optimal case for regression. The gene is represented by an integer sequence with 185 elements, and an element has three cases: 0 if the event type is not used, 1 if the event type is used for
, and 2 if the event type is used for
. We used parameters for the genetic algorithm as follows. An initial population of 500, a random integer gene initialization method, a uniform crossover, a uniform integer gene mutation method (indpb = 0.04), and a k best individuals selection method were used.
In order to collect the event values for Mali GPU, a target agent called gator [
19] is needed. The gator driver is responsible for delivering counted event values to the ARM Streamline [
20] host program. Originally, the gator driver should be used with the gator daemon and the ARM Streamline [
20], but we modified the gator driver to deliver PMC event values to our power estimation program.
7. Experimental Setup
7.1. Android OS Settings for Experiment
Due to the limited battery capacity in a smartphone, many low-power techniques are applied to manage its power consumption. Such techniques can act as an impediment to identify the effectiveness of the phase-based power model. Therefore, we turned them off for accurate experiments. First, the governor for the dynamic voltage frequency scaling (DVFS) was set as the userspace governor, and the frequencies of the little core and big core were set to 1.1 GHz and 2.14 GHz, respectively. The frequency of GPU was set to 533 MHz. Second, we turned on only one core for each cluster and prevented the other cores from turning on during the experiment. Finally, ARM provides the intelligent power allocation (IPA) technology for smartphone thermal management. By turning this technique off, the frequency is not changed while the workload is running.
7.2. CPU and GPU Power Measument
7.2.1. CPU Power Measurement
In this experiment, we use the monsoon power monitor that measures the total power consumption of the smartphone. The android debug bridge (ADB) shell commands are used to execute the CPU workload, but the CPU operates only when the smartphone display is on. We set the android
wake_lock for accurate measurement so that the CPU can operate even when the display is off. By doing so, we can exclude the power consumption of display. After setting the wake lock, the measured power without executing any workload is expressed as
in (9).
The measured power, while the CPU executes workload and the display is off, is represented by in (9). Therefore, the dynamic power consumption of the CPU is represented by as shown in (9).
7.2.2. GPU Power Measurement
Since not all GPU workloads support offscreen rendering, display power cannot be excluded. We used fast and accurate display power model [
21] to estimate display power consumption, which is expressed as
as shown in (10). Therefore, the dynamic power consumption of the GPU,
, is calculated as shown in (10). In (10),
is the estimated power consumption by our proposed CPU power model.
8. Experimental Results
8.1. Building CPU and GPU Power Models
8.1.1. Workloads for CPU and GPU Power Models
We used 75 workloads and 15 workloads to build the CPU and GPU power models, respectively. 75 workloads for CPU are composed of 37 from roy longbottom benchmark [
22], 16 from c algorithm benchmark [
23], 1 from parsec benchmark [
24], 6 from cortex suite benchmark [
25], 13 from mibench benchmark [
26], and 2 from ARM Linux Benchmark [
27]. Meanwhile, 15 workloads for GPU are composed of 3DMark [
28], Madagascar 3D benchmark [
29], Kassja benchmark [
30], Renderscript benchmark [
31], Nena benchmark [
32], V1 GPU benchmark [
33], Seascape benchmark [
34], Basemark [
35], 3D benchmark [
36], Relative benchmark [
37], and L-bench [
15]. We installed them on the Galaxy S7 smartphone for experiment.
8.1.2. Results of Per-Phase CPU Power Models
Table 4 shows the MAPEs of per-phase power models. The predictors of each per-phase model were selected by the variable selection method shown in
Section 5.3. All 54-size interval vectors from the data matrix were classified into five phases using the phase classification method shown in
Section 5.1. Then, each per-phase model has been built with only the interval vectors of the corresponding phase. Eventually, the MAPEs of per-phase models shown in
Table 4 are on average 2.51% on ARM cortex-A53 CPU and averagely 1.97% on Samsung M1 CPU, respectively.
8.1.3. Comparison with Existing CPU Power Models
Table 5 shows the results of the proposed CPU power models, the existing utilization-based model [
5] and the PMC based model. In the case of the PMC based model, we used our variable selection method to select six global event types instead of the method proposed by Walker et at [
10]. The first and second rows of
Table 5 show the results of implementing those models on the Galaxy S7 smartphone. The proposed per-phase models show better results compared to both the utilization-based model and the PMC-based model. However, the general power model described in
Section 5.5 shows worse MAPE results than that of the PMC-based model, but shows better results than that of the utilization-based model. Actually, a phase prediction rate is important. This is because, if prediction fails, we cannot help but use the general power model. Meanwhile, CPU workloads are not suitable to test the phase prediction rate because they have monotonous characteristics. Thus, in
Section 8.2.2, we will test the prediction rate for 3D rendering and game benchmarks that show dynamic characteristics.
8.1.4. Results of Per-Phase GPU Power Models
Table 6 shows the MAPE of our per-phase GPU power models. We used the maximum selection method, described in
Section 6.1, to classify all interval vectors to four phases. The genetic algorithm was performed about 220 h to select the semi-optimal event sets and finally we built the per-phase power models using selected event sets. As shown in
Table 6, the per-phase power models showed 5.12–11.23% MAPEs and 8.92% MAPEs on average.
8.1.5. Comparison with Existing GPU Power Models
Table 7 shows the results of the proposed GPU power model, the existing utilization-based model [
7] and the PMC-based model [
9]. The first and second rows of
Table 7 show the results of implementing those models on the Galaxy S7 smartphone. There is no general power model for GPU, since there is no phase prediction step in our GPU power estimation process. As shown in
Table 7, the proposed per-phase models were better than the others.
8.2. CPU + GPU Power Model Test
8.2.1. Workloads for CPU + GPU Power Model
We installed nine additional workloads, which are different from those of
Section 8.1, to test our holistic power model that combines the proposed CPU and GPU power models. The nine workloads are composed of Antutu benchmark GPU [
38], Performance test mobile [
39], Orbital flight benchmark [
40], Unreal benchmark [
41], OESK benchmark [
42], Snow forest [
43], KZ FPS2017 [
44], and bunny benchmark [
45]. In the case of the performance test mobile [
39]. Each section was treated as different workloads.
8.2.2. CPU Phase Prediction Rate
In case of phase prediction, two methods are proposed in
Section 5.4. We evaluated these methods with the 9 workloads. The phase prediction rate is calculated as in (11).
Table 8 shows the prediction rates of the past and deep past methods. The average prediction rates of the past and deep past methods were 67.65% and 81.85%, respectively, when we experimented on nine workloads. Therefore, if the past method is used, prediction misses may occur so frequently that the general power model is more frequently used. On the contrary, the deep-past method can improve the performance of our phase-based power model.
8.2.3. Results of GPU Phase Classification Methods
The holistic power model should estimate the overall power consumption of a smartphone. To this end, we combined the proposed CPU and GPU power models and an existing state-of the-art display power model.
As shown in (12),
represents the holistic power model and is the sum of each estimated power.
,
, and
represent the estimated power values of the CPU, GPU, and display power models, respectively.
is the same value with that of (9). The power consumption of the display is estimated by the high-accurate display power model [
21].
Figure 9 shows the holistic power models with four optional combinations. In
Figure 9, CPU(past) means a CPU power model built with the past phase prediction method described in
Section 5.4, and GPU(max) means a GPU power model built with the maximum selection method described in
Section 6.1. CPU(deep-past) and GPU(K-means) mean the CPU and GPU power models with the deep-past method and K-means clustering, respectively. In
Figure 9,
x-axis represents the running workloads and
y-axis represents the MAPEs, which are calculated by comparing the estimated power with the actual measured power. When we compare the average result of model 1 with that of model 2, we can see that the Maximum-based method is better than the K-means method. Likewise, the performance of model 3 is better than that of model 4. Thus, the Maximum selection method is better than the K-means method since the holistic power model with GPU(max) shows better MAPEs than that with GPU(K-means).
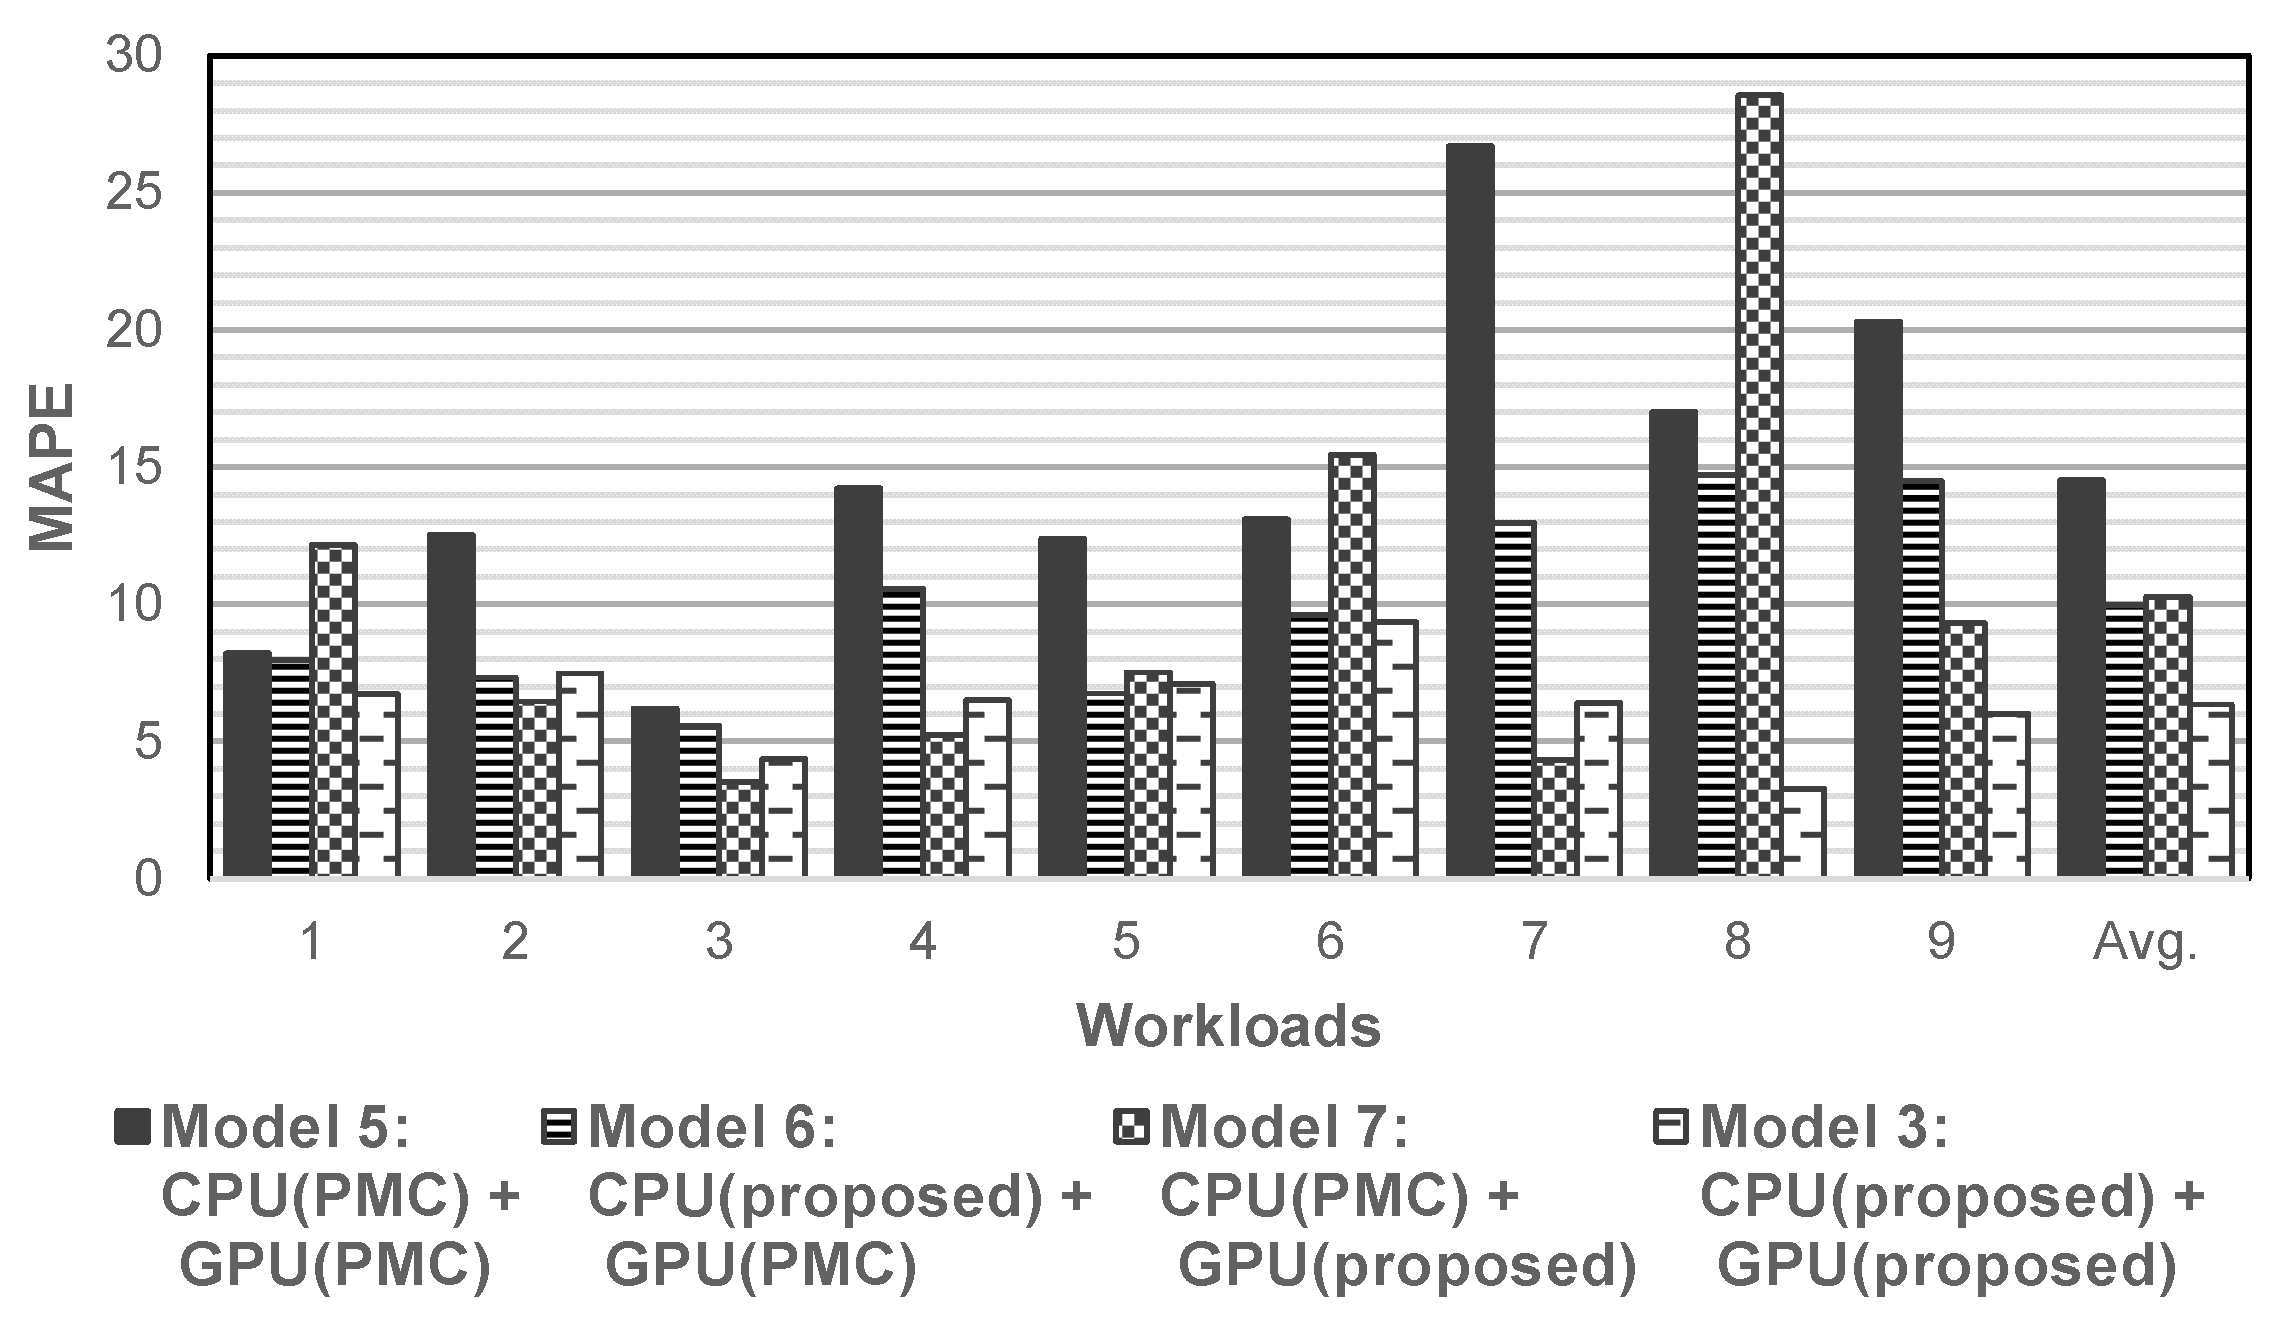
8.2.4. Holistic Power Model Comparison
Based on the results of the previous section, we selected model 3 (deep-past + maximum selection) for the holistic power model.
Figure 10 shows the results of comparison ours with existing state-of-the-art power models.
Figure 10 shows the MAPEs of four combinations of the proposed and existing power models on CPU and GPU for the holistic power model of the smartphone. The average MAPE was reduced from 14.51% to 9.99% when we compare model 5 with model 6. Similar results are shown when we compare model 5 with model 7. The average MAPE was reduced from 14.51% to 10.28%. As a result, model 3, which is the combination of the proposed CPU and GPU power models, showed a 6.36% average MAPE, showing much improved results compared to model 5, which is the combination of the existing state-of-the-art PMC-based CPU and GPU power models.
9. Conclusions
In this paper, new and accurate phase-based CPU and GPU power modeling methods for mobile application processors are proposed. We classified hardware operations into several phases and built per-phase power models. Additionally, then, we combined them into an accurate holistic power model. Based on an observation, a specific event set can produce better results on a specific phase in the aspect of the accuracy of a power model, we proposed efficient variable selection methods to find the optimal event set in each phase. We also proposed phase classification and prediction methods to use an appropriate per-phase power model according to the hardware state. In the case of CPU, a phase classification method, a variable selection method, and two phase prediction methods were proposed, and in the case of GPU, two phase classification methods and the genetic algorithm were proposed.
We tested the holistic power models using four different optional combinations. The results showed that the model built with the deep-past method for CPU and maximum-based method for GPU was best. The results also showed that the proposed power model can estimate power consumption more accurately than the existing PMC-based power model. When we compared our best holistic power models with models built with existing methods, our model showed an average MAPE of 6.36%, which resulted in 56% improvement over the latest prior model.
Since we conducted all experiments on the Galaxy S7 smartphone, our model shows the possibility of accurately estimating the power consumption of a recent mobile device without additional sensors for power measurement. As future work, more research on the improved phase prediction method is required, because if the hardware state is more correctly predicted by the improved phase prediction method, a per-phase power model corresponding to the state will be used more frequently, and the accuracy of the power model estimation will be raised higher.
Author Contributions
Conceptualization, Y.-J.K.; Methodology, K.L., S.-R.O., Y.-J.K.; Project administration, Y.-J.K.; Resources, Y.-J.K.; Software, K.L., S.-R.O.; Validation, K.L., S.-G.L.; Visualization, S.-R.O., S.-G.L.; Writing—original draft, K.L.; Writing—review & editing, S.-G.L., Y.-J.K. All authors have read and agreed to the published version of the manuscript.
Funding
This research was supported by the Basic Science Research Program through the NRF, Korea funded by the Ministry of Education (2018R1A2B6005466) and the Ajou University research fund.
Conflicts of Interest
The authors declare no conflict of interest.
References
- Heibert, P. Smartphone Users Still Want Long-Lasting Batteries More Than Shatterproof Screens. Available online: https://today.yougov.com/topics/technology/articles-reports/2018/02/20/smartphone-users-still-want-longer-battery-life (accessed on 16 May 2021).
- Chen, X.; Chen, Y.; Ma, Z.; Fernandes, F.C.A. How is energy consumed in smartphone display applications? In Proceedings of the 14th Workshop on Mobile Computing Systems and Applications (HotMobile 2013), Jekyll Island, GA, USA, 26–27 February 2013. [Google Scholar]
- ARM. Arm DS-5. Available online: https://developer.arm.com/tools-and-software/embedded/legacy-tools/ds-5-development-studio (accessed on 16 May 2021).
- Whitley, D. A genetic algorithm tutorial. Stat. Comput. 1994, 4, 65–85. [Google Scholar] [CrossRef]
- Yoon, C.; Lee, S.; Choi, Y.; Ha, R.; Cha, H. Accurate power modeling of modern mobile application processors. J. Syst. Arch. 2017, 81, 17–31. [Google Scholar] [CrossRef]
- Zhang, Y.; Liu, Y.; Zhuang, L.; Liu, X.; Zhao, F.; Li, Q. Accurate CPU Power Modeling for Multicore Smartphones; MSR-TR-2015-9; Microsoft Reasearch Asia: Beijing, China, 2015. [Google Scholar]
- Kim, Y.G.; Kim, M.; Kim, J.M.; Sung, M.; Chung, S.W. A Novel GPU Power Model for Accurate Smartphone Power Breakdown. ETRI J. 2015, 37, 157–164. [Google Scholar] [CrossRef]
- Pricopi, M.; Muthukaruppan, T.S.; Venkataramani, V.; Mitra, T.; Vishin, S. Power-performance modeling on asymmetric multi-cores. In Proceedings of the 2013 International Conference on Compilers, Architecture and Synthesis for Embedded Systems (CASES), Montreal, QC, Canada, 29 September–4 October 2013; pp. 1–10. [Google Scholar]
- Jin, T.; He, S.; Liu, Y. Towards Accurate GPU Power Modeling for Smartphones. In Proceedings of the 13th Annual International Conference on Mobile Systems, Applications, and Services (MobiSys 2015), Florence, Italy, 19–22 May 2015; pp. 7–11. [Google Scholar]
- Walker, M.J.; Diestelhorst, S.; Hansson, A.; Das, A.K.; Yang, S.; Al-Hashimi, B.M.; Merrett, G.V. Accurate and Stable Run-Time Power Modeling for Mobile and Embedded CPUs. IEEE Trans. Comput. Des. Integr. Circuits Syst. 2017, 36, 106–119. [Google Scholar] [CrossRef] [Green Version]
- Sherwood, T.; Perelman, E.; Hamerly, G.; Sair, S.; Calder, B. Discovering and exploiting program phases. IEEE Micro 2003, 23, 84–93. [Google Scholar] [CrossRef]
- Hartigan, J.A.; Wong, M.A. Algorithm AS 136: A K-Means Clustering Algorithm. J. R. Stat. Soc. Ser. C Appl. Stat. 1979, 28, 100. [Google Scholar] [CrossRef]
- Kim, Y.; Mercati, P.; More, A.; Shriver, E.; Rosing, T. P4: Phase-based power/performance prediction of heterogeneous systems via neural networks. In Proceedings of the 2017 IEEE/ACM International Conference on Computer-Aided Design (ICCAD), Irvine, CA, USA, 13–16 November 2017; pp. 683–690. [Google Scholar]
- Zheng, X.; John, L.K.; Gerstlauer, A. Accurate phase-level cross-platform power and performance estimation. In Proceedings of the Proceedings of the 53rd Annual Design Automation Conference, Austin, TX, USA, 5–9 June 2016; pp. 1–6. [Google Scholar]
- Nah, J.-H.; Suh, Y.; Lim, Y. L-Bench: An Android benchmark set for low-power mobile GPUs. Comput. Graph. 2016, 61, 40–49. [Google Scholar] [CrossRef]
- Peter Harris. The Mali GPU: An Abstract Machine, Part 3-The Midgard Shader Core. Available online: https://community.arm.com/developer/tools-software/graphics/b/blog/posts/the-mali-gpu-an-abstract-machine-part-3---the-midgard-shader-core?CommentId=b7b18d27-4368-4e96-bce8-4f4a947af00c (accessed on 16 May 2021).
- Isci, C.; Martonosi, M. Runtime power monitoring in high-end processors: Methodology and empirical data. In Proceedings of the 36th Annual International Symposium on Microarchitecture, San Diego, CA, USA, 3–5 December 2003. [Google Scholar]
- Hong, S.; Kim, H. An integrated GPU power and performance model. ACM SIGARCH Comput. Arch. News 2010, 38, 280–289. [Google Scholar] [CrossRef]
- ARM-Software. Gator Daemon, Driver and Related Tools. Available online: https://github.com/ARM-software/gator (accessed on 16 May 2021).
- ARM Developer. Streamline Performance Analyzer. Available online: https://developer.arm.com/tools-and-software/embedded/arm-development-studio/components/streamline-performance-analyzer (accessed on 16 May 2021).
- Kim, C.; Hong, S.; Lee, K.; Kim, Y.J. High-Accurate and Fast Power Model Based on Channel Dependency for Mobile AMOLED Displays. IEEE Access 2018, 6, 73380–73394. [Google Scholar] [CrossRef]
- R. Longbottom. Roy Longbottom’s pc Benchmark Collection. Available online: http://www.roylongbottom.org.uk (accessed on 16 May 2021).
- fragglet. C Algorithms. Available online: https://fragglet.github.io/c-algorithms/ (accessed on 16 May 2021).
- Bienia, C.; Li, K. PARSEC 2.0: A New Benchmark Suite for Chip-Multiprocessors. In Proceedings of the 5th Annual Workshop on Modeling, Benchmarking and Simulation, New Orleans, LA, USA, 21 June 2009; Volume 2011. [Google Scholar]
- Thomas, S.; Gohkale, C.; Tanuwidjaja, E.; Chong, T.; Lau, D.; Garcia, S.; Taylor, B.M. CortexSuite: A synthetic brain benchmark suite. In Proceedings of the 2014 IEEE International Symposium on Workload Characterization (IISWC), Raleigh, NC, USA, 26–28 October 2014; pp. 76–79. [Google Scholar]
- Guthaus, M.R.; Ringenberg, J.S.; Ernst, D.; Austin, T.M.; Mudge, T.; Brown, R.B. MiBench: A free, commercially representative embedded benchmark suite. In Proceedings of the Fourth Annual IEEE International Workshop on Workload Characterization, Austin, TX, USA, 2 December 2001; pp. 3–14. [Google Scholar]
- TonyHo. ARM Linux BenchMark. Available online: http://tonyho.github.io/ARM%20Linux%20BenchMark.html (accessed on 16 May 2021).
- 3DMark. UL LLC. Available online: https://play.google.com/store/apps/details?id=com.futuremark.dmandroid.application (accessed on 16 May 2021).
- Madagascar 3D Benchmark. ext2dev4me. Available online: https://play.google.com/store/apps/details?id=app.ext2dev4me.m3db (accessed on 16 May 2021).
- Benchmark 3D Kassja graphics. MKDesignMobile. Available online: https://play.google.com/store/apps/details?id=com.mkdesignmobile.KassjaBenchmark (accessed on 16 May 2021).
- Renderscript Benchmark. Binary Group SK s.r.o. Available online: https://play.google.com/store/apps/details?id=name.duzenko.farfaraway (accessed on 16 May 2021).
- NenaMark2. Nena Innovation AB. Available online: https://play.google.com/store/apps/details?id=se.nena.nenamark2 (accessed on 16 May 2021).
- V1-GPU Benchmark Pro. Invented Games. Available online: https://m.apkpure.com/kr/v1-gpu-benchmark-pro/com.InventedGames.V1Benchmark (accessed on 16 May 2021).
- Seascape Benchmark-Test Your Device Performance. NatureApps. Available online: https://play.google.com/store/apps/details?id=com.nature.seascape (accessed on 16 May 2021).
- Basemark GPU. Basemark. Available online: https://play.google.com/store/apps/details?id=com.basemark.basemarkgpu.free (accessed on 16 May 2021).
- 3D Benchmark. 42 Game Studio. Available online: https://apkpure.com/kr/3d-benchmark-android-gamers/com.cabodidev.threedbenchmark (accessed on 16 May 2021).
- Relative Benchmark. RelativeGames. Available online: https://play.google.com/store/apps/details?id=com.re3.benchmark (accessed on 16 May 2021).
- Antutu Benchmark. Beijing Antutu Technology Company Limited. Available online: http://www.antutu.com/en/index.htm (accessed on 16 May 2021).
- PassMark PerformanceTest. PassMark Software. Available online: https://play.google.com/store/apps/details?id=com.passmark.pt_mobile (accessed on 16 May 2021).
- Orbital Flight Benchmark-Asteroids Benchmarks. Virtual Arts Ltd. Available online: https://apkpure.com/kr/orbital-flight-benchmark-asteroids-benchmarks/virtualarts.benchmarks.orbitalflight (accessed on 16 May 2021).
- Unreal System Benchmark. PlatinumBladeGames. Available online: https://play.google.com/store/apps/details?id=com.PlatinumBladeGames.UnrealSystemBenchmark (accessed on 16 May 2021).
- OESK Benchmark-3D 2D Game. NTIMobile. Available online: https://apkpure.com/kr/oesk-benchmark-3d-2d-game/pl.ntimobile.oeskbenchmarktwo2 (accessed on 16 May 2021).
- Snow Forest Benchmark-Asteroids Benchmarks. Virtual Arts Ltd. Available online: https://apkpure.com/kr/snow-forest-benchmark-asteroids-benchmarks/virtualarts.benchmarks.snowforest (accessed on 16 May 2021).
- KZ FPS BENCHMARK 2017. KrzysztofZuk. Available online: https://play.google.com/store/apps/details?id=com.KrzysztofZuk.KZ3DBenchmark2017&hl=ko (accessed on 16 May 2021).
- Bunny Benchmark. Alexander Fomin. Available online: https://play.google.com/store/apps/details?id=ru.alexanderfomin.bunnybenchmark&hl=ko (accessed on 16 May 2021).
| Publisher’s Note: MDPI stays neutral with regard to jurisdictional claims in published maps and institutional affiliations. |
© 2021 by the authors. Licensee MDPI, Basel, Switzerland. This article is an open access article distributed under the terms and conditions of the Creative Commons Attribution (CC BY) license (https://creativecommons.org/licenses/by/4.0/).


