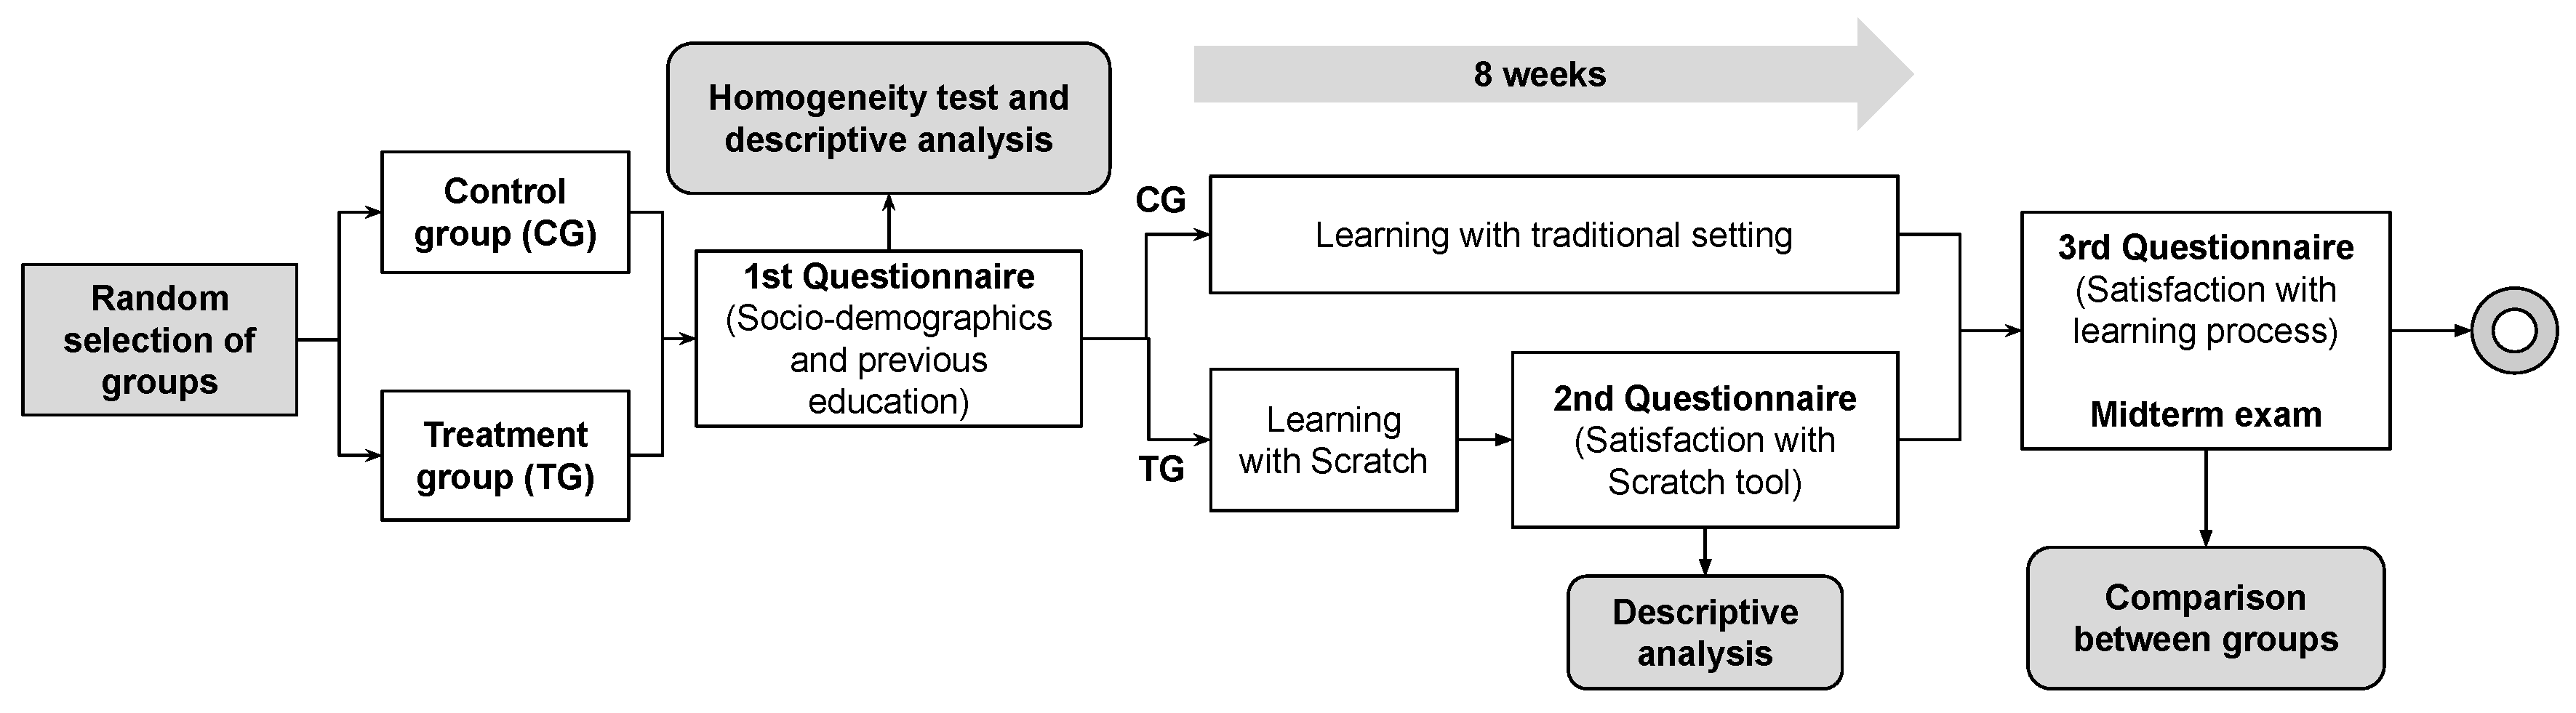
This section describes the results obtained to provide answers to the questions guiding the research. Before this, we have considered it necessary to show statistically that the groups under study (control and experimental) are homogeneous (
Section 4.1). In this way, it will be verified that the assignment of individuals to these groups has been carried out with the least occurrence of bias. After that,
Section 4.2 addresses the satisfaction of the Experimental group about Scratch and the satisfaction of both groups with respect to the teaching method, that is, after 8 weeks. Finally,
Section 4.3 provides answers to question RQ2 through both univariate and multivariate statistical analyses.
4.1. Homogeneity of the Groups
To simplify the analysis of group homogeneity, the study was divided into two parts. First, we analyzed the six initial questions (A1…A6) of the Q1 questionnaire presented in
Table 1, and in the second part, we will consider the pre-course motivation (items from A7 to A13).
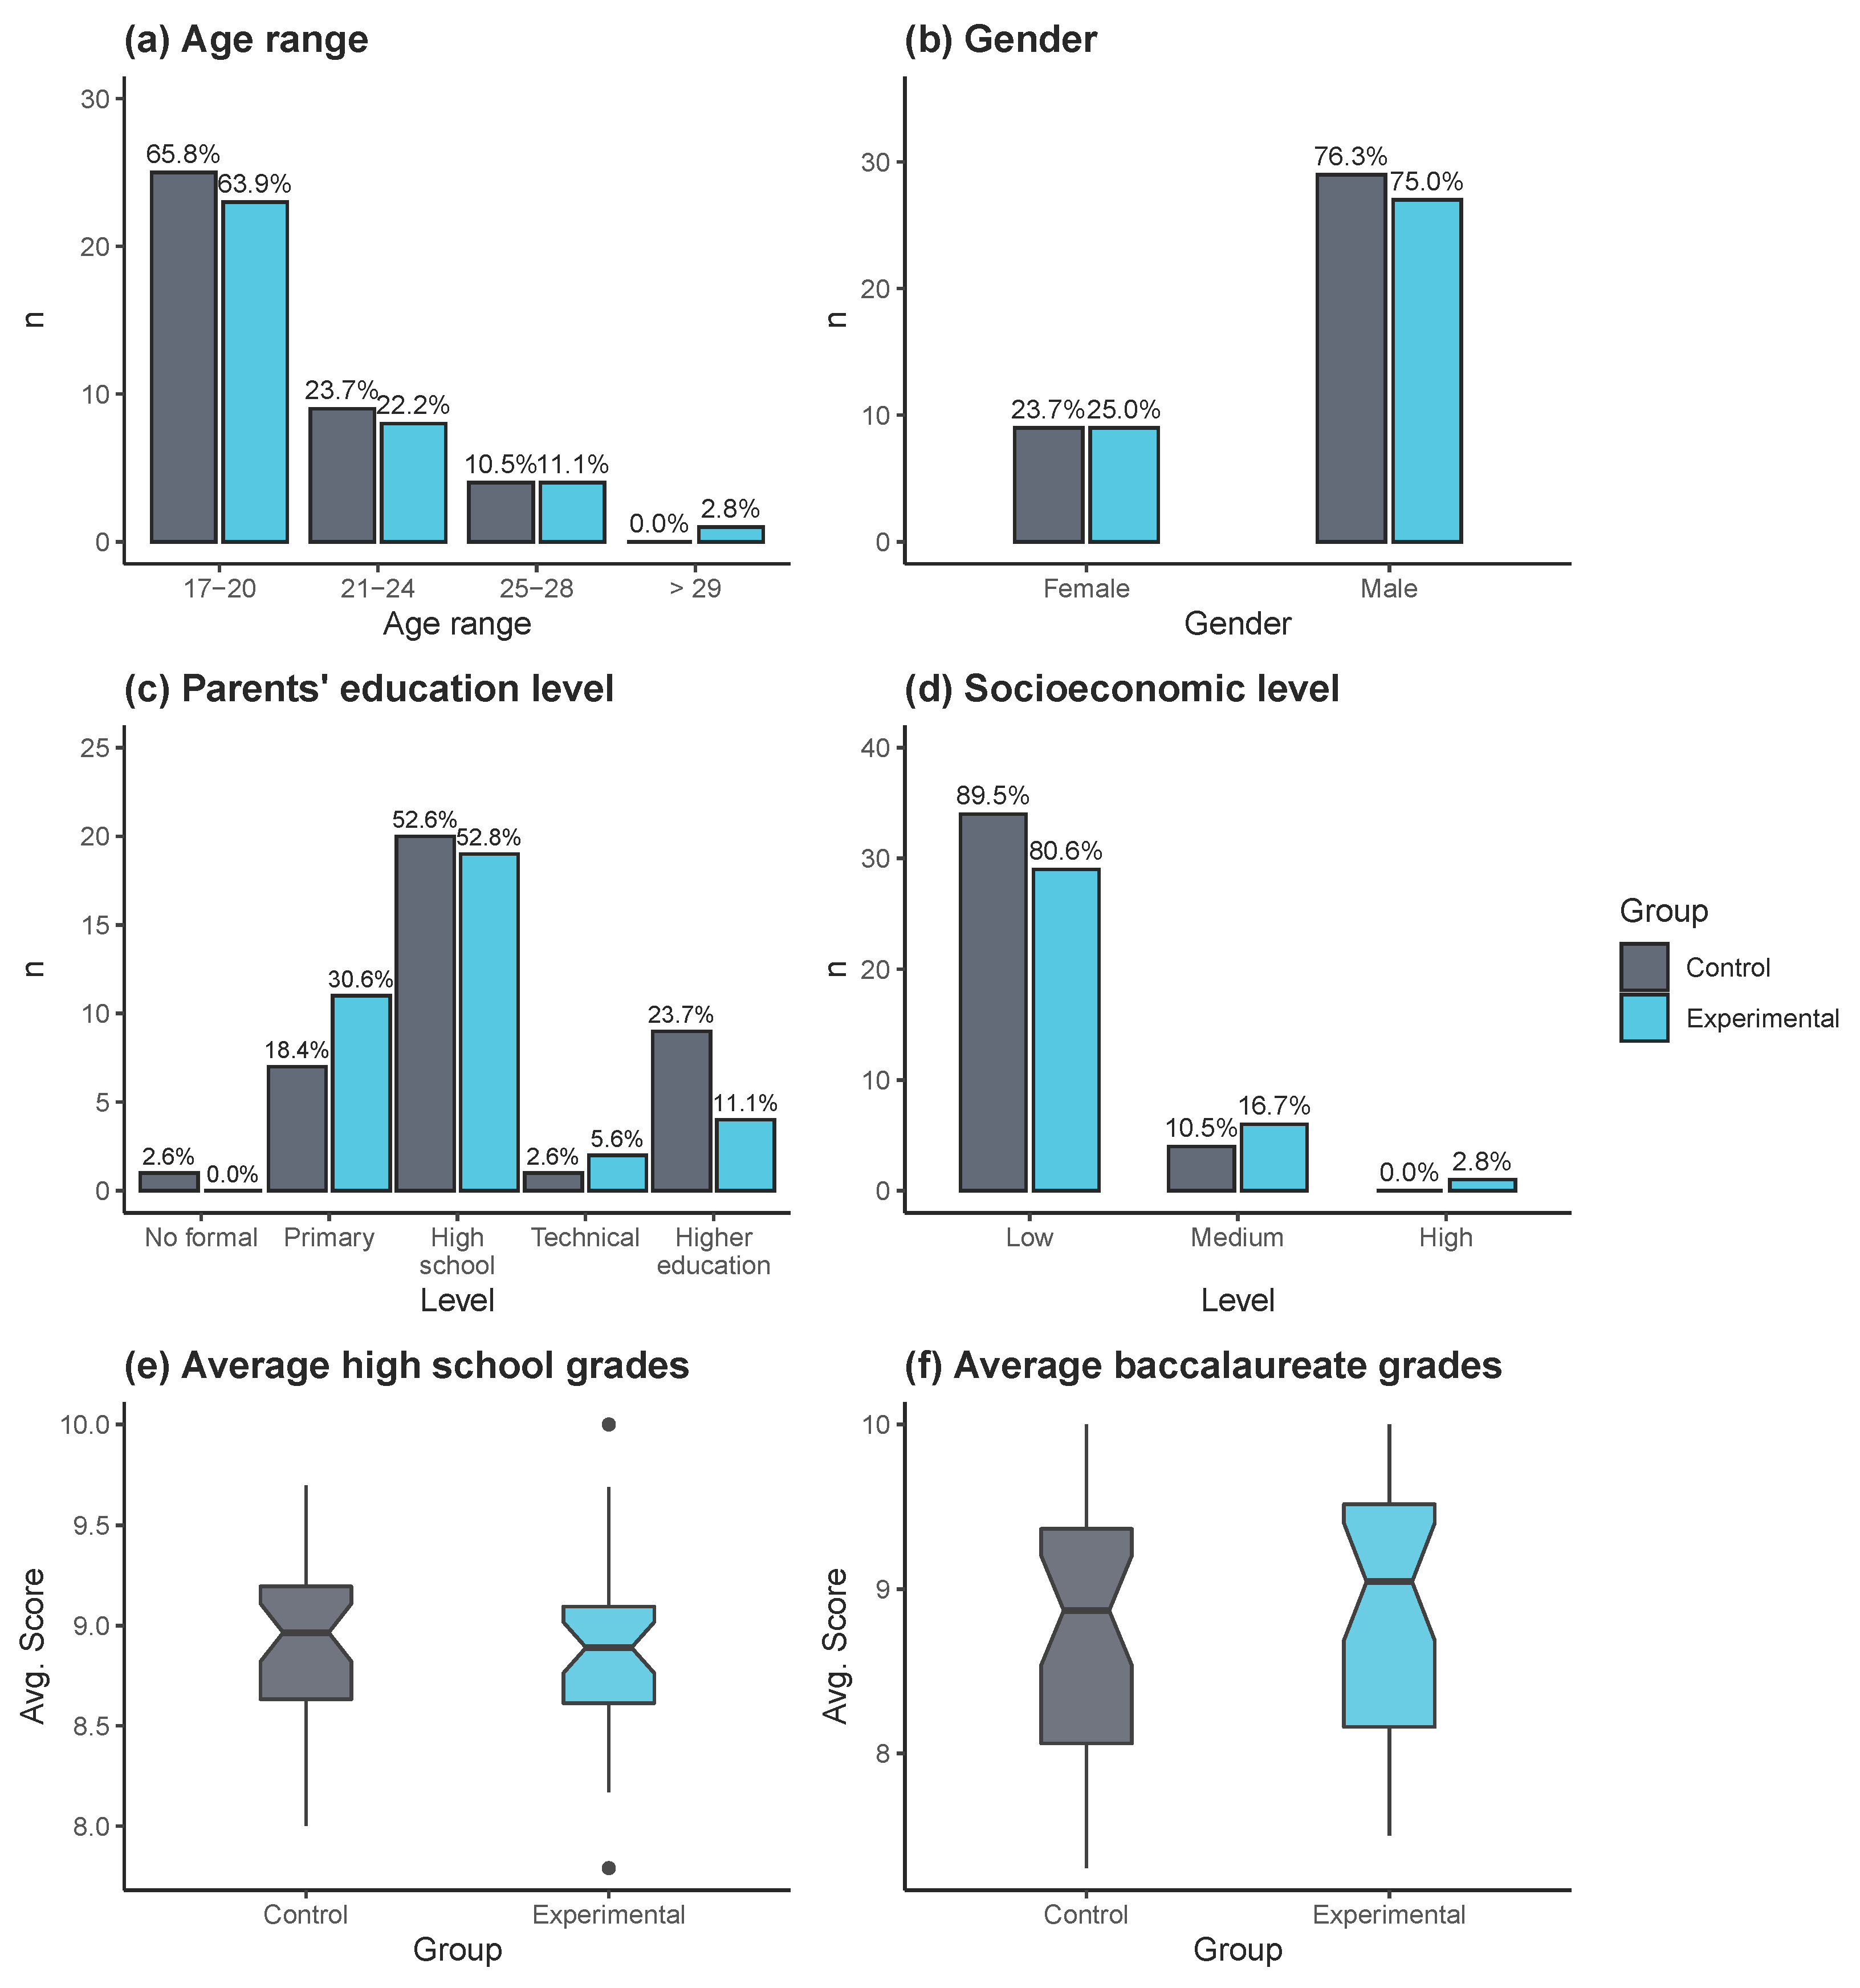
Figure 2 shows a descriptive summary of the variables that characterize the students. From these plots we can observe that students in both groups (control and experimental) present very similar characteristics. The majority are under 21 years of age (
Figure 2a), are male (
Figure 2a), with parents who studied up to high school (
Figure 2c), and from families with low socioeconomic status (
Figure 2d). Additionally,
Figure 2e,f show that both groups are composed of students who obtained similar academic grades in both high school and baccalaureate. Overall, these features indicate that most of the students started the course in not very favorable conditions.
In order to formally confirm the homogeneity of the control and experimental groups, we proceeded with a statistical analysis. We relied on a t-test for equality of means.
Table 2 shows that no significant differences exit between the experimental and control group in terms of age, parental education level, socioeconomic level of the family, average high-school grades, and average grades in the baccalaureate course (all
p-value
).
In the second part of this study, we analyzed the existence of significant differences between the experimental and control groups regarding motivation. The operationalization of this variable was realized by means of the average of the perception on the degree of fidelity in the course, regularity, attendance, interest, intellectual capacity and expectation of passing Fundamentals of Programming.
Table 3 and
Table 4 show the statistical summary and results of t-test. Under the test of normality and homogeneity of variance, the value of the t-test (
p-value
) did not provide enough statistical evidence to reject the null hypothesis (
). For this reason, there is no significant difference between students’ expectations at the beginning of the course.
4.2. Satisfaction Analysis (RQ1)
In this section, we will analyze the information obtained in the Q2 and Q3 questionnaires. Both were applied after 8 weeks of intervention.
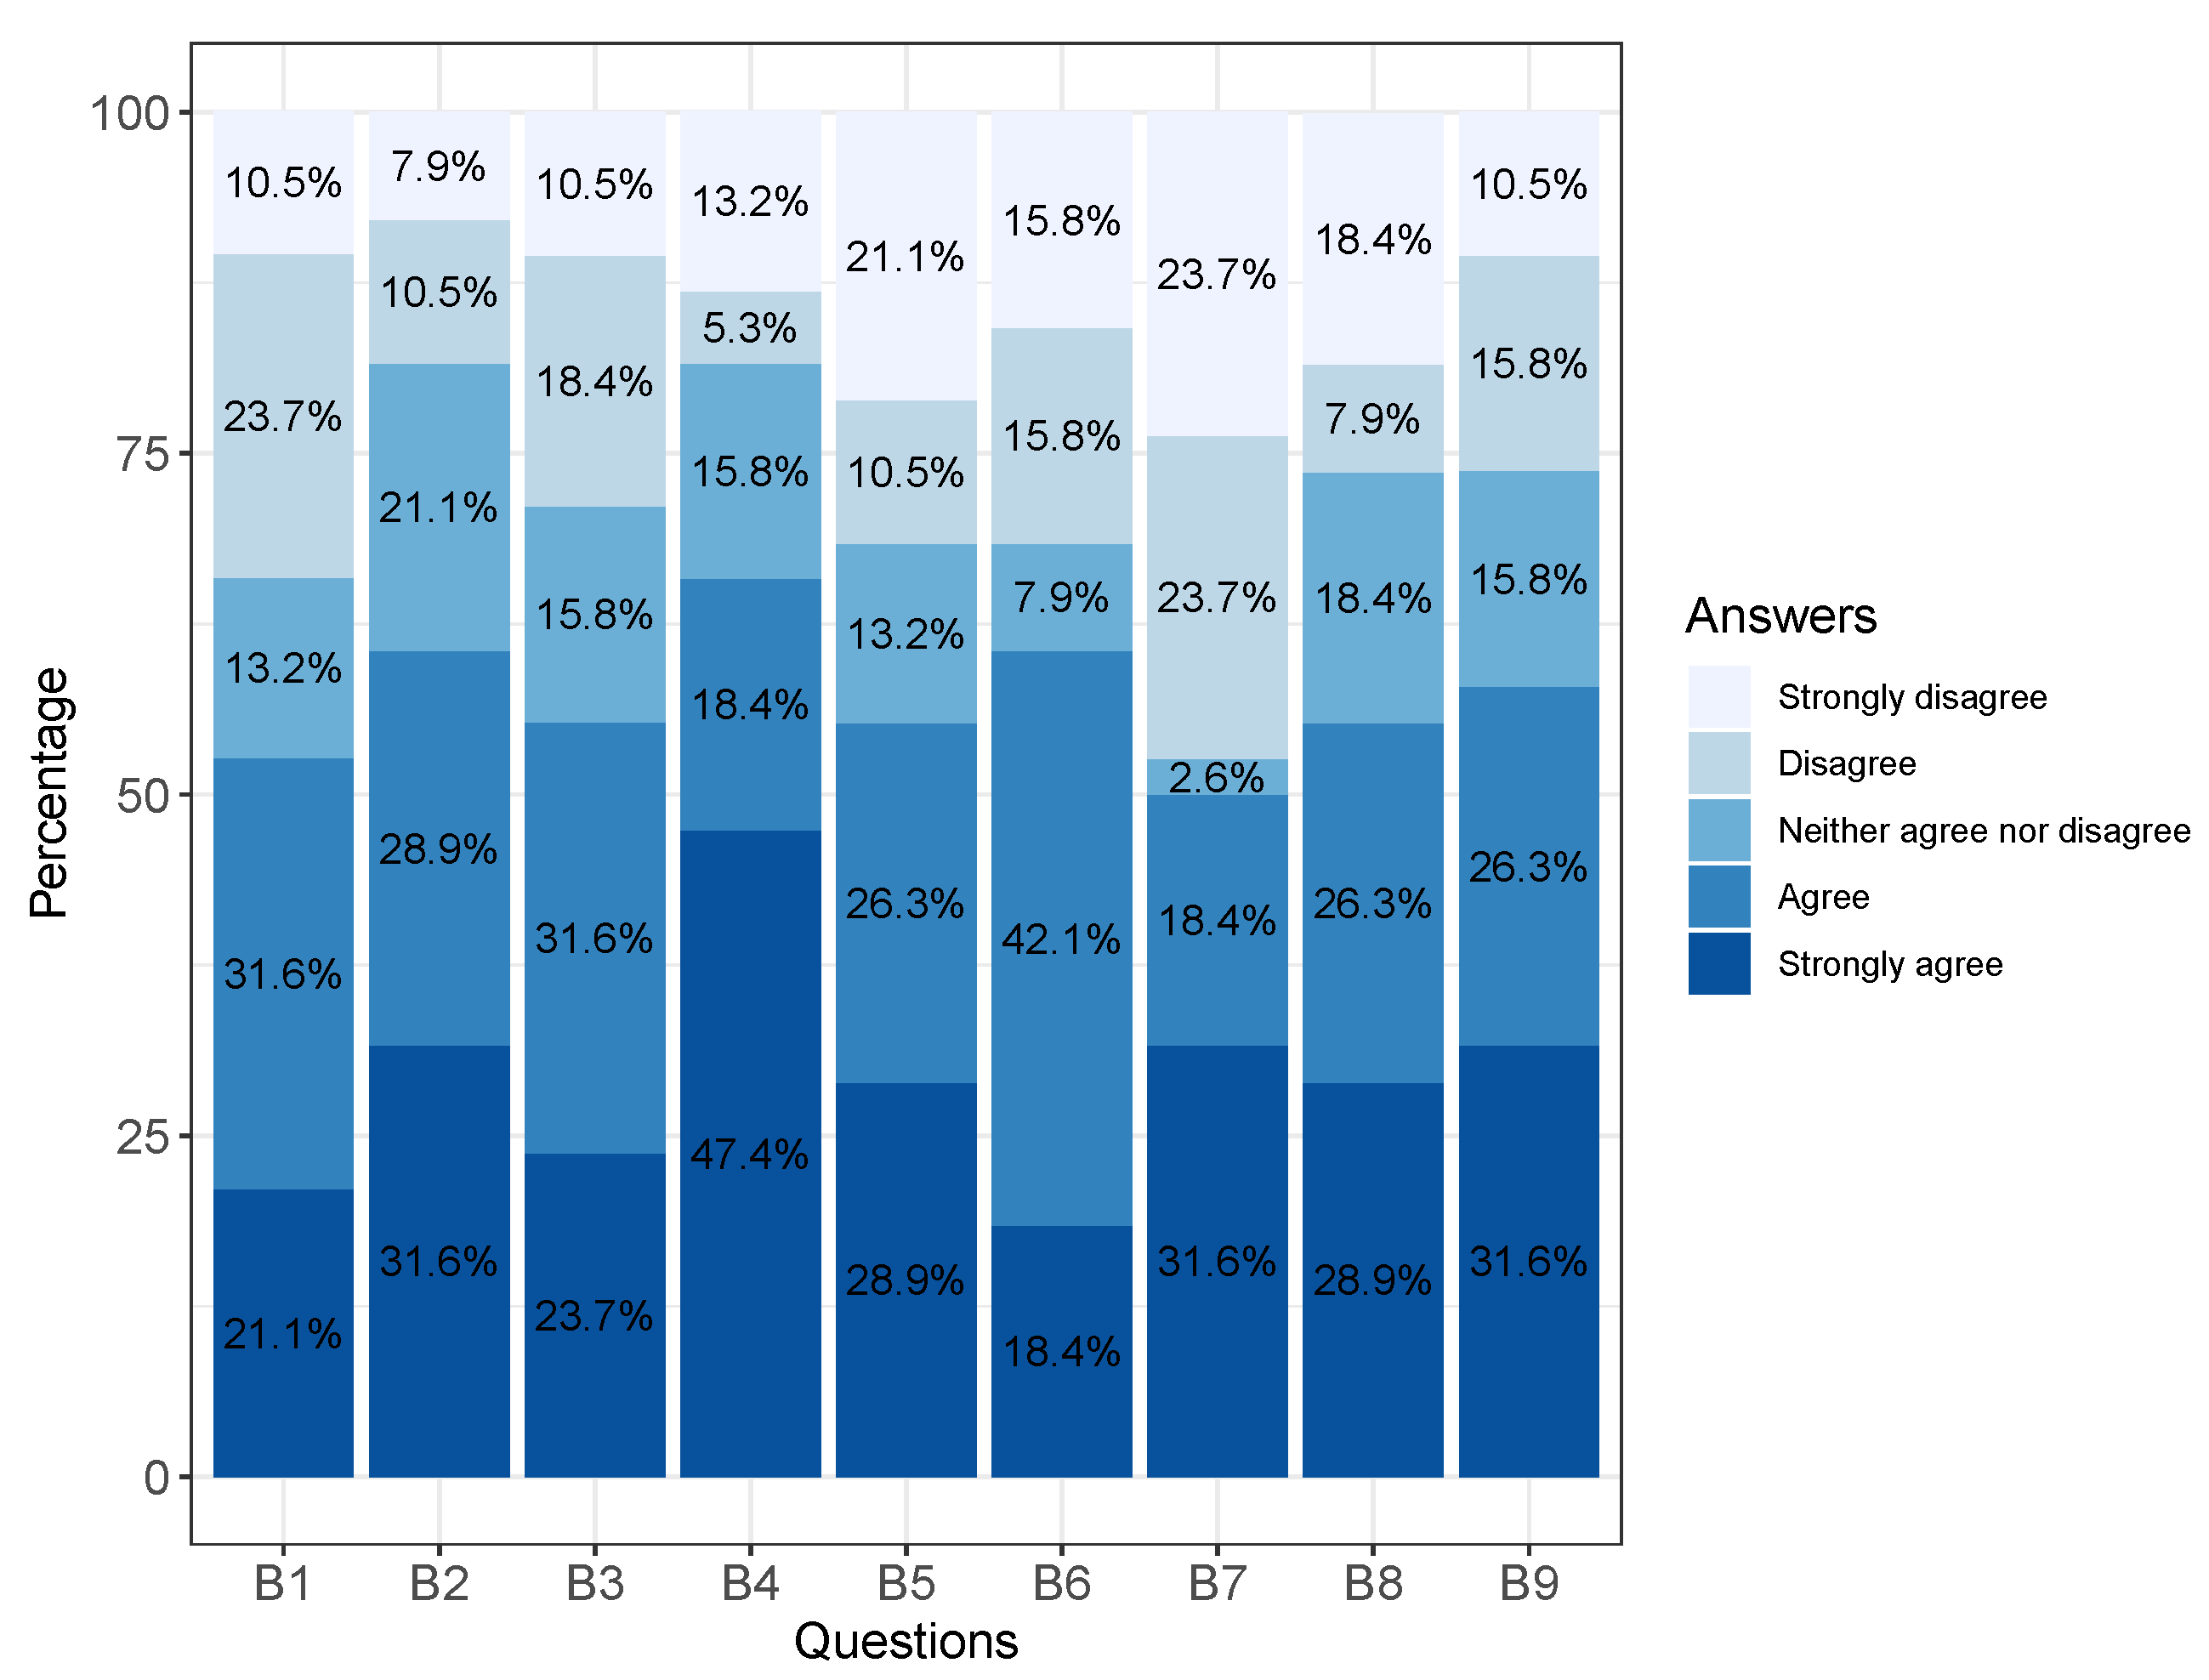
The objective of Q2 was to determine students’ satisfaction with Scratch tool and the impact it had on their learning.
Figure 3 summarizes the results of this survey. It can be seen that the highest percentage of disagreement corresponds to question B7 (related to the perception that it is necessary to have prior programming knowledge to work with Scratch). In contrast, the largest percentage of agreement is achieved for question B4 (related to students’ intention to attend courses and learn Scratch).
In general, the results of this satisfaction survey show a higher proportion of positive (strongly agree and agree) than negative responses (fisagree and strongly disagree). Considering that this was the first time that students used Scratch, in our opinion the results were positive.
Finally, we determined if there was a significant difference between the two groups in terms of students’ perceptions (questionnaire Q3) about the learning process in Fundamentals of Programming. The variables related to the students’ perceptions about degree of learning achievement, ease, enthusiasm, interest, applicability, motivation and qualification were taken into account.
Table 5 shows the descriptive summary for each item from questionnaire Q3. The lowest mean value is reported for item C1, indicating that most students feel they have not yet completed the subject matter. This result is understandable considering that the experiment took place during the first 8 weeks of the course. As a consequence, only basic programming concepts were taught.
Here, we also proceed with t-test for comparing both groups regarding the questionnaire Q3.
Table 6 shows that no significant difference exist for each question (
p-values > 0.05). With this result we can conclude that both groups valued the learning process in a similar way. Given these results, we believe that the work carried out by the teachers who took part in the experimental group was meritorious. Specifically, their achievement was that levels of satisfaction with the teaching-learning method were at the same level in both the experimental group and the control group (in which teachers had more experience in the methodology employed).
4.3. Effect of Learning with Scratch (RQ2)
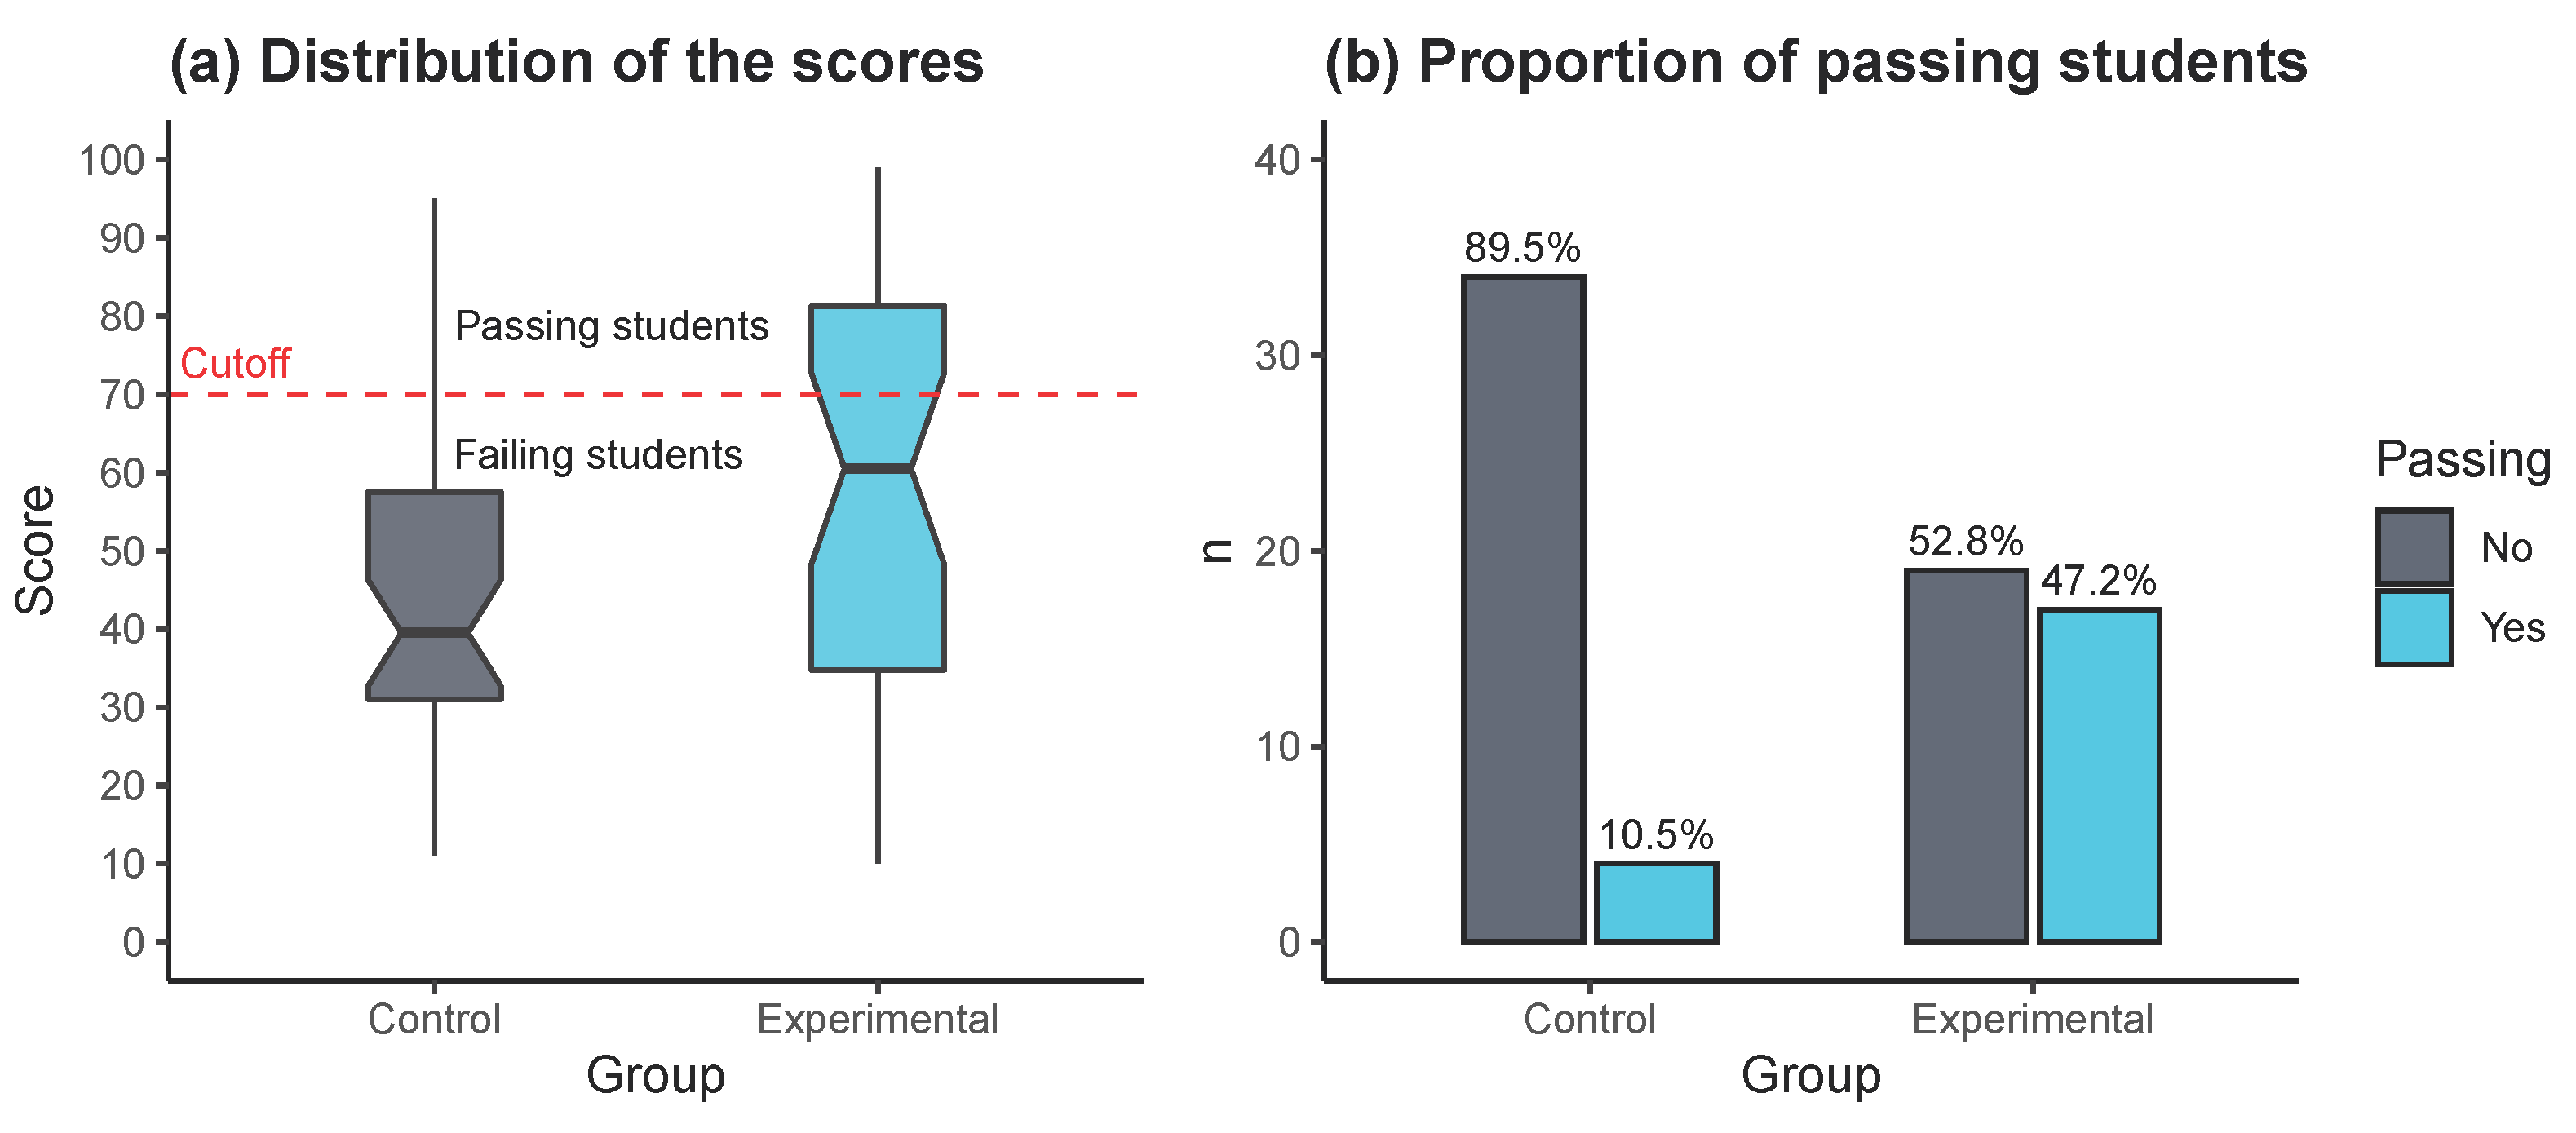
In this section, we report the results after presenting all the evaluations of the first midterm exam (after 8 weeks) regarding the students’ grades in the control group and the experimental group. In accordance with UNEMI regulations, the minimum grade to pass the course is 70.
Figure 4 summarizes the results achieved by both groups in the midterm exam. Specifically,
Figure 4a shows the score distribution through boxplots. In this case it can be observed that the control group has clearly inferior results compared to the experimental group. Notably, more than 75% of the students in the control group (quantiles 1, 2, and 3) achieve grades below the minimum necessary to pass (e.g., 70). This proportion is lower in the case of the experimental group. To complement this information, the bar chart in
Figure 4b indicates that the experimental group improves the proportion of passing students of the control group by a factor of 4, i.e., from 10.5% to 47.2%.
We confirmed these observed differences through a t-test for equality of means (
Table 7). Here, it is easy to see that the corresponding
p-value (=0.021) is less than 0.05, so the null hypothesis (equality of means) can be rejected.
To better understand which student characteristics explain their success or failure in the midterm exam, we have conducted a multivariate analysis. Due to the small sample size (There are very few cases (students) per level configuration in each predictor variable), it is more appropriate to rely on nonparametric techniques. Specifically, we fitted a decision tree [
30], in which the variables of questionnaire Q1 (e.g., age, gender, etc) were used as predictors of student success or failure. This success or failure has been modeled as dichotomous variable named Passing, so that a student with a score greater than or equal to 70 will be associated with Passing = Yes, while Passing = No, otherwise (e.g., the student fails).
Figure 5 illustrates the tree obtained, in which each node contains three pieces of information: the most probable value with respect to the Passing variable (i.e., No or Yes), the probability that Passing = Yes, and the proportion of cases (students) that would be covered up to that node.
From the structure of the decision tree it is observed that, before attending the programming classes, the probability of passing is 0.28, that is, regardless of whether students take the course with or without Scratch. However, if students are taught with Scratch (Group = Experimental), the probability increases to 0.47. In this case, having a grade higher than 9.1 in high school is associated with a probability of success of 0.73. Otherwise, if the grade is lower than 9.1, success depends on the type of education achieved by the student’s parents. If the parents have a primary education or less, or are university graduates, the probability of passing the subject is 0.60. Interestingly, the fact that the parents have a secondary or technical education is associated with a probability of passing 0.20. Finally, note that the probability of passing if learning without Scratch (Group = Control) is associated with a probability of 0.11. The latter is consistent with the results reflected in
Figure 4b where the pass rate for the control group case was 10.5%. Similarly, the probability of 0.47 associated with students being taught with Scratch is consistent with the pass rate in
Figure 4b, that is, 47.2%. Another important aspect of these results is that only three variables (e.g., Group, High school grades, and Parents’ education) were found to be relevant in explaining students’ success or failure in the midterm exam.
The confusion matrix listed in
Table 8 shows that the obtained decision tree has an accuracy of 0.811, 95% confidence interval
. From a one-side binomial test we found that the decision tree predicts better than chance (
p-value
). Besides, the MacNemar’s test
p-value was greater than 0.05 indicating that the proportion of misclassified cases is statistically the same for both classes (e.g., Passing = No and Passing = Yes).


 ,
, 


