Article

A Study on Persistence of GAN-Based Vision-Induced Gustatory Manipulation

1
Graduate School of Science and Technology, Nara Institute of Science and Technology, 8916-5 Takayamacho, Ikoma, Nara 630-0192, Japan
2
Graduate School of Interdisciplinary Information Studies, University of Tokyo, 7-3-1 Hongo, Bunkyo-ku, Tokyo 113-0033, Japan
3
Department of Informatics, The University of Electro-Communications, 1-5-1 Chofugaoka, Chofu, Tokyo 182-8585, Japan
4
Graduate School of Information Science and Technology, University of Tokyo, 7-3-1 Hongo, Bunkyo-ku, Tokyo 113-0033, Japan
*
Author to whom correspondence should be addressed.
Electronics 2021, 10(10), 1157; https://doi.org/10.3390/electronics10101157
Submission received: 5 February 2021 / Revised: 24 April 2021 / Accepted: 30 April 2021 / Published: 13 May 2021
(This article belongs to the Special Issue Recent Advances in Virtual Reality and Augmented Reality)

Abstract

:
Vision-induced gustatory manipulation interfaces can help people with dietary restrictions feel as if they are eating what they want by modulating the appearance of the alternative foods they are eating in reality. However, it is still unclear whether vision-induced gustatory change persists beyond a single bite, how the sensation changes over time, and how it varies among individuals from different cultural backgrounds. The present paper reports on a user study conducted to answer these questions using a generative adversarial network (GAN)-based real-time image-to-image translation system. In the user study, 16 participants were presented somen noodles or steamed rice through a video see-through head mounted display (HMD) both in two conditions; without or with visual modulation (somen noodles and steamed rice were translated into ramen noodles and curry and rice, respectively), and brought food to the mouth and tasted it five times with an interval of two minutes. The results of the experiments revealed that vision-induced gustatory manipulation is persistent in many participants. Their persistent gustatory changes are divided into three groups: those in which the intensity of the gustatory change gradually increased, those in which it gradually decreased, and those in which it did not fluctuate, each with about the same number of participants. Although the generalizability is limited due to the small population, it was also found that non-Japanese and male participants tended to perceive stronger gustatory manipulation compared to Japanese and female participants. We believe that our study deepens our understanding and insight into vision-induced gustatory manipulation and encourages further investigation.

1. Introduction

Eating is not only for maintaining life but also one of the greatest pleasures of life. Having the pleasure to eat whatever one’s heart’s desire is priceless, for example, a favorite dish or unusual ingredients. Yet, not everyone can have this pleasure. For a variety of reasons, some people cannot eat as they wish. Some are for health restrictions like diets and allergies, others for religious or moral restrictions. In these cases, quality of life (QoL) might be significantly affected [1,2].
On the other hand, it is well established that the flavors perceived as tastes are not driven solely by pure gustatory stimuli. It is understood that taste perception is affected by the integration and interaction of different senses; in other words, all of vision, hearing, olfaction, gustation and tactile perception interact to perceive taste [3,4]. We believe that manipulating food perception with cross-modal illusions produced by these senses on taste sensations will help people regain their appetite and eat with satisfaction and thus, improve their QoL.
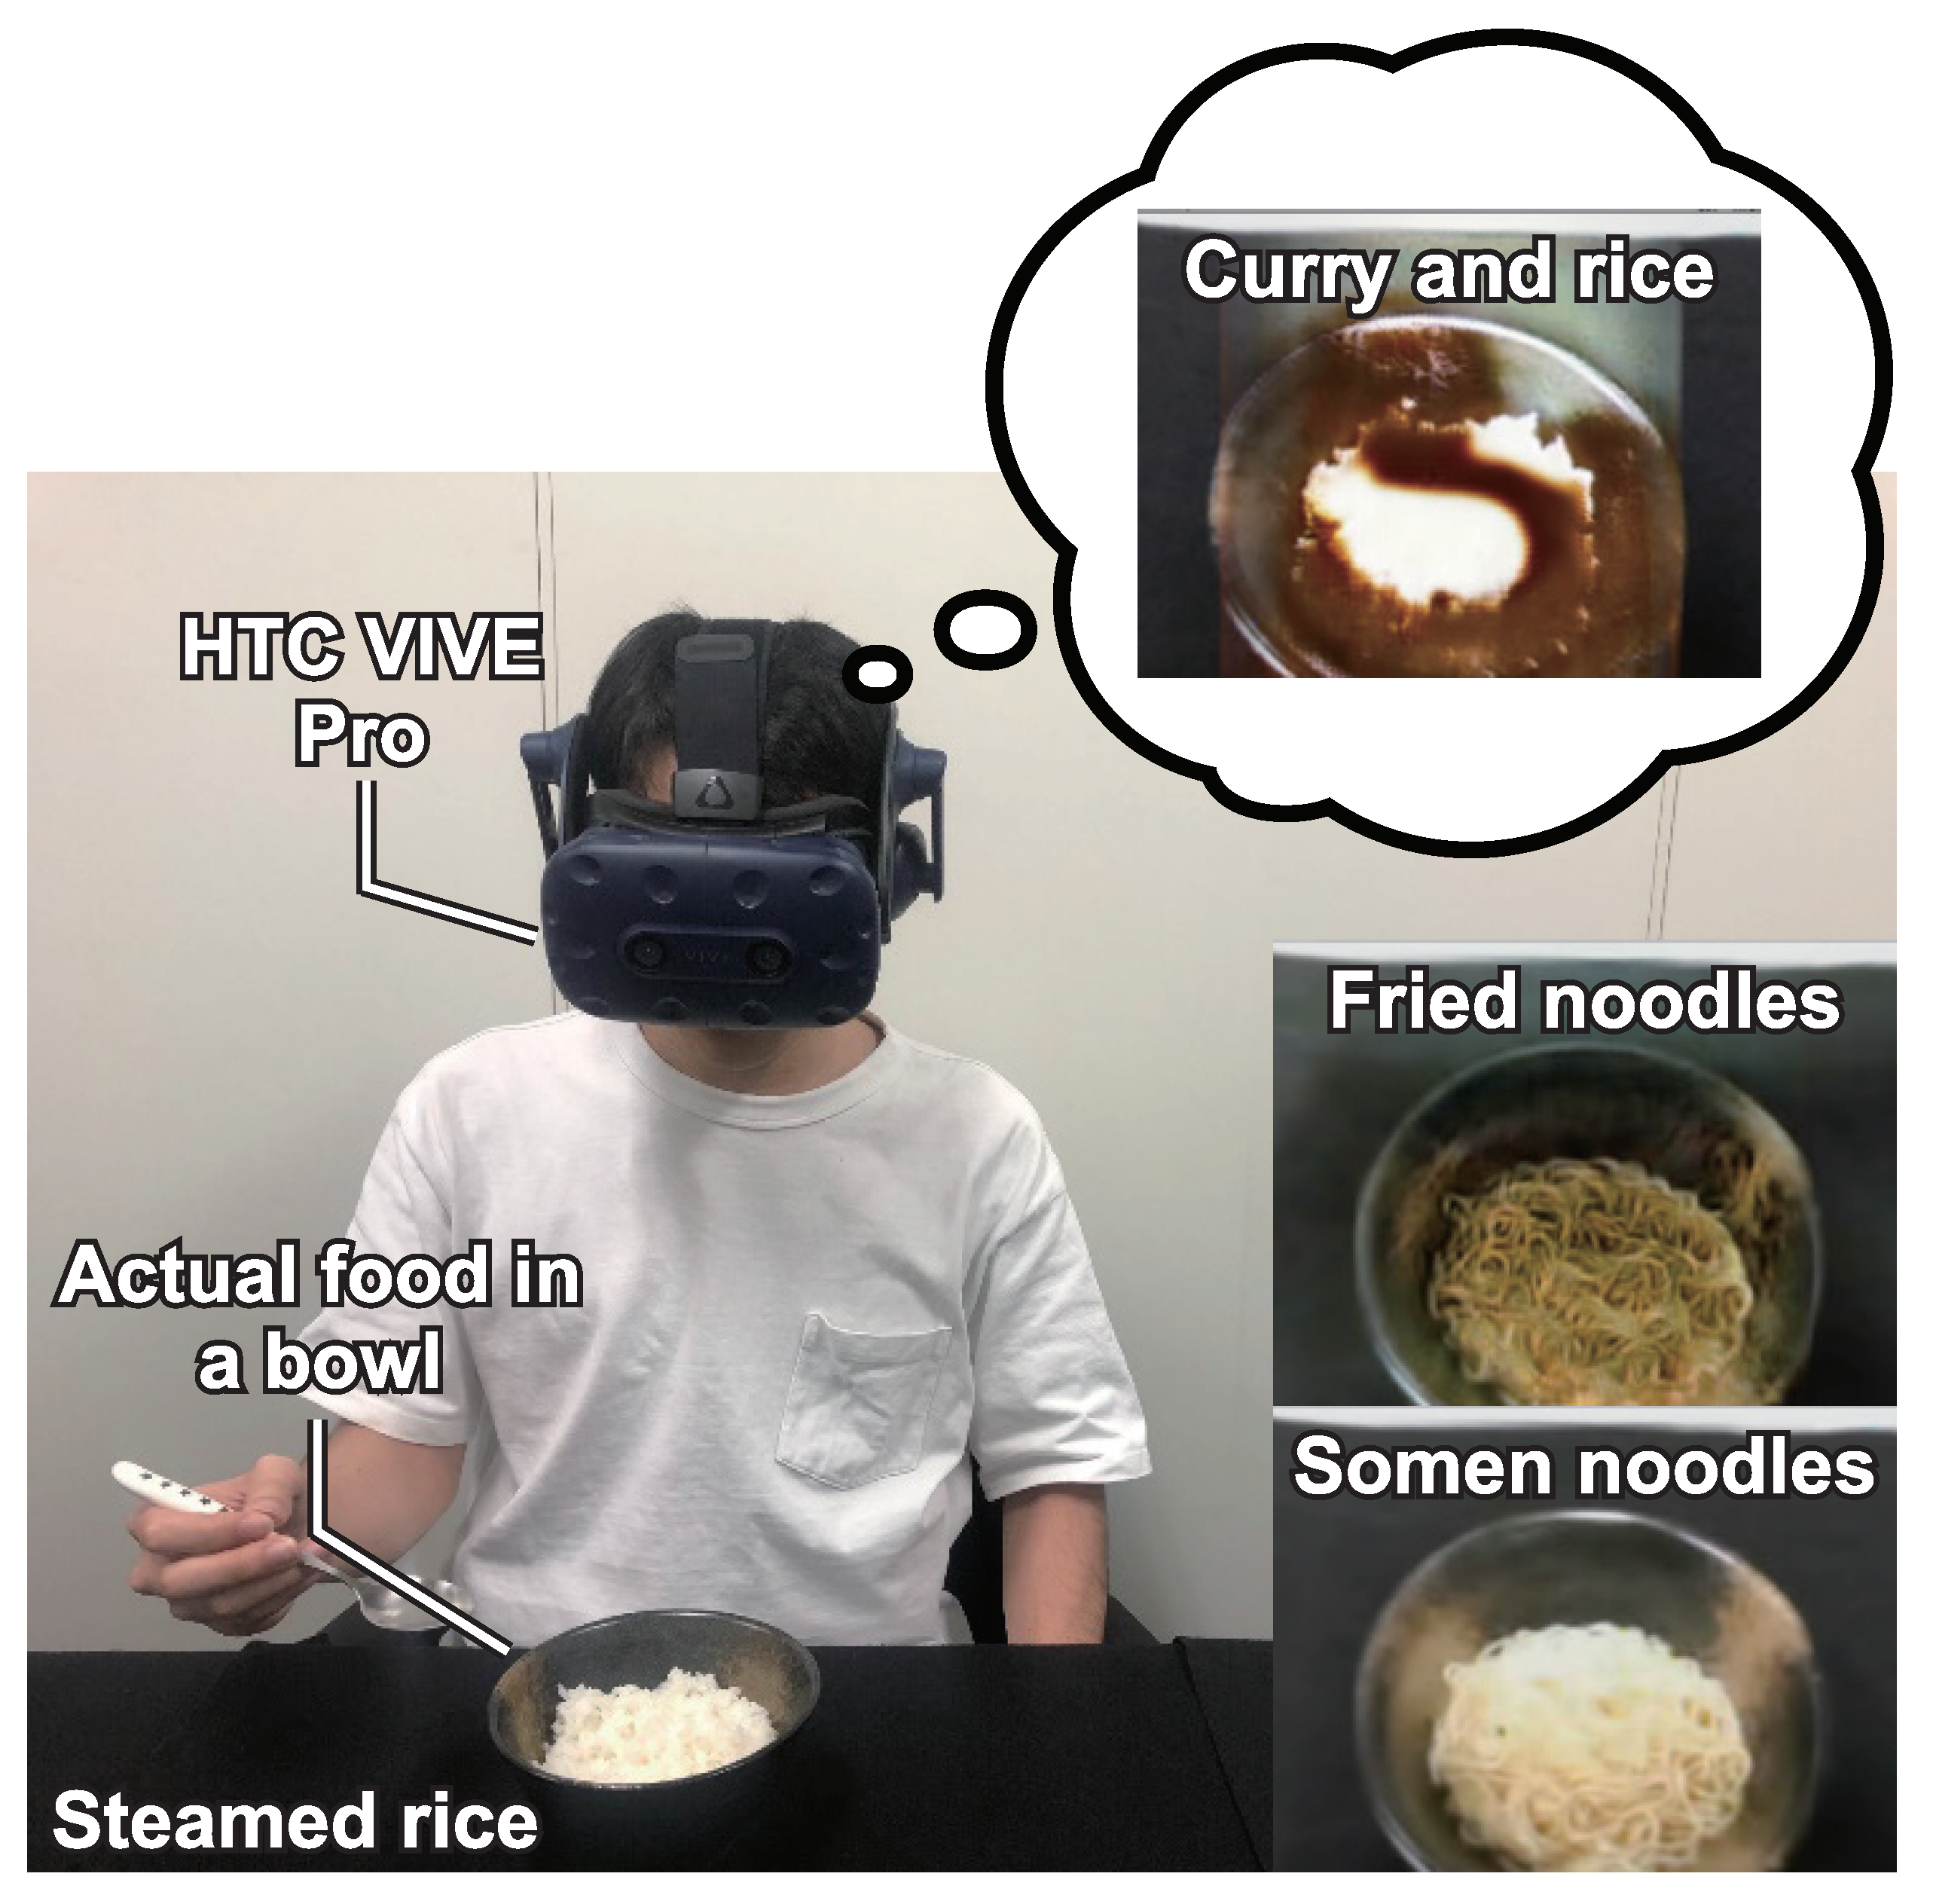
Current studies on how to manipulate gustation through vision involved mainly changing the texture or color pattern of a single type of food, for example, sushis or cookies, significantly limiting its applicability and flexibility [5,6]. To the best of our knowledge, no studies have investigated interactive systems that alter the appearance of one type of food into another, and more importantly, the impact of such a system on how food is experienced (see Figure 1). To fill this knowledge gap, we have been studying how to use augmented reality (AR) interfaces to manipulate the gustation and have reported on our manipulation interface using a generative adversarial network (GAN)-based real-time image-to-image translation [7].
In a previous study, we succeeded in changing the participants’ perception of the taste and type of food in the first or second bite they ate. On the other hand, it is not clear whether the gustatory change they experience lasts until they have eaten all their food (i.e., until the end of the meal). Some participants felt that eating food multiple times reduced the effects of gustatory modulation. We aim to improve their QoL by using gustatory manipulation systems to alter the taste of the alternative foods they are eating, giving them the sensation of eating what they want. If they use the vision-induced gustatory manipulation interface daily, the gustatory manipulation’s effect must last until their meal ends. However, despite its importance, there are no studies to our knowledge investigating the persistence of gustatory change using cross-modal illusions by visual modulation. Therefore, we measured the gustatory change from the first to the fifth bite and investigated vision-induced gustatory manipulation persistence. Note that in this paper, the term ‘bite’ is used to describe the series of actions from bringing a mouthful of food to the mouth, tasting it, and swallowing it. The biting or chewing actions themselves are not our focus of the study.
Besides, we also investigated “Would not seeing the original food before seeing the altered food affect the intensity of the gustatory manipulation, and how would it affect it?” and “Whether and how the intensity of the gustatory change differ depend on the participants’ cultural backgrounds (nationality and gender)” which had been problematic in previous studies. These contributions reveal that gustatory manipulation using visual modulation tends to be persistent for many users, indicating the potential for applications of gustatory manipulation interfaces.
The primary findings of the present paper are listed below.
  • Vision-induced gustatory manipulation is persistent in many participants for several times of a mouthful of food. Their persistent gustatory changes are divided into three groups: those in which the intensity of the gustatory change gradually increased, those in which it gradually decreased, and those in which it did not fluctuate, each with about the same number of participants.
  • Vision-induced gustatory manipulation is clearly present even when the original type of food was never shown to the participants directly without a head-mounted display (HMD).
  • Visually induced gustatory manipulation is affected differently depending on the participant’s attributes (gender and nationality). Still, those who are less familiar with the original and target types of food may have a stronger effect.

2. Related Work

Research has revealed that our sense of taste (gustatory sensations) is affected by gustatory stimuli and by the other senses [3]. For example, the flavor of food is heavily affected by signals from the taste buds associated with smell [8,9,10]. For example, Murphy and Cain reported that their experimental participants tasted ethyl acetate, a flavor component of peaches and pears, despite that it is actually tasteless [11]. However, they also reported that up to 80% of the taste disappeared when their nose was blocked. Stevenson et al. found that the sweet taste of sucrose increased and the sour taste of citric acid decreased when presented with the odor of sweet caramel [10]. Various gustatory displays make use of these multimodal and cross-modal effects of olfaction [5,12].
When eaten, the food texture also produces tactile and auditory sensations, and thus gustatory displays that make use of these sensations are emerging [13,14]. Besides, the sense of touch and the sense of hearing influence the sense of taste. As an example of the influence of touch on taste, Slocombe et al. reported that the acidity perceived by participants was stronger in rough foods than in smooth foods [15]. Iwata et al. have developed a food simulator as a gustatory manipulation interface that can reproduce food texture by measuring and reproducing the temporal changes in force when chewing food [14]. As for the effect of hearing on taste, Zampini and Spence found that when a high-pass filtered chewing sound or white noise was played in the ear while chewing deep-fried potato chips, the chips felt crispier and fresher [16]. Koizumi et al. developed Chewing Jockey as a gustatory manipulation interface based on this phenomenon [13]. Chewing Jockey successfully amplifies the crunchiness of potato chips, the thickness of cookies, and the stickiness of daifuku by processing the subject’s chewing sound and playing it back through earphones. In the field of electric taste, Miyashita developed gustatory displays that have been using ion electrophoresis to present tastes by individually suppressing the five basic tastes contained in five gels [17].
Vision is known to affect taste [18] as put by van der Laan et al. ‘The first taste is always with the eyes’ [19]. Additionally, visual modulation of food affects the perception of food types. Some studies have successfully changed how the flavor of food is perceived by altering its color [12,20,21,22,23,24]. For example, by changing the color of wine Morrot et al. demonstrated that they were able to make sommeliers believe that white wine tasted like red wine [21]. Narumi et al. used LEDs to color beverages and change the same flavored beverage to a different flavor [22]. Additionally, Ranasinghe et al. changed the perceived flavor of water in a cocktail glass by combining color, smell, and electrical taste stimuli to the water [12]. Zampini et al. conducted an experiment in which participants drank orange- and blackcurrant-flavored beverages that were colored in various ways and found that proper visual presentation with flavor-matching coloration helped them identify the taste accurately [20]. Piqueras-Fiszman et al. found that participants perceived the sweetness of strawberry-flavored mousse more strongly and preferred it more when eating it on a black plate than when using a white plate [23]. Shankar et al. [24] showed that the lower the degree of inconsistency between the participants’ expected flavor and the color combination of the beverage, the more it affected their perception. Besides, they showed that food perception manipulation could be performed even if participants are explicitly told that color is an uninformative cue. They know that they are eating visually altered food.
Besides the perception of taste, vision also influences the feeling of satiety. The feeling of satiety felt by the participant can be manipulated in several methods, e.g., changing the color of the cup [25], using a bowl that automatically and continuously refills with soup to prevent the food from visually diminishing [26], using the Delboeuf illusion to misrepresent the size of the food [27], using AR to change the size of food [28].
AR can also be used to change the type of food one is experiencing; this is done by superimposing a 3D model with food texture. By combining an olfactory display with a variety of cookie textures on top of plain cookies, Narumi et al. were able to transform the plain cookies into many different perceived flavors, for instance, chocolate [5]. Ueda and Okajima developed a gustatory manipulation interface (Magic Sushi) that uses machine learning to detect tuna sushi and change its appearance to salmon sushi, flatfish sushi, the medium fatty tuna, and the fattiest portion of tuna [6]. As a result, participants perceived more mouthfeel and oiliness in medium-fatty tuna and the fattiest portion of tuna sushi than tuna sushi. The studies mentioned above show that it is feasible to change the type of food that people believe they are consuming by altering its appearance. However, current studies on vision-induced gustatory manipulation have only experimented with a single type of food, such as cookies or sushi, considerably limiting its applicability and flexibility. To our knowledge, no studies on vision-induced gustatory manipulation have examined the effects between different types of food. Not much is known as to whether such manipulation is possible and to what extent.
We have previously reported a gustatory manipulation interface that changes the perception of taste and type of food through visual modulation using GAN [7]. By changing the appearance of somen noodles to ramen noodles and fried noodles and steamed rice to curry and rice and fried rice, we found that the participants felt they were eating the food presented visually. On the other hand, some participants reported decreased gustatory modulation after eating the food more than once. If the gustatory change of the vision-induced gustatory manipulation interface does not last but only occurs in the first bite, it is challenging to apply it to daily meals where a lasting gustatory change is necessary. To the best of our knowledge, no research focuses on gustatory change persistence using cross-modal illusions by visual modulation. In this study, we focused on the persistence of the gustatory change.
In the previous study, participants directly viewed the original food without modulation without wearing the HMD before the experiment. We hypothesize that looking only at the altered food without looking at the original one would reduce the belief about what they are eating, and thus the gustatory alteration effect would increase.
Besides, Wan et al. suggest that the formation of cross-modal associations to taste differ depending on cultural differences such as the nationality and gender of the participants [29]. For example, cultural differences in nationality affect the cross-modal correspondence between visual features and taste [29,30] and sound and taste [31]. The present study utilizes a cross-modal correspondence between food appearance and gustatory, but does the effect differ across cultures based on nationality and gender? In this study, in addition to the persistence of gustatory change, we investigated the effects of prior exposure to the specific food, nationality, and gender on the strength of gustatory change.

3. GAN-Based Real-Time Food-to-Food Translation System

In this section, we briefly introduce our GAN-based real-time food-to-food translation system [7]. Our system (see Figure 1 and Figure 2) performs inference by machine learning on food images captured from the front camera of the HMD, changes the appearance of the captured food images to that of different foods, and then superimposes them on the actual food using AR. The user eats while viewing the changed appearance of the food with the HMD, which generates a cross-modal effect by visual modulation and changes the user’s gustatory. For example, we can change the appearance of steamed rice into curry and rice and present the user with the sensation of eating curry and rice (see Figure 1). Our system has the following benefits specifically compared to a simpler gustatory manipulation system that overlays static 3D food models over the original food images. These characteristics contribute to its applicability, flexibility and ease of eating.
  • There is no occlusion of the original food or the user’s hand, differently from the 3D model-based system without a depth camera, because the input video is modulated while, to some extent, keeping its visual features.
  • Following the deformation of the input food, the target food’s depiction is dynamic and interactive.
  • Trained with several domains, the single GAN can simulataneously convert multiple domains of food.
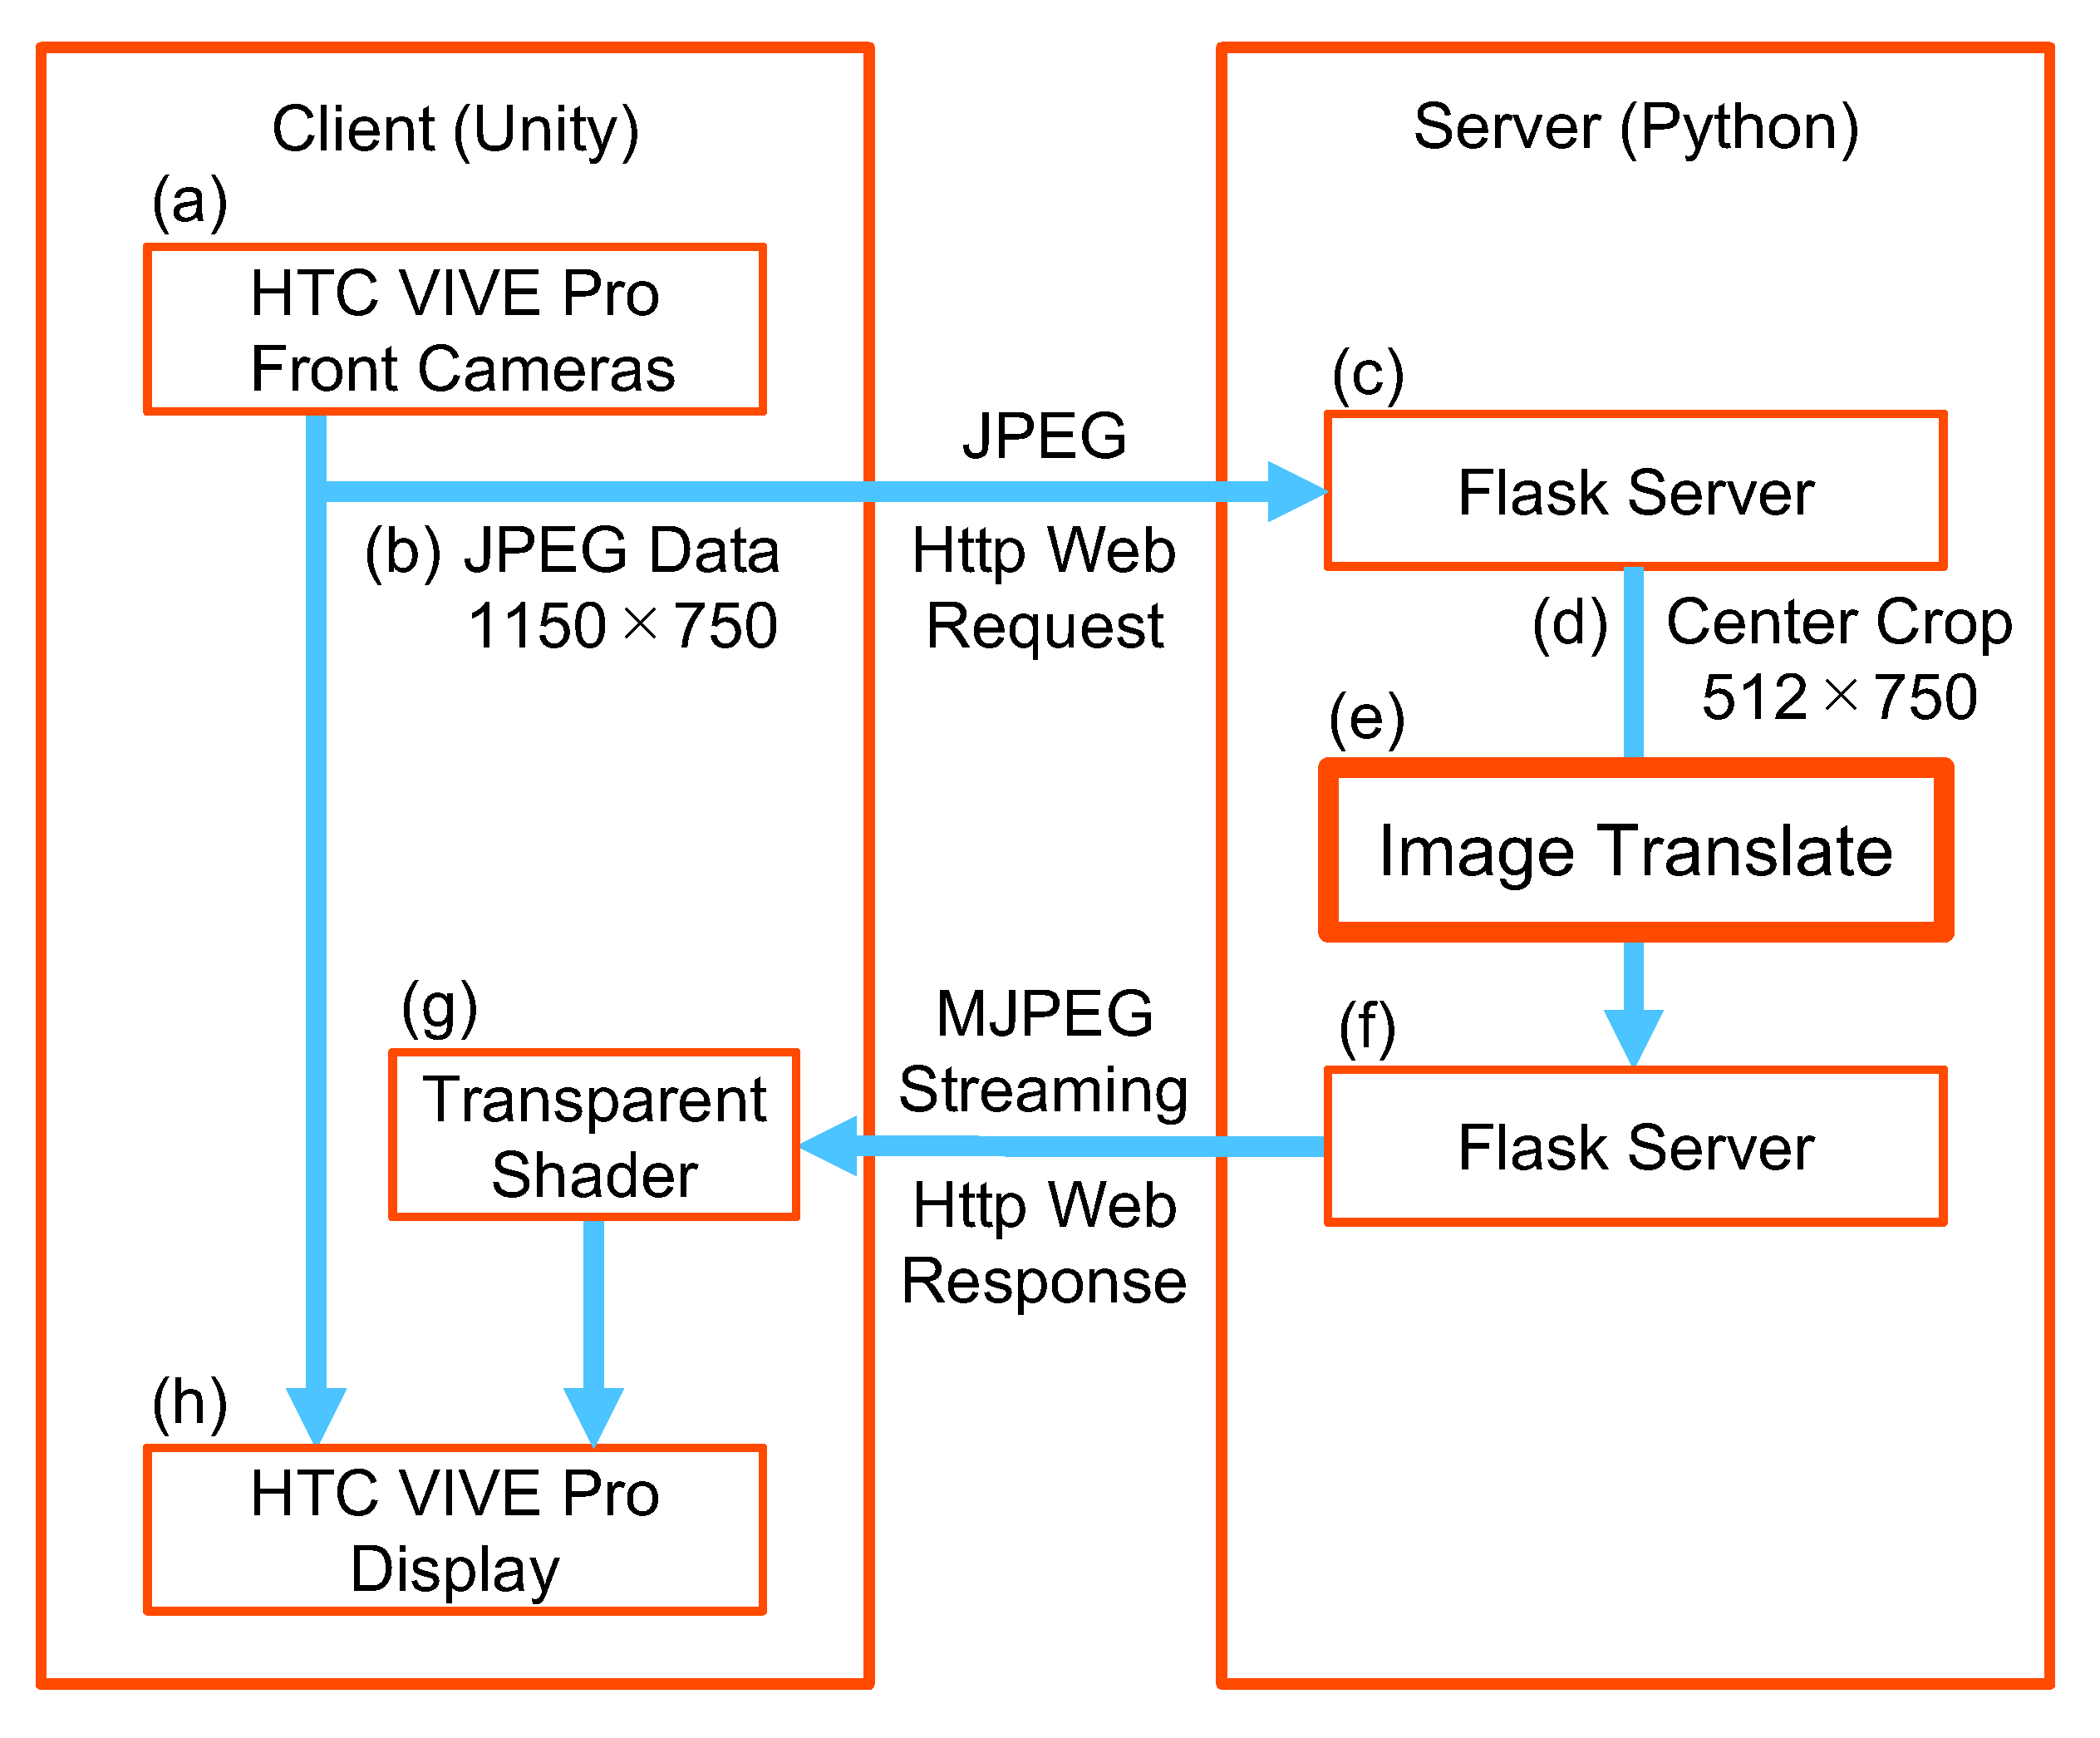
Our GAN-based food-to-food translation system consists of client and server modules. They run on different desktop computers (Client: Intel Core i7-8700 K, 3.70 GHz, 16 GB, NVIDIA GTX1080 × 2, Server: Intel Core i7-4790 K, 4.00 GHz, 16 GB, NVIDIA GTX1060) to maximize the overall performance. The Unity-based client module is responsible for the front-end of the user interaction. It first acquires an RGB image from a front camera of the video see-through HMD (HTC VIVE Pro), then sends it to the server module, overlays the processed image over the stereo video background, and presents the scene to the user via the HMD. The overall motion-to-photon latency was around 400 ms for the previous user study [7]. It was reduced to around 150 ms for the main experiment in this paper by optimizing the communication between the server and the client.
The back-end of the image conversion is handled by the Python-based server module. First, an RGB image is sent from the client to the server, then the image center is cropped and converted to another food image, and sent back to the client. The food image is converted by StarGAN [32] which was trained with a food image dataset based on UECFOOD-100 [33] and more images acquired from the Twitter stream. All the images were resized to 256 × 256 × 3 . In order to clean the dataset, VGG [34] was used to extract image features which were clustered by X-means. Unused classes and duplicate images were removed. In the end, we used 149,370 images in five categories (see Table 1).

4. Previous User Study

We previously conducted a user study to investigate the effectiveness of the GAN-based gustatory manipulation system [7] using two sets of food conditions; noodles and rice. 12 Japanese volunteers (10 males and two females) ranging in age from 21 to 39 participated in the user study. In the noodle conditions, they saw somen noodles through the HMD as they are, as ramen noodles, or as yakisoba (fried) noodles with visual modulation. In the rice conditions, they either saw white steamed rice as it is, curry and rice, or fried rice with visual modulation. In the noodle conditions, participants actually ate the original food (somen noodles) in three visually presented conditions (somen noodles (no conversion), ramen noodles, and fried noodles) and answered a questionnaire about how they perceived the taste and type of food. We also carried out similar experiments on the rice conditions (steamed rice (no conversion), curry and rice, and fried rice) for a total of six different conditions. We found that the participants clearly perceived a change in the perception of the food type and the taste felt for the food presented by the visual modulation.
The previous user study has shown that visual modulation tends to decrease the taste of the original food and increase that of visually presented food. Additionally, in the noodle conditions, the amount of change in taste of food was more significant for fried noodles than for ramen noodles, and in the rice conditions, the amount of change in taste of food tended to be greater for curry and rice than for fried rice. However, several questions arose as follows, which motivated us to conduct the follow-up user study reported in the next sections.
  • Participants had only two bites of the food at once per condition. Will the vision-induced gustatory manipulation persist for a longer period, and if yes, how?
  • Participants saw the original type of food directly without the HMD before actually tasted the food with visual modulation, which may have biased the experimental results. Will the results be different if the participants only see the altered food through the HMD?
  • Participants were all Japanese. All the tested types of food are common in Japan but much less common outside Japan. Will we see any cultural differences between Japanese and non-Japanese participants?
  • Participants were mostly males. Will we see any gender differences in the gustatory manipulation with a larger population of male and female participants?

5. Experiment

5.1. Overview

The purpose of the experiment is to investigate the effectiveness of the GAN-based gustatory manipulation system from the following perspectives.
  • Whether and how the gustatory manipulation persists while eating the modulated food.
  • Whether and how not seeing the original food before seeing the modulated food affects the strength of the perceived gustatory of the modulated food.
  • Whether and how the results depend on the participants’ nationality and gender.
For the experiment, we reduced the actual and apparent motion-to-photon latency in the gustatory manipulation system. The actual latency was reduced from around 400 ms [7] to around 150 ms by using a single PC to reduce the communication delay. The apparent latency (registration error) was further reduced by around 87% by implementing AR Timewarping [35].

5.2. Procedure

Figure 3 shows a participant in the experiment. The food was served in a black bowl with red chopsticks or a spoon on a black table in a quiet room with white walls for stable visual modulation. We confirmed that each participant was healthy and not too full or hungry. They wore the HMD and looked at either the original or the modulated food for three minutes to get used to the system and the viewing experience. Then, they were asked to tell what food they observed before eating. We told them the correct food type, and they answered whether or not it appeared so. Then, they took some water and a bite of the food, and answered the questions.
The questionnaire was displayed on the HMD so that participants could answer the questions through the HMD. They repeated the procedure five times with an interval of 120 s per condition (about 60 s for eating and answering, respectively) and finally removed the HMD.
As the number of trials increases, we reduced the number of food conditions from six [7] to four by removing the ramen noodles (Rn) and fried rice (Fr) conditions as they were less effective in the previous study compared to the fried noodles (Fn) and curry and rice (Cr) conditions, respectively. Each participant performed all four conditions in a single day, either the noodle conditions (Sn, Fn) first or the rice conditions (Sr, Cr) first in a randomized order.
Following our previous study, the questionnaire consisted of the four questions below on a VAS (visual analog scale) (0 and 100 being ‘strongly disagree’ and ‘strongly agree’, respectively) [36]. Q1 and Q2 were about taste perception and Q3 and Q4 were about food recognition.
Q1. 
It tasted like somen noodles (or steamed rice).
Q2. 
It tasted like fried noodles (or curry and rice).
Q3. 
It felt like I was eating somen noodles (or steamed rice).
Q4. 
It felt like I was eating fried noodles (or curry and rice).

6. Results and Discussions

6.1. Overview

A total of 16 volunteers (eight males with an average age of 24.1 and eight females with an average age of 31.5 ranging from 22 to 49) participated in the experiment. None of them had previously tried our AR gustatory manipulation system. They were briefed about the procedure and its purpose orally and agreed to it. The institutional review board approved the experiment. The participants were eight Japanese and eight non-Japanese (two French, two Thai, one Chinese, one German, one Korean, and one Egyptian) recruited from our university. The participants had eaten all of the four types of food used in the experiment before the experiment. In the following, we give the results and discussion for the noodle and rice conditions in order. We performed a three-way ANOVA followed by a post hoc analysis with the Holm–Bonferroni correction throughout the experiment. As our data were not normally distributed, we employed the aligned rank transform procedure for hypothesis testing [37]. However, it should be noted that the number of participants participating in this study was by no means large, and the experimental results should be associated with the individual differences. Nevertheless, we believe the experimental results will give interesting insights.

6.2. Noodle Conditions

6.2.1. Results

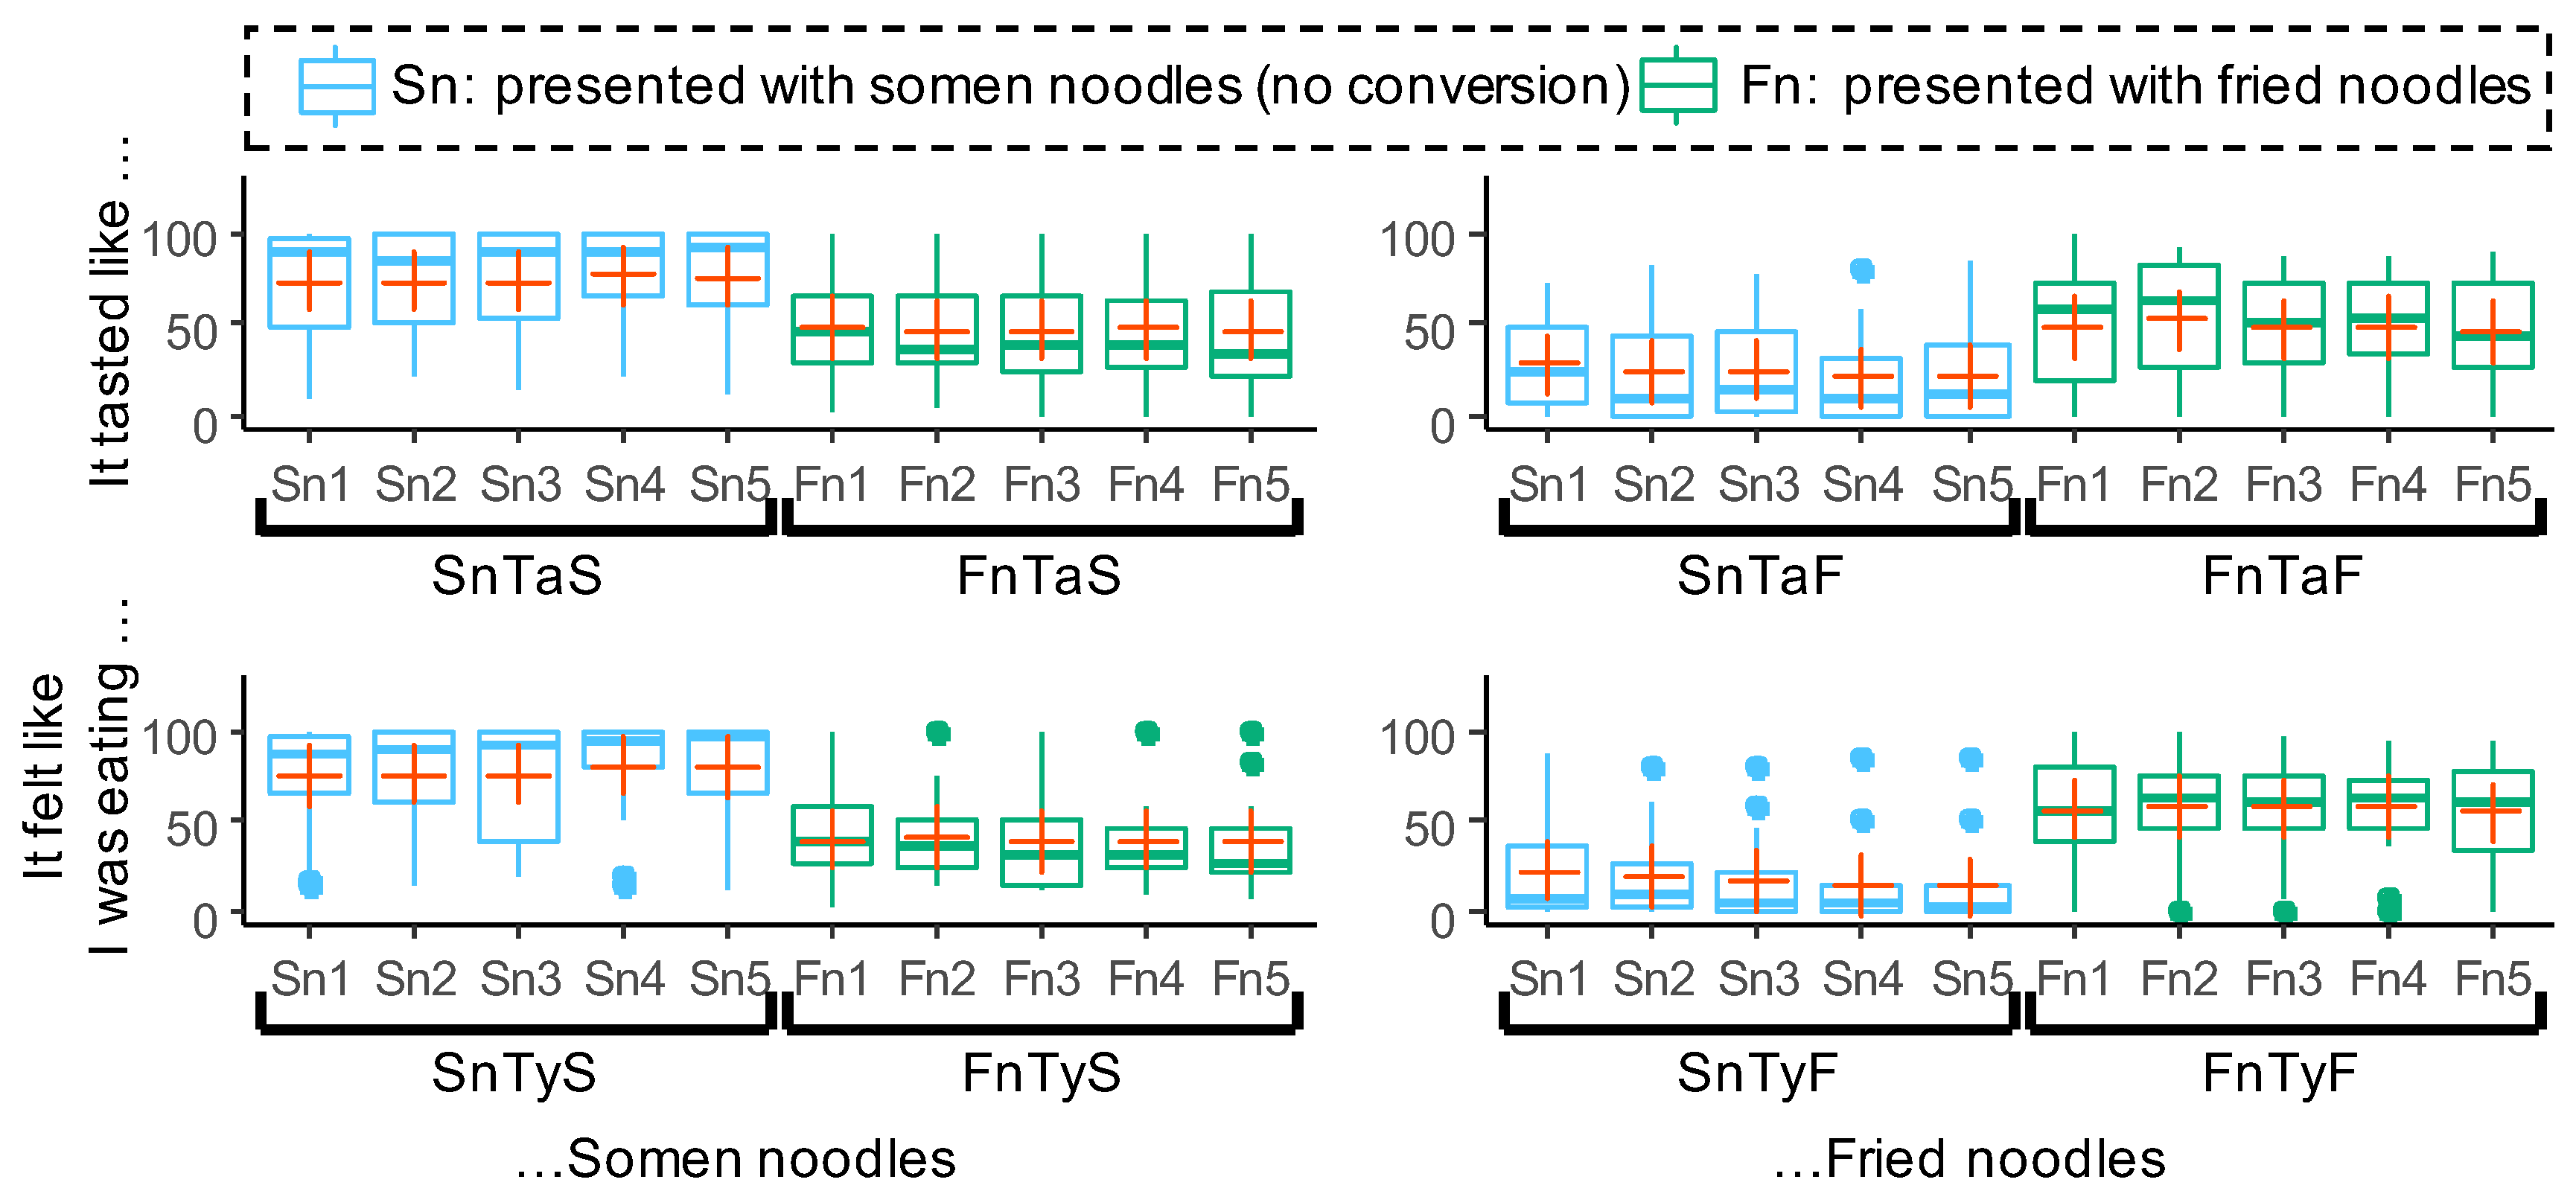
The results of the noodle conditions are shown in Figure 4. The results for Q1 and Q2, and Q3 and Q4, are shown in the box plots in the upper and lower rows, respectively. SnTaF in Figure 4 denotes, for example, the intensity of the perceived taste of fried noodles when somen noodles were presented visually (the visual modulation condition Sn). Additionally, FnTyS in Figure 4 denotes the intensity of the perceived type of somen noodles when fried noodles were presented visually (the visual modulation condition Fn). Sni denotes the result for the i-th bite showing the persistency trend.
Paired t-tests between Sn1 and Fn1 found significant differences for all groups ( p < 0.01 for SnTaS and FnTaS, p < 0.05 for SnTaF and FnTaF, p < 0.001 for SnTyS and FnTyS, and p < 0.01 for SnTyF and FnTyF). For example, in the upper left graph of Figure 4, which shows the results for “It tasted like somen noodles”, Fn1 is lower than Sn1. This means that the visual modulation changed the food’s appearance from the original somen noodles into fried noodles, and the taste of the original food, somen noodles, was more weakly perceived. In the upper right graph of Figure 4, which shows the result of “It tasted like fried noodles”, Fn1 is higher than Sn1. This means that the visual modulation changed the food’s appearance into that of fried noodles and the taste of fried noodles was more strongly perceived. These visual modulation trends decreasing the taste of the original food and increasing the taste of the visually presented food are similar to the previous studies. Additionally, the lower graphs of Figure 4, which correspond to the results of “It felt like I was eating somen noodles” and “It felt like I was eating fried noodles”, show more significant differences between Sn1 and Fn1 compared to the upper graphs. The results are similar to those of the previous studies, showing that vision-induced gustatory manipulation is more effective in changing participant’s perception of the food that they are eating than changing their perception of taste. Similarly to the previous user study, gustatory manipulation is clearly present in the noodle conditions.
Table 2 shows the number of participants whose VAS scores have changed by 10 points or more between the first and fifth bites under the noodle conditions. We call the groups with increasing and decreasing scores Up and Down, respectively, and the group with little changing scores Stay. Figure 5 shows the relative change in VAS scores from the first bite to the fifth bite in each participant’s noodle conditions, with the first bite as the baseline. The results for each participant were categorized as Up, Down, and Stay according to Table 2. Our hypothesis was that “the cross-modal effect would decrease as the number of bites increased, and participants would feel more strongly that they were eating the original food.” For example, the values of SnTaS and FnTaS were expected to increase as the number of bites increases, while the values of SnTaF and FnTaF were expected to decrease.
Table 3 and Table 4 show the results of ANOVA for Q1 to Q4 for each type of the noodles. Here, the interactions of “Persistency: Nationality”, “Persistency: Gender” and “Persistency: Nationality: Gender” are omitted in the tables because there was no significant difference. Significant differences are indicated with symbols (*** for p < 0.001 , ** for p < 0.01 , * for p < 0.05 , and + for p < 0.1 ). Figure 6 and Figure 7 show the results of nationality and gender differences. If the score for “It tasted like somen noodles” was lower for Fn than Sn, and the score for “It tasted like fried noodles” was higher for Fn than Sn, the effect of visual modulation was stronger. For example, if the values of SnTaS and FnTaF were large and the values of SnTaF and FnTaS were small in Figure 6, the effect of visual modulation was considered to be strong.

6.2.2. Discussion

Figure 4 shows the same tendency as the results of the noodle conditions in the previous study: visual modulation decreases the taste of the original food and increases the taste of the visually presented food. However, in Figure 4, SnTaF and SnTyF showed higher scores than those in the previous study, which were close to zero, indicating that some participants felt that the food they were eating was fried noodles even under the somen noodle condition. A possible cause for this problem is that some participants experienced the Fn condition before the Sn condition (without knowing what the original food was), which have affected the gustatory sensation. However, when presented with somen noodles, the Up group is larger than the Down group in SnTaS and SnTyS, and the Down group is larger than the Up group in SnTaF and SnTyF in Table 2 and Figure 5. This appears to mean that the participants gradually became more confident that they were eating somen noodles when visually presented with somen noodles.
No significant difference was found in all conditions on persistency in Table 3 and Table 4 suggesting that the gustatory manipulation persists to some extent for a longer period of time. On the other hand, as can be read from Table 2, we could confirm that some participants’ taste perceptions changed between the first and fifth bites. Focusing on FnTaF and FnTyF, which were the plausibility of the perceived taste and the recognized food type as fried noodles when visually presented with fried noodles, nearly the same number of the participants are classified into Up and Down groups, leaving the similar number of participants whose scores did not change much.
Additionally, Figure 5 shows that there were more participants in Up groups in SnTaS and SnTyS and more in Down groups in SnTaF and SnTyF with larger changes. These results indicated that even if the participants initially misidentified that they were eating fried noodles, they tended to recognize that they were eating somen noodles as the number of bites increased. In other words, it supported the hypothesis that “the cross-modal effect would decrease as the number of bites increased, and people would feel more strongly that they were eating the original food.” On the other hand, FnTaS, FnTyS, FnTaF, and FnTyF in the Fn conditions had similar participant numbers in the Up, Stay, and Down groups, confirming that they were near evenly distributed. In particular, it is important to note that the Down groups in FnTaS, FnTyS, FnTaF and FnTyF differed from the trend in the Sn conditions in that there were also similar number of participants in the opposite (Up) groups. In other words, a non-negligible number of participants felt that they were eating fried noodles with a stronger confidence as the number of bites increased. These results differ from the hypothesis and indicate that the cross-modal effect of visual modulation was increased by multiple bites for some individuals.
We considered that the temporal change of the vision-induced gustatory manipulation effect varied between individuals. From these results, we could confirm that vision-induced gustatory manipulation was persistent in many participants. Their persistent gustatory changes were divided into three groups: those in which the intensity of the gustatory change gradually increased, those in which it gradually decreased, and those in which it did not fluctuate, each with about the same number of participants.
Next, we investigate evaluation scores in terms of nationality and gender. From Table 3 and Table 4, we could confirm significant differences and trends toward significance in many groups. Looking at the nationality rows in Figure 6 and Figure 7, the international participants felt the stronger taste of somen noodles when visually presented with somen noodles than the Japanese participants (SnTaS and SnTyS). We believe that this is because the foreign participants did not have much experience with somen noodles, and they may not have been confident in the taste of somen noodles. Note that the somen noodles used in this experiment were served not with typical cold soup but with warm soup. We adopted a ready-made instant noodle product with warm soup to make it consistent with hot fried noodles in this experiment. Somen noodles served with warm soup is sometimes called nyumen and common in many regions in Japan even though it is slightly less common than those with cold soup. We used the name “somen noodles” in this experiment because the product we used is named so. It is also defined as “somen noodles” in the “Quality Labeling Standards for Dried Noodles (Quality Labeling Standards for Dried Noodles, https://www.caa.go.jp/policies/policy/food_labeling/quality/quality_labelling_standard/pdf/kijun_25_110930.pdf, last accessed on 15 April 2021.) ” established by the Consumer Affairs Agency of Japan. The Japanese participants have felt like they were eating fried noodles more strongly than the international participants under the Sn condition (SnTaF and SnTyF). We believe that this is because they did not feel like they were eating (typical cold) somen noodles.
Besides, the international participants felt the stronger taste of fried noodles when visually presented with fried noodles than the Japanese participants (FnTaF and FnTyF). Again, we believe that this is because the international participants had little experience of eating fried noodles and had a narrower range of expectations about the taste of fried noodles. Looking at the gender rows of Figure 6 and Figure 7, the female participants felt the stronger taste of somen noodles when visually presented with somen noodles (SnTaS and SnTyS) and the weaker taste of fried noodles when visually presented with fried noodles (FnTaF) than the male participants. We believe that this result suggests that cultural differences such as cooking experience and average age (24.1 for males vs. 30.5 for females) affected the formation of cross-modal associations with taste [29]. However, in the Fn condition (FnTyF), there was no significant difference in the change in food type between the female and male groups. This result suggests little difference between men and women in the perception of food types after visual modulation. Despite these statistically significant differences, we have to also note that the generalizability of our findings is limited due to the small number of participants.

6.3. Rice Conditions

6.3.1. Results

Figure 8 shows the results of the rice conditions. The box plots in the upper and lower rows correspond to the results for Q1 and Q2, and Q3 and Q4, respectively. For example, in Figure 8, SrTaC denotes the strength of the perceived taste of curry and rice when visually presented with steamed rice (the visual modulation condition Sr). Additionally, in Figure 8, CrTyS denotes the strength of the perceived type of steamed rice when visually presented with curry and rice (the visual modulation condition Cr). Paired t-tests between Sr1 and Cr1 found significant differences for all groups ( p < 0.05 for SrTaS and CrTaS, p < 0.05 for SrTaC and CrTaC, p < 0.001 for SrTyS and CrTyS, and p < 0.001 for SrTyC and CrTyC). For example, in the upper left graph of Figure 8, which shows the results for “It tasted like steamed rice”, Cr1 is lower than Sr1. This means that the visual modulation changed the food’s appearance from the original steamed rice into curry and rice, and the taste of the original food, steamed rice, was more weakly perceived. In the upper right graph of Figure 8, which shows the result of “It tasted like curry and rice”, Cr1 is higher than Sr1. This means that the visual modulation changed the food’s appearance into that of curry and rice and the taste of curry and rice was more strongly perceived. These visual modulation trends decreasing the taste of the original food and increasing the taste of the visually presented food are similar to the findings of the previous study and the noodle conditions above. Additionally, the lower graphs of Figure 8, which correspond to the results of “It felt like I was eating steamed rice” and “It felt like I was eating curry and rice”, show more significant differences between Sr1 and Cr1 compared to the upper graphs. The results are similar to those of the previous study and the noodle conditions above, showing that vision-induced gustatory manipulation is more effective in changing participant’s perception of the food that they are eating than changing their perception of taste. Similarly to the previous user study, gustatory manipulation is clearly present in the rice conditions as well.
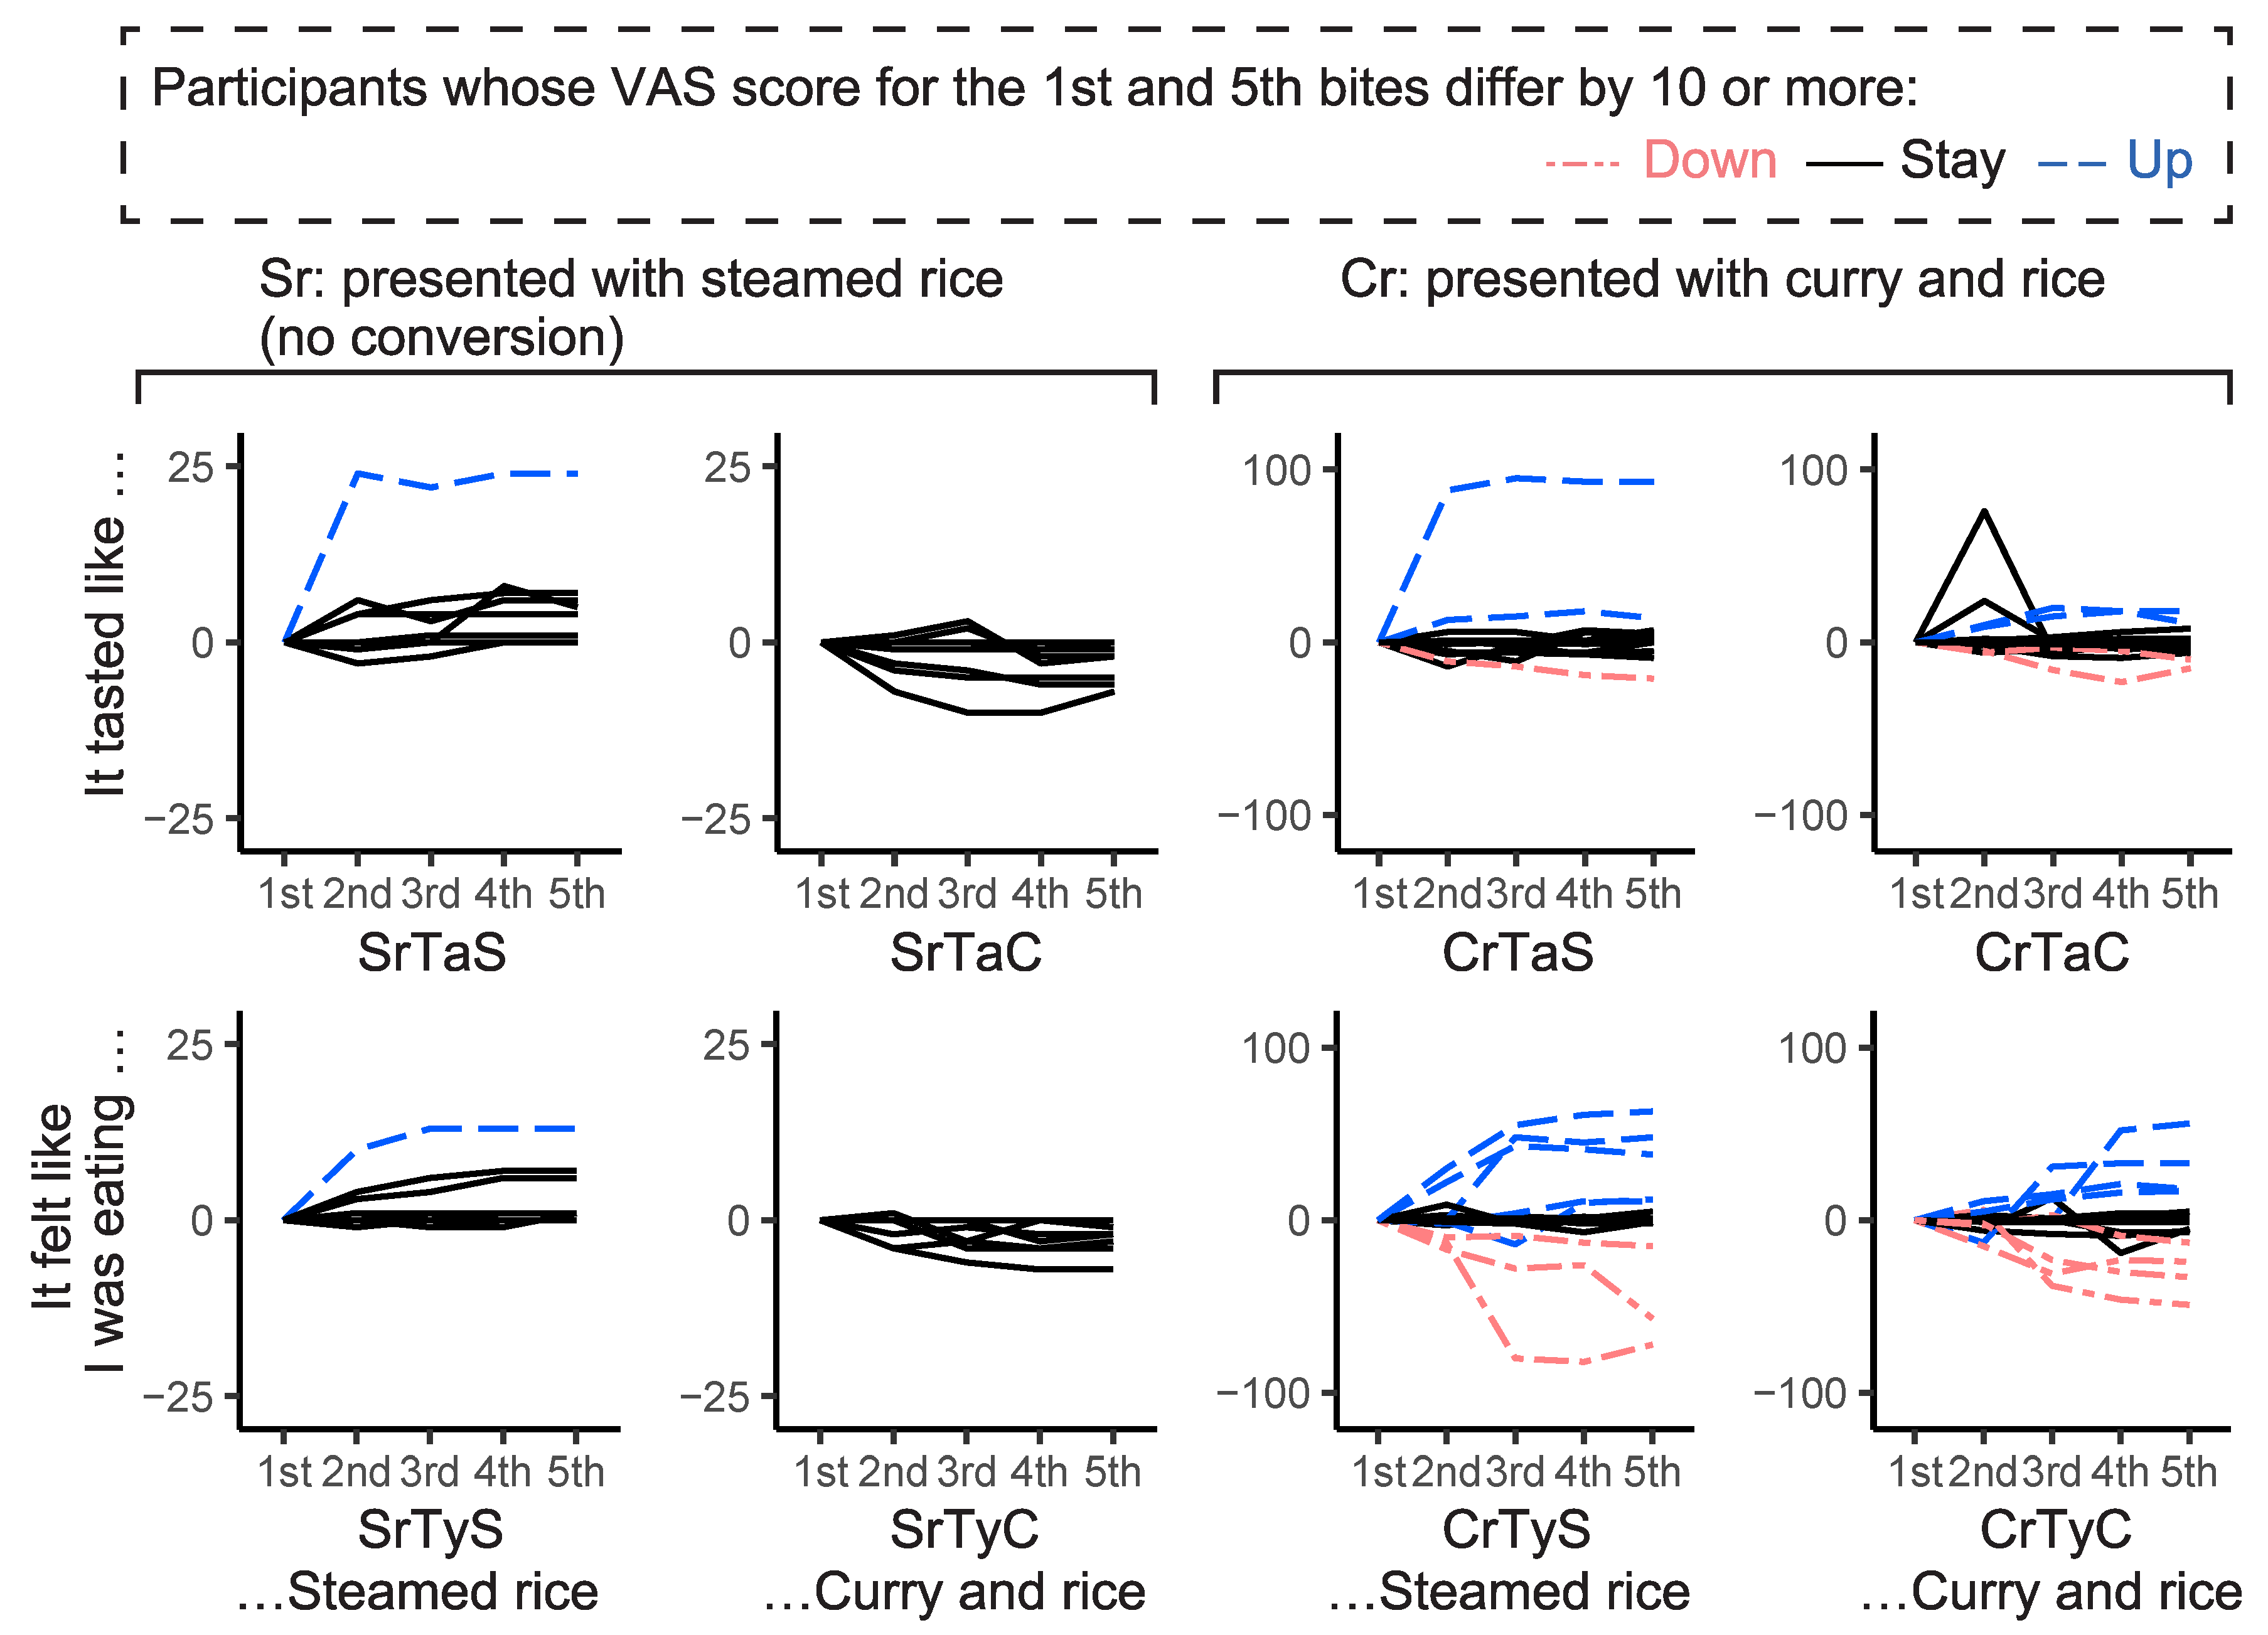
Table 5 shows the number of participants whose VAS scores changed by 10 points or more between the first and fifth bites under the rice conditions. Figure 9 shows the relative change in VAS scores from the first bite to the fifth bite in each participant’s rice conditions, with the first bite as the baseline. The results for each participant were categorized as Up, Down, and Stay according to Table 5. Our hypothesis was that “the cross-modal effect would decrease as the number of bites increased, and participants would feel more strongly that they were eating the original food.” For example, the values of SrTaS and CrTaS were expected to increase as the number of bites increases, while the values of SrTaC and CrTaC were expected to decrease.
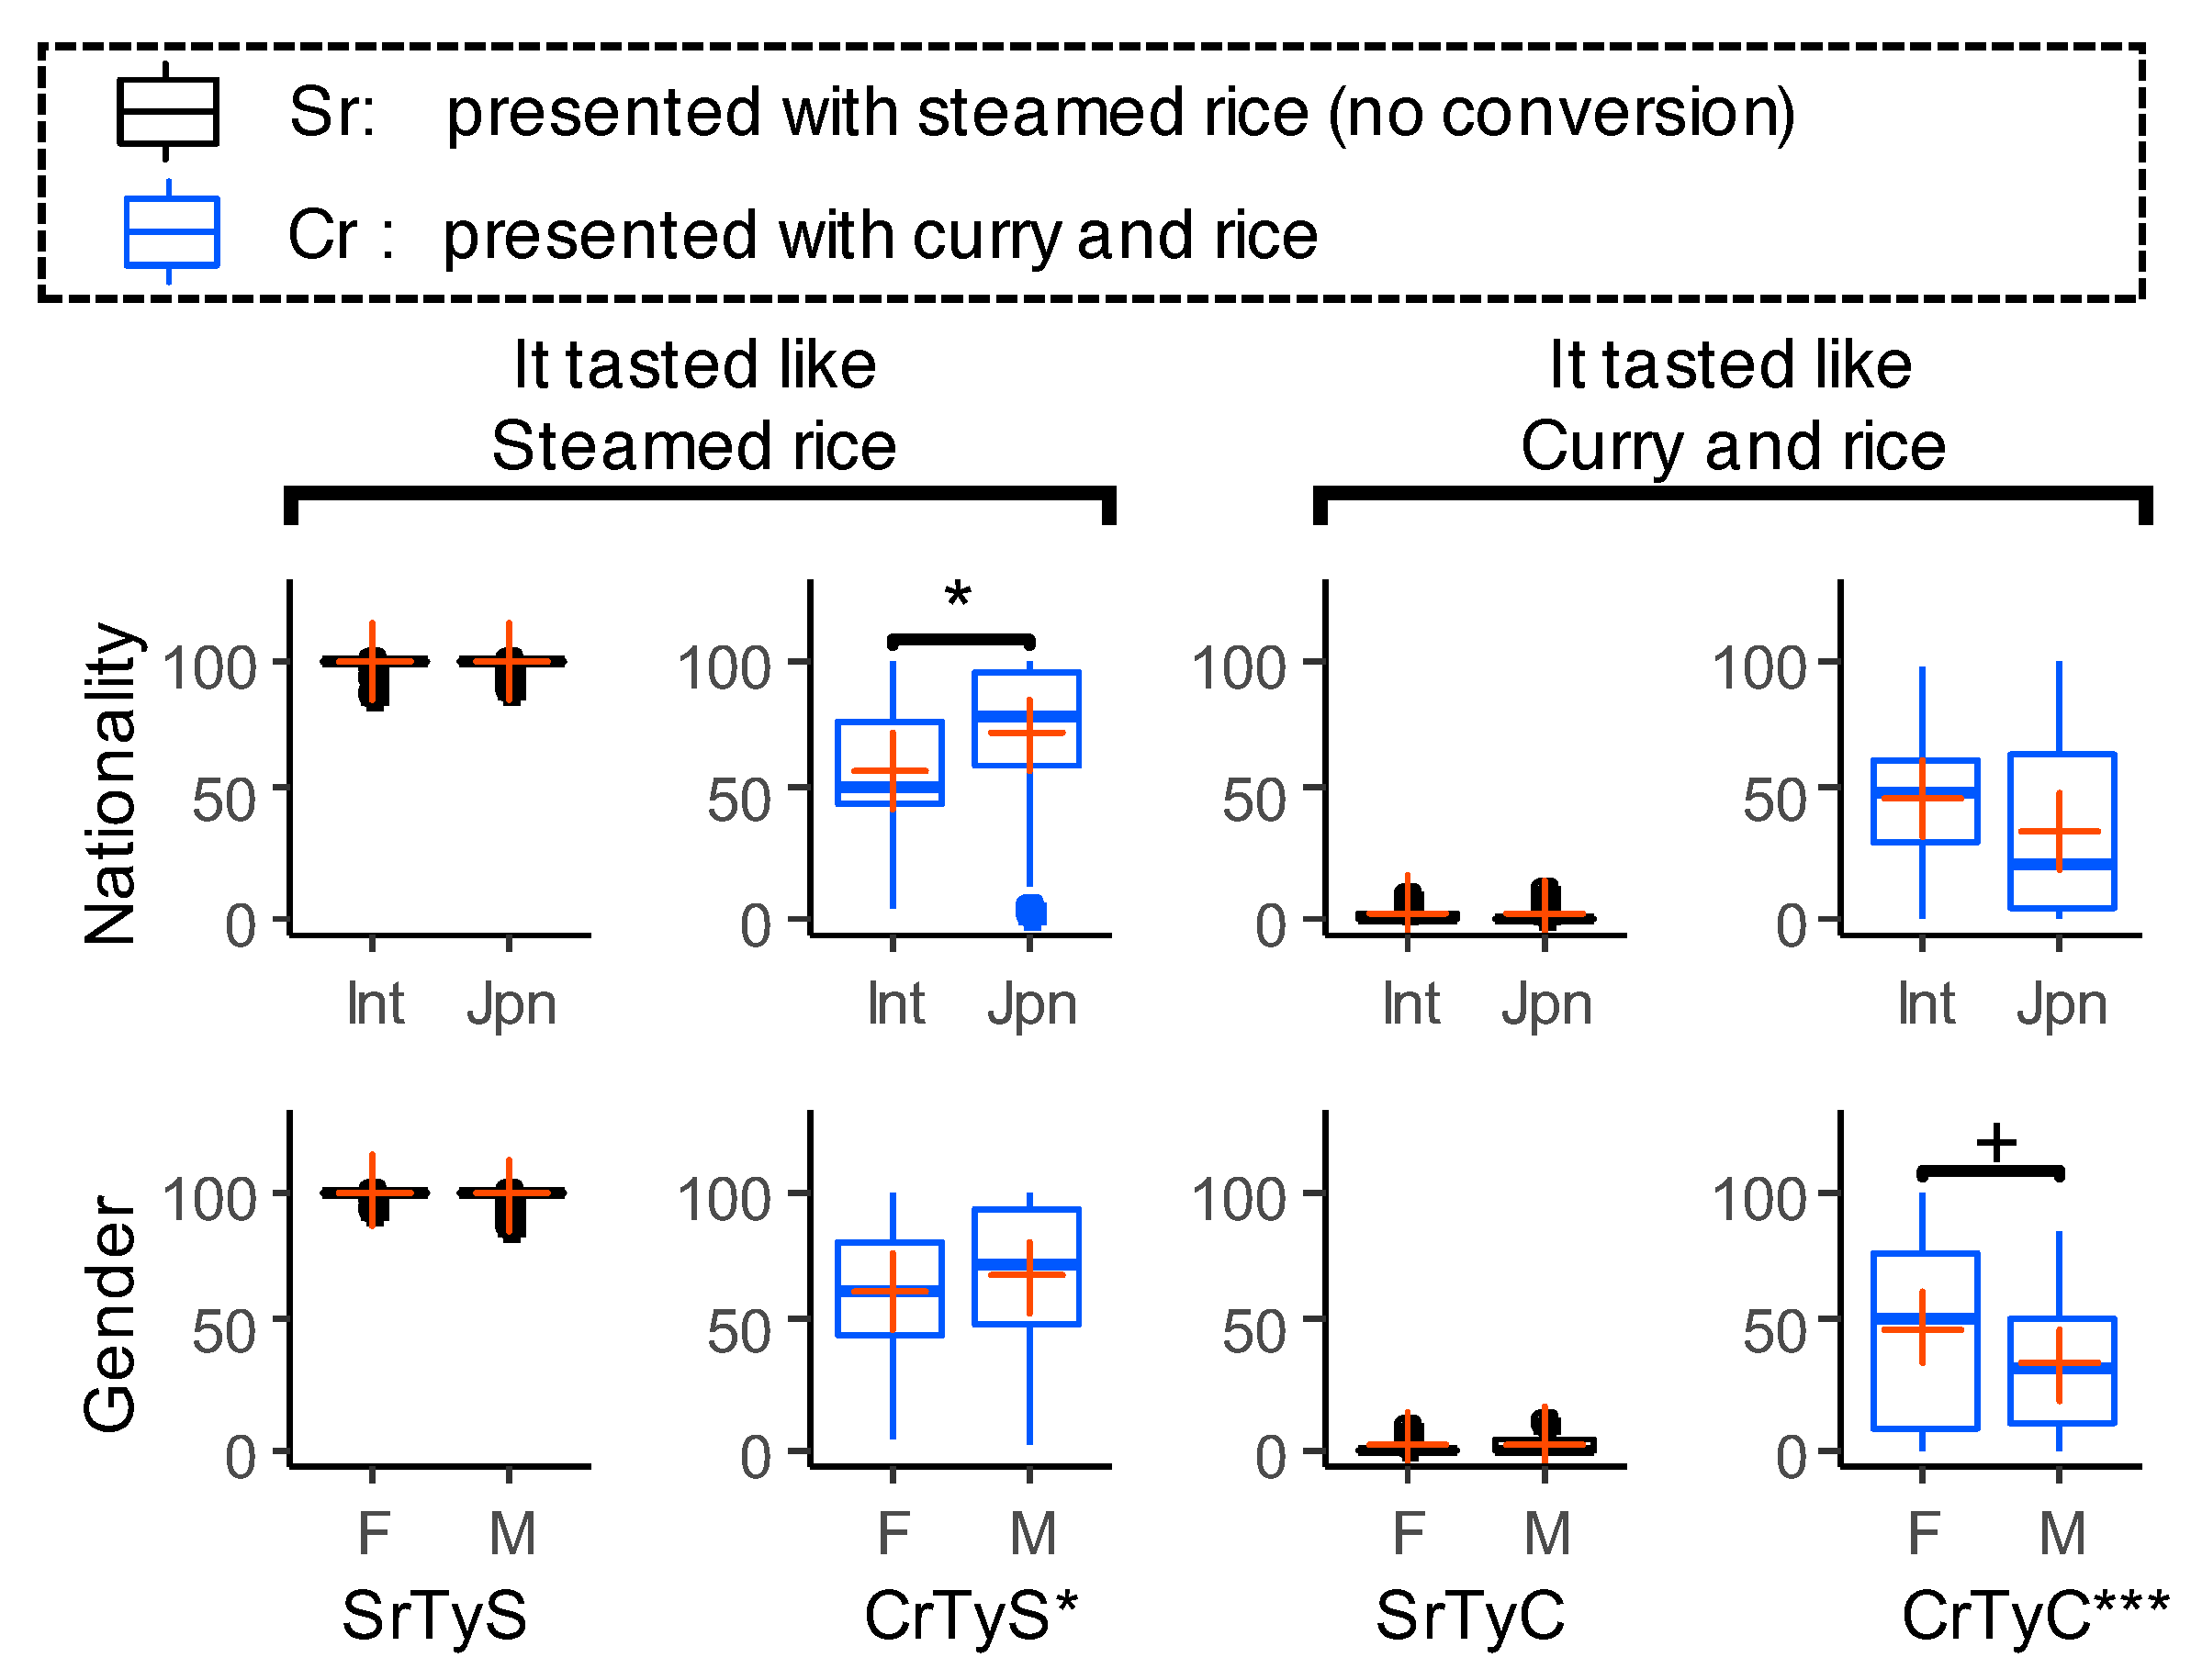
Table 6 and Table 7 show the results of ANOVA for Q1 to Q4 for each of the rice conditions. The interactions of “Persistency: Nationality”, “Persistency: Gender,” and “Persistency: Nationality: Gender” are omitted because there was no significant difference. Figure 10 and Figure 11 show the results of nationality and gender differences. If the score for “It tasted like steamed rice” is lower for Cr than Sr, and the score for “It tasted like curry and rice” is higher for Cr than Sr, the effect of visual modulation is stronger. For example, if the values of SrTaS and CrTaC are large and the values of SrTaC and CrTaS are small in Figure 8, the effect of visual modulation is considered to be strong.

6.3.2. Discussion

Figure 8 shows similar scores and tendencies as the results of the rice conditions in the previous study: visual modulation decreases the taste of the original food and increases the taste of the visually presented food. As in the noodle conditions, gustatory sensations are manipulated successfully even if the participants only saw the evaluating food through the HMD.
Regarding persistency in Table 6 and Table 7, a significant difference was confirmed only for SrTaS. However, no significant difference was found in the post-hoc analysis using the Holm method. For SrTaS, most participants scored 90 or higher, and only one participant changed the score by 10 or more, as shown in Table 5. From these results, we can say that the gustatory manipulation clearly persists in the rice conditions as well. Additionally, Figure 9 shows that most participants’ scores did not change in the Sr conditions SrTaS, SrTaC, SrTyS, and SrTyC. Besides, CrTaS and CrTaC, which are the results of the questions on taste in the Cr conditions, showed little change in taste, which is different from the results for the noodle conditions. We hypothesize that these results are because steamed rice is an everyday food in Japan, and therefore the memory of the taste is robust, making it difficult to induce cross-modal effects and that the light taste of steamed rice makes it difficult to perceive changes in taste.
On the other hand, CrTyS and CrTyC, which are the results of the questions on food type in the Cr conditions, showed that the numbers of participants in the Up and Down groups were higher, confirming the similar trends as in the noodle conditions. These results indicate that as the number of bites increased, some participants noticed that they were eating steamed rice and the effect of the illusion decreased, while others thought they were eating curry and rice, and the effect of the illusion increased. We attribute the differences in taste and food type changes in these Cr conditions to the fact that the vision-induced gustatory manipulation is more effective in changing participants’ perception of food type than changing their perception of taste. From these results, we can confirm again that the vision-induced gustatory manipulation is persistent in many participants. Their persistent gustatory changes are divided into three groups: those in which the intensity of the gustatory change gradually increased, those in which it gradually decreased, and those in which it did not fluctuate, each with about the same number of participants.
Next, we investigate evaluation scores in terms of nationality and gender. From Table 6 and Table 7, we can confirm significant differences and trends toward significance in many groups. In addition, the interaction between nationality and gender has also been confirmed.
Looking at the nationality rows in Figure 10 and Figure 11, the international participants felt the stronger taste of curry and rice when visually presented with curry and rice than Japanese participants like in the rice conditions (CrTaC and CrTyC). Again, we consider this is because the international participants had little experience of eating the target food and had a narrower range of expectations about the taste of the target food. Looking at the gender rows of CrTaS and CrTaC in Figure 10, the female participants felt the stronger taste of steamed rice and the weaker taste of curry and rice when visually presented with curry and rice compared to the male participants. In other words, the female participants’ taste perceptions were less modulated by visual stimuli, which is the same trend as that of the noodle conditions.
These results again suggest that the taste perceptions of the female participants were less modulated by visual stimuli. However, looking at the gender row of CrTyC in Figure 11, they felt like they were eating curry and rice better than male participants in the Cr condition. As in the noodle conditions, the results suggest that the participants perceived a change in the type of food even if they did not perceive a change in the food’s taste.
Like in the noodle conditions, we have to note that the generalizability of our findings is limited due to the small number of participants despite these findings.

6.4. Correlation between Noodle and Rice Conditions

We here discuss the correlation between the noodle and rice conditions. Comparing the two modulation conditions, the VAS scores in the Cr conditions (see Figure 8, CrTaC and CrTyC) are lower than those in the Fn conditions (see Figure 6, FnTaF and FnTyF). We believe that this is because the steamed rice was near tasteless whereas the somen noodles were not. Gustatory manipulation becomes more difficult when the gap in taste between the original and target types of food is larger. Comparing the numbers of Table 2, FnTaS and FnTaF and Table 5, CrTaS and CrTaC, those in the rice conditions are smaller. We believe that this is not because the gustatory manipulation is more stable but because it is weaker in the rice conditions.
The Pearson’s product moment correlation coefficient between the noodle and rice conditions indicates a weak relationship on the VAS scores of the perceived taste of the modulated food (FnTaF and CrTaC) ( r = 0.39 ), and that of the recognized type of food (FnTyF and CrTyC) ( r = 0.33 ). These results suggest that the participants who scored high in the Fn condition also scored high in the Cr condition and that the gustatory sensations of some participants are more strongly affected by visual modulation than others.

6.5. Overall Discussion

We here summarize the above discussions and answer the questions that arose in the previous user study. For the first question (whether and how the gustatory manipulation persists while eating the modulated food), since the significant differences for persistency were not confirmed in almost all the cases, we can say that the gustatory manipulation persists to some extent for a longer period of time. Meanwhile, there were individual differences in the tendency for persistent changes in visual modulation. In particular, there were many individual differences in the perception of food types during the visual modulation, and there were similar number of participants who gradually felt more strongly that they were eating the original food, those who felt that they were eating the food presented by the visual modulation, and those who did not change. In other words, their tendency for vision-induced gustatory change persistent exists in three groups: those in which the intensity of the gustatory change gradually increased with each biting session, those in which it gradually decreased, and those in which it did not fluctuate.
For the second question (whether and how not seeing the original food before seeing the modulated food affects the strength of gustatory manipulation), this experiment revealed that the gustatory manipulation occurred and the strengths of the perceived taste and the confidence of the recognized food are similar whether or not participants saw the original food before seeing the modulated food under both the noodle and rice conditions. We hypothesize that the intensity of the taste change would be enhanced when participants were not presented with the actual food they were eating, but these results did not support our hypothesis.
For the third question (whether and how the results depend on the participants’ nationality and gender), we confirmed that the strength of gustatory manipulation varies depending on nationality and gender. In the present experiment, non-Japanese and male participants felt the stronger gustatory manipulation compared to Japanese and female participants, respectively. We speculate that the more they are familiar with the original and target types of food, the weaker gustatory manipulation they will feel due to more accurate expectations of the food experience. The experiments focusing on nationality and gender showed these trends, but note that the number of participants was small. An additional large-scale study with many participants is needed to examine the effects of cultural differences such as nationality and gender on vision-induced gustatory.

7. Limitations

We believe that the reported user study is valuable in general, however, it also has several limitations. Here, we discuss some of these limitations and future directions.

7.1. Food Types

We tested only two original types of food (steamed rice and somen noodles) and two target types of food (curry and rice and fried noodles). We chose rice and noodles because of the popularity in East Asia. Somen noodles and steamed rice are both widely available and known for weak tastes thus good as original types of food. Fried noodles and curry and rice were selected due also to the popularity. In addition, they often contain ‘forbidden’ ingredients such as pork. We believe that the selection of these food types is reasonable considering that we target to support people with dietary restrictions in the future. We would like to conduct follow-up studies on the relationship between the strength of gustatory manipulation and the visual or gustatory similarities between the original and target food types.

7.2. Participants

Even though we increased the geographical, ethnic, and gender variations among the participants compared to those in the previous user study, the low variations in age and the background (most were graduate students) are possible limitations of this study. For example, the small number of participants might have had a significant impact on the results. The large average age difference between males and females is problematic in comparing the effects of gender, and the bias in the country of origin of international participants is problematic in comparing the differences between Japanese and international participants. However, it should not be ignored that despite these problems, there was a clear tendency for differences in food experience to affect flavor perception that promises interesting follow-up studies in the future.
We would like to conduct further studies using different combinations with greater variation of food types and sample population in the future.

7.3. Experimental Protocol

In our user study, participants knew what they were actually eating regardless of the visual modulation conditions even though they did not see the original food without the HMD. One way to avoid unwanted bias would be to mix the opposite modulation conditions (e.g., fried noodles as the original food and somen noodles as the target food). However, such additional conditions will significantly increase the cost of food preparation.

7.4. Image Translation Quality

The image quality of visual modulation needs to be improved significantly. Twitter images used for training were generally taken close to the food with chopsticks or a spoon whereas the participants saw the food from slightly farther positions. Visual modulation sometimes failed because of this difference. Besides, the current system converts the entire image into the target food so we needed to run the experiment in a texture-less environment. Another problem was that our system’s output was coarse and more or less the same for one type of food (e.g., fried noodles) whereas there are actually many variations within a single type of food. Because of this, the modulated food looked very different from participants’ expectations sometimes. In the future, we plan to improve the neural network by introducing many new features, such as food region extraction, supporting a larger number of food types and high resolution images [38,39].

7.5. System Latency

The system latency has been improved from 400 ms in the previous study to about 150 ms in the current system. However, it is still non-negligible. Even though no-one reported relevant problems such as motion sickness or nausea, the latency must be further shortened for a practical use.

7.6. Difficulty of Eating

Many participants reported the difficulty of eating while wearing the HMD. This was mainly due to the horizontal offset between the participants’ eyes and the cameras for the video see-through experience. Because of this, they thought their mouth position was about 10 cm away from their actual position. In the future, we would like to use a custom-designed video see-through HMD with a smaller horizontal parallax and a wider opening around the mouth.

8. Conclusions

In this paper, we have reported a user study on the effectiveness of our GAN-based gustatory manipulation system primarily from the perspectives of persistency, nationality, and gender differences.
Our experimental results revealed that vision-induced gustatory manipulation is persistent in many participants. Their persistent gustatory changes are divided into three groups: those in which the intensity of the gustatory change gradually increased, those in which it gradually decreased, and those in which it did not fluctuate, each with similar number of participants. Our results also revealed that those participants who are less familiar with the original and target types of food in their home countries feel stronger gustatory manipulation and that males feel stronger gustatory manipulation than females.
We believe that our research has provided a deeper understanding and insights into GAN-based gustatory manipulation. We hope many researchers will be encouraged to conduct follow-up studies. In the future, we will improve the image translation quality, further reduce the system latency, and minimize the horizontal parallax. Then we will conduct follow-up studies using a wider variety of foods for a larger number of participants from a more diverse demographic background.

Author Contributions

K.N. contributed to the study concept, the development of the VR Application, the data acquisition, the analysis and writing of the first version of the manuscript. D.H. contributed to the development of the machine learning model and writing corresponding sections of the manuscript. K.N., N.S., K.K. and T.N. contributed to the conception and implementation of the study. N.I., N.K., N.S., K.K. and K.Y. contributed to resources and supervision. All authors have read and agreed to the published version of the manuscript.

Funding

This research was funded by JSPS KAKENHI Grant Number JP18H03273.

Data Availability Statement

The data presented in this study are available on request from the corresponding author.

Conflicts of Interest

The funders had no role in the study’s design; in the collection, analyses, or interpretation of data; in the writing of the manuscript, or in the decision to publish the results.

References

  1. Lieberman, J.A.; Sicherer, S.H. Quality of life in food allergy. Curr. Opin. Allergy Clin. Immunol. 2011, 11, 236–242. [Google Scholar] [CrossRef] [PubMed]
  2. DunnGalvin, A.; de BlokFlokstra, B.M.J.; Burks, A.W.; Dubois, A.E.J.; Hourihane, J.O. Food allergy QoL questionnaire for children aged 0–12 years: Content, construct, and cross-cultural validity. Clin. Exp. Allergy 2008, 38, 977–986. [Google Scholar] [CrossRef]
  3. Spence, C. Multisensory Flavor Perception. Cell 2015, 161, 24–35. [Google Scholar] [CrossRef] [Green Version]
  4. Prescott, J. Multisensory processes in flavour perception and their influence on food choice. Curr. Opin. Food Sci. 2015, 3, 47–52. [Google Scholar] [CrossRef]
  5. Narumi, T.; Nishizaka, S.; Kajinami, T.; Tanikawa, T.; Hirose, M. Augmented reality flavors: Gustatory display based on Edible Marker and cross-modal interaction. In Proceedings of the SIGCHI Conference on Human Factors in Computing Systems, Vancouver, BC, Canada, 7–12 May 2011; pp. 93–102. [Google Scholar] [CrossRef]
  6. Ueda, J.; Okajima, K. AR food changer using deep learning and cross-modal effects. In Proceedings of the IEEE International Conference on Artificial Intelligence and Virtual Reality, San Diego, CA, USA, 9–11 December 2019; pp. 110–117. [Google Scholar] [CrossRef]
  7. Nakano, K.; Horita, D.; Sakata, N.; Kiyokawa, K.; Yanai, K.; Narumi, T. DeepTaste: Augmented reality gustatory manipulation with GAN-based real-time food-to-food translation. In Proceedings of the IEEE International Symposium on Mixed and Augmented Reality, Beijing, China, 14–18 October 2019; pp. 212–223. [Google Scholar] [CrossRef]
  8. Roper, S.D.; Chaudhari, N. Taste buds: Cells, signals and synapses. Nat. Rev. Neurosci. 2017, 18, 485–497. [Google Scholar] [CrossRef]
  9. Rozin, P. “Taste-smell confusions” and the duality of the olfactory sense. Percept. Psychophys. 1982, 31, 397–401. [Google Scholar] [CrossRef] [PubMed] [Green Version]
  10. Stevenson, R.J.; Prescott, J.; Boakes, R.A. Confusing tastes and smells: How odours can influence the perception of sweet and sour tastes. Chem. Senses 1999, 24, 627–635. [Google Scholar] [CrossRef] [PubMed] [Green Version]
  11. Murphy, C.; Cain, W.S. Taste and Olfaction: Independence vs Interaction. Physiol. Behav. 1980, 24, 601–605. [Google Scholar] [CrossRef]
  12. Ranasinghe, N.; Nguyen, T.N.T.; Liangkun, Y.; Lin, L.Y.; Tolley, D.; Do, E.Y.L. Vocktail: A Virtual Cocktail for Pairing Digital Taste, Smell, and Color Sensations. In Proceedings of the ACM international conference on Multimedia, Mountain View, CA, USA, 23–27 October 2017; pp. 1139–1147. [Google Scholar] [CrossRef]
  13. Koizumi, N.; Tanaka, H.; Uema, Y.; Inami, M. Chewing jockey: Augmented food texture by using sound based on the cross-modal effect. In Proceedings of the International Conference on Advances in Computer Entertainment Technology, Lisbon, Portugal, 8–11 November 2011; pp. 1–4. [Google Scholar] [CrossRef]
  14. Iwata, H.; Yano, H.; Uemura, T.; Moriya, T. Food simulator: A haptic interface for biting. In Proceedings of the IEEE Conference on Virtual Reality and 3D User Interfaces, Chicago, IL, USA, 27–31 March 2004; pp. 51–57. [Google Scholar] [CrossRef]
  15. Slocombe, B.G.; Carmichael, D.A.; Simner, J. Cross-modal Tactile–taste Interactions in Food Evaluations. Neuropsychologia 2016, 88, 58–64. [Google Scholar] [CrossRef] [Green Version]
  16. Zampini, M.; Spence, C. The Role of Auditory Cues in Modulating The Perceived Crispness and Staleness of Potato Chips. J. Sens. Stud. 2004, 19, 347–363. [Google Scholar] [CrossRef]
  17. Miyashita, H. Norimaki synthesizer: Taste display using ion electrophoresis in five gels. In Proceedings of the Extended Abstracts of the CHI Conference on Human Factors in Computing Systems, Honolulu, HI, USA, 25–30 April 2020; pp. 1–6. [Google Scholar] [CrossRef]
  18. Spence, C.; Levitan, C.A.; Shankar, M.U.; Zampini, M. Does Food Color Influence Taste and Flavor Perception in Humans? Chemosens. Percept. 2010, 3, 68–84. [Google Scholar] [CrossRef]
  19. van der Laan, L.; de Ridder, D.; Viergever, M.; Smeets, P. The first taste is always with the eyes: A meta-analysis on the neural correlates of processing visual food cues. NeuroImage 2011, 55, 296–303. [Google Scholar] [CrossRef]
  20. Zampini, M.; Wantling, E.; Phillips, N.; Spence, C. Multisensory flavor perception: Assessing the influence of fruit acids and color cues on the perception of fruit-flavored beverages. Food Qual. Prefer. 2008, 19, 335–343. [Google Scholar] [CrossRef]
  21. Morrot, G.; Brochet, F.; Dubourdieu, D. The Color of Odors. Brain Lang. 2001, 79, 309–320. [Google Scholar] [CrossRef] [PubMed] [Green Version]
  22. Narumi, T.; Sato, M.; Tanikawa, T.; Hirose, M. Evaluating cross-sensory perception of superimposing virtual color onto real drink: Toward realization of pseudo-gustatory displays. In Proceedings of the Augmented Human International Conference, Megeve, France, 2–4 April 2010; pp. 18–24. [Google Scholar] [CrossRef]
  23. Piqueras-Fiszman, B.; Alcaide, J.; Roura, E.; Spence, C. Is it the plate or is it the food? Assessing the influence of the color (black or white) and shape of the plate on the perception of the food placed on it. Food Qual. Prefer. 2012, 24, 205–208. [Google Scholar] [CrossRef]
  24. Shankar, M.; Simons, C.; Shiv, B.; McClure, S.; Levitan, C.A.; Spence, C. An expectations-based approach to explaining the cross-modal influence of color on orthonasal olfactory identification: The influence of the degree of discrepancy. Atten. Percept. Psychophys. 2010, 72, 1981–1993. [Google Scholar] [CrossRef] [Green Version]
  25. Genschow, O.; Reutner, L.; Wänke, M. The color red reduces snack food and soft drink intake. Appetite 2012, 58, 699–702. [Google Scholar] [CrossRef] [Green Version]
  26. Wansink, B.; Painter, J.E.; North, J. Bottomless Bowls: Why Visual Cues of Portion Size May Influence Intake. Obes. Res. 2005, 13, 93–100. [Google Scholar] [CrossRef] [PubMed]
  27. Sakurai, S.; Narumi, T.; Ban, Y.; Tanikawa, T.; Hirose, M. Affecting Our Perception of Satiety by Changing the Size of Virtual Dishes Displayed with a Tabletop Display. In Proceedings of the International Conference on Virtual, Augmented and Mixed Reality, Las Vegas, NV, USA, 21–26 July 2013; pp. 90–99. [Google Scholar] [CrossRef]
  28. Narumi, T.; Ban, Y.; Kajinami, T.; Tanikawa, T.; Hirose, M. Augmented perception of satiety: Controlling food consumption by changing apparent size of food with augmented reality. In Proceedings of the SIGCHI Conference on Human Factors in Computing Systems, Austin, TX, USA, 5–10 May 2012; pp. 109–118. [Google Scholar] [CrossRef]
  29. Wan, X.; Woods, A.T.; van den Bosch, J.J.F.; McKenzie, K.J.; Velasco, C.; Spence, C. Cross-cultural differences in crossmodal correspondences between basic tastes and visual features. Front. Psychol. 2014, 5, 1365. [Google Scholar] [CrossRef] [PubMed] [Green Version]
  30. Wan, X.; Velasco, C.; Michel, C.; Mu, B.; Woods, A.T.; Spence, C. Does the type of receptacle influence the crossmodal association between colour and flavour? A cross-cultural comparison. Flavour 2014, 3, 3. [Google Scholar] [CrossRef] [Green Version]
  31. Ngo, M.K.; Velasco, C.; Salgado, A.; Boehm, E.; O’Neill, D.; Spence, C. Assessing crossmodal correspondences in exotic fruit juices: The case of shape and sound symbolism. Food Qual. Prefer. 2013, 28, 361–369. [Google Scholar] [CrossRef]
  32. Choi, Y.; Choi, M.; Kim, M.; Ha, J.W.; Kim, S.; Choo, J. StarGAN: Unified Generative Adversarial Networks for Multi-domain Image-to-Image Translation. In Proceedings of the IEEE Computer Society Conference on Computer Vision and Pattern Recognition, Salt Lake City, UT, USA, 18–23 June 2018; pp. 8789–8797. [Google Scholar] [CrossRef] [Green Version]
  33. Matsuda, Y.; Hoashi, H.; Yanai, K. Recognition of multiple-food images by detecting candidate regions. In Proceedings of the IEEE International Conference on Multimedia and Expo, Melbourne, VIC, Australia, 9–13 July 2012; pp. 25–30. [Google Scholar] [CrossRef] [Green Version]
  34. Simonyan, K.; Zisserman, A. Very deep convolutional networks for large-scale image recognition. In Proceedings of the International Conference on Learning Representations, San Diego, CA, USA, 7–9 May 2015. [Google Scholar]
  35. Kim, P.; Orlosky, J.; Kiyokawa, K. AR Timewarping: A Temporal Synchronization Framework for Real-Time Sensor Fusion in Head-Mounted Displays. In Proceedings of the Augmented Human International Conference, Seoul, Korea, 7–9 February 2018. [Google Scholar] [CrossRef]
  36. Spetter, M.S.; Smeets, P.A.M.; de Graaf, C.; Viergever, M.A. Representation of Sweet and Salty Taste Intensity in the Brain. Chem. Senses 2010, 35, 831–840. [Google Scholar] [CrossRef] [PubMed] [Green Version]
  37. Wobbrock, J.O.; Findlater, L.; Gergle, D.; Higgins, J.J. The Aligned Rank Transform for nonparametric factorial analyses using only ANOVA procedures. In Proceedings of the SIGCHI Conference on Human Factors in Computing Systems, Vancouver, BC, Canada, 7–12 May 2011; pp. 143–146. [Google Scholar] [CrossRef] [Green Version]
  38. Wang, T.C.; Liu, M.Y.; Zhu, J.Y.; Tao, A.; Kautz, J.; Catanzaro, B. High-Resolution Image Synthesis and Semantic Manipulation with Conditional GANs. In Proceedings of the IEEE Computer Society Conference on Computer Vision and Pattern Recognition, Salt Lake City, UT, USA, 18–23 June 2018; pp. 8798–8807. [Google Scholar] [CrossRef] [Green Version]
  39. Wang, T.C.; Liu, M.Y.; Zhu, J.Y.; Liu, G.; Tao, A.; Kautz, J.; Catanzaro, B. Video-to-Video Synthesis. In Proceedings of the Conference on Neural Information Processing Systems, Montreal, QC, Canada, 3–8 December 2018. [Google Scholar]
Figure 1. Our GAN-based real-time food-to-food translation system in action. (left) User with a video see-through HMD experiencing vision-induced gustatory manipulation of Rice Conditions. (right bottom) Examples of Noodle Conditions.
Electronics 10 01157 g001
Figure 2. System configuration of the GAN-based food-to-food translation system. The client module acquires an RGB image from the camera (a), sends it to the server (b), overlays the processed image on the video background (g), and presents the scene to the user (h). The server module receives the sent image (c), crops the center (d), translates it to another food image (e), and sends it back (f).
Electronics 10 01157 g002
Figure 3. A participant in a noodle condition. They ate food placed on a black table surrounded by a white wall while wearing HMDs.
Electronics 10 01157 g003
Figure 4. VAS scores in the noodle conditions. The box plots in the upper and lower rows correspond to the results for Q1 and Q2, and Q3 and Q4, respectively. The red crosses indicate the mean values, and the dots indicate the outliers. For example, the upper left graph, where “It tasted like …” and “…Somen noodles” intersect, shows the results of Q1, where “It tasted like somen noodles” was asked, and Sn1 shows the VAS score of the first bite under Sn conditions. In addition, the entire Sn1–Sn5 is denoted as SnTaS for identification purposes.
Electronics 10 01157 g004
Figure 5. Relative change in VAS scores from the first to the fifth bite for each participant. Participants were divided into three groups based on the differences in VAS scores between the first and fifth bites: Up group (those increased by 10 points or more), Down group (those decreased by 10 points or more), and Stay group (those changed by less than 10 points). For example, the upper left graph, where “It tasted like…” and “…Somen noodles” intersect, shows the results of SnTaS, where “It tasted like somen noodles” was asked, and the n-th VAS score shows the VAS score of the n-th bite under Sn conditions.
Electronics 10 01157 g005
Figure 6. VAS scores with regard to nationality and gender for Q1 and Q2 in the noodle conditions. Interactions are indicated to the right of result group names SnTaS, FnTaS, and FnTaF. The red crosses indicate the mean values, and the dots indicate the outliers. Significant differences are indicated with symbols (*** for p < 0.001 , ** for p < 0.01 , * for p < 0.05 , and + for p < 0.1 ). The upper graphs show the nationality classification, where Int indicates international participants and Jpn indicates Japanese participants. The lower graphs show the classification of gender, where F indicates female participants and M indicates male participants. For example, the upper left graph shows the values of Sn1–Sn5 of SnTaS focusing on nationality.
Electronics 10 01157 g006
Figure 7. VAS scores with regard to nationality and gender for Q3 and Q4 in the noodle conditions. Interactions are indicated to the right of result group names SnTyS and FnTyS. The red crosses indicate the mean values, and the dots indicate the outliers. Significant differences are indicated with symbols (*** for p < 0.001 , ** for p < 0.01 , * for p < 0.05 , and + for p < 0.1 ). The upper graphs show the nationality classification, where Int indicates international participants and Jpn indicates Japanese participants. The lower graphs show the classification of gender, where F indicates female participants and M indicates male participants. For example, the upper left graph shows the values of Sn1–Sn5 of SnTyS focusing on nationality.
Electronics 10 01157 g007
Figure 8. VAS scores in the rice conditions. The box plots in the upper and lower rows correspond to the results for Q1 and Q2, and Q3 and Q4, respectively. The red crosses indicate the mean values, and the dots indicate the outliers. For example, the upper left graph, where “It tasted like ...” and “...Steamed rice” intersect, shows the results of Q1, where “It tasted like steamed rice” was asked, and Sr1 shows the VAS score of the first bite under Sr conditions. In addition, the entire Sr1–Sr5 is denoted as SrTaS for identification purposes.
Electronics 10 01157 g008
Figure 9. Relative change in VAS scores from the first to the fifth bite for each participant. Participants were divided into three groups based on the difference in VAS scores between the first and fifth bites: Up group (those increased by 10 points or more), Down group (those decreased by 10 points or more), and Stay group (those changed by less than 10 points). For example, the upper left graph, where “It tasted like …” and “…Steamed rice” intersect, shows the results of SrTaS, where “It tasted like steamed rice” was asked, and the n-th VAS score shows the VAS score of the n-th bite under Sr conditions.
Electronics 10 01157 g009
Figure 10. VAS scores with regard to nationality and gender for Q1 and Q2 in the rice conditions. Interactions are indicated to the right of result group names CrTaS and CrTaC. The red crosses indicate the mean values, and the dots indicate the outliers. Significant differences are indicated with symbols (*** for p < 0.001 , ** for p < 0.01 , * for p < 0.05 , and + for p < 0.1 ). The upper graphs show the nationality classification, where Int indicates international participants and Jpn indicates Japanese participants. The lower graphs show the classification of gender, where F indicates female participants and M indicates male participants. For example, the upper left graph shows the values of Sn1–Sn5 of SrTaS focusing on nationality.
Electronics 10 01157 g010
Figure 11. VAS scores with regard to nationality and gender for Q3 and Q4 in the rice conditions. Interactions are indicated to the right of result group names CrTyS and CrTyC. The red crosses indicate the mean values, and the dots indicate the outliers. Significant differences are indicated with symbols (*** for p < 0.001 , ** for p < 0.01 , * for p < 0.05 , and + for p < 0.1 ). The upper graphs show the nationality classification, where Int indicates international participants and Jpn indicates Japanese participants. The lower graphs show the classification of gender, where F indicates female participants and M indicates male participants. For example, the upper left graph shows the values of Sn1–Sn5 of SrTyS focusing on nationality.
Electronics 10 01157 g011
Table 1. Image dataset used to learn the network.
CategoryNumbers of Images
Ramen noodles75,350
Fried noodles28,400
Steamed rice7390
Curry & rice9830
Fried rice28,400
Total149,370
Table 2. Number of participants whose VAS scores for the first and fifth bites differ by 10 or more in the noodle conditions (up: number of participants with improved VAS scores, stay: number of participants with little change in VAS scores, down: number of participants with reduced VAS scores).
Sn Fn
Taste Type Taste Type
SnTaSSnTaF SnTySSnTyF FnTaSFnTaF FnTySFnTyF
up32 40 45 56
stay118 1211 66 45
down26 05 65 75
Table 3. ANOVA results for Q1 and Q2 in the noodle conditions. Significant differences are indicated with symbols (*** for p < 0.001 , ** for p < 0.01 , * for p < 0.05 , and + for p < 0.1 ). “Nationality: Gender” shows the interaction between nationality and gender. The interactions of “Persistency: Nationality”, “Persistency: Gender,” and “Persistency: Nationality: Gender” are omitted because there was no significant difference.
It Tasted Like…
…Somen Noodles…Fried Noodles
ConditionSnTaSFnTaSSnTaFFnTaF
Persistencyn.s.n.s.n.s.n.s.
Nationality***n.s.+*
Gender******+***
Nationality: Gender******n.s.*
Table 4. ANOVA results for Q3 and Q4 in the noodle conditions. Significant differences are indicated with symbols (*** for p < 0.001 , ** for p < 0.01 , * for p < 0.05 , and + for p < 0.1 ). “Nationality: Gender” shows the interaction between nationality and gender. The interactions of “Persistency: Nationality”, “Persistency: Gender,” and “Persistency: Nationality: Gender” are omitted because there was no significant difference.
It Felt Like I Was Eating…
…Somen Noodles…Fried Noodles
ConditionSnTySFnTySSnTyFFnTyF
Persistencyn.s.n.s.n.s.n.s.
Nationality***n.s.**
Gender***n.s.*n.s.
Nationality:Gender*****n.s.n.s.
Table 5. Number of participants whose VAS scores for the first and fifth bites differ by 10 or more in the rice conditions (up: number of participants with improved VAS scores, stay: number of participants with no change in VAS score, down: number of participants with reduced VAS scores).
Sr Cr
Taste Type Taste Type
SrTaSSrTaC SrTySSrTyC CrTaSCrTaC CrTySCrTyC
up10 10 22 54
stay1516 1516 1312 88
down00 00 12 34
Table 6. ANOVA results for Q1 and Q2 in the rice conditions. Significant differences are indicated with symbols (*** for p < 0.001 , ** for p < 0.01 , * for p < 0.05 , and + for p < 0.1 ). “Nationality: Gender” shows the interaction between nationality and gender. The interactions of “Persistency: Nationality”, “Persistency: Gender,” and “Persistency: Nationality: Gender” are omitted because there was no significant difference.
It Tasted Like…
…Steamed Rice…Curry and Rice
ConditionSrTaSCrTaSSrTaCCrTaC
Persistency**n.s.n.s.n.s.
Nationality****+***
Gender+***n.s.***
Nationality:Gendern.s.***n.s.**
Table 7. ANOVA results for Q3 and Q4 in the rice conditions. Significant differences are indicated with symbols (*** for p < 0.001 , ** for p < 0.01 , * for p < 0.05 , and + for p < 0.1 ). “Nationality: Gender” shows the interaction between nationality and gender. The interactions of “Persistency: Nationality”, “Persistency: Gender,” and “Persistency: Nationality: Gender” are omitted because there was no significant difference.
It Felt Like I Was Eating…
…Steamed Rice…Curry and Rice
ConditionSrTySCrTySSrTyCCrTyC
Persistencyn.s.n.s.n.s.n.s.
Nationalityn.s.*n.s.n.s.
Gendern.s.n.s.n.s.+
Nationality:Gendern.s.*n.s.***
Publisher’s Note: MDPI stays neutral with regard to jurisdictional claims in published maps and institutional affiliations.