Article

Scaled Modeling and Measurement for Studying Radio Wave Propagation in Tunnels

1
Department of Electrical and Electronics Engineering, Ariel University, Ariel 40700, Israel
2
Department of Chemical Engineering and Biotechnology, Ariel University, Ariel 40700, Israel
*
Author to whom correspondence should be addressed.
Electronics 2021, 10(1), 53; https://doi.org/10.3390/electronics10010053
Submission received: 18 November 2020 / Revised: 16 December 2020 / Accepted: 22 December 2020 / Published: 31 December 2020

Abstract

:
The subject of radio wave propagation in tunnels has gathered attention in recent years, mainly regarding the fading phenomena caused by internal reflections. Several methods have been suggested to describe the propagation inside a tunnel. This work is based on the ray tracing approach, which is useful for structures where the dimensions are orders of magnitude larger than the transmission wavelength. Using image theory, we utilized a multi-ray model to reveal non-dimensional parameters, enabling measurements in down-scaled experiments. We present the results of field experiments in a small concrete pedestrian tunnel with smooth walls for radio frequencies (RF) of 1, 2.4, and 10 GHz, as well as in a down-scaled model, for which millimeter waves (MMWs) were used, to demonstrate the roles of the frequency, polarization, tunnel dimensions, and dielectric properties on the wave propagation. The ray tracing method correlated well with the experimental results measured in the tunnel as well as in a scale model.

1. Introduction

Over recent decades, changes in lifestyle and frequent drives between cities have led to a large increase in roads for transportation and increased use of underground infrastructures, such as tunnels, mines, corridors, and other underground passways. People use this infrastructure during commutes in metro systems, trains, cars, and by walking. Due to security constraints and the constant demand for instant service, various agencies, such as telecommunications providers, search and rescue forces, and security forces, must cope with the challenge of providing service in an underground environment. There is ongoing research into radio waves in car and train tunnels and in mines. RF propagation in tunnels significantly differs as compared to above ground propagation. One reason for this is that, in tunnels, the far-field attenuation is generally lower than that of free-space [1,2,3]; therefore, researchers are working toward the understanding and the ability to precisely model the propagation of radio waves as a tool for improving communication and tracking systems. Experiments were performed in car and train tunnels as well as in curved tunnels [1,2,3]. In addition, measurements were taken in mines with rock dust, shotcrete [4] and underground galleries.
The prediction of wave propagation in an underground environment is troublesome due to the short wavelength relative to objects of different dimensions and shapes. The dimensions of rooms, the building materials, and the positions of various objects such as cars and trains, change, as well as people moving in the vicinity. To predict how an underground environment would affect wave propagation, some researchers have utilized scale models of tunnels in a lab environment to perform experiments that imitate real-world conditions [5,6]. Other works relied on results in the existing literature to confirm the models they developed [7]. Another approach involves using channel models for simulations, such as the waveguide model [8,9], two-slope model [10], ray tracing [11,12,13], and numerical solutions to Maxwell’s equations [14,15,16,17,18]. These models are suitable for empty tunnels with straight walls, making the propagation environment relatively simple and allowing it to be approximated to a waveguide.
The reported experiments were performed on various tunnels, and all but a few [4] were performed for large tunnels rather than pedestrian tunnels. The main differences between pedestrian and transport tunnels and mines are the dimensions and cross-sections, parameters that significantly impact the wave propagation [19,20] and electromagnetic properties [21]. Car and train tunnels are usually wide with low ceilings while pedestrian tunnels are narrow and have high ceilings. These differences affect the frequency and polarization of the transmitted waves. The majority of the theoretical and experimental research in predicting wave propagation concerns long distances and does not consider the transmitter’s close vicinity.
This paper is aimed at investigating the propagation of RF waves in relatively ‘narrow’ tunnels such as pedestrian walkways and corridors. The scenario becomes interesting for wireless communication links operating at Ultra High Frequency (UHF) or Super High Frequency (SHF), when the dimensions of the tunnel are not much larger than the wavelength. In addition, the paper demonstrates the use of scaled models for experimental radio wave propagation studies.
In this paper we report on the results of a field experiment performed in a pedestrian tunnel with a relatively small cross-section: a height of 1.85 m and width of 1 m. Measurements and simulations were performed for frequencies of 1, 2.4, and 10 GHz. In addition, a 1:10 scale model was built out of wood coated in Formica for testing frequencies of 10 and 94 GHz, which correspond to the scaled frequencies of the real experiment. We compared the field and scaled experiments to a modified simulation model based on ray tracing.
The experiments used directional antennas, contrary to other known models where the number of reflections is infinite [4,12] along the tunnel. In reality, the number of reflections is a function of distance and tunnel dimensions, its starting value of zero gradually increasing with the distance between antennas. We observed that every ray incident on the receiver had a significant impact when in close vicinity to the transmitter. Our results showed a correlation between theoretical and experimental results, which indicates that wave propagation in a tunnel environment can be realistically modeled by ray tracing. A good fit between the scale model experiments and the simulation demonstrates that scale models can be used to imitate real-world experiments in a laboratory environment.

2. Properties of Tunnels and Systems and Their Effect on Propagation

Radio wave propagation along a tunnel depends on the position, radiation pattern, and the emission polarization of the transmitting and receiving antenna [22,23,24]. The attenuation can be lowered by using a directional antenna with a suitable radiation pattern. While omnidirectional antennas do offer wider coverage for areas without line of sight (LOS) rays in a tunnel, their performance is surpassed by directional antennas in areas with LOS rays [19,25]. The optimal position of the transmitter is at the center of the cross section of the tunnel, while a transmitter positioned near the walls has the worst propagation properties [24,26].
In empty, straight, narrow, high, rectangular tunnels, as long as the dielectric constants of the side walls, ceiling, and floor are approximately equal, when the width of the tunnel is smaller than its height, vertically polarized waves are shown to be attenuated less than horizontally polarized waves [27]. When the width is greater than the height, the opposite is true [24,28]. This can be understood using modal expansion of the propagating field while considering the dimensions of the horizontal cross section [22]. The attenuation decreases when the dimensions are increased in relation to the wavelength. In addition, the reflection coefficients of the floor and ceiling are larger than that of the walls, which contributes an additional large factor of attenuation for vertically polarized electromagnetic waves [22]. In general, to achieve minimal attenuation in a rectangular tunnel, the polarization of the electric field must be coincident with the largest side-to-side dimension of the tunnel.

3. Scaling the Ray Tracing Model

The choice of wave propagation model largely depends on the type of tunnel and its dimensions. In our model we assumed a straight concrete rectangular tunnel with smooth walls. We employed the ray-tracing approach for simplicity of calculation and physical explanation for this kind of tunnel.
In ray tracing, the propagation of the signal depends on the number of rays arriving at the receiver location. This includes the LOS rays, reflected waves, diffracted waves, and scattered waves [12,29,30]. The received power P r ( T u n n e l ) , normalized by the LOS link budget P r ( L O S ) for a distance P r ( 0 ,   0 ) between the transmitter and the receiver, is given by the following ratio [4]:
P r ( T u n n e l ) P r ( L O S ) = | m = + n = + Γ | m | ( θ m ) Γ | n | ( θ n ) G [ m , n ] G [ 0 ,   0 ] R [ 0 ,   0 ] R [ m , n ] e j 2 π λ [ R ( m , n ) R ( 0 ,   0 ) ] | 2 ,
where λ = c / f is the wavelength at wave frequency f (c is the light in a vacuum), m and n are indices of rays traveling and reflected from the walls, ceiling and floor of the tunnel,   R ( m , n ) is the path propagation length of the ( m , n ) ray, for which the corresponding antenna gain is G [ m , n ] = G t [ m , n ] G r [ m , n ] ( G t [ m , n ] , and G r [ m , n ] are the gains of the transmitting and receiving antennas, respectively). θ m and θ n are the incidence angles between the ( m , n ) ray and the corresponsive surface in the horizontal (ceiling or floor) and vertical (walls) dimensions respectively. Γ ( θ m ) and Γ ( θ n )   are the reflection coefficients from the surface for the m and n incident ray. The received power in the LOS path ( m = 0 , n = 0 ) is given by the Friis formula:
P r ( L O S ) = G r [ 0 , 0 ] ( λ 4 π R ( 0 ,   0 ) ) G t [ 0 ,   0 ] P t ,
where P t is the transmitted power. Assuming that the transmitter and the receiver are both located at the center of the tunnel cross-section, the travelling range R [ m , n ] of ray [ m , n ] along the tunnel is described by [31]
R [ m , n ] = R [ 0 ,   0 ] 1 + [ m W R [ 0 ,   0 ] ] 2 + [ n H R [ 0 ,   0 ] ] 2 ,
where W and H are the width and height of the rectangular tunnel, respectively. Inspection of Equations (1) and (2) reveals a non-dimensional parameter R [ 0 , 0 ] / λ , which can be used for scaling. Equation (3) describes the overall path length along which the ( m , n ) ray is traveling from the transmitting antenna until it arrives at the antenna of the receiver. Introducing this parameter into Equation (3) results in two additional scaling ratios W / λ and H / λ . We further show that by keeping these ratios, a scaling model of a long tunnel can be constructed demonstrating an identical link budget.
For all our examined cases, the tunnel surfaces were sufficiently smooth and their roughness depth δ satisfied the Rayleigh criterion δ λ / [ 8 sin ( θ ) ] . This allowed the utilization of Fresnel equations for calculating the wall’s reflection coefficients Γ ( θ ) for the vertically or horizontally polarized ray [32]:
Γ ( θ ) = { ε r sin θ V ε r cos 2 θ V ε r sin θ V + ε r cos 2 θ V                   V e r t i c a l ,       sin θ H ε r cos 2 θ H sin θ H + ε r cos 2 θ H                   H o r i z o n t a l ,
where ε r is the dielectric coefficient of the building material composing the wall. Using the ray optic simulation [33], the top and bottom ray illustrations of Figure 1 demonstrate the reflection from the side walls and ceiling/floor, respectively, for the case when W < H . When summed, the phase-shift between rays results in constructive and destructive interferences, causing power fluctuations along the tunnel.
In general, the model does not specify the total number of reflected rays playing roles in the link budget (1). When omni-directional antennas are used, there is, in principle, a large number of reflection paths between the transmitter and the receiver antennas. However, the high order rays are attenuated due to the multiple reflections, and their contribution to the overall link budget is negligible (as discussed in [31]). Employing directive antennas results in even a smaller number of contributing rays determined by the transmitting antenna beam width and by the field of view of the receiving antenna. In directive links, the number of rays can be evaluated via the beam-width of the antenna; Θ v in the vertical and Θ h in the horizontal dimensions according to:
M = i n t [ R ( 0 ,   0 ) H tan ( Θ v   2 ) ] ,     V e r t i c a l ,
N = i n t [ R ( 0 ,   0 ) W tan ( Θ h   2 ) ] ,     H o r i z o n t a l .
We note that the received power is a result of a coherent summation of the ensemble of rays arriving at the receiving antenna and collected by its aperture. This effect is considered via the antenna gain G [ m , n ] for each of the ( m , n ) propagating ray directions.
The study was performed in a 75 m pedestrian tunnel made of concrete, with height H = 1.85   m and width W = 1   m , as shown in Figure 2.
The received signal strength was measured along the tunnel at intervals of 25 cm between measurements. The measurements were performed for three frequencies: 1, 2.4, and 10 GHz, while 94 GHz was used in a 1/10th down-scaled model. Table 1 summarizes the parameters of the different experiments in UHF, SHF, and W-band regimes.
The graphs in Figure 3 show the results of link budget simulations along a tunnel with concrete walls for the three frequencies 1, 2.4, and 10 GHz. Since the dielectric permittivity ε r of concrete is spread between 6 and 8, depending on its ingredients and condition [34], a comparison was made between the expected results for different permittivity values. Figure 3 shows an almost identical expected performance.

4. Experiments in a Rectangular Pedestrian Tunnel

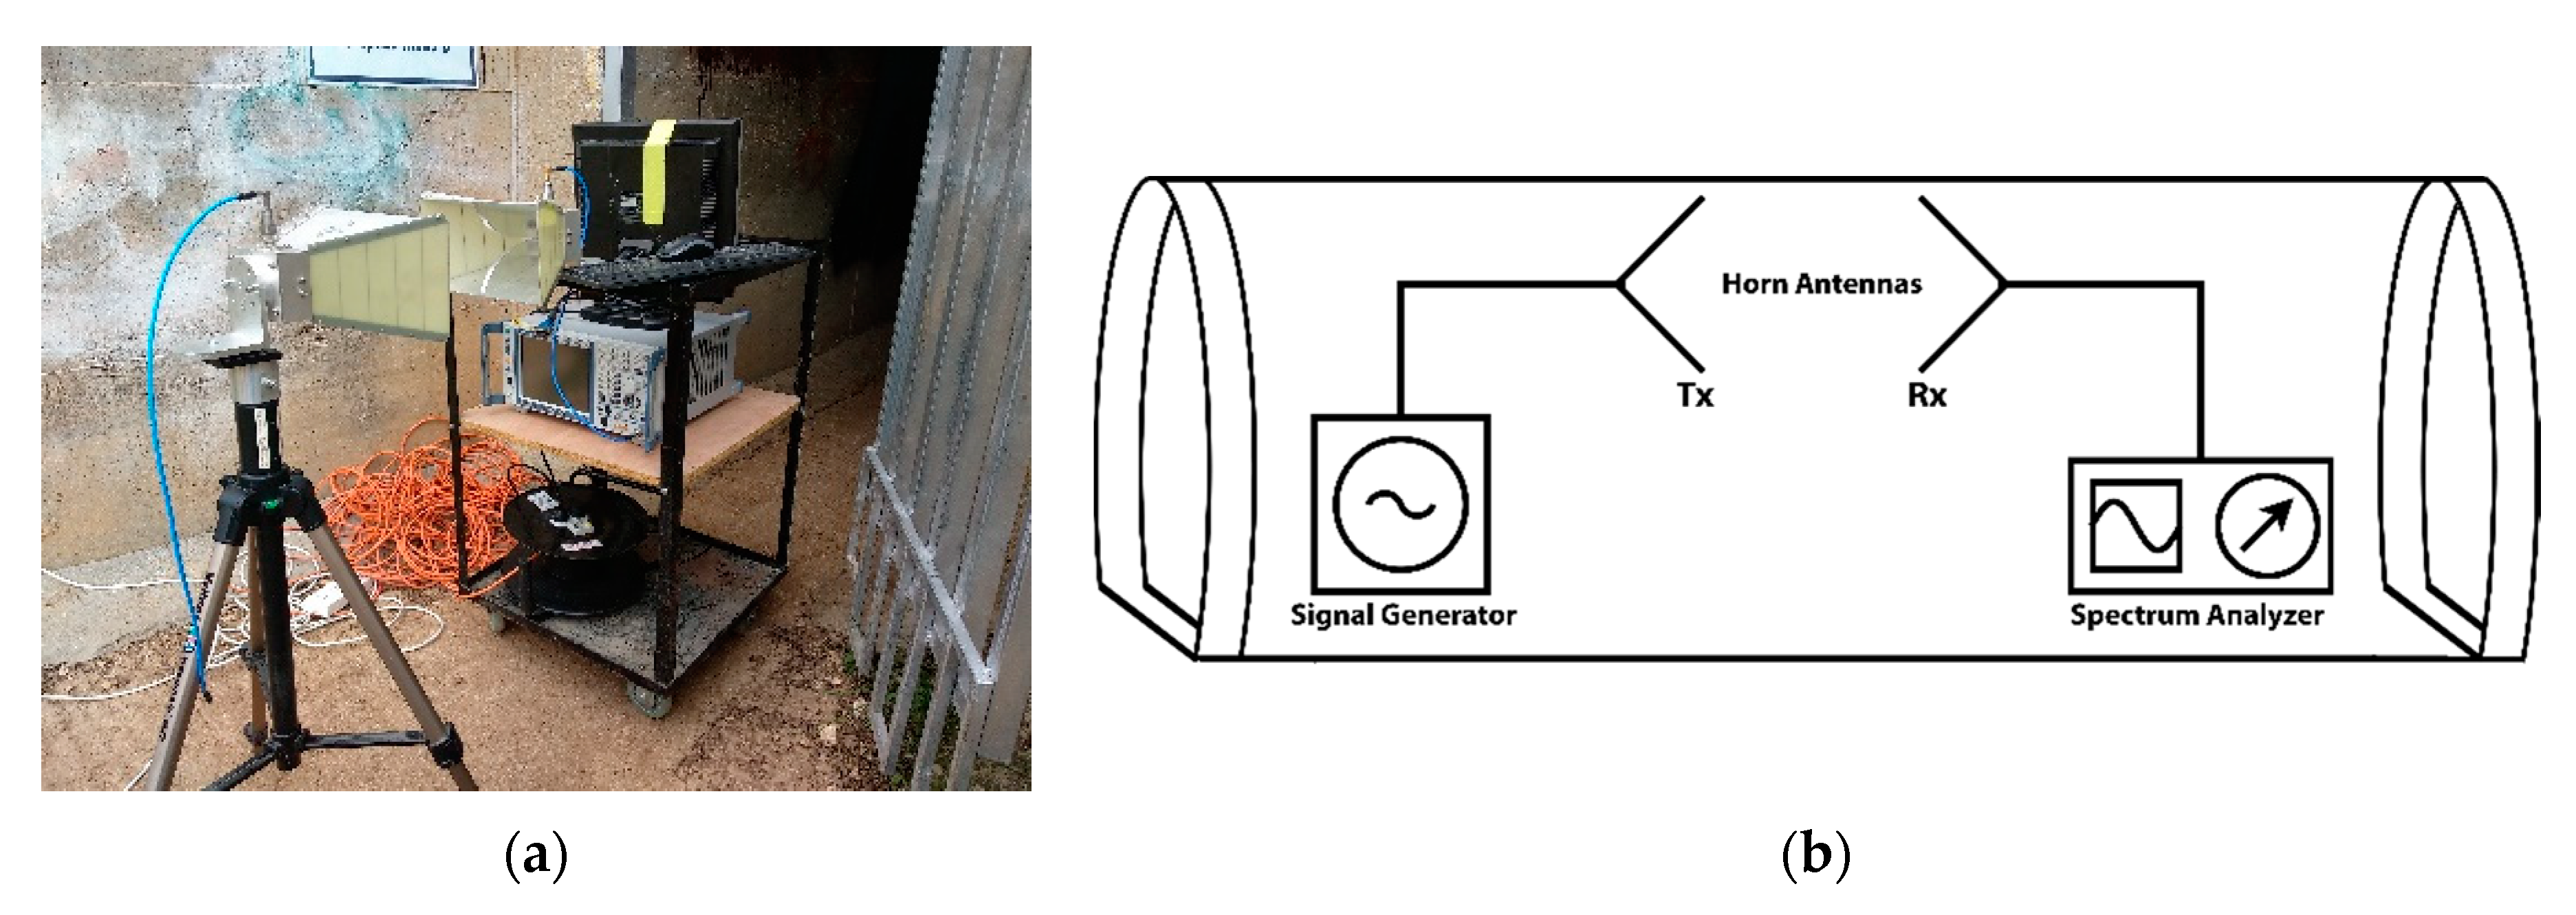
The experimental system is shown in Figure 4. It consists of a transmission system T x and a receiver R x . The transmitter was based on a 9 kHz–20 GHz analog signal generator (KEYSIGHT EXG N5173B), set for a continuous wave transmission with a Continuous Waveform (CW) power of 19 dBm, fed to a 1–18 GHz Broadband Horn Antenna (A-INFO JXTXLB-10180), with a gain of 4.97 dBi (at 1 GHz), 13.2 dBi (at 2.4 GHz) and 12.69 dBi (at 10 GHz). The A-INFO antenna cross-section is 244 × 164 mm 2 . This type of antenna was also used at the receiver site, which was connected to a spectrum analyzer for measuring the received signal power and frequency. Its high dynamic range and sensitivity allow measuring even very low level of received power, well below the minimum measured signal power, which was in the experiment −60 dBm. The R x   antenna and the spectrum analyzer were placed on a mobile cart. The T x   antenna was mounted on a tripod, as shown in Figure 4a.
Both the transmitting and receiving antennas were placed at the center of a tunnel cross-section, with smooth concrete walls and with a rectangular cross-section as shown in Figure 4b. The measurements were taken for the UHF and SHF bands, from 4 m between the antennas in order to fulfill far-field conditions and avoiding near-field measurements, ending at 45 m, with the receiver being moved in steps of 25   cm . The position of the receiver antenna relative to the center of the tunnel was verified at every step to ensure the measurements were consistent.
A comparison between the simulation and the experimental results of wave propagation along the tunnel for the three frequencies is shown in Figure 5. The rest of the physical parameters, including the height, width, antenna location, and frequency, were identical to those of the experimental scenario. In the experiment, the Minimum Detectible Signal (MDS) power was set to −80 dBm. It was well above the minimum measured signal power which was −60 dBm. The graphs show that the simulations based on ray tracing had correlated well with the measured results for all three frequencies, which confirms that ray tracing is suitable for modeling radio wave propagation in tunnels in the UHF and SHF regimes. The measured signal power is a result of coherent summation of the ensemble of rays propagating from the transmitting horn and arriving at the receiving horn aperture. The spectrum analyzer shows the total resulted power collected by the receiving horn.
Inspection of the experimental measurements in Figure 5 reveals a good fit with the simulation results. The main discrepancy is due to the limited dynamic range of the receiver that cannot measure low power dips emerging when distractive interferences occur. Taking into account this limitation, the experimental results show that the link between the budget estimation with the ray-tracing model is also reliable for wireless communication links operating in narrow tunnels or corridors.

5. Scale Model Experiments in the SHF and the MMWs Regime

As field experiments in an underground tunnel often prove to be difficult, an experiment in a miniaturized environment in which physical properties are maintained is preferable. Scaling models have previously been shown to be useful for radio wave propagation in tunnels [5,6,13]. In our case, we used a subscale 1/10th tunnel model, as summarized in Table 2.
The system for the scaled experiments was based on the schematics presented in Figure 4b. For the W-band experiment at a frequency of 94 GHz, the transmitter T x consisted of a signal generator outputting a CW signal at a constant power of 17 dBm. The CW signal was fed to a standard W-band (75–110 GHz) horn antenna (QUINSTAR QGH-WPRR00), with cross-section of 25 × 20 mm 2 and gain of 24 dBi. The receiving system R x had a detector with an RF gain of 10 dB and a receiving antenna is the same as the transmitting one. For the X-band experiment at a frequency of 10 GHz, we used a homemade horn antenna with cross-section of 45 × 25 mm 2 and 10.8 dBi gain, at the transmitter. The receiving homemade horn antenna was of 15.7 dBi gain (cross-section of 55 × 50 mm 2 ). It was connected to the power detector sensor. The antenna data are summarized in Table 3.
For both W-band and X-band measurements, the antennas were attached to the same adjustable stands. The transmitter antenna remains stationary, while the receiving one was moved along a rail installed inside the scaled tunnel model, as shown in Figure 6b. The signal generator and the receiving system were both located outside of the tunnel model. The horn antennas collect all rays arriving at their aperture, and the power measured is a result of a coherent summation of all contributing rays. Knowing the antenna aperture, the corresponding gain is considered in the multi-ray simulation.
A sub-scale tunnel-like model was built. The scale model is presented in Figure 6. It represents a 1/10th down-scaled version of the real pedestrian tunnel and was constructed using 4.8 m plates made of Formica, with straight, smooth walls, and a rectangular shape with height H = 0.2   m and width W = 0.1   m . The sub-scaled ratio was chosen to fit the experimental setup in a lab environment, and the frequency was up-scaled corresponding with the dimensions of the tunnel by the same ratio. Although the electromagnetic properties of the real tunnel were not scaled exactly in the lab model, the impact of this mismatching proved to be negligible.
The transmitting and receiving antennas were placed at the center of the down-scaled tunnel cross-section. The measurements started at the respective far field at a distance between the antennas from 0.4 m up to 4.5 m. The receiving antenna was moved in steps of 2   cm while carefully maintaining the antennas position relative to the walls.
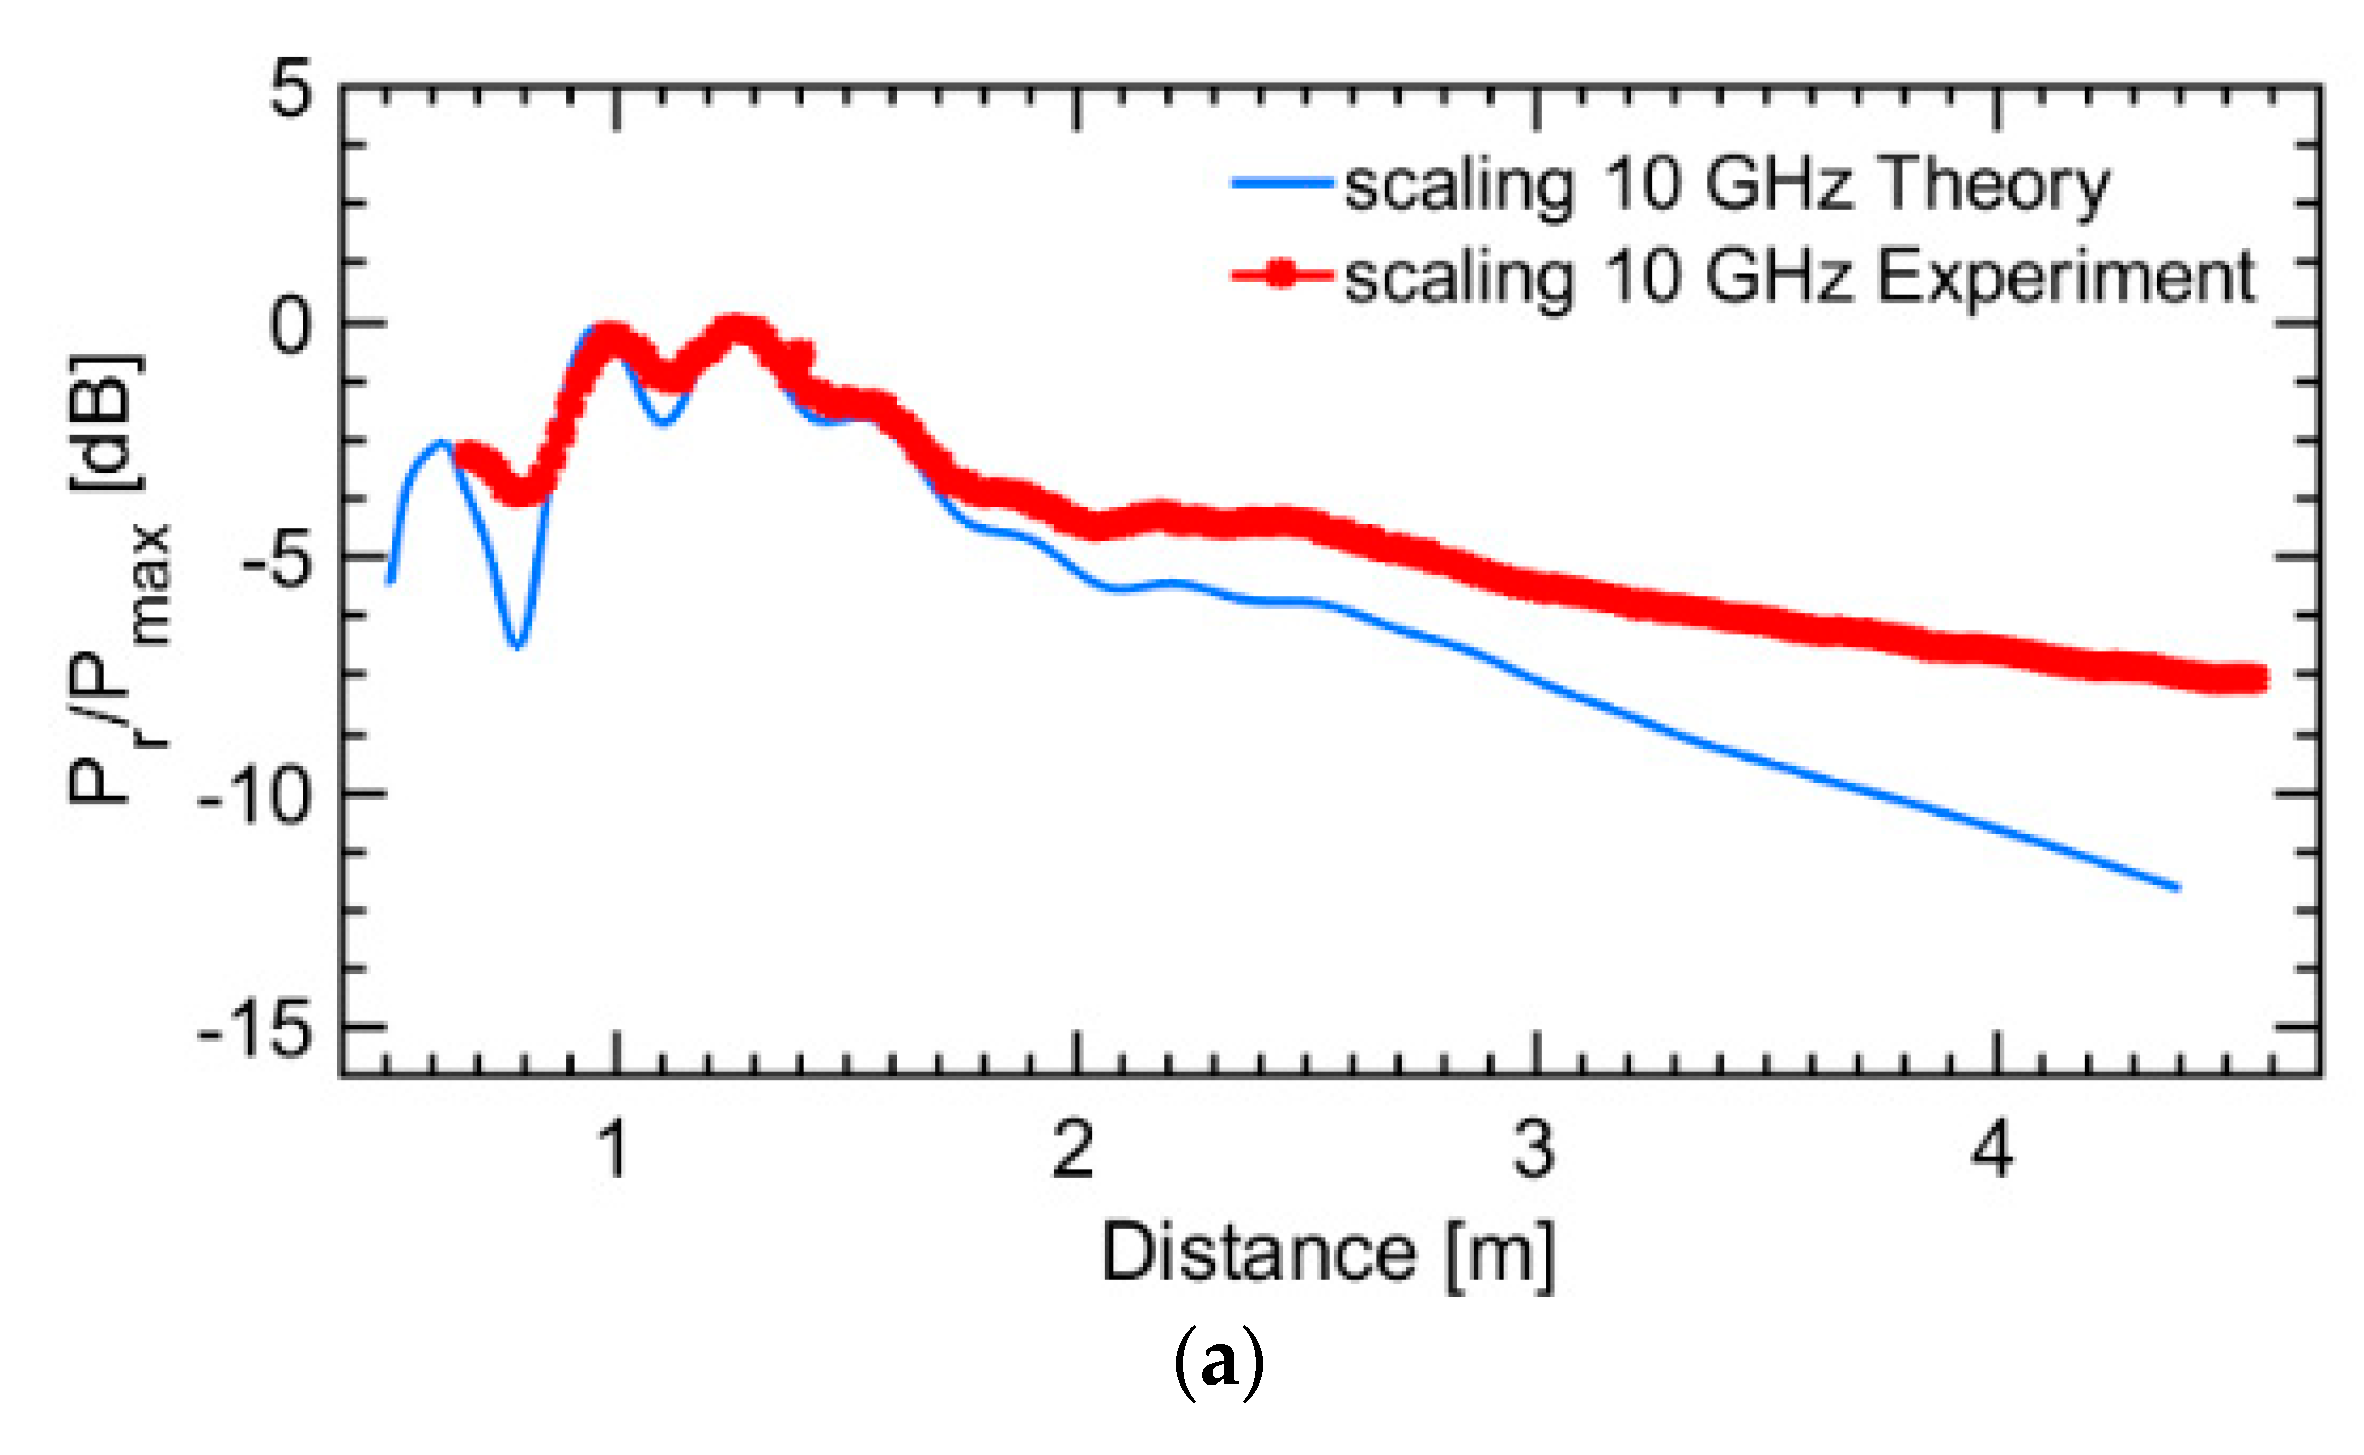
As with the field experiments, the experiment was performed by measuring the power as a function of distance between the antennas inside the tunnel. Figure 7 shows a comparison between the simulation and the experiments for the normalized results of wave propagation for frequencies of 10 and 94 GHz.
The same dielectric pror4perties as in the field experiment were used in the simulations for both frequencies and of the scaled tunnel model in the laboratory. For this experiment, in addition to the measured power inside the tunnel, the power permeating through the walls of the tunnel laboratory model was also monitored. The transmitting and receiving antennas were placed inside the tunnel. For the 94 GHz experiment, the measured permeating power was negligible, while for 10 GHz some leakage was observed.
Figure 7 demonstrates a relatively good agreement between the measurement results and those obtained from the simulations. The main difference is revealed in the dips, and especially in the case of the received power at the W-band experiments, where the wavelengths is 3 mm. These discrepancies are explained due to the limited dynamic range and the sensitivity of the detection. Further, note that the received power was measured in discrete locations along the tunnel. Given these differences, the results demonstrate that link budget estimations using down scaled model are sufficiently reliable for practical scenarios.
The results obtained during the scaled experiments show that precise scale models, constructed to maintain the physical properties of the ratio of wavelength to tunnel dimensions, can be used to simulate and predict the wave propagation in tunnel environments. The results also show that simulations based on the ray tracing models correlated well with the field experiments and the scaled experiments.

6. Conclusions

Evaluation of the radio wave propagation in an underground tunnel environment is important for the appropriate design of wireless links and networks. We demonstrated that link budget estimation for UHF and SHF links can be performed using multi-ray simulations and verified this experimentally by using down-scaled structures.
In this paper, we have reported a series of experiments for measuring wave propagation in underground pedestrian tunnels as well as in a subscale laboratory model. We demonstrated that our simulations based on a modified ray tracing method were suitable for predicting the wave propagation in a tunnel for different frequencies and showed that a scale model in a laboratory environment can be a suitable replacement for field experiments.

Author Contributions

Conceptualization, Y.P., G.A.P., N.B., and J.G.; methodology, Y.P., G.A.P., N.B., and J.G.; software, G.A.P., J.G., and E.B.; validation, Y.P., G.A.P., N.B., and E.L.; formal analysis, Y.P., G.A.P., J.G, Y.R., and M.G.; investigation, J.G. and Y.P.; resources, J.G. and Y.P.; data curation, J.G., Y.R., and N.B.; writing, original draft preparation, J.G.; writing, review, and editing, J.G., E.L., Y.P., and G.A.P.; visualization, J.G., M.G., and Y.P.; supervision, G.A.P. and Y.P.; project administration, Y.P.; funding acquisition, Y.P. and G.A.P. All authors have read and agreed to the published version of the manuscript.

Funding

This research received no external funding.

Institutional Review Board Statement

Not applicable.

Informed Consent Statement

Not applicable.

Data Availability Statement

Not applicable.

Conflicts of Interest

The authors declare no conflict of interest.

References

  1. Forooshani, A.E.; Bashir, S.; Michelson, D.G.; Noghanian, S. A survey of wireless communications and propagation modeling in underground mines. IEEE Commun. Surv. Tutor. 2013, 15, 1524–1545. [Google Scholar] [CrossRef]
  2. Yarkan, S.; Güzelgöz, S.; Arslan, H.; Murphy, R. Underground mine communications: A survey. IEEE Commun. Surv. Tutor. 2009, 11, 125–142. [Google Scholar] [CrossRef]
  3. Hrovat, A.; Kandus, G.; Javornik, T. A Survey of radio propagation modeling for tunnels. IEEE Commun. Surv. Tutor. 2014, 16, 658–669. [Google Scholar] [CrossRef]
  4. Zhou, C.; Plass, T.; Jacksha, R.; Waynert, J.A. RF Propagation in Mines and Tunnels. IEEE Antennas Propag. Mag. 2015, 57, 88–102. [Google Scholar] [CrossRef]
  5. Jacard, B.; Maldonado, O. Microwave Modeling of Rectangular Tunnels. IEEE Trans. Microw. Theory Tech. 1984, 32, 576–581. [Google Scholar] [CrossRef]
  6. Yamaguchi, Y.; Abe, T.; Sekiguchi, T. Radio Wave Propagation Loss in the VHF to Microwave Region Due to Vehicles in Tunnels. IEEE Trans. Electromagn. Compat. 1989, 31, 87–91. [Google Scholar] [CrossRef]
  7. Lee, J.; Bertoni, H.L. Coupling at cross, T, and L junctions in tunnels and urban street canyons. IEEE Trans. Antennas Propag. 2003, 51, 926–935. [Google Scholar] [CrossRef]
  8. Li, F.; Han, P.; Wu, X.; Xu, W. Research of UWB signal propagation attenuation model in coal mine. In Lecture Notes in Computer Science (Including Subseries Lecture Notes in Artificial Intelligence and Lecture Notes in Bioinformatics); Springer: Berlin/Heidelberg, Germany, 2007; Volume 4611, pp. 819–828. [Google Scholar] [CrossRef]
  9. Zhang, Y.P.; Hwang, Y. Enhancement of rectangular tunnel waveguide model. In Proceedings of the Asia-Pacific Microwave Conference, APMC, Hong Kong, China, 2–5 December 1997; Volume 1, pp. 197–200. [Google Scholar] [CrossRef]
  10. Zhang, Y.P. Novel model for propagation loss prediction in tunnels. IEEE Trans. Veh. Technol. 2003, 52, 1308–1314. [Google Scholar] [CrossRef]
  11. Wang, T.S.; Yang, C.F. Simulations and measurements of wave propagations in curved road tunnels for signals from GSM base stations. IEEE Trans. Antennas Propag. 2006, 54, 2577–2584. [Google Scholar] [CrossRef]
  12. Jia, M.; Zheng, G.; Ji, W. A new model for predicting the characteristic of RF propagation in rectangular tunnel. In Proceedings of the 2008 China-Japan Joint Microwave Conference, CJMW, Shanghai, China, 10–12 September 2008; Volume 1, pp. 268–270. [Google Scholar] [CrossRef]
  13. Didascalou, D.; Schäfer, T.M.; Weinmann, F.; Wiesbeck, W. Ray-density normalization for ray-optical wave propagation modeling in arbitrarily shaped tunnels. IEEE Trans. Antennas Propag. 2000, 48, 1316–1325. [Google Scholar] [CrossRef]
  14. Rana, M.M.; Mohan, A.S. Segmented-locally-one-dimensional-FDTD method for em propagation inside large complex tunnel environments. IEEE Trans. Magn. 2012, 48, 223–226. [Google Scholar] [CrossRef]
  15. Bernardi, P.; Caratelli, D.; Cicchetti, R.; Schena, V.; Testa, O. A numerical scheme for the solution of the vector parabolic equation governing the radio wave propagation in straight and curved rectangular tunnels. IEEE Trans. Antennas Propag. 2009, 57, 3249–3257. [Google Scholar] [CrossRef]
  16. Martelly, R.; Janaswamy, R. An ADI-PE approach for modeling radio transmission loss in tunnels. IEEE Trans. Antennas Propag. 2009, 57, 1759–1770. [Google Scholar] [CrossRef]
  17. Martelly, R.; Janaswamy, R. Modeling radio transmission loss in curved, branched and rough-walled tunnels with the adi-pe method. IEEE Trans. Antennas Propag. 2010, 58, 2037–2045. [Google Scholar] [CrossRef]
  18. Carter, R. The Method of Moments in Electromagnetics, by W.C. Gibson. Contemp. Phys. 2010, 51, 183–184. [Google Scholar] [CrossRef]
  19. Yang, X.; Lu, Y. Research on propagation characteristics of millimeter wave in tunnels. Int. J. Infrared Millim. Waves 2007, 28, 901–909. [Google Scholar] [CrossRef]
  20. Didascalou, D.; Maurer, J.; Wiesbeck, W. Natural wave propagation in subway tunnels at mobile communications frequencies. IEEE Veh. Technol. Conf. 2000, 3, 2009–2013. [Google Scholar] [CrossRef]
  21. Didascalou, D.; Maurer, J.; Wiesbeck, W. Subway tunnel guided electromagnetic wave propagation at mobile communications frequencies. IEEE Trans. Antennas Propag. 2001, 49, 1590–1596. [Google Scholar] [CrossRef]
  22. Sun, Z.; Akyildiz, I.F. Channel modeling and analysis for wireless networks in underground mines and road tunnels. IEEE Trans. Commun. 2010, 58, 1758–1768. [Google Scholar] [CrossRef]
  23. Molina-Garcia-Pardo, J.M.; Lienard, M.; Stefanut, P.; Degauque, P. Modeling and understanding MIMO propagation in tunnels. J. Commun. 2009, 4, 241–247. [Google Scholar] [CrossRef]
  24. Wang, S. Radio Wave Attenuation Character in the Confined Environments of Rectangular Mine Tunnel. Mod. Appl. Sci. 2010, 4, 65–70. [Google Scholar] [CrossRef] [Green Version]
  25. Rissafi, Y.; Talbi, L.; Ghaddar, M. Experimental characterization of an UWB propagation channel in underground mines. IEEE Trans. Antennas Propag. 2012, 60, 240–246. [Google Scholar] [CrossRef]
  26. Han, X.; Wang, S.; Fang, T.; Guo, Z. Propagation character of electromagnetic wave of the different transmitter position in mine tunnel. In Proceedings of the International Conference on Networks Security, Wireless Communications and Trusted Computing, NSWCTC 2009, Wuhan, China, 25–26 April 2009; Volume 1, pp. 530–533. [Google Scholar] [CrossRef]
  27. Zhang, Y.P.; Zhang, W.M.; Sheng, J.H.; Zheng, G.X. Radio propagation at 900 MHz in underground coal mines. Meitan Xuebao/J. China Coal Soc. 2002, 27, 83. [Google Scholar] [CrossRef]
  28. Cheng, L.; Zhang, P. Influence of dimension change on radio wave propagation in rectangular tunnels. In Proceedings of the 5th International Conference on Wireless Communications, Networking and Mobile Computing, WiCOM 2009, Beijing, China, 24–26 September 2009; pp. 9–11. [Google Scholar] [CrossRef]
  29. Hemalatha, A.B.R.; Savithri, T.S. Development of an Optimized Ray Tracing Path Loss Model in the Indoor Environment. Wirel. Pers. Commun. 2017, 96, 1039–1064. [Google Scholar] [CrossRef]
  30. Yao, S.H.; Wu, X.L. Electromagnetic waves multi-path model based on image approach in tunnels. In Proceedings of the 2011 International Conference on Electric Information and Control Engineering, ICEICE 2011, Wuhan, China, 15–17 April 2011; pp. 2150–2153. [Google Scholar] [CrossRef]
  31. Rapaport, L.; Pinhasi, G.A.; Pinhasi, Y. Millimeter Wave Propagation in Long Corridors and Tunnels—Theoretical Model and Experimental Verification. Electronics 2020, 9, 707. [Google Scholar] [CrossRef]
  32. Rappaport, T.S. Wireless Communications Principles and Practice, 2nd ed.; Prentice Hall: Upper Saddle River, NJ, USA, 2002. [Google Scholar]
  33. Available online: https://ricktu288.github.io/ray-optics/ (accessed on 1 January 2020).
  34. Olkkonen, M.; Mikhnev, V. Complex Permittivity of Concrete in the Frequency. In Proceedings of the 2013 7th European Conference on Antennas and Propagation (EuCAP), Gothenburg, Sweden, 8–12 April 2013; pp. 3319–3321. [Google Scholar]
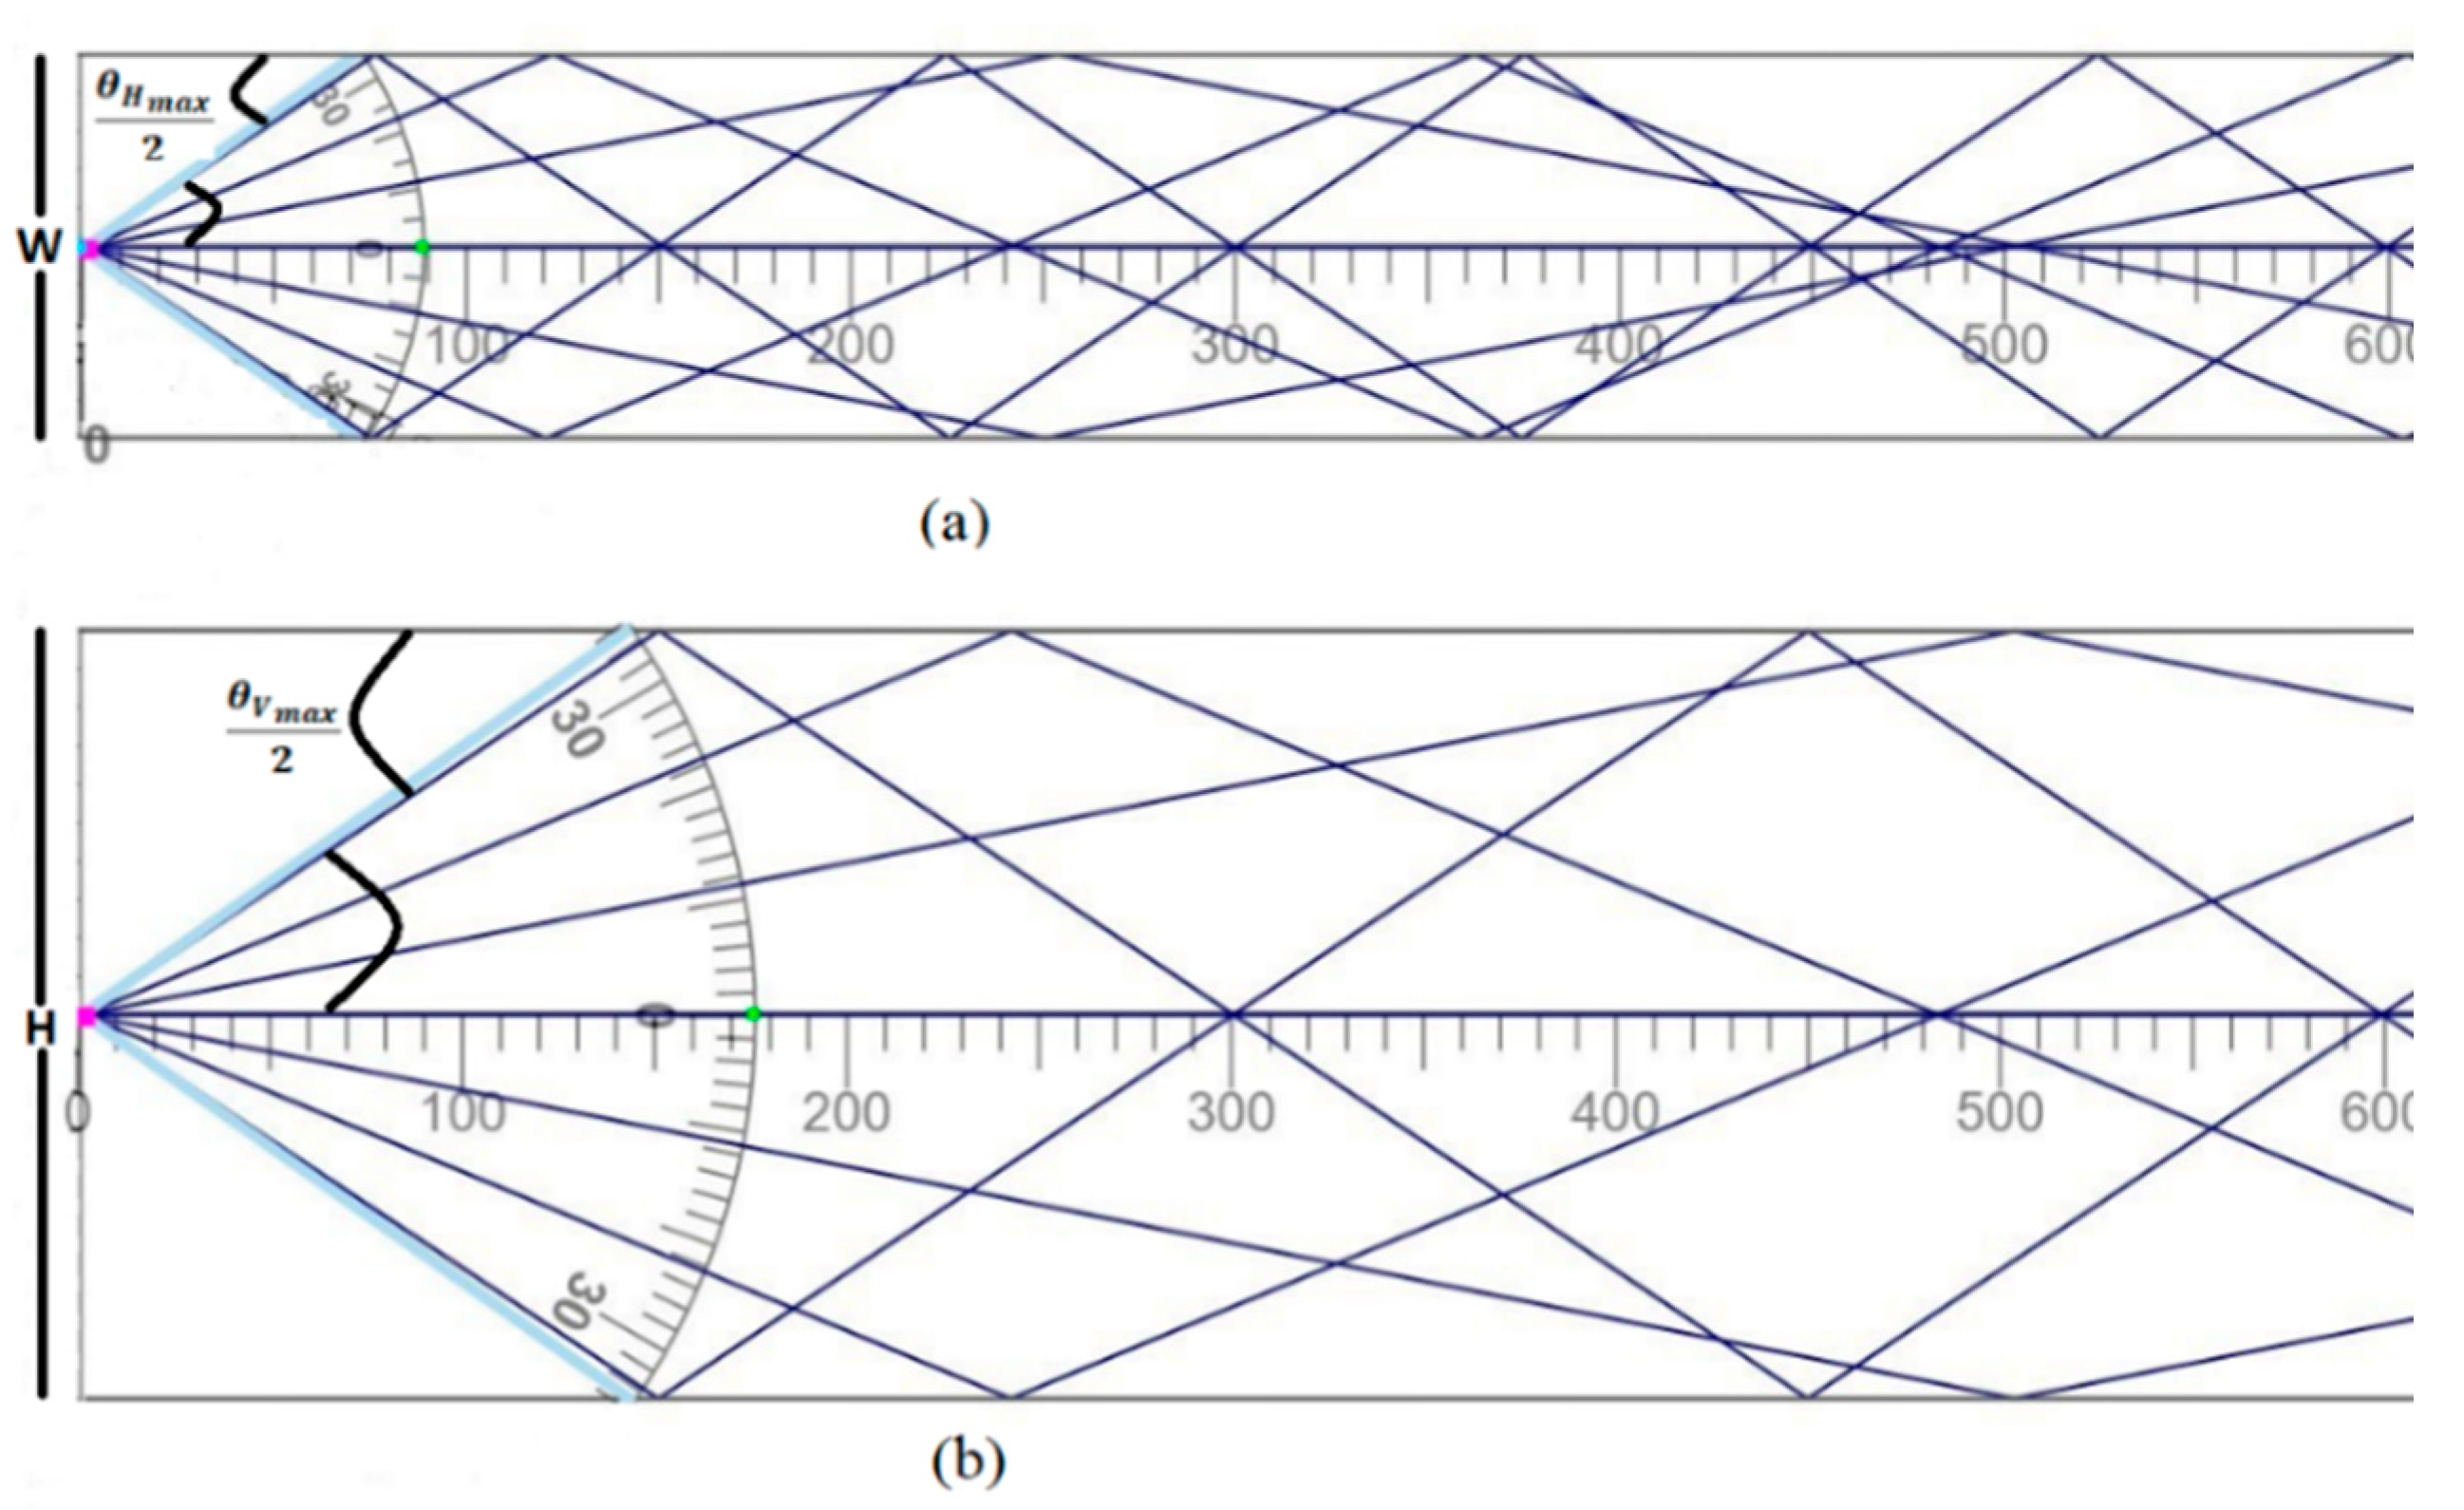
Figure 1. A two-dimensional illustration of ray tracing inside a tunnel from the (a) side walls, and (b) ceiling/floor reflections.
Electronics 10 00053 g001
Figure 2. Straight tunnel with concrete walls of rectangular profile with a height of 1.85 m, width of 1 m (a) a schema, and (b) a real tunnel.
Electronics 10 00053 g002
Figure 3. Simulations of the link budget along a pedestrian concrete tunnel considering different permittivity values for frequencies of (a) UHF 1 GHz, (b) UHF 2.4 GHz, and (c) SHF 10 GHz.
Electronics 10 00053 g003aElectronics 10 00053 g003b
Figure 4. (a) Experimental setup in the tunnel, and (b) block diagram of experimental setup.
Electronics 10 00053 g004
Figure 5. Normalized results of the field experiments and simulation as a function of distance in a rectangular tunnel for different frequencies of (a) UHF 1 GHz, (b) UHF 2.4 GHz, and (c) SHF 10 GHz.
Electronics 10 00053 g005aElectronics 10 00053 g005b
Figure 6. Scale tunnel model built out of Formica of rectangular profile with a height of 0.2 m and width of 0.1 m (a) a schema, and (b) a real tunnel model.
Electronics 10 00053 g006
Figure 7. Normalized results of the scale model experiments and simulation as a function of distance for frequencies of (a) SHF 10 GHz, and (b) MMW 94 GHz.
Electronics 10 00053 g007aElectronics 10 00053 g007b
Table 1. Wave frequencies and respective scaling ratios.
BandUHF
Real Tunnel
UHF
Real Tunnel
SHF
Real Tunnel and Scaling for 1 GHz
W-Band
Scaling for 10 GHz
Frequency (GHz)12.41094
Wavelength (cm)29.9812.492.9983.19
W / λ 3.3358.00633.35313.5
H / λ 6.1714.8161.7579.9
Table 2. Parameters of the real tunnel and its subscale model.
Band UHFReal
Tunnel
SHF
Scaling for 1 GHz
SHF
Real Tunnel
W-Band
Scaling for 10 GHz
Frequency (GHz)1101094
Wavelength (cm) λ = 29.98 λ / S = 2.998 λ = 2.998 λ / S = 3.19
Width (m) W = 1 W / S = 0.1 W = 1 W / S = 0.1
Height (m) H = 1.85 H / S 0.2 H = 1.85 H / S 0.2
Antenna Aperture (deg) Θ v 70 o Θ v 30 o Θ v 70 o Θ v 30 o
Θ h 30 o Θ h 8 o Θ h 30 o Θ h 8 o
Table 3. Antennas used in the real tunnel experiments and their counterparts used in the respective scale models for frequencies of 1, 10, and 94 GHz.
Horn AntennaFrequency (GHz)Gain (dBi)H-Plane 3 dB Beamwidth (deg)E-Plane 3 dB Beamwidth (deg)
A-INFO14.977170
X-Band Gray1015.73330.6
X-Band Black1010.861.247.7
A-INFO1012.693533.4
W-Band94248.88.2
Publisher’s Note: MDPI stays neutral with regard to jurisdictional claims in published maps and institutional affiliations.