Article

Development of Frequency Weighted Model Reduction Algorithm with Error Bound: Application to Doubly Fed Induction Generator Based Wind Turbines for Power System

1
Department of Electrical Engineering, College of Electrical and Mechanical Engineering (CEME), National University of Sciences and Technology (NUST), Islamabad 44000, Pakistan
2
Department of Electrical Engineering, Military College of Signals (MCS), NUST, Rawalpindi 46000, Pakistan
3
Research Centre For Modelling and Simulation (RCMS), Department of Computational Engineering,NUST, Islamabad 44000, Pakistan
*
Author to whom correspondence should be addressed.
These authors contributed equally to this work.
Electronics 2021, 10(1), 44; https://doi.org/10.3390/electronics10010044
Submission received: 24 November 2020 / Revised: 15 December 2020 / Accepted: 21 December 2020 / Published: 29 December 2020
(This article belongs to the Section Systems & Control Engineering)

Abstract

:
The state-space representations grant a convenient, compact, and elegant way to examine the induction and synchronous generator-based wind turbines, with facts readily available for stability, controllability, and observability analysis. The state-space models are used to look into the functionality of different wind turbine technologies to fulfill grid code requirements. This paper deals with the model order reduction of the Variable-Speed Wind Turbines model with the aid of improved stability preserving a balanced realization algorithm based on frequency weighting. The algorithm, which is in view of balanced realization based on frequency weighting, can be utilized for reducing the order of the system. Balanced realization based model design uses a full frequency spectrum to perform the model reduction. However, it is not possible practically to use the full frequency spectrum. The Variable-Speed Wind Turbines model utilized in this paper is stable and includes various input-output states. This brings a complicated state of affairs for analysis, control, and design of the full-scale system. The proposed work produces steady and precise outcomes such as in contrast to conventional reduction methods which shows the efficacy of the proposed algorithm.

1. Introduction

Among the available sources of energy such as oil, gas coal, and nuclear, the wind is recognized as an infinite source of clean energy. Wind energy has reduced the sole reliance on fossil fuel means. During the last two decades, the rapid growth of wind power plants is observed all over the world [1,2,3,4]. According to the global wind energy council (GWEC), by the completion of the year 2019, the total cumulative installed capacity of wind energy was 60.4 GW [5] around the globe, which is a 19% globally increase from installation in 2018 [6]. Moreover, the second-best year for wind energy historically. The total cumulative installed capacity for wind energy is 651 GW around the globe, a 10% increase compared to 2018 (see GWEC for more detail). Continual change in speed, density, and temperature round the clock is the main issue with wind energy. Therefore the integration of the wind masts with the grid needs to be governed by certain policies, known as grid codes, to avoid the undesirable impact on the grid power [1,7,8,9]. The developed grid codes are different for the different countries depending upon their environmental conditions and operational constraints [10,11]. However, wind farms need their disturbance less connection with the grid similar to that of a conventional power plant. In this regard a noble grid code essentially covers the following [12]:
  • Ranges:
    • Voltage operating range;
    • Frequency operating range.
  • Controls:
    • Active power control;
    • Frequency control;
    • Voltage control;
    • Reactive power control;
    • Communications and external control.
  • Rides Through:
    • Low voltage ride through (LVRT);
    • High voltage ride through (HVRT).
  • Power quality;
  • Wind farm modeling and verification.
Traditionally three types of power generation machines are used in wind turbines to convert wind energy into electrical energy. These are Squirrel (single/double) Cage Induction Generator (SCIG), Doubly Fed (wound rotor) Induction Generator (DFIG), and Permanent Magnet Synchronous Generator (PMSG). Among the said three generators, the DFIG has shown a good performance during LVRT and remained connected to the power grid. DFIGs are frequently being used in the wind energy conversion systems due to the distinguished features of handling of variable speed, easy to control, higher energy efficiency, and improved power quality [13]. Nevertheless, Squirrel Cage Induction Machines (SCIM) equipped with reactive power compensators are also used in wind energy conversion systems because of their simplicity [14], low cost, and robustness. The SCIM with an additional cage, also called double squirrel cage, has higher-order complexity as compared to the single cage machines.
Hence, the computer simulation-based study, investigations and research demands a realization of a perfect depiction of Double Cage Induction that can address their significant issues, especially, concerning the integration of wind energy conversion systems to the grid. Thus, the use of wind energy and its integration with the grid is now an essential subject to learn about [15].
Comprehensive studies to discover the interplay between wind farms and the power system are necessary. Different researches are carried out whenever a wind farm is designed, in a comparable way to other new technology amenities [13,15]. In general, the influences of wind technology are assessed in the course of model planning concerning voltage profile, electricity flow, short-circuit currents, reactive power capability, Low Voltage Ride Through (LVRT), and transient stability [16,17,18,19]. A detailed representation of each unique unit and connections between the units and the system is every so often considered. Alternatively, the wind farm can also be modeled as a lumped equivalent model as viewed from the system [17]. The other related work on transient stability improvement and spinning reserve dispatch in wind-thermal power system is also given in [20,21].
Nevertheless, the response of the system will rely on the type of tools being used. Several different dynamic models have been derived and are entirely documented in the literature [22,23,24,25,26,27]. However, some of them use significant simplification to make use of control system design techniques [28].
To provide a high-quality tool for energy system studies, the reduced-order modeling of state-space representations of synchronous and induction machines for wind turbine applications is given [29]. The reduced models are presented as state-space representations, allowing a convenient, compact and elegant way to check the induction and synchronous generator-based wind turbines [30,31,32], with facts effectively accessible for stability, controllability, and observability analyses [33,34]. Natural and steady-state responses of reduced-order model (ROM) effectively compared with the original system which shows the effectiveness of ROM by using balanced based realization [35].
Model order reduction (MOR) is a process of reducing the higher-order system to lower-order systems. A Higher-order system involves lots of complexity for the analysis, design, and simulations. In control system theory it is a very useful way to reduce the higher-order model and perform tasks [36,37,38,39,40,41,42,43,44,45,46].
One of the most extensively used technique of MOR is balance truncation (BT) [47]. It is used to acquire the ROM. It grants the stable ROM and also grants error bound formula. It keeps the properties like input/output behavior and passivity etc while the use of the full frequency spectrum. The BT approach [47] yields ROM which not only preserves stability but additionally gives easily computable error bounds [47]. Ideally, the BT [47] approach tends to approximate the original model and offers ROM with less approximation error for the entire frequency range. However, there is a certain scenario where approximation error is required to be small for certain frequency weights alternatively than the entire frequency range. This motivates to use of frequency weights in a balanced realization algorithm [48]. Enns [48] has extended the BT [47] approach by way of introducing frequency weights in the given model realization. This technique may additionally include input, output, and two-sided weighting. However, this method sometime yields unstable reduced order systems when both sided weighting is present [49]. To overcome this main drawback, Wang et al’s [50] and Imran and Ghafoor (IG) [51] presented stability preserving methods. Gawronski and Juang [52] and Wang and Zilouchian (WZ) [53] proposed a frequency confined balanced MOR technique for the continuous-time and the discrete-time systems respectively, where weights are not explicitly predefined, but the approximation is considered in certain frequency intervals. In this technique, Gramians were described for preferred frequency intervals. However, it can also yield unstable ROM for a stable original system. Moreover, there is no error bound exists. The instability issues appeared in [52,53] were carried out by [54,55,56,57,58,59].
To overcome the instability issue of Enns [48], the proposed scheme effectively performs a model reduction of the DFIG based Variable-Speed Wind Turbines model [24] and produces stable ROM by ensuring the positive/semi-positive definiteness of some input and output related matrices respectively, simulation results that are comparable with [48] and existing stability preserving techniques ([50,51]). Moreover, the proposed technique provides computable a priori error bounds formula for frequency weighting and limited frequency-intervals respectively. Simulation results are given to show the usefulness of the proposed technique when compared with other methods.
The main contributions of this paper are as follows
  • Frequency weighted Gramians based MOR approach for the wind turbine power system is proposed.
  • A priori error bound formula for frequency weighted cases is derived.
  • ROMs of DFIG (current, flux) models are obtained based on frequency weighted scenario which ensure the stability.
  • Comparison among different existing MOR technique with proposed technique is presented.

2. Grid Connection Configuration of Induction Machines

This section discusses the grid connection configuration of Double Fed Induction Generator (DFIG) and Squirrel Cage Induction Generator (SCIG).

2.1. Double Fed Induction Generator (DFIG)

DFIGs are integrated with the grid in a pattern as shown in Figure 1. A low-speed shaft of the wind turbine is connected to the rotor of the DFIG through a gearbox. The gearbox enhances the speed to a value required by the generator for power generation. DFIG uses a wound type rotor which is connected to the grid through, AC-DC-AC, two back-to-back voltage source converters of partial rating (usually 30 percent of generator power). The converter connected to the rotor end is called Rotor Side Converter (RSC) while the converter connected to the grid end is known as Grid Side Converter (GSC). Both converters are separated by a DC-link capacitor as energy storage. These converters address the problem of the variable wind speed, during both sub-synchronous and super-synchronous modes, and produce fixed output frequency as required at the grid [16]. The stator is connected to the grid through a step-up transformer [13]. A control system is incorporated to control input power at the shaft of the wind turbine, reactive power, and the voltage at the grid terminal. This system generates separate voltage commands V r and V g c for R S C and G S C respectively. The RSC provides the control of both active and reactive power while GSC manages the voltage at DC-link capacitor in between R S C and G S C for its operation at unity power factor.

2.2. Squirrel Cage Induction Generator (SCIG)

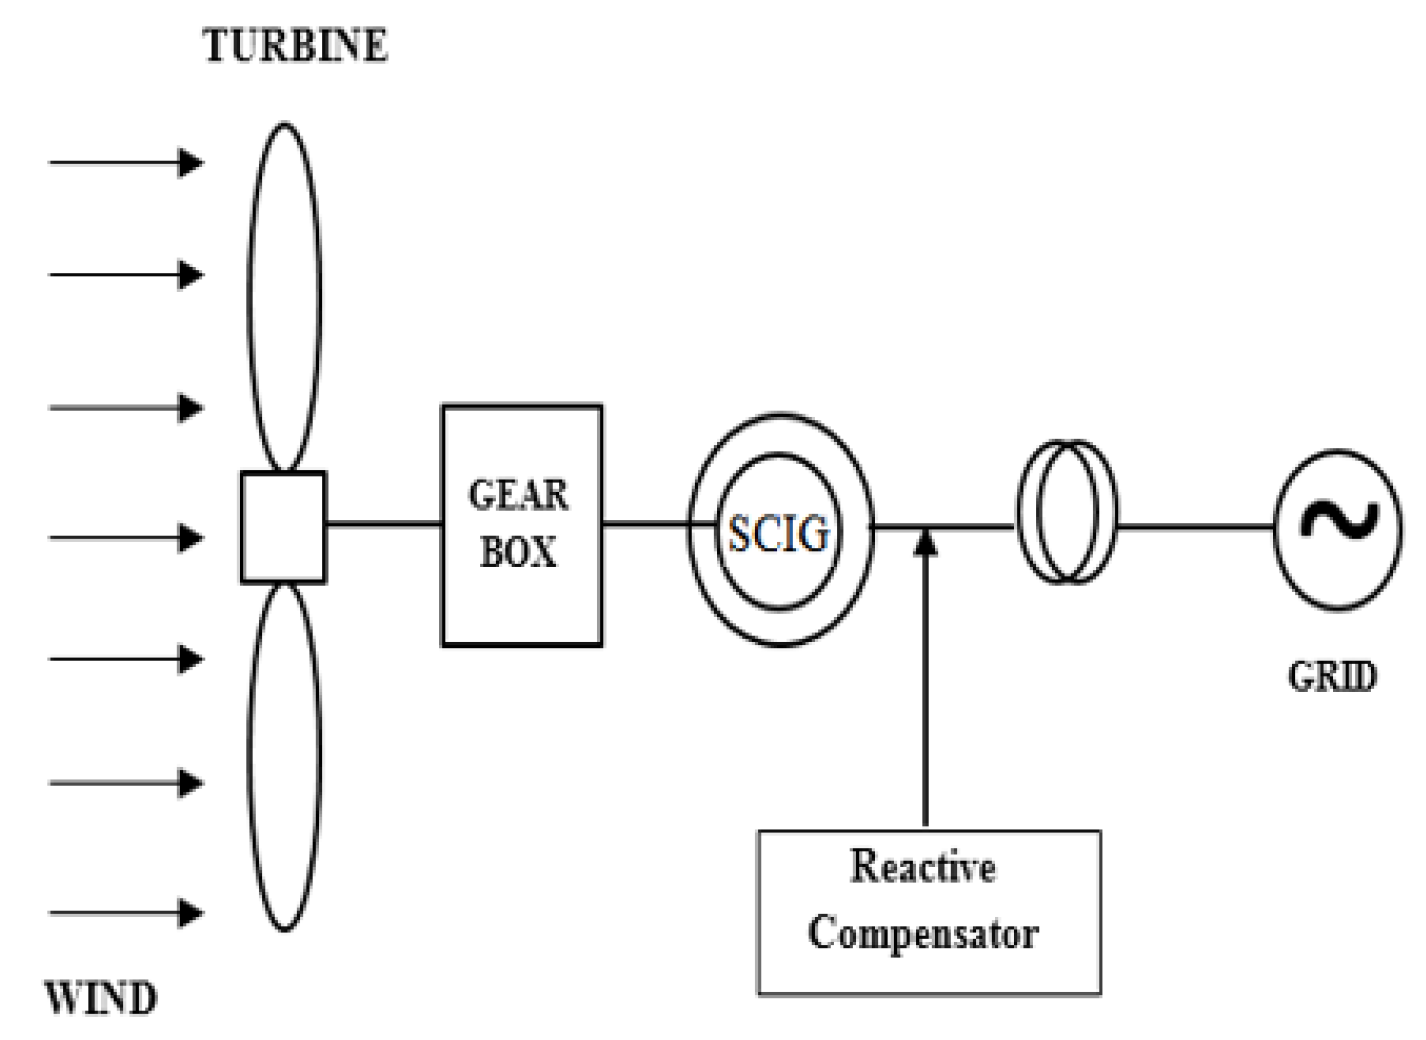
Direct grid-connected wind energy turbines use SCIGs (single or double cage) and operate at a fixed speed [14]. Similar to the other wind energy conversion systems, the turbine is linked to SCIG through a gearbox to achieve a nominal speed for power generation while the generator is directly coupled to the grid as displayed in Figure 2. As speed fluctuations are due to the variations in the rotor slip, the rotor speed changes are minor and the wind turbine is normally used to drive at a fixed speed. At the instant of voltage variations at the grid, SCIG acts as an induction motor and absorbs reactive power. Therefore, the power system is augmented with a reactive power compensator, usually a capacitor bank, to improve the power factor. The pitch angle control is incorporated for the optimum value of the wind power to address the rotor speed instability of the generator as the wind speed varies. The Squirrel cage systems are also used in variable-speed wind energy systems.

2.3. Mathematical Model for DFIG and SCIG

The variables indicated by prime are referred to the stator. The stator and rotor quantities are in arbitrary ‘dq’ (d-axis and q-axis) reference frame. Figure 1 depicts circuit diagram of DFIG and SCIG.

3. Mathematical Model for Double Cage Induction Machines (DCIM)

Mathematical relations for the conversion of wind energy into electrical energy is specified in [17,18,19]. Electrical variables and parameters designated by primes, in the mathematical model, are referred to as the stator. Parameters for the Double Cage Induction Machine (DCIM) are shown in Table 1.

3.1. Electrical System

The electrical system comprises a stator and a double squirrel cage rotor. The machine is represented by a sixth-order model while the mechanical part is a second-order system [22]. The electrical circuit is represented in Figure 3. Stator voltages on quadrature (q) axis and direct (d) axis can be obtained as following
V q s = R s i q s + d φ q s d t + ω φ d s V d s = R s i d s + d φ d s d t ω φ q s
where
φ q s = L s i q s + L m ( i ´ q r 1 + i ´ q r 2 ) φ d s = L s i d s + L m ( i ´ d r 1 + i ´ d r 2 ) L s = L 1 s + L m .
Rotor equations for the first cage quadrature (q) axis and direct (d) axis can be obtained as following
0 = R ´ r 1 i ´ q r 1 + d φ ´ q r 1 d t + ( ω ω r ) φ ´ d r 1 0 = R ´ r 1 i ´ d r 1 + d φ d r 1 d t + ( ω ω r ) φ ´ q r 1
where
φ ´ q r 1 = L ´ r 1 i ´ q r 1 + L m i q s φ ´ d r 1 = L ´ r 1 i ´ d r 1 + L m i d s L ´ r 1 = L ´ 1 r 1 + L m .
Rotor equations for the second cage quadrature (q) axis and direct (d) axis can be obtained as following
0 = R ´ r 2 i ´ q r 2 + d φ ´ q r 2 d t + ( ω ω r ) φ ´ d r 2 0 = R ´ r 2 i ´ d r 2 + d φ d r 2 d t + ( ω ω r ) φ ´ q r 2
where
φ ´ q r 2 = L ´ r 2 i ´ q r 2 + L m i q s φ ´ d r 2 = L ´ r 2 i ´ d r 2 + L m i d s L ´ r 2 = L ´ 1 r 2 + L m .
Electrical torque equations double squirrel cage induction machines be
T e = 1.5 p ( ω φ d s i q s ω φ q s i d s )
Remark 1.
During the conversion process of electromechanical energy, some of the energy constitutes as heat due to the resistive loss in the conductors of rotor and stator as well as core losses (hysteresis and eddy current) and dielectric loss. Technically, core losses are taken into account by placing a small resistor in parallel with the magnetizing inductance Lm in the per phase equivalent circuit of the model. However, these losses are ignored in the circuit diagram, as shown in Figure 3, due to the following reasons [22]:
1. 
Selected core is made up of ferromagnetic material organized in lamination to minimize the core losses
2. 
The core losses are negligible when compared to the stator and rotor copper winding losses

3.2. Mechanical System

A second-order mechanical system of double cage induction machine is represented as [25]
d d t ω m = 1 2 H ( T e F ω m T m )
where ω m = d d t θ m

4. Mathematical Model for DFIG and SCIG Systems

For a computer simulations based study it is necessary to understand mathematical models of the machines for their electrical and mechanical systems [19]. Table 1 displays all the mathematical symbols and their meaning in the context of the mathematical models discussed.

4.1. Wind Energy Conversion

The kinetic energy of the wind is converted through the blades of turbine into mechanical power P m and computed as follows [19]
P m = T m ω m
where T m is the torque exerted on the mechanical shaft and ω m (rad/sec) is rotational speed of the turbine. In steady state operation at a fixed speed for a lossless generator, mechanical torque is equal to electrical torque i.e., T m = T e = P m / ω m [17,18]. The power produced by the wind is given as follows
P m = 0.5 ζ p ( λ , β ) ρ π r 2 ν 3
where
  • ζ p = Performance coefficient of the turbine
  • λ = Tip speed ratio of the rotor blade tip speed to wind speed = ω m / ν
  • β = Blade pitch angle (deg)
  • ρ = Density of Air (kg/m)
  • r = Radius of the turbine blades (m)
  • ν = Wind speed (m/s)

4.2. Electrical Systems for Wound Rotor (DFIG) and Squirrel Cage (SCIG) Machine

This section discusses mathematical model of electrical system. The variables indicated by prime are referred to the stator. The stator and rotor quantities are in arbitrary ‘dq’ (d-axis and q-axis) reference frame. Figure 4 depicts circuit diagram of DFIG and SCIG.
The stator voltages are given as follow
V q s = R s i q s + d φ q s d t + ω φ d s V d s = R s i d s + d φ d s d t ω φ q s
where
φ q s = L s i q s + L m ( i ´ q r ) φ d s = L s i d s + L m ( i ´ d r ) L s = L 1 s + L m .
The stator voltages are given as follow
V ´ q r = R ´ r i ´ q r + d φ ´ q r d t + ( ω ω r ) φ ´ d r V ´ d r = R ´ r i ´ d r + d φ d r d t + ( ω ω r ) φ ´ q r
where
φ ´ q r = L ´ r i ´ q r + L m i q s φ ´ d r = L ´ r i ´ d r + L m i d s L ´ r = L ´ 1 r + L m .
The active and reactive stator and rotor powers are related as follow [19]
P s = 3 / 2 ( V d s i d s + V q s i q s ) Q s = 3 / 2 ( V d s i d s V q s i q s ) P r = 3 / 2 ( V d r i d r + V q r i q r ) Q r = 3 / 2 ( V d r i d r V q r i q r )

5. Balancing Related Model Order Reduction Schemes

Consider a linear time invariant continuous time system
G ( s ) = C ( s I A ) 1 B + D ,
where A n × n , B n × p , C q × n , D q × p and { A , B , C , D } is n t h order minimal realization with p inputs and q outputs. The problem of model reduction is to find
G t r ( s ) = C t r ( s I A t r ) 1 B t r + D t r ,
which approximates the actual system (in the full frequency band), where A t r r × r , B t r r × p , C t r q × r , D t r q × p with r < < n .

5.1. Balance Truncation Technique (Moore, B. 1981)

Let P c g and Q o g be the full frequency controllability and observability Gramians respectively
P c g = e A τ B B T e A T τ d τ Q o g = e A T τ C T C e A τ d τ
are the solution of following Lyapunov equations:
A P c g + P c g A T + B B T = 0
A T Q o g + Q o g A + C T C = 0
Let T B be a contragredient matrix obtained as
T B T Q o g T B = T B 1 P c g T B T = σ 1 0 0 0 σ 2 0 0 0 σ n
where σ j σ j + 1 , j = 1 , 2 , 3 , , n 1 and σ r > σ r + 1 , and r is the order of ROM. By applying the transformation and then partitioning the original system, the ROM G t r ( s ) = C t r ( s I A t r ) 1 B t r + D t r is obtained as:
T B 1 A T B = A t r A 12 A 21 A 22 , T B 1 B = B t r B 2 ,
C T B = C t r C 2 , D = D t r
Remark 2.
For the minimal and stable realization the transformed balanced realization is minimal and the stability of ROM ( A t r , B t r , C t r ) is also guaranteed and yields frequency response error bounds. However, the balance truncation technique [47] uses a full frequency spectrum to perform MOR which not practically feasible all the time.

5.2. Enns’s Technique (Enns, D.F. 1984)

Consider a stable input weighting stable model of continuous time systems
V i ( s ) = C i ( s I A i ) 1 B i + D i ,
where A i n i × n i , B i n i × m i , C i p i × n i , D i p i × m i and { A i , B i , C i , D i } is its n i t h order minimal realization.
Let a stable output weighting model of continuous time systems
W o ( s ) = C o ( s I A o ) 1 B o + D o ,
where A o n o × n o , B o n o × m o , C o p o × n o , D o p o × m o and { A o , B o , C o , D o } is its n o t h order minimal realization.
The augmented systems are given by
G ( s ) V i ( s ) = C s i ( s I A s i ) 1 B s i + D s i W o ( s ) G ( s ) = C s o ( s I A s o ) 1 B s o + D s o
where
A s i B s i C s i D s i = A B C i B D i 0 A i B i C D C i D D i A s o B s o C s o D s o = A o B o C B o D 0 A B C o D o C D o D
Let the Gramians
P s i = P e n P 12 P 12 T P V , Q s o = Q W Q 12 T Q 12 Q e n
satisfy the following Lyapunov equations:
A s i P s i + P s i A s i T + B s i B s i T = 0
A s o T Q s o + Q s o A s o + C s o T C s o = 0
Remark 3.
In controller reduction, scenario pole-zero cancellation may occur that leads to loss of controllability and observability of realizations input-augmented A s i , B s i , C s i , D s i and output-augmented A s o , B s o , C s o , D s o respectively.
By considering the first and fourth block of Equations (9) and (10) respectively, we have:
A P e n + P e n A T + X e n = 0
A T Q e n + Q e n A + Y e n = 0
where
X e n = B e n B e n T = B C i P 12 T + P 12 C i T B T + B D i D i T B T
Y e n = C e n T C e n = C T B o T Q 12 T + Q 12 B o C + C T D o T D o C
By eigenvalues decomposition of X e n and Y e n we have following
X e n = U e n S e n 1 0 0 S e n 2 U e n T = U e n S e n U e n T
B e n = U e n S e n 1 1 / 2 0 0 S e n 2 1 / 2 = U e n S e n 1 / 2
Y e n = V e n R e n 1 0 0 R e n 2 V e n T = V e n R e n V e n T
C e n = R e n 1 1 / 2 0 0 R e n 2 1 / 2 V e n T = R e n 1 / 2 V e n T
where
S e n 1 = s 1 0 0 0 s 2 0 0 0 s k , S e n 2 = s k + 1 0 0 0 s k + 2 0 0 0 s n , R e n 1 = r 1 0 0 0 r 2 0 0 0 r q , R e n 2 = r q + 1 0 0 0 r q + 2 0 0 0 r n
k and q are the number of positive eigenvalues of X e n and Y e n respectively. Let T e n be a contragredient matrix obtained as
T e n T Q e n T e n = T e n 1 P e n T e n T = σ 1 0 0 0 σ 2 0 0 0 σ n
where σ j σ j + 1 , j = 1 , 2 , 3 , , n 1 and σ r > σ r + 1 and r is the order of ROM. By applying the transformation and then partitioning the original system, the ROM G t r ( s ) = C t r ( s I A t r ) 1 B t r + D t r is obtained as as similar as way as in (5)–(6).
Remark 4.
P e n and Q o g are used to obtain the balancing (contragredient) transformation T e n in (19) subject to only input weights are present. Likewise, P c g and Q e n are used to obtain balancing (contragredient) transformation T e n in (19) subject to only output weights are present, where P c g and Q o g are un-weighted Gramians computed as in (3)–(4).
Remark 5.
Enns’s technique [48] do not ensure the stability of the ROM since X e n 0 and Y e n 0 , it may cause sometimes unstable ROMs for both sided weighting case. Furthermore, the transformed realization may not be minimal due to pole-zero cancellation, therefore, this method is not useful especially in the controller reduction scenario [49].

5.3. Wang and Sreeram’s Technique (Wang, G. 1999)

Wang and Sreeram [50] provides the solution to the instability issue that appeared in [48]. This method [50] ensured the positive/semi-positive definiteness of input and output related matrices X e n (13) and Y e n (14) respectively by doing some variation. Let the improvised controllability and observability Gramians P W S and Q W S (calculated by solving the following Lyapunov equations) respectively.
A P W S + P W S A T + B W S B W S T = 0
A T Q W S + Q W S A + C W S T C W S = 0
where the fictitious input B W S and output C W S matrices shown in the above Lyapunov equations are defined as,
B W S = U W S | S e n | 1 / 2 = U W S S W S for s n < 0 U e n S e n 1 / 2 for s n 0
C W S = | R e n | 1 / 2 V W S T = R W S V W S T for r n < 0 R e n 1 / 2 V T for r n 0 .
Since the expressions U W S , S W S , V W S , and R W S are calculated by orthogonal eigenvalues-decomposition of X W S = B W S B W S T = U W S S W S U W S T and Y W S = C W S T C W S = V W S R W S V W S T , where S W S = | S e n | = d i a g ( | s 1 | , | s 2 | , , | s n | ) , R W S = | R e n | = d i a g ( | r 1 | , | r 2 | , , | r n | ) , s 1 s 2 s n 0 and r 1 r 2 r n 0 . Let T W S be a contragredient matrix obtained as
T W S T Q W S T W S = T W S 1 P W S T W S T = σ ¯ 1 0 0 0 σ ¯ 2 0 0 0 σ ¯ n
where σ ¯ j σ ¯ j + 1 , j = 1 , 2 , 3 , , n 1 and σ ¯ r > σ ¯ r + 1 and r is the order of the ROM. By applying the transformation and then partitioning the original system, the ROM G t r ( s ) = C ¯ t r ( s I A ¯ t r ) 1 B ¯ t r + D ¯ t r is obtained as similar way as in (5)–(6).
Remark 6.
X e n B W S B W S T 0 , Y e n C W S T C W S 0 , P W S > 0 and Q W S > 0 , ensures minimality of the realization A , B W S , C W S . Moreover, the stability of ROMs in the presence of both input and output weightings is ensured [50].
Remark 7.
The relationship between the system input matrix B and the new fictitious input matrix B W S , the existence of r a n k B W S B = r a n k B W S . Similarly, the system output matrix C and the new fictitious output matrix C W S , the existence of r a n k C W S C = r a n k C W S is shown in [50].
Remark 8.
The following expression for error bounds holds [50] (subject to fulfillment of r a n k B W S B = r a n k B W S and r a n k C W S C = r a n k C W S )
W o ( s ) ( G ( s ) G t r ( s ) ) V i ( s ) 2 W o ( s ) L W S K W S V i ( s ) j = r + 1 n σ ¯ j
where
L W S = C V W S d i a g ( r 1 1 2 , r 2 1 2 , , r l i 1 2 , 0 , , 0 ) ,
K W S = d i a g ( s 1 1 2 , s 2 1 2 , , s k o 1 2 , 0 , , 0 ) U W S T B ,
l i = r a n k X e n and k o = r a n k Y e n .

5.4. Imran and Ghafoor’s Technique (Imran, M. 2014)

Imran and Ghafoor [51] technique also provided the solution to instability issue appeared in [48], by ensuring positive/semi-positive definiteness of input and output related matrices X e n and Y e n respectively. However, this technique produces large approximation error due to large variation in X e n and Y e n . The controllability and observability Gramians P I G and Q I G (calculated by solving the following Lyapunov equations) respectively can be obtained as:
A P I G + P I G A T + B I G B I G T = 0
A T Q I G + Q I G A + C I G T C I G = 0
the fictitious input and output related matrices B I G and C I G respectively are defined as:
B I G = U I G ( S e n s n I ) 1 / 2 = U I G S i g 1 / 2 for s n < 0 U e n S e n 1 / 2 for s n 0 C I G = ( R e n r n I ) 1 / 2 V I G T = R I G 1 / 2 V T for r n < 0 R 1 / 2 V T for r n 0 .
The terms U I G , S I G , V I G , and R I G are calculated by the orthogonal eigenvalues- decomposition of symmetric matrices B I G B I G T = U I G S I G U I G T and C I G T C I G = V I G R I G V I G T , where S I G = S e n s n I = d i a g ( s ¯ 1 , s ¯ 2 , s 3 , , s ¯ n 1 , 0 ) , R I G = R e n r n I = d i a g ( r ¯ 1 , r ¯ 2 , r 3 , , r ¯ n 1 , 0 ) , s ¯ 1 s ¯ 2 s ¯ n 1 0 , and r ¯ 1 r ¯ 2 r ¯ n 1 0 . Let T I G be contragredient matrix obtained as
T I G T Q I G T I G = T I G 1 P I G T I G T = σ ¯ 1 0 0 0 σ ¯ 2 0 0 0 σ ¯ n
where σ ¯ j σ ¯ j + 1 , j = 1 , 2 , 3 , , n 1 and σ ¯ r > σ ¯ r + 1 and r is the order of the ROM. By applying the transformation and then partitioning the original system, the ROM G t r ( s ) = C ¯ t r ( s I A ¯ t r ) 1 B ¯ t r + D ¯ t r is obtained as similar way as in (5)–(6).
Remark 9.
Since X e n B I G B I G T 0 , Y e n C I G T C I G 0 , P I G > 0 and Q I G > 0 . Therefore, the realization ( A , B I G , C I G , D ) is minimal. Moreover, ROMs are stable.
Remark 10.
The stability of ROMs in the presence of both input and output weighting is guaranteed and the following error bound holds [51]
W o ( s ) ( G ( s ) G t r ( s ) ) V i ( s ) 2 W o [ z ] L I G K I G V i [ z ] j = r + 1 n σ ¯ j
where
L I G = C V I G d i a g ( r 1 1 2 , r 2 1 2 , , r l i 1 2 , 0 , , 0 ) ,
K I G = d i a g ( s 1 1 2 , s 2 1 2 , , s k o 1 2 , 0 , , 0 ) U I G T B ,
l i = r a n k X e n and k o = r a n k Y e n .

6. Main Results

In [48], input related and output related matrices X e n and Y e n respectively are not ensured to be positive/semi-positive definite due to negative eigenvalues obtained by using eigenvalue decomposition of X e n and Y e n . Whereas, the proposed technique ensured the positive/semi-positive definite of the matrices X e n and Y e n by introducing small variation in input related and output related matrices X e n and Y e n respectively. This is achieved by subtracting all the eigenvalues with the negative sum of eigenvalues which results in stable ROM. The proposed technique also provides computable a priori error bounds formula. Let controllability P S B and observability Q S B Gramians satisfying the following Lyapunov equations:
A P S B + P S B A T + X S B = 0
A T Q S B + Q S B A + Y S B = 0
where X S B = B S B B S B T and Y S B = C S B T C S B
By eigenvalues decomposition of X S B = U S B S S B U S B T and Y S B = V R S B V T . The new imaginary input and output related matrices B S B and C S B respectively are given as following
B S B = U S B S e n 1 1 / 2 0 0 S S B 2 1 / 2 = U S B S S B 1 / 2 ,
C S B = R e n 1 1 / 2 0 0 R S B 2 1 / 2 V S B T = R S B 1 / 2 V S B T
where
S S B 2 = ( S e n 2 s ^ I ) 1 / 2 for s n < 0 S e n 2 1 / 2 for s n 0 R S B 2 = ( R e n 2 r ^ I ) 1 / 2 for r n < 0 R e n 2 1 / 2 for r n 0 .
where s ^ = i = k + 1 n s i and r ^ = i = q + 1 n r i . The terms U S B , S S B , V S B , and R S B are calculated by the orthogonal eigenvalues-decomposition of input and output related matrices B S B B S B T = U S B S S B U S B T and C S B T C S B = V S B R S B V S B T respectively, where S S B = S e n s ^ n I = d i a g ( s ^ 1 , s ^ 2 , s ^ 3 , , s ^ n 1 , s ^ n ) , R S B = R e n r ^ n I = d i a g ( r ^ 1 , r ^ 2 , r ^ 3 , , r ^ n 1 , r ^ n ) , s ^ 1 s ^ 2 s ^ n 0 , and r ^ 1 r ^ 2 r ^ n 0 . Note that, the matrices B S B and C S B are constructed by ensuring similar effect on all eigenvalues of symmetric matrices X e n and Y e n . This will guarantee the preserving of eigenvalue structure of matrices X e n and Y e n and therefore, better results are obtained in proposed technique as compared to Wang and Sreeram [50] and Imran and Ghafoor [51] technique. A contragradient transformation matrix T S B is obtained as
T S B T Q S B T S B = T S B 1 P S B T S B T = σ ^ 1 0 0 0 σ ^ 2 0 0 0 σ ^ n
where σ ^ j σ ^ j + 1 and σ ^ r σ ^ r + 1 and r is the order of the ROM. By applying the transformation and then partitioning the original system, the ROM G t r ( s ) = C ^ t r ( s I A ^ t r ) 1 B ^ t r + D ^ t r is obtained as:
T S B 1 A T S B = A ^ = A ^ t r A ^ 12 A ^ 21 A ^ 22 , T S B 1 B = B ^ = B ^ t r B ^ 2 ,
C T S B = C ^ = C ^ t r C ^ 2 , D = D ^ t r
Lemma 1.
X e n B S B B S B T 0 , Y e n C S B T C S B 0 , likewise, P e n < P S B > 0 and Q e n < Q S B > 0 . Therefore, minimal and stable realization ( A , B S B , C S B ) is obtained which guaranteed the stability of the ROM.
Proof of Lemma 1.
We will first show that the realization A , B S B , C S B is minimal. Since P S B and Q S B are solution of Lyapunov Equations (26) and (27) respectively, so
B S B B S B T X e n 0 P S B P e n = e A t B S B B S B T e A T t d t e A t X e n e A T t d t = e A t ( B S B B S B T X e n ) e A T t d t 0
Since P e n is positive definite, P S B must be positive definite. Similarly, we can say Q S B is positive definite. Since P S B and Q S B are positive definite and A is stable, it follows immediately that the pair ( A , B S B ) is controllable and ( A , C S B ) is observable or in other words the realization A , B S B , C S B is minimal. □
Theorem 1.
If the following rank conditions (which follows from [50,54]) are satisfied r a n k B S B B = r a n k B S B and r a n k C S B C = r a n k C S B error bound for the proposed scheme holds
( a ) W o ( s ) ( G ( s ) G t r ( s ) ) V i ( s ) 2 W o ( s ) L S B K S B V i ( s ) j = r + 1 n σ ^ j ( b ) ( G ( s ) G t r ( s ) ) V i ( s ) 2 K S B V i ( s ) j = r + 1 n σ ^ j ( c ) W o ( s ) ( G ( s ) G t r ( s ) ) 2 W o ( s ) L S B j = r + 1 n σ ^ j
where
L S B = C V S B R S B 1 / 2 if R S B 2 exists C V e n R e n 1 / 2 otherwise K S B = S S B 1 / 2 U S B T B if S S B 2 exists S e n 1 / 2 U e n T B otherwise
Proof of Theorem 1.
We will proof (a) part of above theorem (where (b) and (c) are the special cases of (a)). Since the rank conditions r a n k B S B B = r a n k B S B and r a n k C S B C = r a n k C S B are satisfied, the following relationships B = B S B K S B and C = L S B C S B holds. By partitioning B S B = B S B 1 B S B 2 , C S B = C S B 1 C S B 2 and then substituting B ^ t r = B S B 1 K S B , C ^ t r = L S B C S B 1 respectively yields
W o ( s ) ( G ( s ) G t r ( s ) ) V i ( s ) = W o ( s ) ( C ( s I A ) 1 B C ^ t r ( s I A ^ t r ) 1 B ^ t r ) V i ( s ) = W o ( s ) ( L S B C S B ( s I A ) 1 B S B K S B L S B C S B 1 ( s I A ^ t r ) 1 B S B 1 K S B ) V i ( s ) = W o ( s ) L S B ( C S B ( s I A ) 1 B S B C S B 1 ( s I A ^ t r ) 1 B S B 1 ) K S B V i ( s ) = W o ( s ) L S B ( C S B ( s I A ) 1 B S B C S B 1 ( s I A ^ t r ) 1 B S B 1 ) K S B V i ( s )
If { A ^ t r , B S B 1 , C S B 1 , D ^ t r } is approximated model obtained by partitioning a balanced realization { A ^ , B S B , C S B , D } , we have from [48]
( C S B ( s I A ) 1 B S B C S B 1 ( s I A ^ t r ) 1 B S B 1 ) 2 j = r + 1 n σ ^ j
then
W o ( s ) ( G ( s ) G t r ( s ) ) V i ( s ) 2 W o ( s ) L S B K S B V i ( s ) j = r + 1 n σ ^ j
 □
Corollary 1.
For the case G ( s ) V i ( s ) , the error bound expression becomes
( G ( s ) G t r ( s ) ) V i ( s ) 2 | K S B j = k + 1 n σ ^ j
Likewise, W o ( s ) G ( s ) , we have
W o ( s ) ( G ( s ) G t r ( s ) ) 2 L S B j = k + 1 n σ ^ j
Corollary 2.
Theorem 1 holds true subject to the following rank conditions r a n k B S B B = r a n k B S B and r a n k C S B C = r a n k C S B (which follows from [50,54]) are satisfied.
Remark 11.
When input and output related matrices X e n 0 and Y e n 0 respectively, then P e n = P S B and Q e n = Q S B . Otherwise P e n < P S B and Q e n < Q S B . Moreover, frequency weighted Hankel singular values satisfies: ( λ j [ P e n Q e n ] ) 1 / 2 ( λ j [ P S B Q S B ] ) 1 / 2
Remark 12.
When input V i ( s ) and output W o ( s ) weights are co-inner and inner respectively [51], then P c g = P e n = P S B and Q o g = Q e n = Q S B .
Remark 13.
When input and output related matrices X e n 0 and Y e n 0 respectively, then approximated models obtained using [48] and proposed technique are the equivalent.
Theorem 2.
The following Lyapunov equation for the proposed technique holds
A P ( e x t ) + P ( e x t ) A T + B ( e x t ) B ( e x t ) T = 0
A T Q ( e x t ) + Q ( e x t ) A + C ( e x t ) T C ( e x t ) = 0
Proof of Theorem 2.
Using (16), (18), (28) and (29) we have following
S e n = d i a g [ S e n 1 , S e n 2 ] = d i a g [ ( s 1 , , s k ) , ( s k + 1 , , s n ) ] S S B = d i a g [ S e n 1 , S S B 2 ] = d i a g [ ( s 1 , , s k ) , ( s ^ k + 1 , , s ^ n ) ] R e n = d i a g [ R e n 1 , R e n 2 ] = d i a g [ ( r 1 , , r q ) , ( r q + 1 , , r n ) ] R S B = d i a g [ R e n 1 , R S B 2 ] = d i a g [ ( r 1 , , r q ) , ( r ^ q + 1 , , r ^ n ) ]
S ( e x t ) and R ( e x t ) are obtained by subtracting ( S S B S e n ) and ( R S B R e n ) respectively
S ( e x t ) = 0 0 0 S ( e x t ) 2 , R ( e x t ) = 0 0 0 R ( e x t ) 2
where
  • S ( e x t ) 2 = S S B 2 S e n 2 and R ( e x t ) 2 = R S B 2 R e n 2 .
  • B ( e x t ) and C ( e x t ) are obtained by subtracting Equations (16)–(28) and (18)–(29) respectively
B ( e x t ) = U ( e x t ) 0 0 0 S ( e x t ) 2 1 / 2 = U ( e x t ) S ( e x t ) 1 / 2 , C ( e x t ) = 0 0 0 R ( e x t ) 2 1 / 2 V ( e x t ) T = R ( e x t ) 1 / 2 V ( e x t ) T
where U ( e x t ) = U S B = U e n and V ( e x t ) = V S B = V e n . Since,
X ( e x t ) = B ( e x t ) B ( e x t ) T = U ( e x t ) S ( e x t ) 1 / 2 S ( e x t ) 1 / 2 U ( e x t ) T = U ( e x t ) S ( e x t ) U ( e x t ) T = U ( e x t ) ( S S B S e n ) U ( e x t ) T = U S B S S B U S B T U e n S e n U e n T = X S B X e n
Y ( e x t ) = C ( e x t ) T C ( e x t ) = V ( e x t ) R ( e x t ) 1 / 2 R ( e x t ) 1 / 2 V ( e x t ) T = V ( e x t ) R ( e x t ) V ( e x t ) T = V ( e x t ) ( R S B R e n ) V ( e x t ) T = V S B R S B V S B T V e n R e n V e n T = Y S B Y e n
substitute ((11) and (26)) in (34) and ((12) and (27)) in (35) we have following
( A P S B + P S B A T ) ( A P e n + P e n A T ) = X ( e x t ) ( A T Q S B + Q S B A ) ( A T Q e n + Q e n A ) = Y ( e x t ) A ( P S B P e n ) + ( P S B P e n ) A T = X ( e x t ) A T ( Q S B Q e n ) + ( Q S B Q e n ) A = Y ( e x t )
If controllability Gramian P ( e x t ) = P S B P e n and observability Gramian Q ( e x t ) = Q S B Q e n , then
A P ( e x t ) + P ( e x t ) A T + B ( e x t ) B ( e x t ) T = 0 A T Q ( e x t ) + Q ( e x t ) A + C ( e x t ) T C ( e x t ) = 0
 □
Corollary 3.
Theorem 2 holds true subject to the realization ( A , B ( e x t ) , C ( e x t ) , D ) is minimal and stable.
Remark 14.
For the realization { A , B ( e x t ) , C ( e x t ) , D } to the following Lyapunov equation
A P ( e x t ) + P ( e x t ) A T + B ( e x t ) B ( e x t ) T = 0 A T Q ( e x t ) + Q ( e x t ) A + C ( e x t ) T C ( e x t ) = 0
where the input matrix B ( e x t ) 0 and output matrix C ( e x t ) 0 ensure positive (semi-positive) definiteness of input and output related matrices B S B and C S B respectively, consequently positive definiteness of P ( e x t ) and Q ( e x t ) in a way leads to positive definiteness of P S B and Q S B .
Remark 15.
Since the input matrix B S B and output matrix C S B ensure positive (semi-positive) definiteness of input and output related matrices, consequently positive definiteness of P S B and Q S B in a way leads to transformation matrix T S B which subsequently results in stability preserving MOR technique. Moreover, L S B and K S B form bases for the derivation of the error bound for the proposed technique.

Computational Aspects

Let S s i and R s o be the Cholesky factors of the augmented system Gramians matrices P s i and Q s o of Equations (9) and (10) respectively,
P s i = S s i S s i T = S 11 S 12 0 S 22 S 11 T 0 S 12 T S 22 T = S 11 S 11 T + S 12 S 12 T S 12 S 22 T S 22 S 12 T S 22 S 22 T = P e n P 12 P 12 T P V
and
Q s o = R s o T R s o = R 11 T 0 R 12 T R 22 T R 11 R 12 0 R 22 = R 11 T R 11 R 11 T R 12 R 12 T R 11 R 22 T R 22 + R 12 T R 12 = Q W Q 12 T Q 12 Q e n
By making use of the Cholesky factors S s o and R s o calculated above, the Cholesky factors corresponding to Gramians in frequency weighted model reduction techniques like [48] and proposed technique can be received as follows:
  • Enns’s Technique [48]: The Cholesky factors S e n = S 11 S 12 and R e n = R 12 R 22 satisfy [54]
    P e n = S e n S e n T = S 11 S 11 T + S 12 S 12 T = S 11 S 12 S 11 T S 22 T
    and
    Q e n = R e n T R e n = R 22 T R 22 + R 12 T R 12 = R 22 T R 12 T R 22 R 12
  • Wang and Sreeram’s Technique [50]: The Cholesky factors S W S and R W S satisfy P W S = S W S S W S T and Q W S = R W S T R W S , where P W S (20) and Q W S (21) [51]. Compute from the realization A , B W S , C W S using method of Hammarling [60].
  • Imran and Ghafoor’s Technique [51]: The Cholesky factors S I G and R I G satisfy P I G = S I G S I G T and Q I G = R I G T R I G , where P I G (24) and Q I G (25).
  • Proposed Technique: The Cholesky factors S S B and R S B satisfy P S B = S S B S S B T and Q S B = R S B T R S B , where P S B (26) and Q S B (27). Next we establish a relationship between Cholesky factors Gramian matrices of Enns and proposed technique. Equations (26) and (27) can be expressed as:
    A ( P e n + P ( e x t ) ) + ( P e n + P ( e x t ) ) A T + ( X e n + X ( e x t ) ) = 0 , for s n < 0 A P e n + P e n A T + X e n = 0 , for s n 0 A T ( Q e n + Q ( e x t ) ) + ( Q e n + Q ( e x t ) ) A + ( Y e n + Y ( e x t ) ) = 0 , for r n < 0 A T Q e n + Q e n A + Y e n = 0 , for r n 0 A P ( e x t ) + P ( e x t ) A T + X ( e x t ) = 0 , for s n < 0 A T Q ( e x t ) + Q ( e x t ) A + Y ( e x t ) = 0 for r n < 0
    Since
    X S B = U S B ( S S B ) 1 / 2 ( S S B ) 1 / 2 U S B T = X e n + X ( e x t ) , for s n < 0 X S B = U S B ( S S B ) 1 / 2 ( S S B ) 1 / 2 U S B T = X e n , for s n 0 Y S B = V S B T ( R S B ) 1 / 2 ( R S B ) 1 / 2 V S B = Y e n + Y ( e x t ) , for r n < 0 Y S B = V S B T ( R S B ) 1 / 2 ( R S B ) 1 / 2 V S B = Y e n for r n 0
    By using the Hammarling’s technique [60] to calculate the Cholesky factors of the Gramians P ( e x t ) and Q ( e x t ) from the realization { A , B ( e x t ) , C ( e x t ) , D } , we can write P ( e x t ) = S ( e x t ) S ( e x t ) T and Q ( e x t ) = R ( e x t ) T R ( e x t ) . Therefore, P S B ( 26 ) and Q S B (27) can be expressed as:
    P S B = S S B S S B T = P e n + P ( e x t ) = S 11 S 11 T + S 12 S 12 T + S ( e x t ) S ( e x t ) T = S 11 S 12 S ( e x t ) S 11 T S 12 T S ( e x t ) T Q S B = R S B T R S B = Q e n + Q ( e x t ) = R 22 T R 22 + R 12 T R 12 + R ( e x t ) T R ( e x t ) = R 22 T R 12 T R ( e x t ) T R 22 R 12 R ( e x t )
Remark 16.
Note that, the Cholesky factors for the Enns and the proposed technique respectively, are computed directly from the augmented system realization using Hammarling technique without calculating the augmented system realization Gramian matrices P s i and Q s o . However, Cholesky factorization for Wang et al’s technique is computed directly from corresponding frequency weighted realization using the Hammarling technique without calculating associated frequency weighted Gramians [61].

7. Numerical Examples

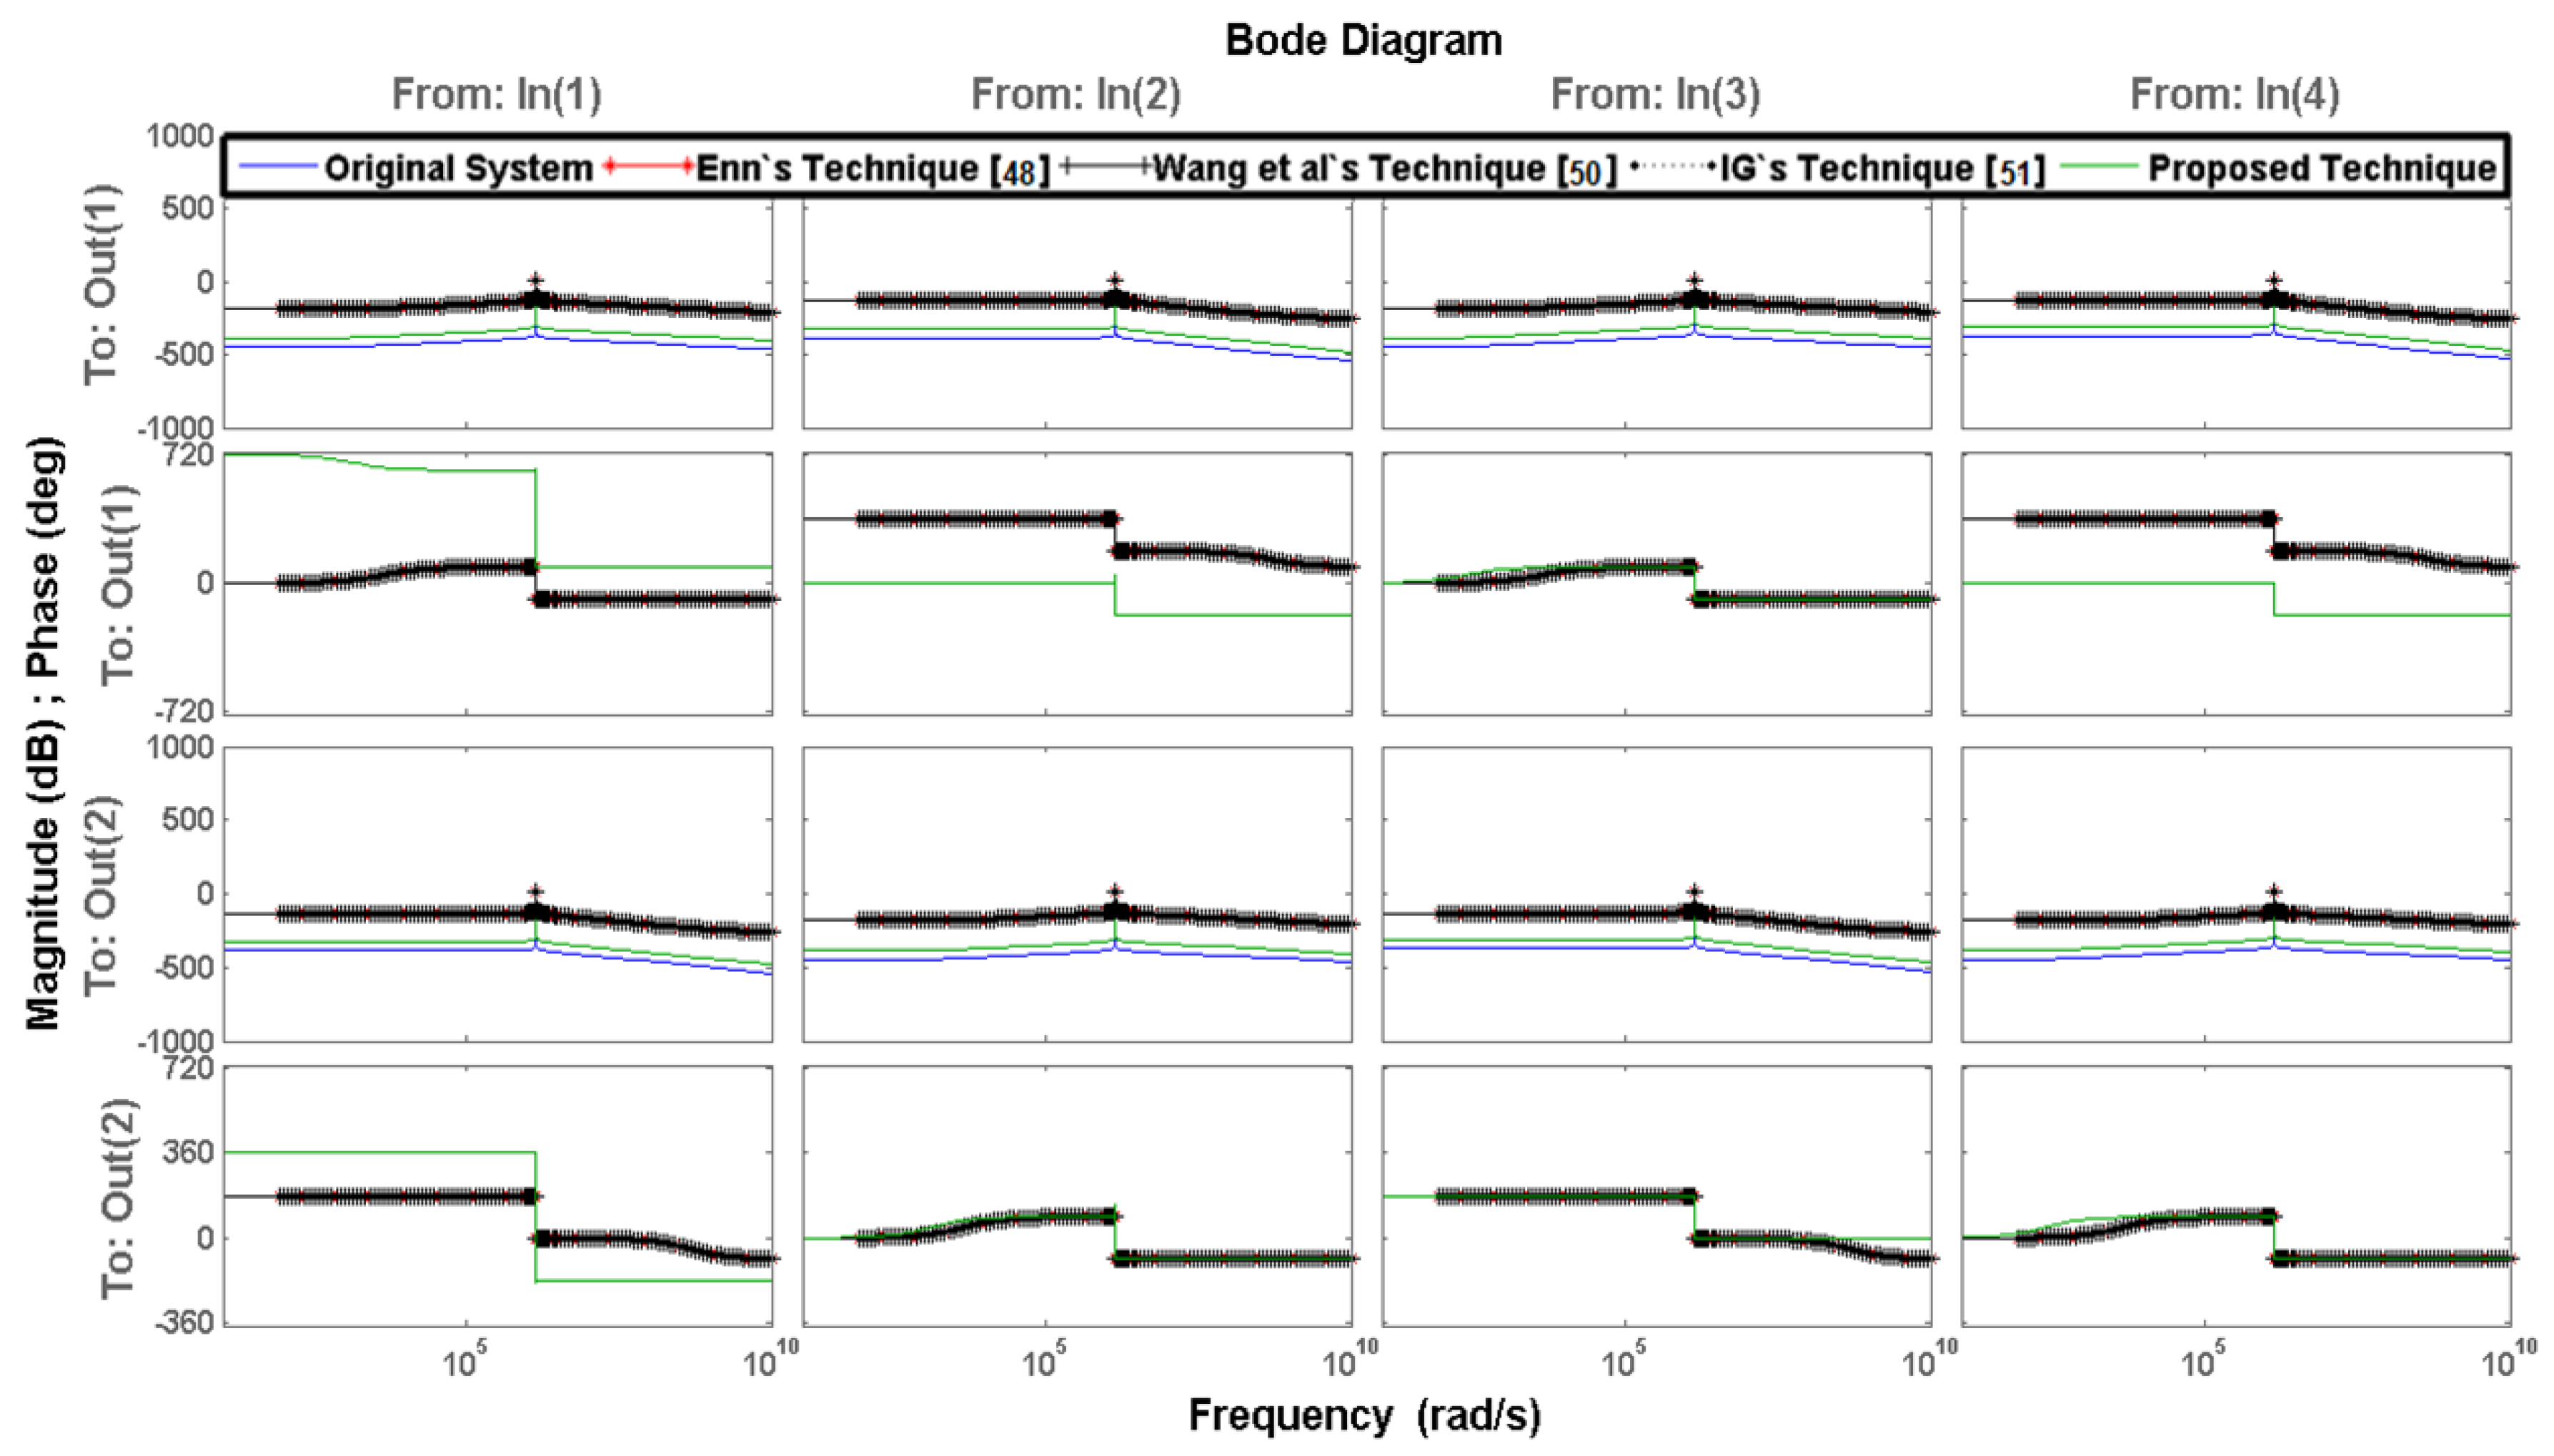
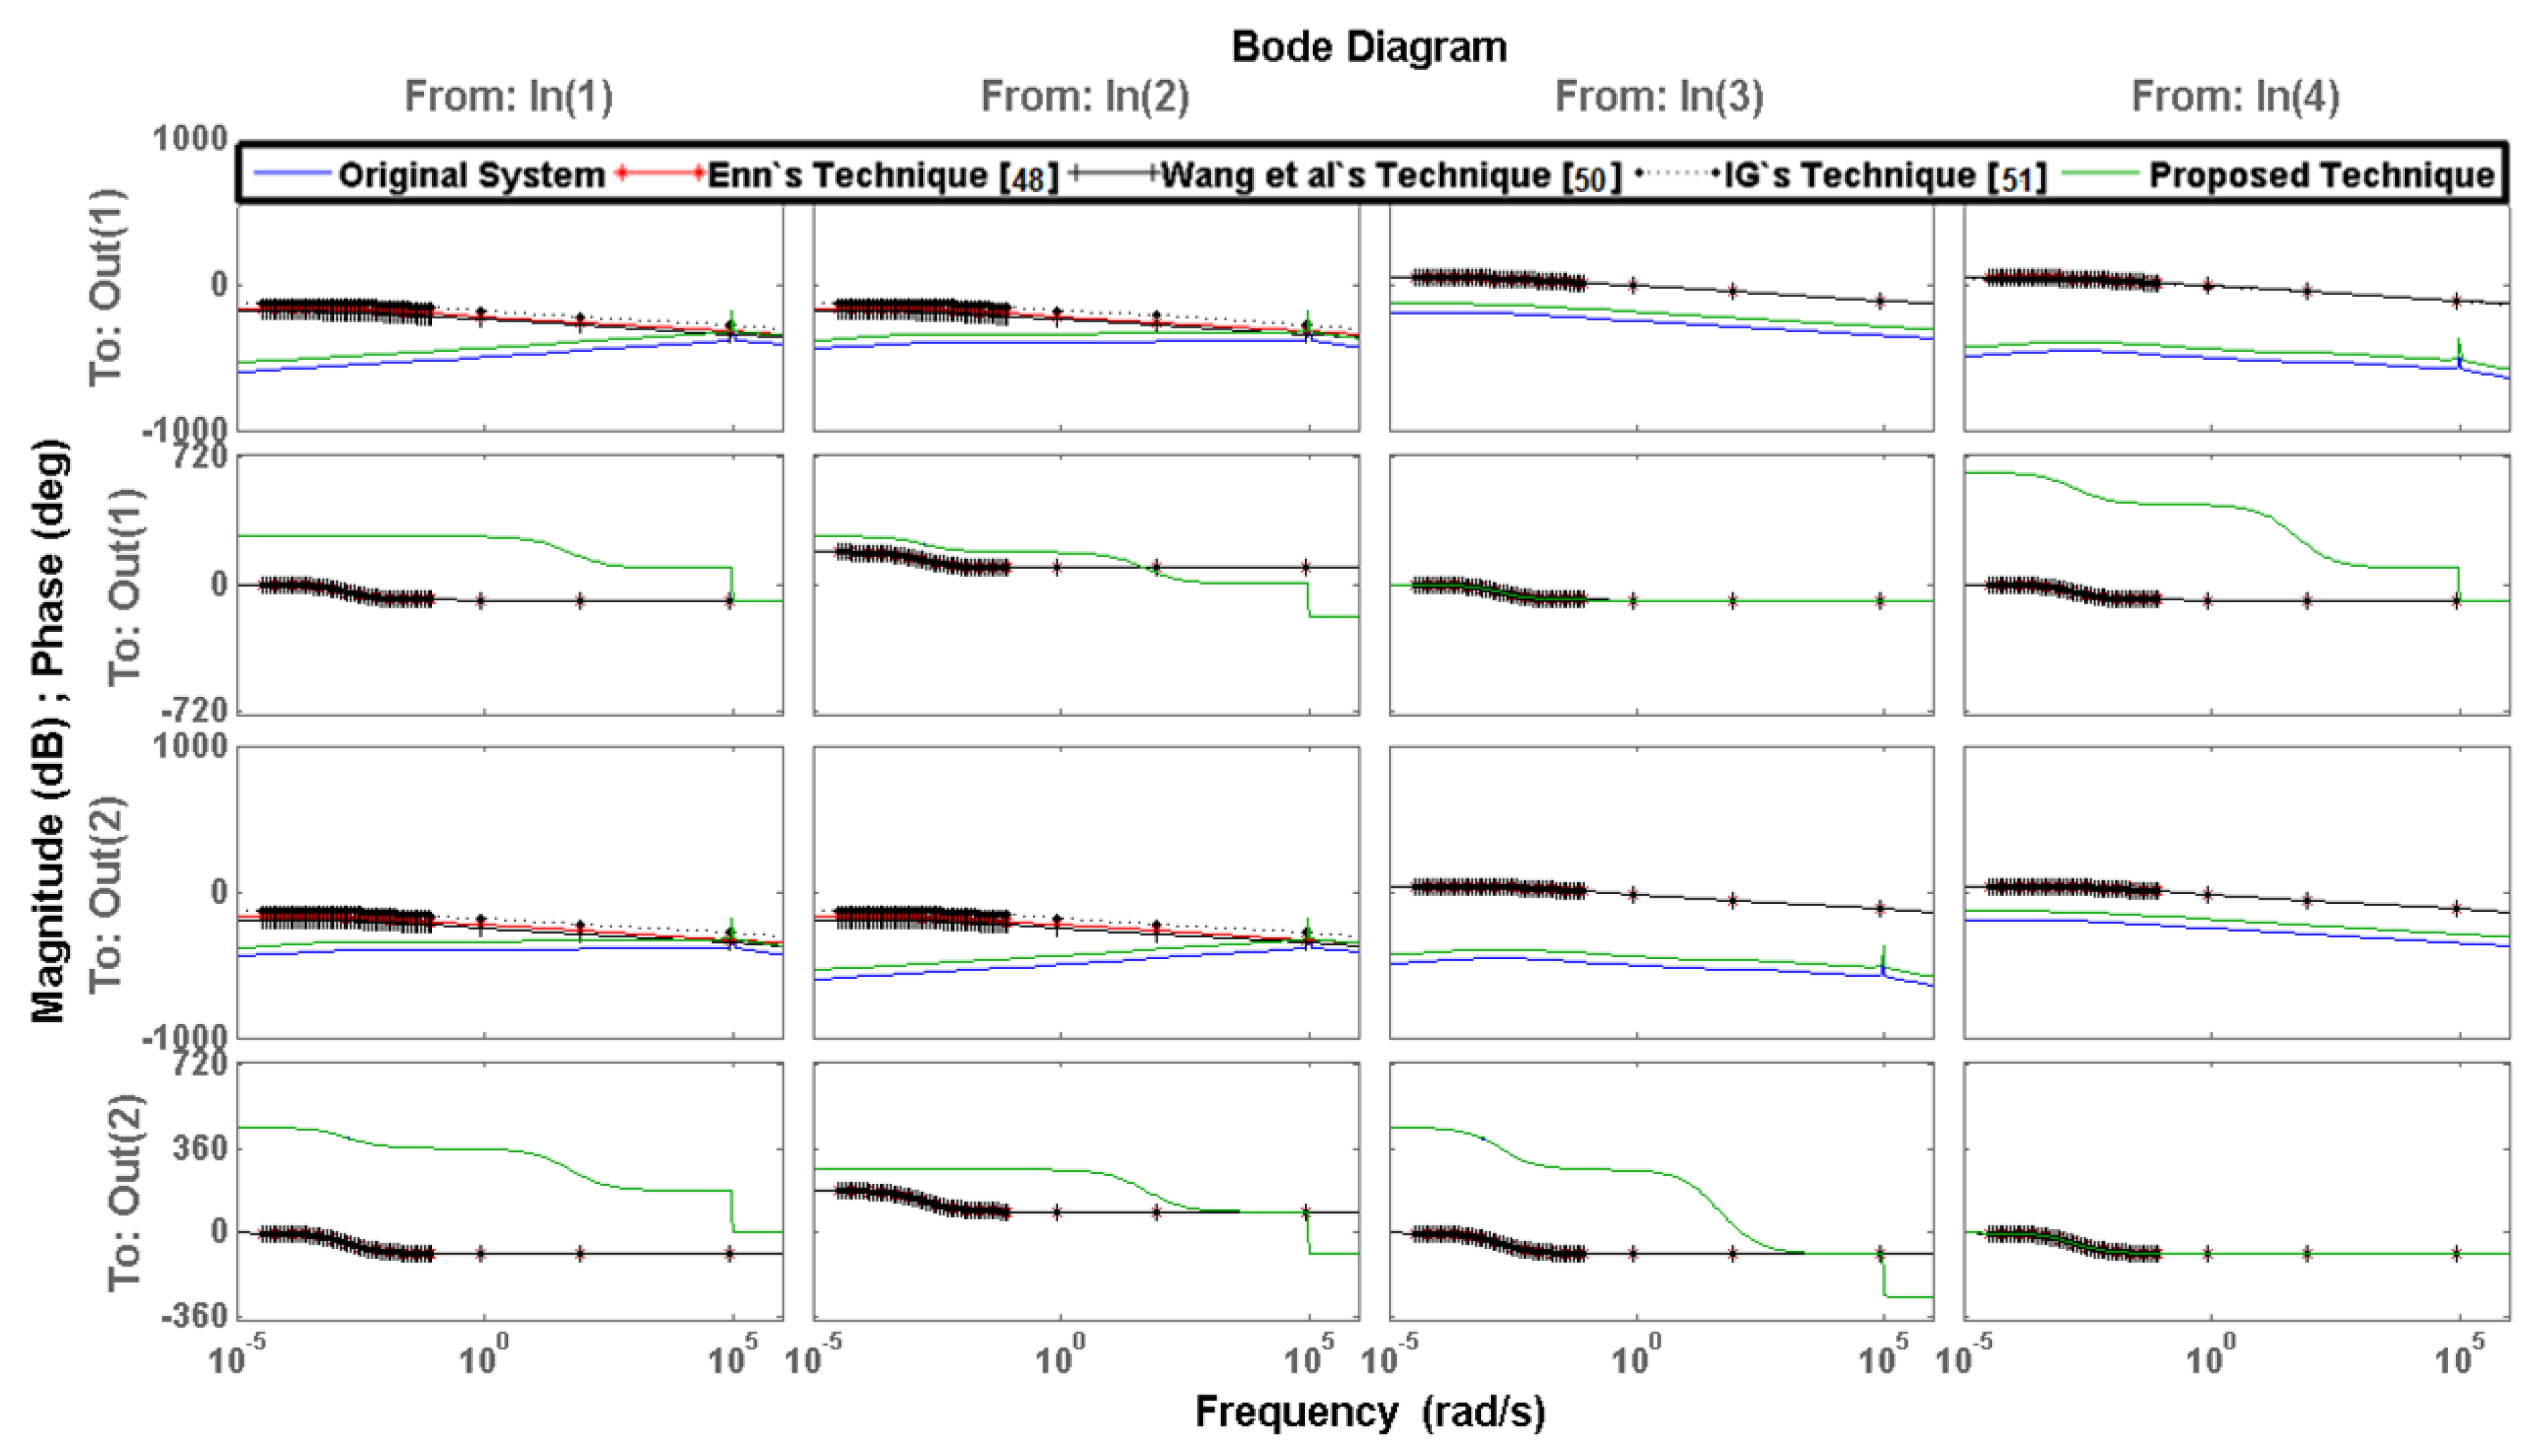
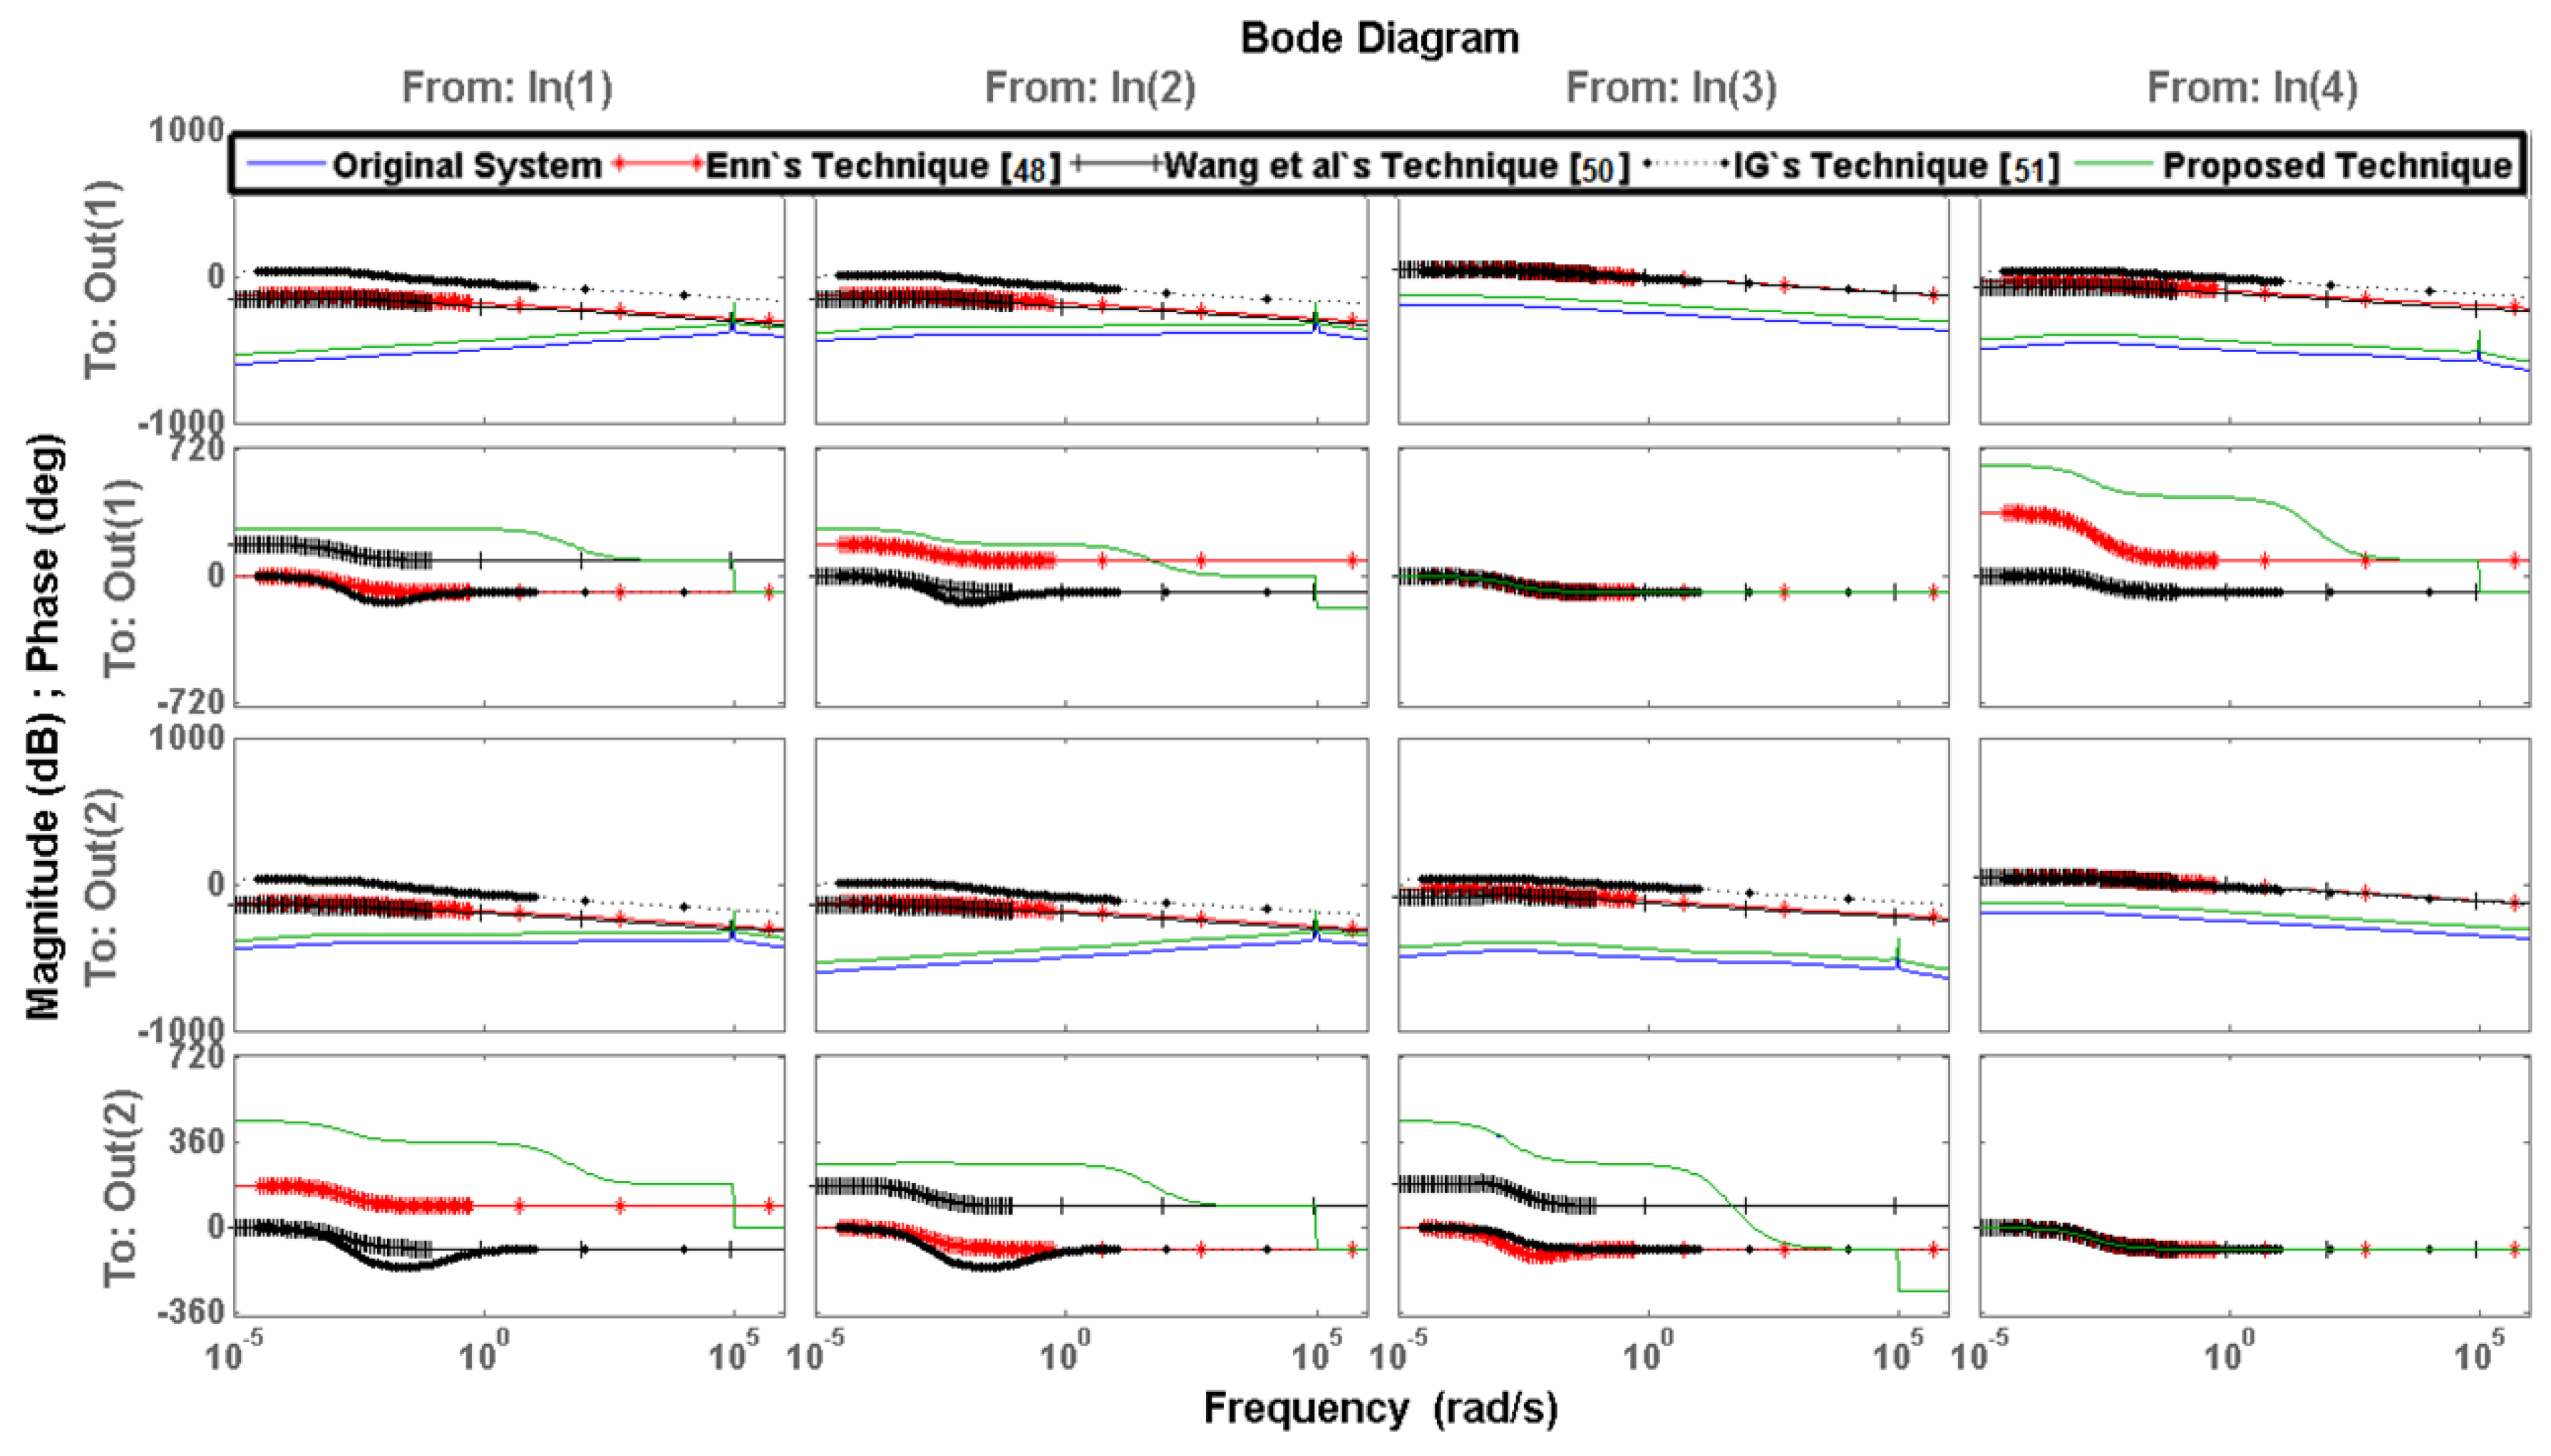
In this section, numerical examples of the DFIG based variable-speed wind turbine (double-cage induction generator) for the power system (induction model, current model) based on the multi-input multi-output continuous-time are given to show the comparison of the proposed technique with the existing frequency-limited model reduction technique for the LTI continuous-time system. Figure 5, Figure 6, Figure 7 and Figure 8 represent the Bode plot (magnitude, phase) comparison of corresponding ROMs obtained by existing ([48,50,51]) and the proposed approach with the original system, each Fig contains sub-figures which represent output/input Bode plot (magnitude, phase). Table 2 provide frequency response error comparison existing ([48,50,51]) and the proposed approaches. Moreover, Table 3 provide pole location of ROMs obtained by using [48] and the proposed technique.
Example 1.
Consider a LTI stable 6 t h order current model [24] with state-space representations given as following
A = 8.387 e 5 9.87 e 4 1.355 e 6 0 0.0003364 0 9.87 e 4 8.387 e 5 0 1.355 e 6 0 0.0003364 1.525 e 6 0 0.001151 9.87 e 4 0.0004567 0 0 1.525 e 6 9.87 e 4 0.001151 0 0.0004567 0.01859 0 0.02243 0 8.486 9.87 e 4 0 0.01859 0 0.02243 9.87 e 4 8.486
B = 314.2 0 0 0 0 314.2 0 0 0 0 314.2 0 0 0 0 314.2 0 0 0 0 0 0 0 0 C = 8.841 e 7 0 0.0006674 0 0.0002648 0 0 8.841 e 7 0 0.0006674 0 0.0002648 D = 0 0 0 0 0 0 0 0
with following input and output weighting state-space and transfer function form
A s i B s i C s i D s i = 3.5 0 0 0 0 0 2.7140 3.0727 0 3.5 0 0 0 0 2.1322 1.5113 0 0 3.5 0 0 0 0.0629 2.2097 0 0 0 3.5 0 0 2.4553 2.0511 0 0 0 0 3.5 0 0.0551 0.7959 0 0 0 0 0 3.5 2.3936 2.7463 1.2944 1.5014 0.6172 2.3110 0.9883 1.1701 0.3435 0.0242 4.1597 1.0678 0.4249 3.8991 2.3320 3.7967 0.0093 0.5500 1.3431 2.4536 1.3990 4.4122 1.5885 2.6226 0.1924 0.2762 2.4134 0.4846 3.6569 1.4699 3.8676 3.2373 0.5074 0.6962
A s o B s o C s o D s o = 9.5 0 0 0 0 0 0.0003 2.3255 0 9.5 0 0 0 0 1.5395 2.3644 0 0 9.5 0 0 0 1.7095 1.1209 0 0 0 9.5 0 0 0.0211 0.4569 0 0 0 0 9.5 0 2.6774 1.0568 0 0 0 0 0 9.5 2.4996 1.9353 1.3979 0.0675 0.9091 1.4310 0.2704 1.2563 0.3795 0.3168 0.1400 1.2630 1.0162 0.6166 0.3007 1.1226 0.0932 0.2812 1.1082 0.2471 1.4815 0.3249 1.0790 0.8758 0.2591 0.8201 0.0829 0.1726 1.4899 0.9437 0.6643 0.2409 0.3358 0.3421 1.1357 0.4073 1.1363 0.0223 1.2682 0.7933 0.3751 0.8720 0.6952 0.4716 0.4126 0.0649 0.5847 0.6940 0.1463 0.2680
Table 2 give a comparison for the frequency-response error and error bound σ ^ W o ( s ) ( G ( s ) G t r ( s ) V i ( s ) ) in the given frequency input and output weights, where G t r ( s ) are ROMs current models of 1st to 5th order obtained by using [50,51] and proposed technique. Pole-locations of ROMs obtained from Enns’s technique [48] and proposed technique are given in Table 3, it can be observed that Enns [48] gives unstable 3rd, 4th and 5th order ROMs with pole-location at s = 1.8141 e 3 ± 1.3912 e 6 i , 0.0282 , s = 2.0750 e 3 ± 1.3912 e 6 i , 2.0160 e 2 ± 1.3912 e 6 i and s = 2.0750 e 3 ± 1.3912 e 6 i , 2.0160 e 2 ± 1.3912 e 6 i , 1.2710 e 4 respectively. However, the proposed technique yields stable 1st, 2nd, 3rd, 4th and 5th order ROMs with pole-location at s = 0.0037 , s = 1.8171 e 3 ± 1.3915 e 6 i , s = 1.8171 e 3 ± 1.3915 e 6 i , 0.0387 , s = 5.2965 e 5 ± 9632.7 i , 0.0012433 ± 9632.7 i and s = 5.2972 e 5 ± 9632.7 i , 0.0012435 ± 9632.7 i , 4.2996 respectively. Figure 5 and Figure 6 provide a comparison for the frequency response Bode plot (magnitude, phase) in the given frequency weights for 1st and 2nd order ROMs respectively, which indicates that propsed techniques provide better approximation results when compared with existing frequency weighted stability preserving MOR approaches ([50,51]). Furthermore, the proposed technique provide low frequency-response approximation error comparable with existing stability preserving approaches ([50,51]) in the given frequency weights.
Example 2.
Consider a LTI stable 6th order flux model [24] with state-space representations given as following
A = 0.0016 9.8696 e 4 1.8597 e 5 0 0.0062 314.1593 9.8696 e 4 0.0016 0 1.8597 e 5 0 0 2.0922 e 5 0 0.0018 0 0.0070 0 0 2.0922 e 5 0 0.0018 0 0.0070 0.3442 0 0.3460 0 87.4326 0 0 0.3442 0 0.3460 0 0
B = 314.1593 0 0 0 0 314.1593 0 0 0 0 314.1593 0 0 0 0 314.1593 0 0 0 0 0 0 0 0 C = 1.2130 e 5 0 0.0010 0 0.0041 0 0 1.2130 e 5 0 1.2130 e 5 0 0.0041 D = 0 0 0 0 0 0 0 0
with following input and output weighting state-space and transfer function form
A s i B s i C s i D s i = 3.5 0 0 0 0 0 0.4779 2.5026 0 3.5 0 0 0 0 2.5243 3.1630 0 0 3.5 0 0 0 0.3737 3.1182 0 0 0 3.5 0 0 2.2882 1.1696 0 0 0 0 3.5 0 1.7296 2.4456 0 0 0 0 0 3.5 2.7267 0.6923 0.0458 1.3571 1.2082 1.3298 1.4680 0.0894 0.5216 0.7224 1.1161 0.9148 0.8651 0.0430 1.0690 1.0230 0.0967 0.1499 0.7500 0.9265 0.2744 0.7349 0.7507 0.0636 0.8181 0.6596 0.7199 1.2892 0.3599 0.2519 0.7066 0.1072 0.8175 0.5186 ,
A s o B s o C s o D s o = 9.5 0 0 0 0 0 1.8674 2.5329 0 9.5 0 0 0 0 1.7611 0.5843 0 0 9.5 0 0 0 0.6232 0.6778 0 0 0 9.5 0 0 0.9037 0.5121 0 0 0 0 9.5 0 1.4128 0.6830 0 0 0 0 0 9.5 0.6915 1.3071 0.4667 0.6583 0.9043 0.6363 1.3933 1.4446 0.6791 0.9133 1.3851 0.1667 1.0668 0.7618 1.0955 0.8202 0.3955 0.7962 0.6453 0.3871 0.3326 0.1283 0.7329 0.7817 0.3674 0.0987 0.2772 0.6131 0.1761 0.3937 0.8678 0.3474 0.9880 0.2619 1.3573 0.8923 0.4450 1.2015 0.3559 0.7333 0.0377 0.3354 1.4696 0.3933 0.4782 0.0438 0.6883 0.9361 0.8852 0.6797
Table 2 give a comparison for the frequency-response error and error bound σ ^ W o ( s ) ( G ( s ) G t r ( s ) V i ( s ) ) in the given frequency input and output weights, where G t r ( s ) are ROMs current models of 1st to 5th order obtained by using [50,51] and proposed technique. Pole-locations of ROMs obtained from Enns’s technique [48] and proposed technique are given in Table 3, it can be observed that Enns [48] gives unstable 3rd, 4th and 5th order ROMs with pole-location at s = 0.0001 , 0.0017 , 0.0023 , s = 1.5561 e 3 ± 9.8696 e 4 i , 0.0017 , 0.0017 and s = 1.5561 e 3 ± 9.8696 e + 04 i , 87.4326 , 0.0017 , 0.0017 respectively. However, the proposed technique yields stable 1st, 2nd, 3rd, 4th and 5th order ROMs with pole-location at s = 0.0019 , s = 0.0022 ± 0.0004 i , s = 0.0017 , 1.5561 e 3 ± 9.8696 e 4 i , s = 1.7761 e 3 ± 9.9879 e 4 i , 0.0017 , 0.0017 and s = 1.7761 e 3 ± 9.9879 e 4 i , 87.4326 , 0.0017 , 0.0017 respectively. Figure 7 and Figure 8 provide a comparison for the frequency response Bode plot (magnitude, phase) in the given frequency weights for 1st and 2nd order ROMs respectively, which indicates that propsed techniques provide better approximation results when compared with existing frequency weighted stability preserving MOR approaches ([50,51]). Furthermore, the proposed technique provide low frequency-response approximation error comparable with existing stability preserving approaches ([50,51]) in the given frequency weights.

8. Analysis and Discussion

It can be seen that in the given input/output frequency weights in the proposed technique compare well with Enns’s technique [48]. From Table 3 it can be seen that 3rd, 4th and 5th order ROMs of example 1 and 3rd, 4th and 5th order ROMs of Example 2 obtained by using Enns’s technique [48] yields unstable in the given both-sided frequency weights. However, the proposed technique yield stable ROMs in given frequency weights. Figure 5 and Figure 6) of Example 1 and Figure 7 and Figure 8 of Example 2 respectively provide a comparison for the frequency response Bode plot (magnitude, phase) in the given frequency weights for (1st, 2nd) and (1st, 2nd) order ROMs respectively, which indicates that the proposed technique provide better approximation results when compared with existing frequency weighted stability preserving MOR approaches ([50,51]). Moreover, the proposed technique also carry error bounds formula with low frequency-response approximation error along-with error bound value. From Table 2 it can be observed that frequency response approximation error attained by the proposed technique is mostly low as compared with other MOR techniques.

9. Conclusions

In this work, the frequency weighted MOR technique is presented which approximates the Variable-Speed Wind Turbines model in the presence of frequency weights. The proposed method is used to derived a stable ROMs and frequency response error comparison at different order is provided which is well comparable with the existing stability preserving MOR techniques (frequency weighted MOR). The frequency response error and error bound comparison of the proposed technique with existing methods is provided which shows that the proposed method provides better results. Numerical analysis of DCIM has proven that ROMs obtained by using the proposed method are stable. However, analysis, control, and design of the original large scale model is not an easy task to do, whereas, it can be performed easily for approximated systems. This paper produces steady and precise outcomes by using the proposed method which shows the effectiveness of the proposed method.

Author Contributions

S.B. (Sajid Bashir), S.B. (Sammana Batool) and M.I.1 developed the theory, mathematical solution to the problem, performed the simulation, and drafted the manuscript. M.I.2, M.I.A., F.M.M. and U.A. performed the evaluation, proof reading and analysis respectively. All authors have read and agreed to the published version of the manuscript.

Funding

This research received no external funding.

Institutional Review Board Statement

Not applicable.

Informed Consent Statement

Not applicable.

Data Availability Statement

No new data were created or analyzed in this study. Data sharing is not applicable to this article.

Acknowledgments

Authors thank National University of Science and Technology (NUST), Military College of Signals (MCS) for supporting this research work.

Conflicts of Interest

The authors declare no conflict of interest.

Abbreviations

The following abbreviations are used in this manuscript:
LVRTLow voltage ride through
HVRTHigh voltage ride through
SCIGSquirrel Cage Induction Generator
DFIGDoubly Fed Induction Generator
PMSGPermanent Magnet Synchronous Generator
SCIMSquirrel Cage Induction Machines
MORModel order reduction
ROMReduced order model
RSCRotor Side Converter
GSCGrid Side Converter
DCIMDouble Cage Induction Machine

References

  1. Giefer, L.A.; Staar, B.; Freitag, M. FPGA-Based Optical Surface Inspection of Wind Turbine Rotor Blades Using Quantized Neural Networks. Electronics 2020, 9, 1824. [Google Scholar] [CrossRef]
  2. Villena-Ruiz, R.; Honrubia-Escribano, A.; Jiménez-Buendía, F.; Molina-García, Á.; Gómez-Lázaro, E. Requirements for Validation of Dynamic Wind Turbine Models: An International Grid Code Review. Electronics 2020, 9, 1707. [Google Scholar] [CrossRef]
  3. Sahragard, A.; Falaghi, H.; Farhadi, M.; Mosavi, A.; Estebsari, A. Generation expansion planning in the presence of wind power plants using a genetic algorithm model. Electronics 2020, 9, 1143. [Google Scholar] [CrossRef]
  4. Abdollahi, A.; Ghadimi, A.A.; Miveh, M.R.; Mohammadi, F.; Jurado, F. Optimal power flow incorporating FACTS devices and stochastic wind power generation using krill herd algorithm. Electronics 2020, 9, 1043. [Google Scholar] [CrossRef]
  5. Lee, J.; Zhao, F. Global Wind Report 2019; Global Wind Energy Council: Brussels, Belgium, 2020; Available online: https://gwec.net/global-wind-report-2019/ (accessed on 27 December 2020).
  6. Ohlenforst, K.; Sawyer, S.; Dutton, A.; Backwell, B.; Fiestas, R.; Lee, J.; Qiao, L.; Zhao, F.; Balachandran, N. Global Wind Report 2018; Global Wind Energy Council: Brussels, Belgium, 2019; Available online: https://gwec.net/global-wind-report-2018/ (accessed on 27 December 2020).
  7. Mlecnik, E.; Parker, J.; Ma, Z.; Corchero, C.; Knotzer, A.; Pernetti, R. Policy challenges for the development of energy flexibility services. Energy Policy 2020, 137, 111147. [Google Scholar] [CrossRef]
  8. Lu, Y.; Khan, Z.A.; Alvarez-Alvarado, M.S.; Zhang, Y.; Huang, Z.; Imran, M. A critical review of sustainable energy policies for the promotion of renewable energy sources. Sustainability 2020, 12, 5078. [Google Scholar] [CrossRef]
  9. Schwarz, M.; Nakhle, C.; Knoeri, C. Innovative designs of building energy codes for building decarbonization and their implementation challenges. J. Clean. Prod. 2020, 248, 119260. [Google Scholar] [CrossRef]
  10. Nazir, M.S.; Mahdi, A.J.; Bilal, M.; Sohail, H.M.; Ali, N.; Iqbal, H.M. Environmental impact and pollution-related challenges of renewable wind energy paradigm–A review. Sci. Total Environ. 2019, 683, 436–444. [Google Scholar] [CrossRef]
  11. Andrić, I.; Koc, M.; Al-Ghamdi, S.G. A review of climate change implications for built environment: Impacts, mitigation measures and associated challenges in developed and developing countries. J. Clean. Prod. 2019, 211, 83–102. [Google Scholar] [CrossRef]
  12. Qiao, W.; Harley, R.G. Grid connection requirements and solutions for DFIG wind turbines. In Proceedings of the 2008 IEEE Energy 2030 Conference, Atlanta, GA, USA, 17–18 November 2008; pp. 1–8. [Google Scholar]
  13. Hlaing, S. Basic Concepts of Doubly Fed Induction Generator Driven by Wind Energy Conversion System. Int. J. Sci. Eng. Technol. Res. 2014, 3, 3242–3246. [Google Scholar]
  14. Tiwari, A.R.; Shewale, A.J.; Gagangras, A.; Lokhande, N.M. Comparison of various wind turbine generators. Multidiscplinary J. Res. Eng. Technol. 2014, 1, 129–135. [Google Scholar]
  15. Yang, B.; Jiang, L.; Wang, L.; Yao, W.; Wu, Q. Nonlinear maximum power point tracking control and modal analysis of DFIG based wind turbine. Int. J. Electr. Power Energy Syst. 2016, 74, 429–436. [Google Scholar] [CrossRef] [Green Version]
  16. Tande, J.O.; Di Marzio, G.; Uhlen, K. System Requirements for Wind Power Plants; SINTEF: Trondheim, Norway, 2007. [Google Scholar]
  17. Kazachkov, Y.; Feltes, J.W.; Zavadil, R. Modeling wind farms for power system stability studies. In Proceedings of the 2003 IEEE Power Engineering Society General Meeting (IEEE Cat. No. 03CH37491), Toronto, ON, Canada, 13–17 July 2003; Volume 3, pp. 1526–1533. [Google Scholar]
  18. Rodríguez, J.M.; Fernández, J.L.; Beato, D.; Iturbe, R.; Usaola, J.; Ledesma, P.; Wilhelmi, J.R. Incidence on power system dynamics of high penetration of fixed speed and doubly fed wind energy systems: Study of the Spanish case. IEEE Trans. Power Syst. 2002, 17, 1089–1095. [Google Scholar] [CrossRef]
  19. Ullah, N.R.; Larsson, A.; Petersson, A.; Karlsson, D. Detailed modeling for large scale wind power installations-a real project case study. In Proceedings of the 2008 Third International Conference on Electric Utility Deregulation and Restructuring and Power Technologies, Nanjing, China, 6–9 April 2008; pp. 46–56. [Google Scholar]
  20. Reddy, S.S.; Prathipati, K.; Lho, Y.H. Transient stability improvement of a system connected with wind energy generators. Int. J. Emerg. Electr. Power Syst. 2017, 18. [Google Scholar] [CrossRef]
  21. Maity, D.; Chowdhury, A.; Reddy, S.S.; Panigrahi, B.K.; Abhyankar, A.R.; Mallick, M.K. Joint energy and spinning reserve dispatch in wind-thermal power system using IDE-SAR technique. In Proceedings of the 2013 IEEE Symposium on Swarm Intelligence (SIS), Singapore, 16–19 April 2013; pp. 284–290. [Google Scholar]
  22. Ekanayake, J.B.; Holdsworth, L.; Wu, X.; Jenkins, N. Dynamic modeling of doubly fed induction generator wind turbines. IEEE Trans. Power Syst. 2003, 18, 803–809. [Google Scholar] [CrossRef] [Green Version]
  23. Akhmatov, V.; Nielsen, A.H.; Pedersen, J.K.; Nymann, O. Variable-speed wind turbines with multi-pole synchronous permanent magnet generators. Part I: Modelling in dynamic simulation tools. Wind. Eng. 2003, 27, 531–548. [Google Scholar] [CrossRef]
  24. Ugalde-Loo, C.E.; Ekanayake, J.B. State-space modelling of variable-speed wind turbines: A systematic approach. In Proceedings of the 2010 IEEE International Conference on Sustainable Energy Technologies (ICSET), Kandy, Sri Lanka, 6–9 December 2010; pp. 1–6. [Google Scholar]
  25. Ackermann, T. Wind Power in Power Systems; John Wiley and Sons: Hoboken, NJ, USA, 2005. [Google Scholar]
  26. Ramtharan, G.; Jenkins, N.; Anaya-Lara, O. Modelling and control of synchronous generators for wide-range variable-speed wind turbines. Wind. Energy Int. J. Prog. Appl. Wind. Power Convers. Technol. 2007, 10, 231–246. [Google Scholar] [CrossRef]
  27. Holdsworth, L.; Wu, X.; Ekanayake, J.B.; Jenkins, N. Comparison of fixed speed and doubly-fed induction wind turbines during power system disturbances. IEE Proc. Gener. Transm. Distrib. 2003, 150, 343–352. [Google Scholar] [CrossRef]
  28. Quang, N.P.; Dittrich, J.A. Vector Control of Three-Phase AC Machines; Springer: Berlin/Heidelberg, Germay, 2008; Volume 2. [Google Scholar]
  29. Ekanayake, J.B.; Holdsworth, L.; Jenkins, N. Comparison of 5th order and 3rd order machine models for doubly fed induction generator (DFIG) wind turbines. Electr. Power Syst. Res. 2003, 67, 207–215. [Google Scholar] [CrossRef]
  30. Pulgar-Painemal, H.A.; Sauer, P.W. Reduced-order model of type-c wind turbine generators. Electr. Power Syst. Res. 2011, 81, 840–845. [Google Scholar] [CrossRef]
  31. Slootweg, J.; Polinder, H.; Kling, W. Reduced-order modelling of wind turbines. Wind. Power Power Syst. 2005, 25. [Google Scholar] [CrossRef]
  32. Rezaei, M.M.; Behzad, M.; Haddadpour, H.; Moradi, H. Development of a reduced order model for nonlinear analysis of the wind turbine blade dynamics. Renew. Energy 2015, 76, 264–282. [Google Scholar] [CrossRef]
  33. García Planas, M.I. Input observability analysis of fixed speed wind turbine. In Proceedings of the 3rd International Conference on Energy, Environment, Devices, Systems, Communications, Computers, Rovaniemi, Finland, 18–20 April 2012; WSEAS Press: Athens, Greece, 2012; pp. 13–19. [Google Scholar]
  34. Zhao, X.; Weiss, G. Well-posedness and controllability of a wind turbine tower model. IMA J. Math. Control. Inf. 2011, 28, 103–119. [Google Scholar] [CrossRef]
  35. Al-Iedani, I.; Gajic, Z. Order reduction of a wind turbine energy system via the methods of system balancing and singular perturbations. Int. J. Electr. Power Energy Syst. 2020, 117, 105642. [Google Scholar] [CrossRef]
  36. Lee, K.; Carlberg, K.T. Model reduction of dynamical systems on nonlinear manifolds using deep convolutional autoencoders. J. Comput. Phys. 2020, 404, 108973. [Google Scholar] [CrossRef] [Green Version]
  37. Lin, K.K.; Lu, F. Data-driven model reduction, Wiener projections, and the Koopman-Mori-Zwanzig formalism. J. Comput. Phys. 2020, 424, 109864. [Google Scholar] [CrossRef]
  38. Idiart, M.I.; Lahellec, N.; Suquet, P. Model reduction by mean-field homogenization in viscoelastic composites. I. Primal theory. Proc. R. Soc. 2020, 476, 20200407. [Google Scholar] [CrossRef]
  39. Klus, S.; Nüske, F.; Peitz, S.; Niemann, J.H.; Clementi, C.; Schütte, C. Data-driven approximation of the Koopman generator: Model reduction, system identification, and control. Phys. Nonlinear Phenom. 2020, 406, 132416. [Google Scholar] [CrossRef] [Green Version]
  40. Parish, E.J.; Wentland, C.R.; Duraisamy, K. The Adjoint Petrov–Galerkin method for non-linear model reduction. Comput. Methods Appl. Mech. Eng. 2020, 365, 112991. [Google Scholar] [CrossRef] [Green Version]
  41. Campbell, K.; Sreeram, V.; Wang, G. A Frequency-weighted discrete system balanced truncation method and an error bound. In Proceedings of the 2000 American Control Conference. ACC (IEEE Cat. No. 00CH36334), Chicago, IL, USA, 28–30 June 2000; Volume 4, pp. 2403–2404. [Google Scholar]
  42. Varga, A.; Anderson, B.D. Accuracy enhancing methods for the frequency-weighted balancing related model reduction. In Proceedings of the 40th IEEE Conference on Decision and Control (Cat. No. 01CH37228), Orlando, FL, USA, 4–7 December 2001; Volume 4, pp. 3659–3664. [Google Scholar]
  43. Imran, M.; Ghafoor, A.; Sreeram, V. Frequency weighted model order reduction technique and error bounds for discrete time systems. Math. Probl. Eng. 2014, 2014, 498453. [Google Scholar] [CrossRef] [Green Version]
  44. Haider, K.S.; Ghafoor, A.; Imran, M.; Malik, F.M. Model reduction of large scale descriptor systems using time limited gramians. Asian J. Control 2017, 19, 1217–1227. [Google Scholar] [CrossRef]
  45. Imran, M.; Ghafoor, A. Frequency weighted passivity preserving model reduction technique. IMA J. Math. Control. Inf. 2018, 35, 837–844. [Google Scholar] [CrossRef]
  46. Haider, S.; Ghafoor, A.; Imran, M.; Malik, F.M. Time-limited Gramians-based model order reduction for second-order form systems. Trans. Inst. Meas. Control 2019, 41, 2310–2318. [Google Scholar] [CrossRef]
  47. Moore, B. Principal component analysis in linear systems: Controllability, observability, and model reduction. IEEE Trans. Autom. Control 1981, 26, 17–32. [Google Scholar] [CrossRef]
  48. Enns, D.F. Model reduction with balanced realizations: An error bound and a frequency weighted generalization. In Proceedings of the 23rd IEEE Conference on Decision and Control, Las Vegas, NV, USA, 12–14 December 1984; pp. 127–132. [Google Scholar]
  49. Sreeram, V.; Anderson, B.; Madievski, A. New results on frequency weighted balanced reduction technique. In Proceedings of the 1995 American Control Conference-ACC’95, Seattle, WA, USA, 21–23 June 1995; Volume 6, pp. 4004–4009. [Google Scholar]
  50. Wang, G.; Sreeram, V.; Liu, W. A new frequency-weighted balanced truncation method and an error bound. IEEE Trans. Autom. Control 1999, 44, 1734–1737. [Google Scholar] [CrossRef] [Green Version]
  51. Imran, M.; Ghafoor, A.; Sreeram, V. A frequency weighted model order reduction technique and error bounds. Automatica 2014, 50, 3304–3309. [Google Scholar] [CrossRef]
  52. Gawronski, W.; Juang, J.N. Model reduction in limited time and frequency intervals. Int. J. Syst. Sci. 1990, 21, 349–376. [Google Scholar] [CrossRef]
  53. Wang, D.; Zilouchian, A. Model reduction of discrete linear systems via frequency-domain balanced structure. IEEE Trans. Circuits Syst. Fundam. Theory Appl. 2000, 47, 830–837. [Google Scholar] [CrossRef]
  54. Gugercin, S.; Antoulas, A.C. A survey of model reduction by balanced truncation and some new results. Int. J. Control 2004, 77, 748–766. [Google Scholar] [CrossRef]
  55. Ghafoor, A.; Sreeram, V. A survey/review of frequency-weighted balanced model reduction techniques. J. Dyn. Syst. Meas. Control 2008, 130, 061004. [Google Scholar] [CrossRef]
  56. Ghafoor, A.; Sreeram, V. Model reduction via limited frequency interval Gramians. IEEE Trans. Circuits Syst. Regul. Pap. 2008, 55, 2806–2812. [Google Scholar] [CrossRef]
  57. Imran, M.; Ghafoor, A. Stability preserving model reduction technique and error bounds using frequency-limited Gramians for discrete-time systems. IEEE Trans. Circuits Syst. II Express Briefs 2014, 61, 716–720. [Google Scholar] [CrossRef]
  58. Imran, M.; Ghafoor, A. A frequency limited interval Gramians-based model reduction technique with error bounds. Circuits Syst. Signal Process. 2015, 34, 3505–3519. [Google Scholar] [CrossRef]
  59. Imran, M.; Ghafoor, A. Frequency limited model reduction techniques with error bounds. IEEE Trans. Circuits Syst. II Express Briefs 2017, 65, 86–90. [Google Scholar] [CrossRef]
  60. Hammarling, S.J. Numerical solution of the stable, non-negative definite lyapunov equation lyapunov equation. IMA J. Numer. Anal. 1982, 2, 303–323. [Google Scholar] [CrossRef] [Green Version]
  61. Ghafoor, A. Frequency-Weighted Model Reduction and Error Bounds; University of Western Australia: Crawley, WA, Australia, 2007. [Google Scholar]
Figure 1. Conventional Integration of DFIG with grid.
Electronics 10 00044 g001
Figure 2. Conventional Integration of SCIG with grid.
Electronics 10 00044 g002
Figure 3. Electrical circuit of a double cage induction machines in the arbitrary two-axis, dq-reference frame.
Electronics 10 00044 g003
Figure 4. Electrical circuit Diagram of Wound Rotor (DFIG) and Single Cage (SCIG) in the arbitrary two-axis, dq-reference frame.
Electronics 10 00044 g004
Figure 5. Frequency response Bode plot (magnitude and phase) in the given frequency weights of 1st order for Example 1.
Electronics 10 00044 g005
Figure 6. Frequency response Bode plot (magnitude and phase) in the given frequency weights of 2nd order for Example 1.
Electronics 10 00044 g006
Figure 7. Frequency response Bode plot (magnitude and phase) in the given frequency weights of 1st order for Example 1.
Electronics 10 00044 g007
Figure 8. Frequency response Bode plot (magnitude and phase) in the given frequency weights of 2nd order for Example 1.
Electronics 10 00044 g008
Table 1. Parameters used for the Double Cage Induction Machine.
Parameters for Double Cage Induction Machine (DCIM)
StatorDouble Cage Rotor
R s , L l s Stator Resistance and Leakage Inductance R ´ r 1 , L ´ l r 1 Rotor resistance and leakage inductance of cage 1
L s Total Stator inductance R ´ r 2 , L ´ l r 2 Rotor resistance andleakage inductance of cage 2
V q s , i q s q-axis stator voltage and current L ´ r 1 , L ´ r 2 Total rotor inductances of cage1 and 2
V d s , i d s d-axis stator voltage and current i ´ d r 1 , i ´ d r 2 d-axis rotor current of cage 1 and 2
φ d s Stator d axis flux i ´ q r 1 , i ´ q r 2 q-axis rotor current of cage 1 and 2
φ q s Stator q axis fluxes φ ´ d r 1 , φ ´ q r 1 d and q-axis rotor fluxes of cage 1
φ ´ d r 2 , φ ´ q r 2 d and q-axis rotor fluxes of cage 2
L m Magnetizing inductance
HCombined rotor and load inertia constant. Set to infinite to simulate a locked rotor.
ω m Angular velocity of rotor
pNumber of pole pairs
T e Electromagnetic torque
T m Shaft mechanical torque
FCombined rotor and load viscous friction coefficient
P s Stator active power
Q s Stator reactive power
P r Rotor active power
Q r Rotor reactive power
P m Mechanical power
Table 2. Frequency response error σ ^ W o ( s ) ( G ( s ) G t r ( s ) ) V i ( s ) for Examples 1 and 2 using frequency weighted MOR.
ExamplesWeightsOrder
of ROMs
Frequency Response Error σ ^ W o ( s ) ( G ( s ) G tr ( s ) ) V i ( s ) and Error Bound
Error ValueError Bound
Example 1Input Enns [48]Wang et al. [50]IG [51]ProposedWang et al [50]IG [51]Proposed
1st210416312363119105212.5089 e 7 1.5787 e 7 6.9691 e 5
2nd210412869128691874.951.0394 e 6 6.5403 e 5 9.3939 e 7
3rd15.19242.53642.5316.68266711419771.471 e 7
4th0.000125040.000362440.000365535.3999 e 5 0.456760.28740.012688
5th0.000194720.000584350.000584529.7367 e 5 0.228280.143640.0063412
Output1st600.8336053605600.837360.17360.11226.7
2nd17.468104.81104.8117.468787.08787.08131.18
3rd781.131292.71292.7272.5633356209887.355 e 6
4th0.000125040.000137690.000234025.8358 e 5 0.0189230.0119070.097036
5th0.000194720.00113340.0011523.997 e 5 0.0094410.00594050.048396
Both1st210416312363119105212.5089 e 7 1.5787 e 7 6.9691 e 5
2nd15.19245.57445.5697.59571.6103 e 6 1.0132 e 6 44730
3rd(Unstable)2343.42343.4390.578.0515 e 5 5.0662 e 5 22365
4th(Unstable)204.75204.7534.125393.54393.5465.59
5th(Unstable)0.00025980.000350155.0657 e 5 0.000130760.000130762.1794 e 5
Example 2Input1st25.423160.96133.56220.411174.325341076.2
2nd4.79199.44369.44361.573915471.55341.611
3rd122.4623.1059.443611.12576.99935.97420.807
4th0.00102320.00103620.0010360.000172690.00251480.39570.0022101
5th5.0869 e 5 8.5879 e 5 0.00010782.0143 e 5 0.000149160.197850.00026321
Output1st91.661654.98549.9741.261136.92992.71103.5
2nd3.728122.36922.3693.5267.1241942.341.8
3rd9.812522.36967.1557.2133.563971.1720.6
4th0.000266950.000649970.000717410.000108330.00137560.000980940.00041012
5th5.8325 e 5 0.00022880.00022880.000106530.000352210.000257250.00012167
Both1st25.423100.1149.2115.828223.2434261384.5
2nd4.791914.37614.37642.7592110.328221780.36
3rd(Unstable)14.376303.1115.821055.214112176.26
4th(Unstable)0.000982410.00127630.000210140.0425063.34150.00083643
5th(Unstable)5.1359 e 5 9.0852 e 5 8.5553 e 6 0.000906270.876291.787 e 5
Table 3. Poles locations of ROMs obtained using frequency weighted MOR.
ExamplesOrder
of
ROMs
Poles Location of Enns [48] and Proposed Technique
Enns’s Technique [48]Proposed Technique
Example 11st 0.0035 0.0037
2nd 1.8141 e 3 ± 1.3912 e 6 i 1.8171 e 3 ± 1.3915 e 6 i
3rd 1.8141 e 3 ± 1.3912 e 6 i , 0.0282 1.8171 e 3 ± 1.3915 e 6 i , 0.0387
4th 2.0750 e 3 ± 1.3912 e 6 i , 2.0160 e 2 ± 1.3912 e 6 i 5.2965 e 5 ± 9632.7 i , 0.0012433 ± 9632.7 i
5th 2.0750 e 3 ± 1.3912 e 6 i , 2.0160 e 2 ± 1.3912 e 6 i , 1.2710 e 4 5.2972 e 5 ± 9632.7 i , 0.0012435 ± 9632.7 i , 4.2996
Example 21st 0.0017 0.0019
2nd 0.0017 , 0.0017 0.0022 ± 0.0004 i
3rd 0.0001 , 0.0017 , 0.0023 0.0017 , 1.5561 e 3 ± 9.8696 e 4 i
4th 1.5561 e 3 ± 9.8696 e 4 i , 0.0017 , 0.0017 1.7761 e 3 ± 9.9879 e 4 i , 0.0017 , 0.0017
5th 1.5561 e 3 ± 9.8696 e 4 i , 87.4326 , 0.0017 , 0.0017 1.7761 e 3 ± 9.9879 e 4 i , 87.4326 , 0.0017 , 0.0017
Publisher’s Note: MDPI stays neutral with regard to jurisdictional claims in published maps and institutional affiliations.