Article

Understanding the Global Sensory Landscape for Facial Cleansing/Makeup Remover Wipes

by
Huajing Xing
1,
Annlyse R. Krogmann
2,
Claudette Vaught
1 and
Edgar Chambers IV
3,*
1
Johnson and Johnson Consumer Inc., New Brunswick, NJ 08933, USA
2
Sensory Spectrum, Inc., New Providence, NJ 07974, USA
3
Center for Sensory Analysis and Consumer Behavior, Kansas State University, 1310 Research Park Drive, Manhattan, KS 66502, USA
*
Author to whom correspondence should be addressed.
Cosmetics 2019, 6(3), 44; https://doi.org/10.3390/cosmetics6030044
Submission received: 30 June 2019 / Revised: 9 July 2019 / Accepted: 18 July 2019 / Published: 21 July 2019

Abstract

:
Makeup chemistries have evolved over the recent years and have become more long-wearing, waterproof and difficult to remove. Thus, many changes have occurred among products designed to remove makeup. Specifically, the facial cleansing/makeup remover wipes category is challenged to establish new strategies and adapt to the changing consumer needs and the evolving competitive landscape. A global product category review can provide the upfront understanding necessary to establish fundamental knowledge. That knowledge can in turn be leveraged when developing future products. A customized descriptive analysis method was applied to address the unique challenges of the category. The method leveraged existing methods and was augmented with new descriptive modalities, specific to the unique developments in the category. A total of seventy-one attributes were identified that spanned visual and tactile cues of the wipes, cleansing performance cues during use, as well as skin look and feel attributes after use. Thirteen facial cleansing/makeup remover wipes from global markets were selected for testing based on commercial and historical insights. Three sensorial perceptual maps were generated displaying the profiles of the thirteen products in three areas of product properties—visual and tactile, cleaning performance, and skin look and feel. These study results combined with existing consumer insights helped the R&D team to establish strategies to guide product development for this category.

1. Introduction

The facial cleansing/makeup remover wipe is a unique product category with a fast-growing rate in the personal care market. Based on Euromonitor data, retail value in the personal care wipes market has grown roughly an additional $900 million from the years 2009 to 2014. It is predicted to have a nearly 3% growth in volume terms, at compound annual growth rate, during 2014 to 2019. With makeup becoming more long-wearing, waterproof and difficult to remove in the recent years, innovation and reformulation of the wipe category are in demand to adapt to the changing makeup needs.
Facial cleansing wipes/makeup remover wipes are one kind of wet wipes consisting of a nonwoven fabric material and a liquid part, which is also known as “juice” or solution. The liquid part is typically water-, ethanol- or oil-based, and 90%–98% of the liquid is water in the wipes. The main composition of the liquid for makeup remover wipes are similar to other wet wipes, which includes an emollient to improve the glide of the wipe on the skin and to hydrate the residues to reduce dryness and irritation; a surfactant and/or an emulsifier to emulsify the emollient or any other water insoluble oils present in the composition with the function of breaking down the dirt, oil, or chemicals in the makeup products; a rheology modifier to increase the viscosity of the composition at lower temperatures as well as at process temperatures; a preservative to reduce the growth of microorganisms and to enable a longer shelf life; and a soothing agent to reduce the irritation or stinging/burning/itching effect of chemicals [1,2].
Descriptive analysis (DA) is a method that uses a trained panel (typically 5 to 15 panelists) to detect (discriminate) and describe both qualitative and quantitative sensory characteristics of a product [3,4]. Different descriptive methods have been developed since the 1950s, which include the flavor profile [5], the texture profile [6], qantitative descriptive analysis [7], free choice profiling [8], Spectrum Descriptive AnalysisTM [9], as well as some hybrid descriptive analysis methods, etc. Recently, alternative and rapid descriptive analysis methods have been introduced, such as flash profile [10], free sorting and projective mapping [11,12], ideal profiling [13,14], and high identity traits (HITS) profiling [15]. These types of rapid methods require less time for panel training and lexicon development resulting in faster delivery of study results to address relevant business needs.
Conventional DA typically uses a group of eight to 15 panelists. A list of attributes has been identified to evaluate the specific product category using an intensity scale. The key procedures of conventional DA involve attribute generation, alignment and definition, panel training with references, panel validation, product evaluation, panel performance monitoring and panel retraining and validation. The Spectrum Descriptive AnalysisTM method is one of the most popular DA methods among the conventional DA methods. The lexicon (attributes) for this method is typically based on common terminology agreed upon by panelists. References are used for attribute clarification and panel training. A 15-point universal scale is typically used for food, beverage and fragrance product evaluation, and a 100-point universal scale is typically used for non-food, personal care product evaluation, such as lotions, creams, oils, pomades and fabrics/paper goods [3].
Descriptive sensory analysis methods on fabric, paper, nonwoven products as well as DA methods on skin care lotions and cleansers have been published throughout the years. Civille and Dus [16] defined the terminology to describe hand-feel properties of paper and fabric based on previous work in this area as well as newly developed attributes generated from their research. The tactile and sound properties were key areas that were defined, with tactile properties including mechanical, geometrical, moisture and thermal characteristics. Mechanical characteristics refer to attributes related to the reaction of the product to stress and strain, such as stiffness, force to press, etc. Geometrical properties are related to the size, shape, orientation of the particles, such as fuzziness and grittiness. Moisture properties are the attributes related to the perception of water and/oil from the product. Thermal characteristics refers to the attributes associated with heat transfer, such as cool or warm sensations. Bacci et al. [17] discussed the sensory evaluation and instrumental measurement of wool fabrics. For the sensory evaluation part, they streamlined 12 sensory attributes based on Civille and Dus’s work to be more specific towards wool fabric, which also covered major textile properties previously discussed. Sular and Okur [18] reviewed the sensory evaluation work conducted on textile fabrics and focused on stiffness, thickness and smoothness attributes, which were the key components of fabric handle of suitings (the feel of the fabric material). Robinson et al. [19] studied the effect of pattern design on the sensory properties of fabrics using the sensory terms from Civille and Dus’ work and added a term called “surface texturing”, which referred to the overall feel of a textured design on the surface of the fabric. Yenket at al. [20] showed that the influence of color on hand characteristics was essentially nonexistent for both descriptive and consumer panelists.
Separate from the fabric properties, skin perception is another key component for wet wipe evaluation. Skin perception related attributes can be leveraged from the work done on other skin care products, such as lotion, cleanser, etc. Lexicon and descriptive analysis work have been widely studied. Meilgaard et al. [3] listed the example of facial wipes skin-feel appearance and texture lexicon, which captured in-use, rinse/wet skin, and after-feel/dry skin perception related attributes. Lee et al. [21] published the terminology using the Spectrum Descriptive AnalysisTM method to evaluate skin care products including aqua cream. Twenty-seven attributes focusing on skin perception were generated with most of them relevant to the skin perception properties of using a wet wipe, especially for facial cleansing/makeup remover wipes.
In addition to the fabric properties and skin perception properties, what makes this research unique is the cleansing performance piece, which is another critical part of the evaluation for facial cleansing/makeup remover wipes. The main purpose of using the wipes is to clean the face, remove dirt, oil residue and makeup products from the skin. The cleansing performance or how effectively the wipes can clean makeup and dirt is a key component of this product category. A customized descriptive analysis method covering all aspects of sensory properties of facial cleansing/makeup remover wipes will provide a full understanding of wipe characteristics to guide product development.
The objectives of this research were: (a) to use descriptive sensory analysis methods to gain a market overview of facial cleansing/makeup removal wipes in the global market; (b) to understand product similarities and differences between one manufacturer’s set of wipes and wipes from other key competitors.

2. Materials and Methods

2.1. Customized Sensory Descriptive Analysis Method

A customized Spectrum Descriptive Analysis™ method was applied to evaluate facial cleansing/makeup removal wipes. The method leveraged existing methods, such as lexicon that have been developed for fabric and cloth evaluation [16,22] as well as hand and feel properties for lotion and cleanser products [3,23]. In addition, new descriptive modalities, specific to the uniqueness of the makeup remover wipe category, such as cleansing performance related attributes, were added to the lexicon development. A total of seventy-one attributes (Table 1) were identified covering three areas (visual and tactile, cleaning performance and skin perception). Visual and tactile attributes include visual embossing (e.g., depth of micro and macro embossing, translucency), surface transfer (e.g., amount of product, amount of fabric moistness), surface roughness (e.g., gritty, grainy, lumpy), and tactile manipulation (e.g., thickness of the wipe, force to gather, stiffness). Cleaning performance attributes focused on removing of foundation product on the cheek, such as the number of laps to clean, occlusion, amount of visual coverage, evenness of coverage, amount of residue. Skin perception properties, including both visual and tactile perception, cover attributes such as stiffness, tautness, roughness, type and amount of residue. Multiple evaluation time intervals including baseline, after applying liquid foundation, immediately after using wipes, and 5 min after using wipes were captured during the test. Neutrogena liquid foundation was selected to be used as the makeup product to be removed based on the purpose of the study, and instructions on how to apply and remove the liquid foundation were specified in the protocol.

2.2. Product Evaluation

Thirteen globally commercialized wipe products from four regions were selected for testing based on commercial information and sales volume. Seven products from North America (N.A.), two from Europe, Middle East, Africa (EMEA), two from Asia Pacific (APAC) and two from Latin America (LATAM) were evaluated by the descriptive analysis panel. Among the thirteen products, three were “Company” (N) products and ten were key competitors’ products (Table 2).
Nine panelists from the Sensory Spectrum™ Personal Care Panel in Kannapolis, NC participated in the lexicon development, training and product evaluation. Panelists were trained on a 100-point universal scale with 0 = none and 100 = very strong/very high. All panelists were extensively trained in evaluation of lotions, creams, gels, cleansers and related personal care products and they received a minimum of 100 h of training and practice on wipes before evaluating the tested products.
A balanced sequential monadic design was applied for the study. Two products were evaluated in each test session per day with one product on each half face for total of thirteen (13) test sessions. Replication and randomization were applied.
Each participant followed a strict study protocol to prepare the skin (ASTM. 1997. E1490–92). Baseline assessment was conducted with clean and dry hands. Panelists were then instructed to apply a facial moisturizer (0.05 cc) on their cheek using a circular motion and covering the area between the cheekbone and jaw line (approximately a 2–3-inch diameter), at a rate of two strokes per second. After a 2-minute rest, they repeated the procedure with liquid foundation. Liquid foundation with various shades were used to enhance the contrast of the product on the evaluation site, which allowed the panelists to visually evaluate the performance of the facial cleansing wipe/makeup remover wipe for cleansing the area. Panelists then waited for 30 min for the foundation to set in prior to proceeding to the evaluations.

2.3. Data Analysis

Data was analyzed using analysis of variance with significant differences indicated using Fisher’s least significant difference (LSD) at the 95% confidence level (p < 0.05). Sensory perceptual maps were generated via factor analysis with varimax rotation to illustrate similarities and differences among all thirteen tested samples. These techniques allow results to be summarized from the seventy-one initial attributes to a smaller set of key sensory dimensions that explains most of the variability among samples.

3. Results and Discussion

Overall, the facial cleansing/makeup removal wipe category displayed a diversity of sensory experiences (Table 3 and Table 4; Tables S1–S8). No significant differences were perceived in baseline skin condition (seven attributes) and after foundation application (four attributes) showing that the substrate, skin with foundation, was the same for all wipes (Table 3 and Table 4). Of the 60 remaining attributes, 37 showed significant differences among the samples at the 95% confidence limit (Tables S1–S8). These attributes included visual and tactile wipes characteristics, cleansing performance attributes and skin perception properties at various time points in the after-feel. Thus, clear differences were noted among the sensory attributes, including perceived performance.

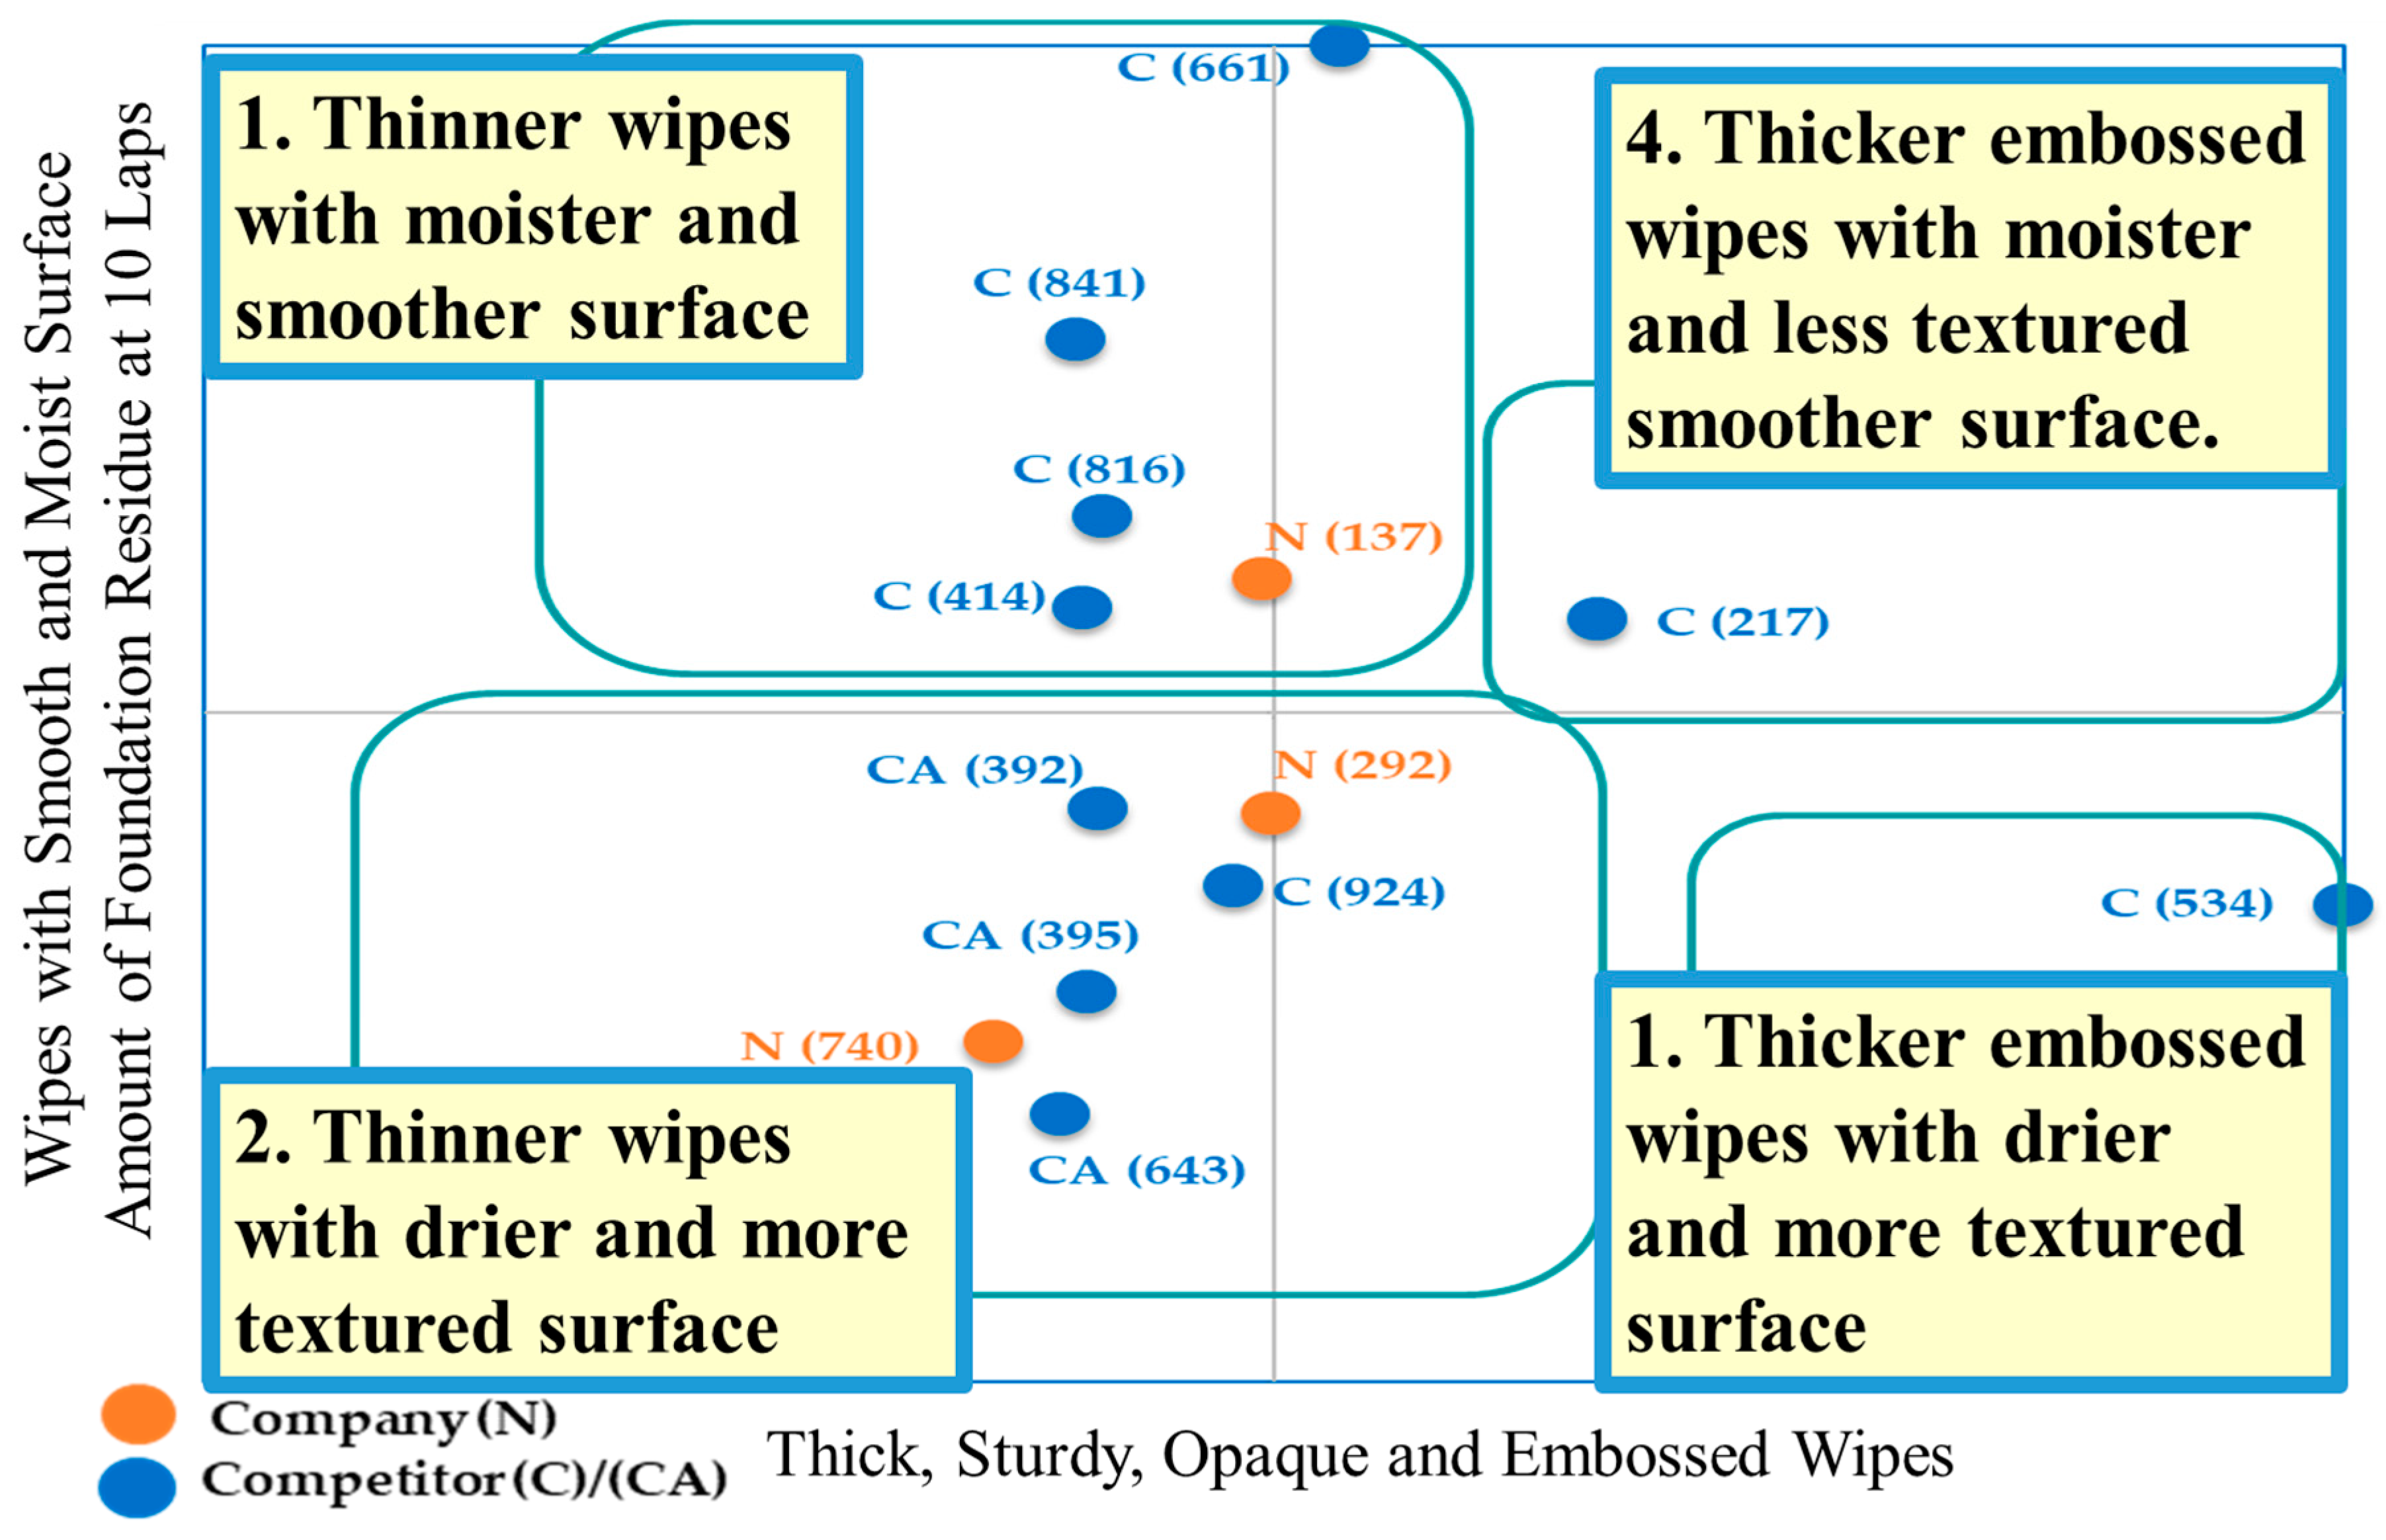
3.1. Visual and Tactile Properties

For visual and tactile properties (Figure 1), the horizontal axis from left to right captures thinner to thicker, less sturdy to sturdier, less opaque to more opaque and less embossed to more embossed wipes. The vertical axis from bottom to top is increasing moistness and smoothness of surface and higher amount of foundation residue left on the skin after 10 laps. Competitor (C) (534) and C (217) were most differentiated in the axis dimension. They were visually different from the other samples by having macro patterns and higher opacity with C (534) demonstrating more extreme ratings on these visual characteristics. From a texture standpoint, both of these samples were thicker and sturdier than all other samples. The samples differed in their grainy textured feel: C (534) was perceived to be grainier and less fuzzy than C (217). However, from a moistness perspective, C (534) and C (217) were similar in moistness compared to other products having a moderate moistness level.
In contrast, none of the other samples, including the three “Company” samples, had macro embossing. These samples were also generally thinner and more translucent. Differences still existed among these samples: Company (N) (740), N (292) and CA (note: CA samples are competitive samples from the same competitor) (392, 195, 643) were directionally drier and more textured (grainy/gritty). These samples also felt dryer overall than samples such as C (841, 661) for example. Interestingly all samples CA (392, 195, 643) grouped together in their visual and tactile properties despite their different regional market positioning. This indicates that visual and tactile cues of the wipe were built into brand recognition and were consistently acknowledged in the global market. Samples such as C (661), C (841) and N (137) were moister, along with C (414) and C (816), which also had a smoother texture.
The three N products were consistent in the visual texture with not having macro embossing. However, they differentiated from each other in the moistness level and texture feeling dimension with N (137) being moister and less dry, and N (740) being the driest among the three. This could be explained by the formula differences among the three products. No obvious reason could be associated with visual or texture differences among the samples except for formula differences.

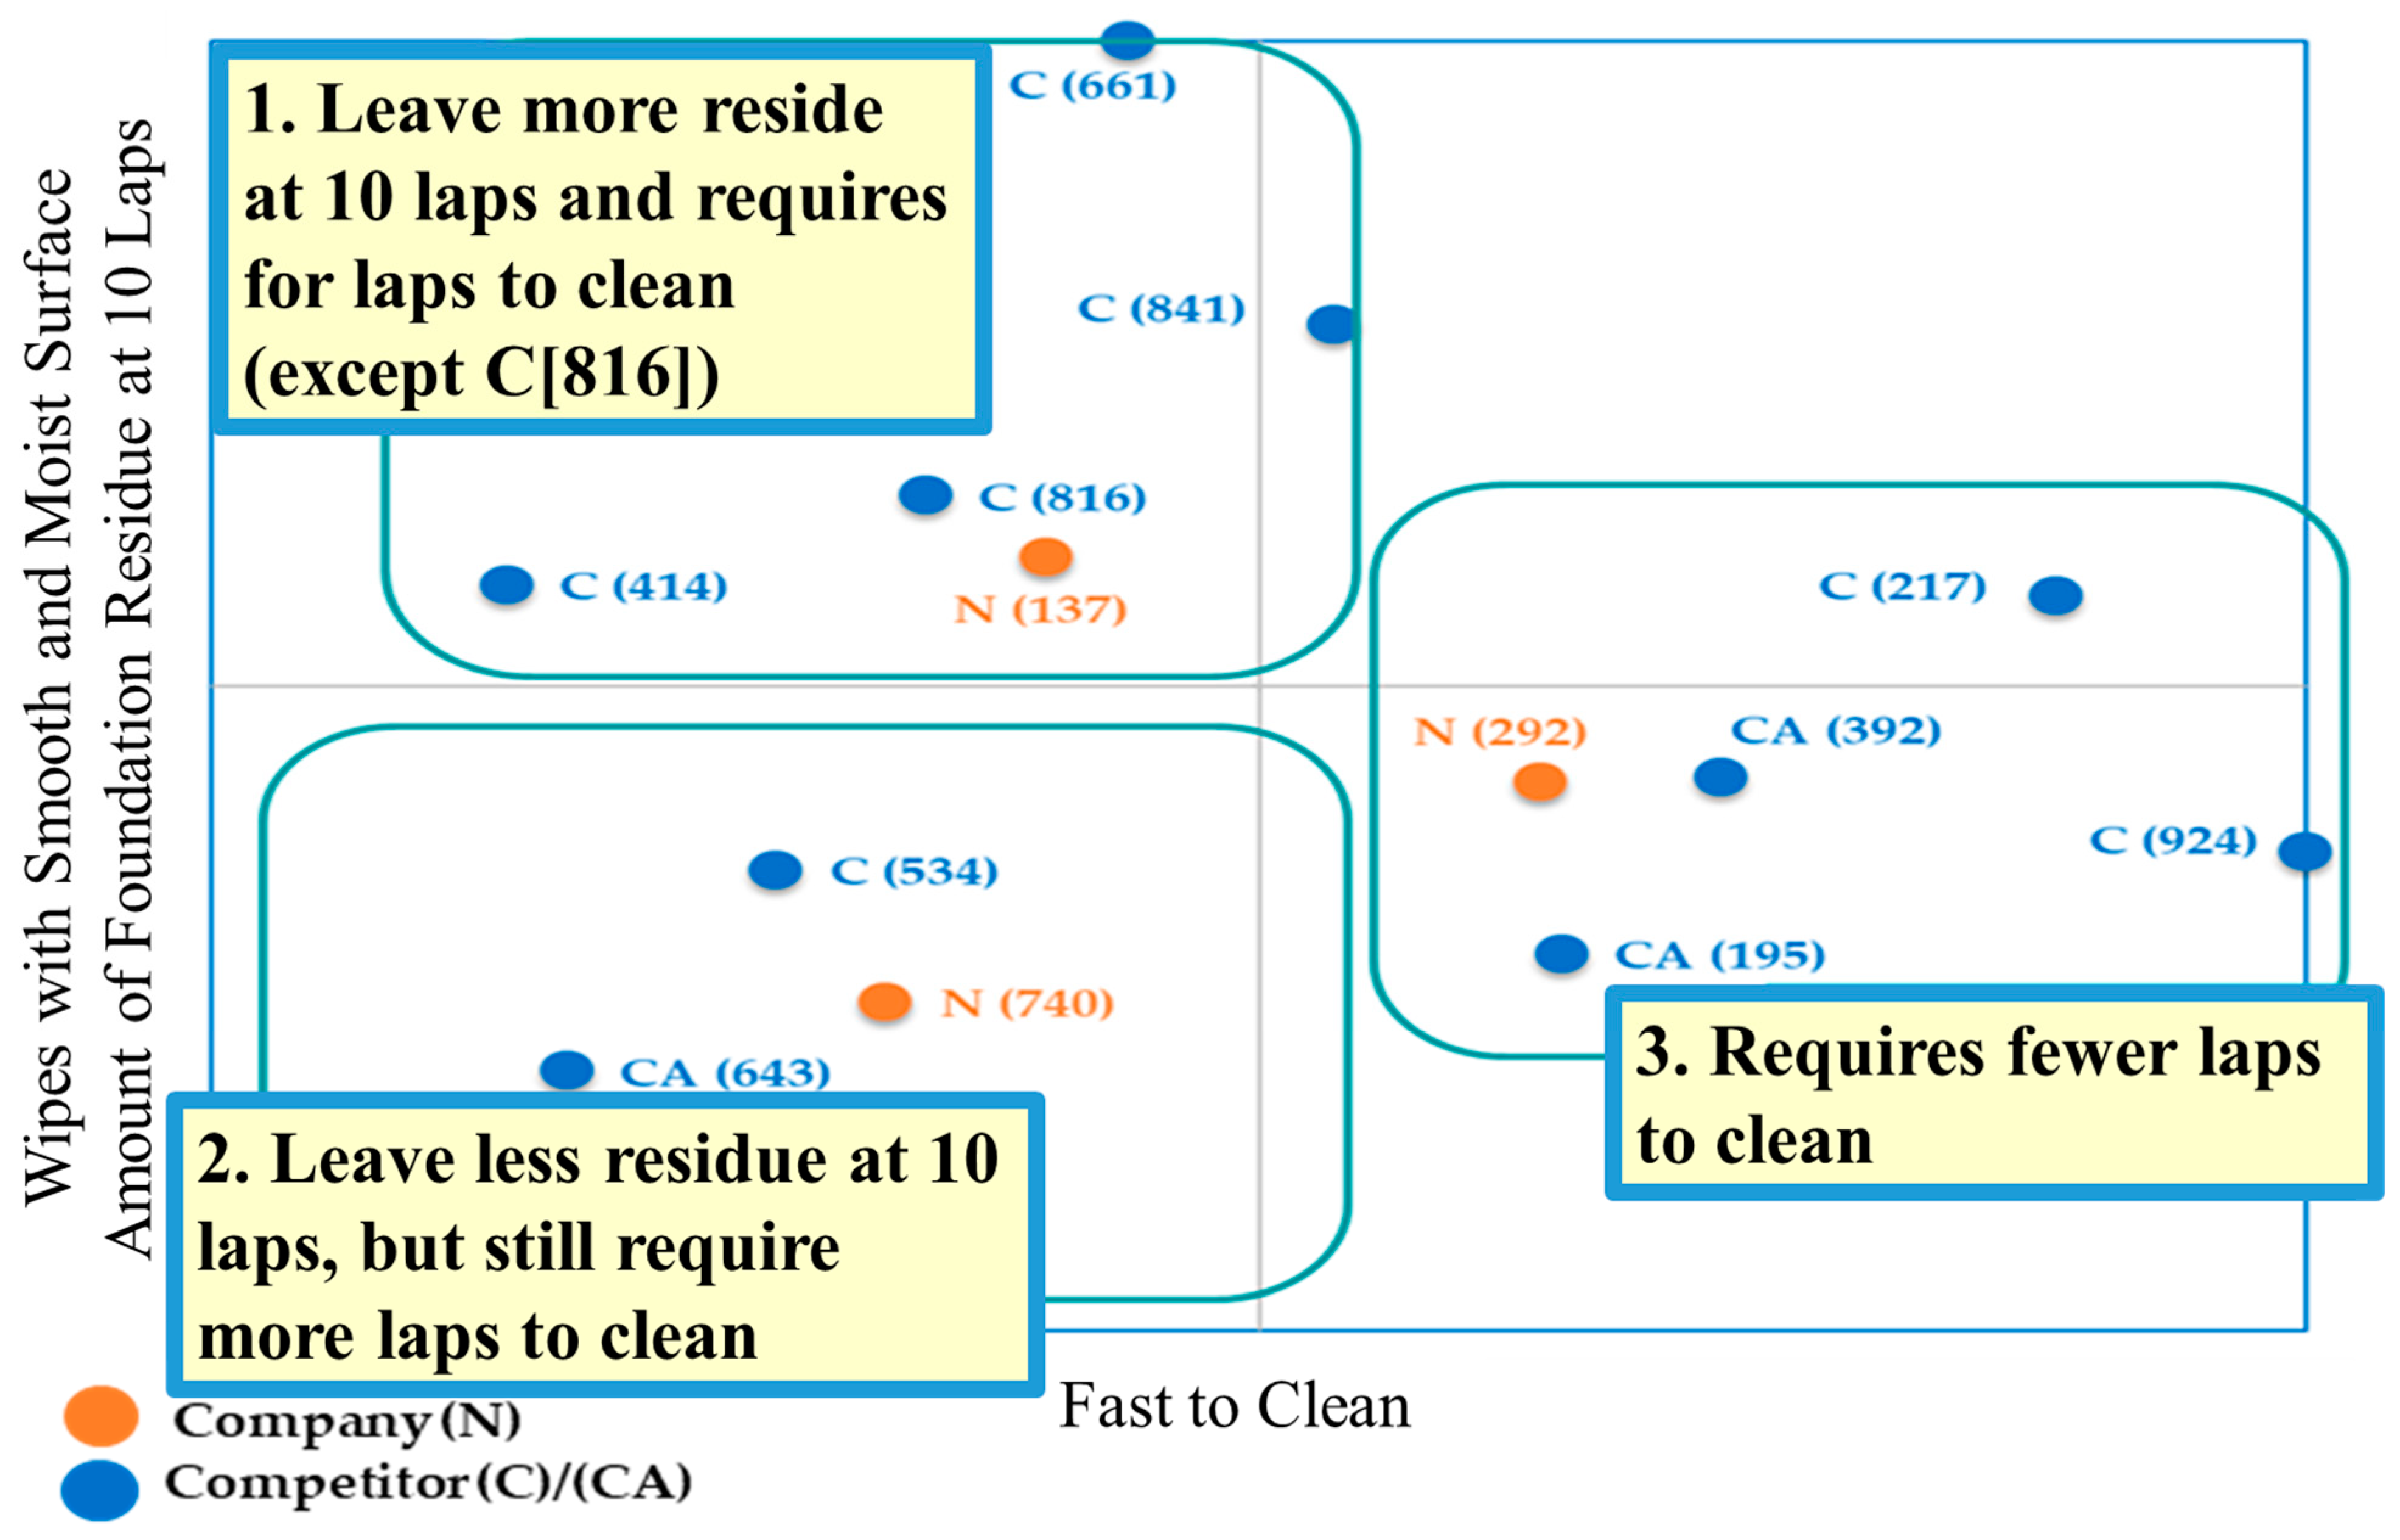
3.2. Cleaning Performance Properties

All thirteen wipe samples cleaned the skin well (Figure 2). All samples removed most of the foundation from the cheek after 10 laps (both from a visual and tactile perspective). All samples completely removed all visual residue within a total of 15 to 19 laps.
Some small differences were found in terms of “amount of tactile residue (foundation) still present at 10 laps” and “number of laps to fully remove foundation.” Samples that were typically drier and/or more textured (grainy/lumpy) such as N (740), C (534), and CA (195) left a lower amount of tactile residue on the skin after 10 laps, while moister and smoother samples such as C (661), C (841) or C (816) left more tactile residue behind. This could be explained by the drier and more textured (grainy/lumpy) wipes providing more friction to the skin during removal, which helped remove more residue and leave less on the skin.
From the cleaning speed stand point, C (924), C (217), C (392), C (195) and N (292) required fewer laps to clean and removed foundation more quickly overall than other samples such as C (413) and CA (643). Additional in-use testing might be needed to further tease apart differences among wipes with regards to cleaning performance (e.g., through the development of another module in the protocol for testing removal of waterproof mascara and eyeliner).

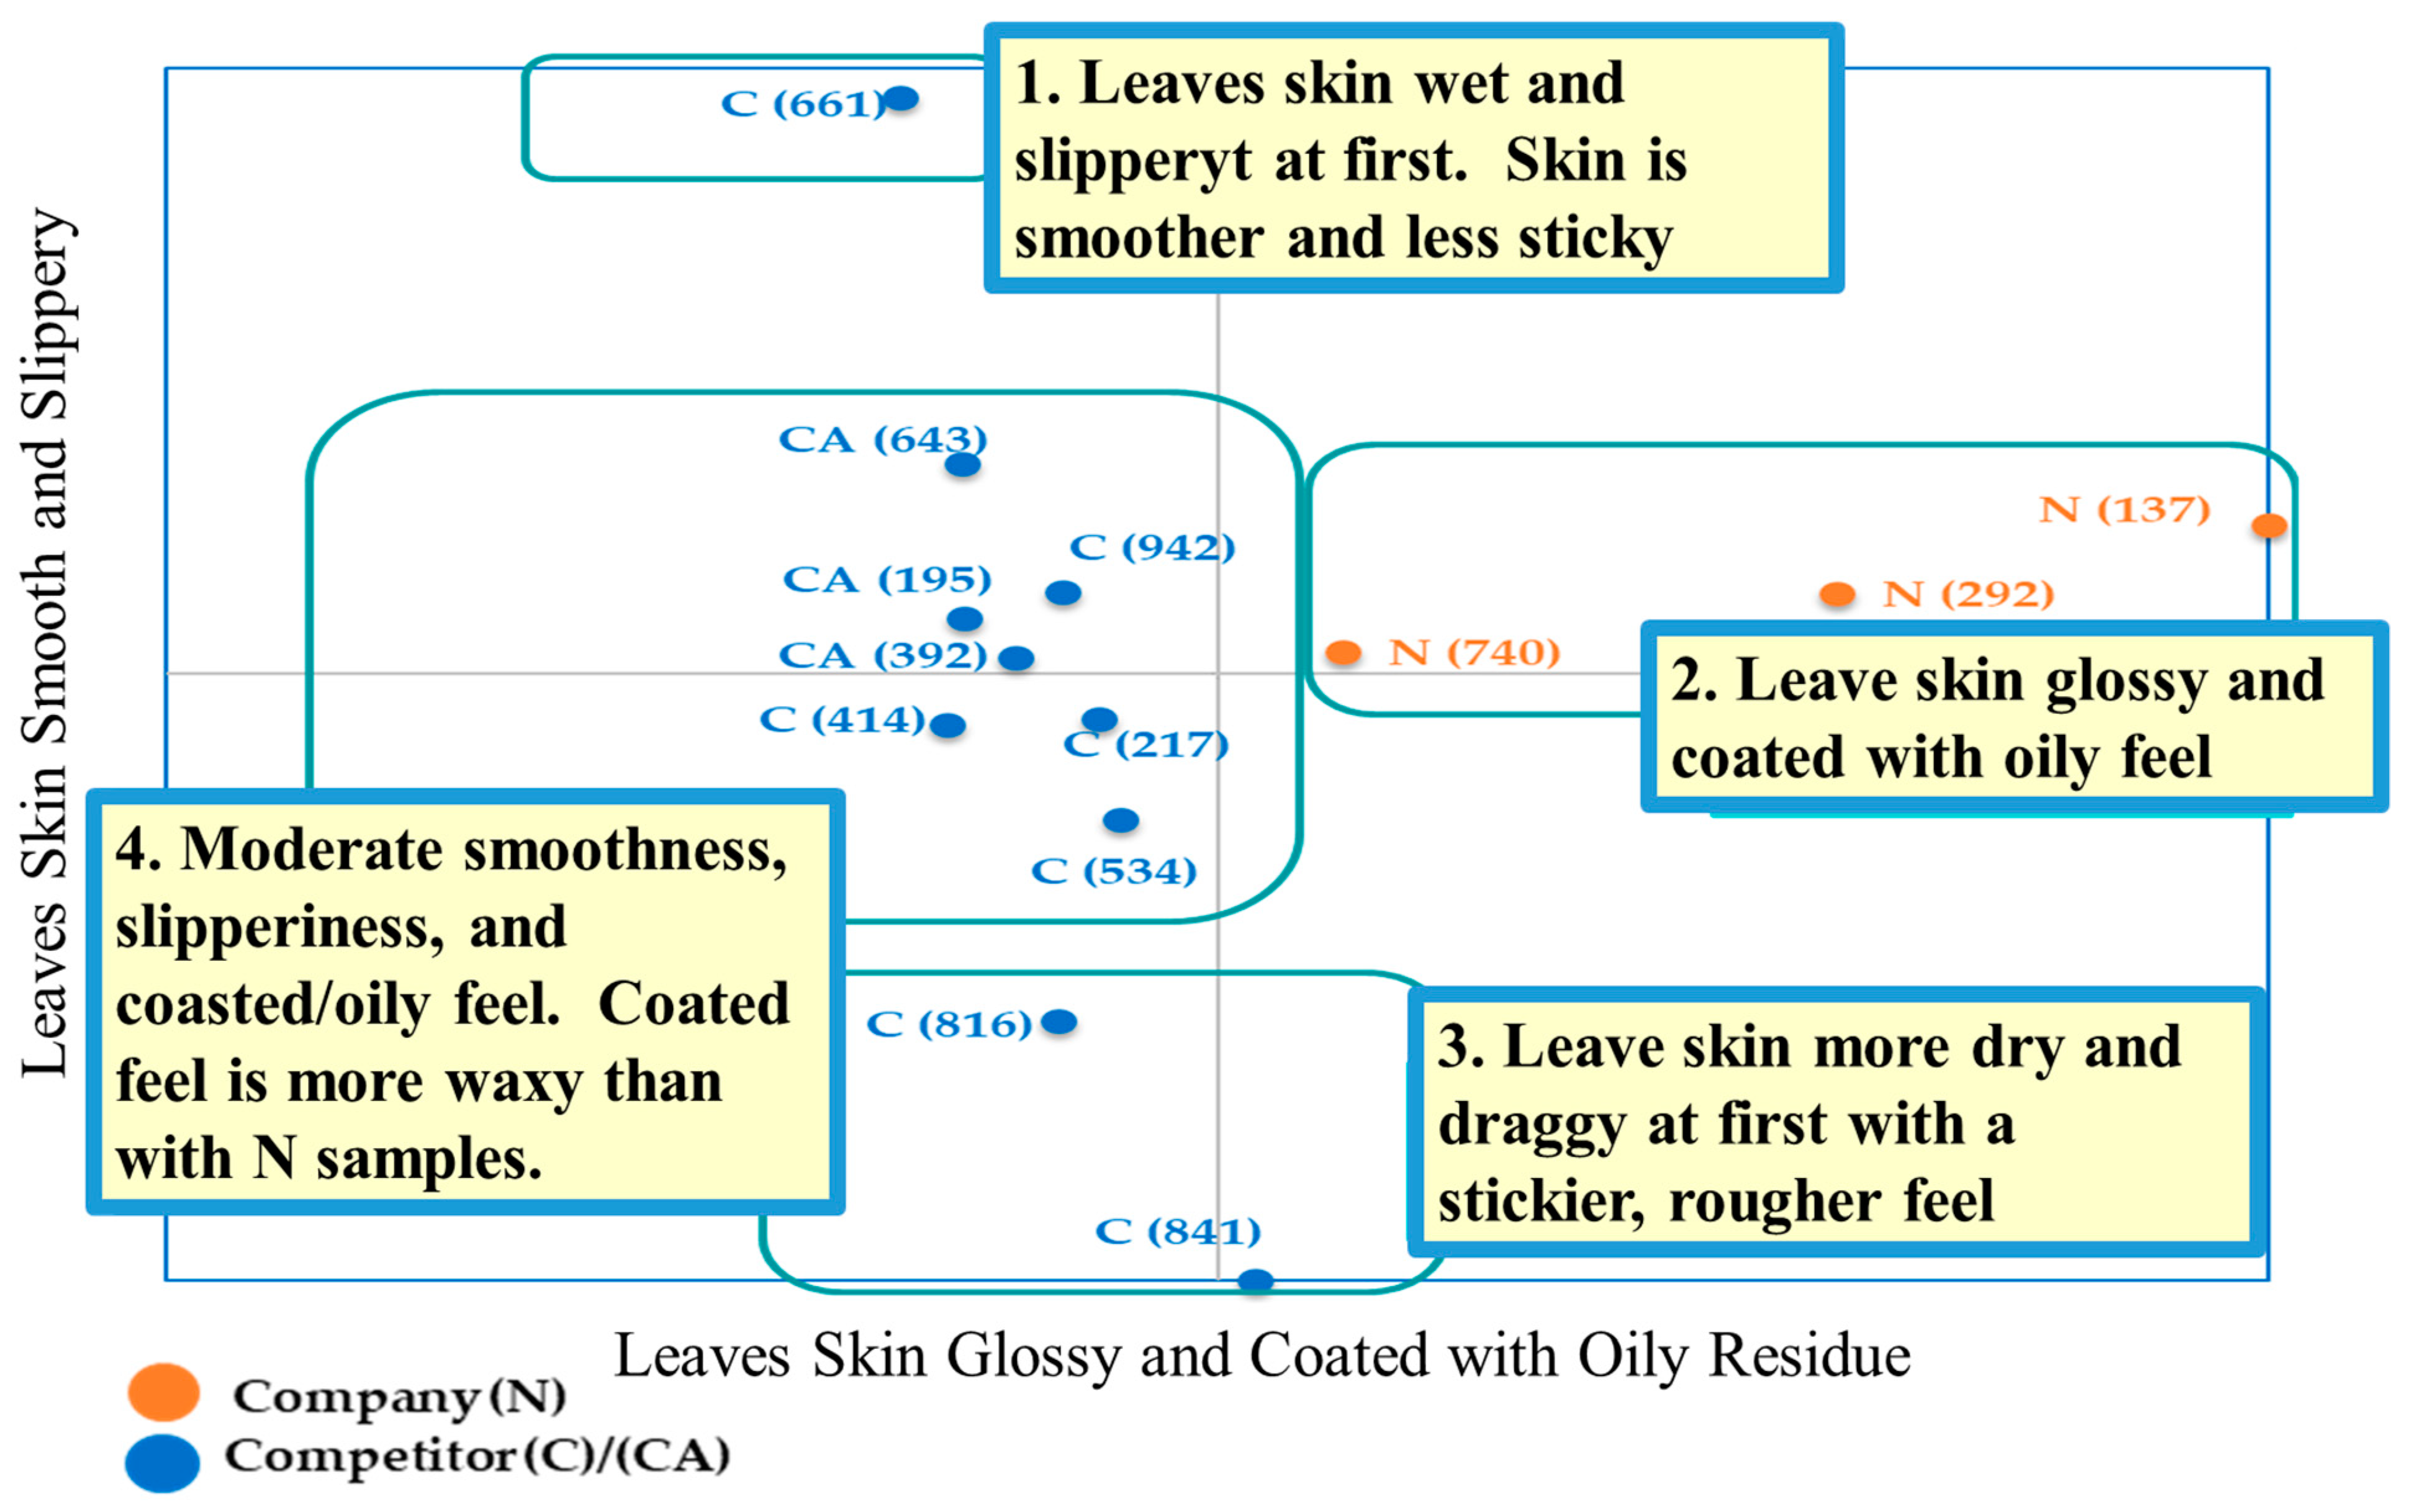
3.3. Skin Perception Properties

For skin perception properties (including both look and feel, baseline ratings were captured before applying makeup products. Then ratings on all related attributes were also captured after using the wipes to remove the makeup products. In comparison to the baseline skin look, all samples made the skin look glossier. No other visual impacts were observed. From a skin feel perspective, all wipes left the skin feeling more moist and cooler than baseline. The skin was smoother and stickier than baseline in the immediate after-feel. These perceptions decreased by the 5 min after-feel. All CA (643, 195, 392) samples left the skin feeling slightly coated with residue. This residue was mostly described as waxy, with some varying intensity of silicone and oily feel (Figure 3).
Differences among samples existed in the skin look and feel properties. N differed among themselves and from all other samples: N (137), N (292) and to a lesser extent N (740) left the skin feeling wetter, looking glossier and coated with a residue proportionally lower in wax and higher in oily feeling than all other samples. N (740) differed slightly from N (292) and N (137). While all three samples left the skin moderately smooth and slippery at first, the skin feel remained draggier longer with N (740). All three N products left the skin feeling closer to baseline in slipperiness at 5 min, similar to all CA (643, 195, 392), C (414), C (924), C (217) and C (534).
Product C (661) stood out by leaving the skin feeling wetter, cooler, smoother, less sticky and more slippery than most samples at first, with a moderate but persistent drag in the 5 min after-feel. C (841) and C (816) left the skin drier, stickier and slightly rougher and draggier than other samples at first. While C (816) returned to baseline in slipperiness at 5 min, C (841) continued to leave the skin feeling slightly draggy at 5 min. Interestingly based on the visual and tactile perceptual map, these three products C (661), C (841) and C (816) were grouped together as being more moist with a smoother texture. However, based on look and skin feel, these three products were perceived to be very different. The smooth and moist surface of the textile of C (661) left the skin feeling wetter and cooler. However, it is difficult to explain why C (861) and C (841) had more moist and smoother surface texture (Figure 1), even though they were perceived to be drier, stickier and slightly rougher on the skin. It was probably due to formula and textile differences.

3.4. Summary

The landscape overview of the sensory descriptive method applied to all thirteen facial cleansing/makeup remover wipes from the global markets provides detailed information on how each product compares to others for different sensorial characteristics. This will guide the product development team to fully understand their products as well as competitors’ products and support new product development and innovation. Consumer studies are strongly recommended to the product development team to further evaluate these products with consumers to build consumer technical models and further understand consumers’ perception on these products as well as identifying new product innovation opportunities. However, challenges exist for conducting this type of consumer study with products from different regions and testing regional products with regional consumers separately. This variance among consumer groups may impact the overall results. One option is to test all products in one country, such as USA, and also have the regional products tested with regional consumers, then the resulting data can be used to leverage the consumer differences and eventually build a technical model. Further research is worth exploring in this area, however, in a business environment, funding is limited and this research has not been conducted by Johnson and Johnson yet.
Fragrance was not included in the attributes for the product evaluation in this research. Because fragrance may play a role influencing consumers’ perception and preference, future consumer research on these wipes should consider including fragrance questions in the questionnaire design. For cleansing performance evaluation, it is worth considering the addition of mascara and eyeliner removal as potential added enhancements to the current protocol to gain more learning in this area.

4. Conclusions

The landscape overview of the facial cleansing/makeup remover products from the global market provides a big picture of how the products differentiate themselves from each other. It helps the product development team to understand the sensory space better to guide product innovation to compete in the global market. It is important to include the cleaning performance attributes to the lexicon development for the facial cleansing/makeup remover wipe descriptive analysis method development. This uniqueness also differentiates wipe evaluation from fabric or cloth evaluation or lotion/liquid cleanser product categories.

Supplementary Materials

Additional Tables (S1-S8) are available online at https://www.mdpi.com/2079-9284/6/3/44/s1.

Author Contributions

Conceptualization, H.X. and C.V.; methodology, H.X. and A.R.K.; validation, H.X. and A.R.K.; formal analysis, A.R.K.; investigation, H.X. and A.R.K.; resources, H.X., C.V. and E.C.IV; data curation, H.X.; writing—original draft preparation, H.X.; writing—review and editing, H.X., E.C.IV, A.R.K. and C.V.; visualization, H.X.; supervision, H.X., A.R.K., C.V. and E.C.IV; project administration, H.X., C.V. and E.C.IV; funding acquisition, H.X., C.V. and E.C.IV.

Funding

This research received no external funding.

Conflicts of Interest

The authors work at a company that manufactures wipes (H.X. and C.V) and consult on sensory testing (A.R) with multiple manufacturers, but otherwise declare no conflict of interest.

References

  1. Russell, S.J. Handbook of Nonwovens; Woodhead Publishing Limited: Cambridge, UK, 2007. [Google Scholar]
  2. Kaplan, S.; Pulan, S.; Ulusoy, S. Objective and subjective performance evaluations of wet wipes including herbal components. J. Ind. Text. 2017, 0, 1–20. [Google Scholar] [CrossRef]
  3. Meilgaard, M.; Civille, G.V.; Carr, B.T. Sensory Evaluation Techniques, 4th ed.; CRC Pres: Boca Raton, FL, USA, 2007; pp. 161–172. [Google Scholar]
  4. Campo, E.; Ballester, J.; Langlois, J.; Dacremont, C.; Valentin, D. Comparison of conventional descriptive analysis and a citation frequency-based descriptive method for odor profiling: An application to Burgundy Pinot noir wines. Food Qual. Prefer. 2010, 21, 44–55. [Google Scholar] [CrossRef]
  5. Cairncross, S.E.; Sjostrom, L.B. Flavor profiles—A new approach to flavor problems. Food Technol. 1950, 4, 308–311. [Google Scholar]
  6. Szczesniak, A.S. Objective measurements of food texture. J. Food Sci. 1963, 28, 410–420. [Google Scholar] [CrossRef]
  7. Stone, H.; Sidel, J.; Oliver, S.; Woolsey, A.; Singleto, R.C. Sensory evaluation by quantitative descriptive analysis. Food Technol. 1974, 28, 24–34. [Google Scholar]
  8. Williams, A.A.; Langron, S.P. The use of free-choice profiling for the evaluation of commercial ports. J. Sci. Food Agric. 1984, 35, 558–568. [Google Scholar] [CrossRef]
  9. Meilgaard, M.; Civille, G.V.; Carr, B.T. Sensory Evaluation Techniques, 1st ed.; CRC Press: Boca Raton, FL, USA, 1987. [Google Scholar]
  10. Delarue, J.; Sieffermann, J.M. Sensory mapping using Flash Profile. Comparison with a conventional descriptive method for the evaluation of the flavor of fruit dairy products. Food Qual. Prefer. 2004, 15, 383–392. [Google Scholar] [CrossRef]
  11. Risvik, E.; McEwan, J.A.; Rødbotten, M. Evaluation of sensory profiling and projective mapping data. Food Qual. Prefer. 1997, 8, 63–71. [Google Scholar] [CrossRef]
  12. Cadoret, M.; Lê, S. The sorted napping: A new holistic approach in sensory evaluation. J. Sens. Stud. 2010, 25, 637–658. [Google Scholar]
  13. Worch, T.; Crine, A.; Lê, S. Analysis and validation of the ideal profile method: Application to a skin cream study. Food Qual. Prefer. 2014, 32, 132–144. [Google Scholar] [CrossRef]
  14. Brard, M.; Lê, S. The ideal pair method, an alternative to the ideal profile method based on pairwise comparisons: Application to a panel of children. J. Sens. Stud. 2016, 31, 306–313. [Google Scholar] [CrossRef]
  15. Talavera-Bianchi, M.; Chambers, E., IV; Chambers, D. Describing flavor using fewer and simpler ‘HITS’ (high identity traits) profiling: An example with cheese. J. Sens. Stud. 2010, 25, 481–493. [Google Scholar] [CrossRef]
  16. Civille, G.V.; Dus, C.A. Development of terminology to describe the handfeel properties of paper and fabrics. J. Sens. Stud. 1990, 5, 19–32. [Google Scholar] [CrossRef]
  17. Bacci, L.; Camilli, F.; Drago, S.; Magli, L.; Vagnoni, E.; Mauro, A.; Predieri, S. Sensory evaluation and instrumental measurements to determine tactile properties of wool fabrics. Text. Res. J. 2012, 82, 1430–1441. [Google Scholar] [CrossRef]
  18. Sular, V.; Okur, A.E. Sensory evaluation methods for tactile properties of fabrics. J. Sens. Stud. 2007, 22, 1–16. [Google Scholar] [CrossRef]
  19. Robinson, K.J.; Chambers, E., IV; Gatewood, B.M. Influence of pattern design, color, and fabric type on the hand characteristics of pigmented prints. Text. Res. J. 1997, 67, 837–845. [Google Scholar] [CrossRef]
  20. Yenket, R.; Chambers, E., IV; Gatewood, B.M. Color has little effect on perception of fabric handfeel tactile properties in cotton fabrics. J. Sens. Stud. 2007, 22, 336–352. [Google Scholar] [CrossRef]
  21. Lee, I.; Yang, H.; Kim, J.; Maeng, Y.; Lee, C.; Kang, Y.; Rang, M. Terminology development and panel training for sensory evaluation of skin care products including aqua cream. J. Sens. Stud. 2005, 20, 421–433. [Google Scholar] [CrossRef]
  22. Meilgaard, M.; Civille, G.V.; Carr, B.T. Sensory Evaluation Techniques, 2nd ed.; CRC Press: Boca Raton, FL, USA, 1991. [Google Scholar]
  23. ASTM. E1490-92 Standard Practice for Descriptive Skinfeel Analysis of Creams and Lotions; ASTM: Barr Harbor, West Conshhocken, PA, USA, 1997. [Google Scholar]
Figure 1. Perceptual map for visual and tactile properties.
Cosmetics 06 00044 g001
Figure 2. Perceptual map for cleansing performance properties.
Cosmetics 06 00044 g002
Figure 3. Perceptual map for skin perception properties.
Cosmetics 06 00044 g003
Table 1. Full attributes list for the customized descriptive analysis method for facial cleansing/makeup remover wipes evaluation.
Baseline Skin-FeelIn-Use EvaluationAfter-FeelProduct in Hand
After Liquid Foundation ApplicationAfter 10 LapsAfter Complete RemovalImmediate5 Min
GlossOcclusionOcclusion# Added Laps to CleanGlossGlossAmount of Product
Amount of CoverageAmount of CoverageEvenness of CoverageCoolnessCoolnessPaper (Fabric) Moistness
Evenness of CoverageCoverage Evenness Residue Amount Facial LinesFacial LinesHand Moistness
Amount of ResidueAmount of Residue Visual ResidueVisual ResidueGritty
Tautness TautnessTautnessGrainy
Occlusion OcclusionOcclusionLumpy
Stickiness StickinessStickinessFuzzy
Moistness MoistnessMoistnessSlipperiness
Slipperiness SlipperinessSlipperinessThickness of Wipe
Roughness RoughnessRoughnessForce to Gather
Amount of ResidueAmount of ResidueStiffness
Soapy Film %Soapy Film %Fullness of Body
Oil %Oil %Depth of Embossing (Macro)
Wax %Wax %Depth of Embossing (Micro)
Grease %Grease %Degree of Embossing
Silliconey %Silliconey %Translucency
Powder %Powder %Blotchy
Particulates (yes = 1, no = 0)Particulates (yes = 1, no = 0)
Table 2. Facial cleansing/makeup removal wipes from the global market.
Company (N) vs. Competitor (C)Region
N (292)N.A.
N (137)N.A.
C (924)N.A.
C (414)N.A.
C (534)N.A.
C (841)N.A.
C (816)N.A.
CA (195) *EMEA
CA (392) *EMEA
C (661)APAC
C (217)APAC
N (740)LATAM
CA (643) *LATAM
* These three products were from the same competitor’s brand. Note: North America (N.A.), Europe, Middle East and Africa (EMEA), Asia Pacific (APAC), Latin America (LATAM).
Table 3. Sensory characteristics of skin: baseline results.
CodeGloss—BaselineTautness—BaselineOcclusion—BaselineStickiness—BaselineMoistness—BaselineSlipperiness—BaselineRoughness—Baseline
13711.115.00.00.05.080.020.0
19511.115.00.00.05.080.020.0
21711.115.00.00.05.080.020.0
29211.115.00.00.05.080.020.0
39210.915.00.00.05.080.020.0
41411.115.00.00.05.080.020.0
53411.115.00.00.05.080.020.0
64311.915.00.00.05.080.020.0
66111.615.00.00.05.080.020.0
74011.115.00.00.05.080.020.0
81611.115.00.00.05.080.020.0
84111.115.00.00.05.080.020.0
92411.115.00.00.05.080.020.0
Scores are based on a 0–100 scale from none to very strong/very high.
Table 4. Sensory characteristics: wipe in-use results.
CodeAfter Application of FoundationAfter 10 LapsAfter Complete Removal
OcclusionAmt of CoverageEven of Coverage—FoundationAmt of Residue—FoundationOcclusion—10 LapsAmt of Coverage—10 LapsEvenness of Coverage—10 LapsAmt of Residue—10 Laps# of Added Laps To CleanEven of Coverage—After WipingAmt of Residue—After Wiping
13711.692.491.4 ab78.86.27.25.5 bc19.4 AB8.1 AB0.00.0
19513.392.092.0 a80.44.67.15.4 bc15.1 ABCDE6.8 ABCD0.00.0
21712.791.791.3 ab80.44.85.86.7 bc14.7 BCDE5.4 CD0.00.0
29213.192.291.3 ab77.64.86.95.6 bc17.0 ABC6.6 ABCD0.00.0
39218.991.891.3 ab79.35.96.15.9 bc16.0 ABCD6.4 BCD0.00.0
41417.191.992.0 a80.24.18.46.1 bc14.9 ABCDE8.3 A0.00.0
53412.491.691.7 ab76.34.37.34.8 c10.8 E7.9 AB0.10.3
64313.991.490.8 b79.46.69.29.7 a14.7 BCDE7.6 AB0.10.1
66112.791.591.4 ab79.94.68.66.8 bc19.4 AB7.3 AB0.10.4
74012.490.789.7 c78.26.26.25.9 bc13.2 CDE8.1 AB0.00.0
81611.991.490.7 bc75.95.26.27.2 b12.0 DE7.7 AB0.00.0
84113.091.891.4 ab80.06.17.95.4 bc19.7 A7.2 ABC0.00.0
92412.991.790.8 b81.05.07.36.9 bc13.4 CDE5.0 D0.00.0
p-value0.32500.34620.05970.64020.28600.14600.08440.00230.00380.57450.5719
LSD 1.08 2.144.911.81
Sig * *****
Means that share a common letter within an attribute were not statistically different at the 95% confidence level; * = significantly different at 90% confidence level; ** = significantly different at 95% confidence level; LSD—least significant difference at 95% if p value < 0.05.

