Abstract
Eye shadows are cosmetic products widely used to enhance appearance. However, the use of raw materials contaminated with heavy metals poses potential health hazards. This study characterized 12 commercial eye shadow samples and quantified concentrations of Al, Ba, B, Cu, Cr, Fe, Mn, Ni, Pb, V, and Zn using inductively coupled plasma mass spectrometry (ICP-MS). Additional characterization using UV-vis, ATR-FTIR, and SEM-EDS techniques provided insights into the composition and potential sources of contamination. Multivariate analysis revealed differences in metal concentrations across brands. Health risk assessments, including margin of safety (MoS), hazard quotient (HQ), hazard index (HI), lifetime cancer risk (LCR), and lifetime cancer risk based on the long-term relevant daily systemic exposure dose (LCR′), indicated that one product may pose significant health risks. Specifically, sample M4 showed an HI of 2.67 × 101, exceeding acceptable limits. These findings highlight the need for stricter regulation and continuous monitoring of heavy metals in cosmetics to safeguard consumer health.
1. Introduction
Currently, the consumption of cosmetics has increased exponentially [1] as millions of people in the world use cosmetics for aesthetic purposes [2]. The problem is that cosmetics are composed of organic and inorganic substances of hydrophilic and hydrophobic nature, and some of these substances may contain traces of heavy metals [3]. This is a constant risk for consumers because these cosmetics are repeatedly applied directly to the skin, mucous membranes, hair, and nails [4], and can bioaccumulate in the human body [5], which represents a constant concern [6] for the health of consumers [7].
Some heavy metals are carcinogenic, allergenic, neurotoxic, teratogenic, and mutagenic, and these contaminants are linked to hair loss and other problems associated with cosmetics [2]. By determining the concentrations of heavy metals, it is possible to estimate carcinogenic and non-carcinogenic effects [8]. The toxicity of heavy metals in cosmetics depends on the dosage, route of exposure, exposure time, concentration level, age, sex, genetics, and nutritional status of the exposed individuals [9]. For this reason, international organizations such as the U.S. Food and Drug Administration (FDA) and the World Health Organization (WHO) have established maximum permissible limits (MPLs) for metals in some products [10], with antimony, arsenic, cadmium, chromium, cobalt, mercury, nickel, and lead being the metals that would be prohibited as intentional ingredients [11]. However, in developing countries, the regulation of metals in cosmetics is very limited, with little information on the MPLs of these heavy metals [12].
Aluminum (Al) can enter the body by inhalation of aerosols or particles, ingestion, and skin contact. Al is also associated with the development of lung disease, heart disease, gastrointestinal disease, anemia, Alzheimer’s disease, dementia, sclerosis, autism, reproductive problems, hepatorenal disease, cancer, and diabetes mellitus, among others [13,14]. Barium (Ba) can accumulate in the skeleton after absorption through oral exposure or inhalation [15], producing irritation of the skin, eyes, and mucous membranes [16], and at high dosages, it could cause negative effects such as weakness, hypertension, hypotension, ventricular tachycardia, and muscle paralysis [17]. Boron (B) is associated with dermal and pulmonary irritation. It can also cause genotoxicity in the male reproductive system and teratogenicity [18]; therefore, it is classified as toxic for reproduction in category 1B [19]. And in rabbits, this metal has been shown to produce conjunctivitis and can be absorbed through damaged skin [20]. Copper (Cu) is a metal that plays an important role in maintaining physiological homeostasis [21]; however, acute or chronic exposure to Cu can occur through water and other routes [22,23] and can cause harmful effects as clinical manifestations in the gastrointestinal tract, liver, kidneys, eyes, respiratory system, cardiovascular system, nervous system, and endocrine system [24]. Chromium (Cr) occurs in numerous oxidation states, with Cr (0) and Cr (III) being vital trace elements [25,26], while Cr (VI) is harmful to living organisms [27], being associated with skin allergies, dermatitis, dermal necrosis, dermal corrosion, respiratory sensitization, lung cancer, liver and kidney damage, irritation and ulceration, internal bleeding, gastrointestinal effects, nausea, vomiting, and neurodegenerative diseases, as well as bone, prostate, lymphoma, Hodgkins, leukemia, stomach, genital, kidney and bladder cancers [28].
Iron (Fe), despite being prescribed medically, is more dangerous than most drugs [29] because excessive iron deposition may be associated with the production of free radicals and, in the brain, may be related to neurodegenerative diseases such as Alzheimer’s and Parkinson’s disease [30,31]. Similarly, manganese (Mn), despite being an essential metal for human health, is also considered toxic because it is associated with negative consequences on the central nervous system [32]. The route of exposure to manganese can be by nutritional intake [33] or by inhalation in occupational environments, triggering inflammatory responses, oxidative stress, and dysregulation of transporters [34].
Nickel (Ni) can cause various side effects on human health, such as allergies, cardiovascular and renal diseases, pulmonary fibrosis, and lung and nasal cancer [35,36]. Also, it is related to dermatitis and reproductive effects [37,38]. Lead (Pb) can enter the body by ingestion or inhalation [39], and when the body is exposed to this metal no function in the human body is not affected [40] and acute or chronic intoxication can be triggered, triggering negative effects such as loss of appetite, headache, hypertension, abdominal pain, renal dysfunction, fatigue, insomnia, arthritis, hallucinations, vertigo [41], pulmonary dysfunction, hematological changes (anemia), gastrointestinal colic, liver damage, and reduced lung function [42]. Another hazardous toxic metal is vanadium (V), whose environmental or occupational exposure [43] is associated with oxidative stress, DNA damage, neurotoxicity, testicular toxicity, kidney damage [44], and neurodegenerative diseases [45]. Finally, zinc (Zn), despite being an essential element for human life [46], can produce fever, respiratory distress, nausea, chest pain, and cough [47] at high exposures; it is also associated with anemia, neutropenia, and zinc-induced copper deficiency and can enter the body by oral consumption, inhalation, or topical application [48]; however, few cases of Zn intoxication have been reported [49].
Therefore, this study hypothesizes that certain commercial eye shadows may contain concentrations of heavy metals that pose potential non-carcinogenic and carcinogenic health risks to consumers. Based on this, the main objective of this research was to characterize the composition and assess the health risks associated with the presence of heavy metals in twelve different brands of commercial eye shadows. For this purpose, (1) the composition of eye shadows was characterized by UV-vis spectrophotometry, infrared spectroscopy, Scanning Electron Microscopy, and energy dispersive spectroscopy; (2) the concentrations of heavy metals in the eye shadow samples were quantified; and finally, (3) the risk to human health by the presence of potentially toxic heavy metals in the eye shadow samples was evaluated by calculating the non-carcinogenic and carcinogenic risks. This study offers new perspectives by integrating different cosmetic material characterization techniques with quantitative health risk assessment, contributing to the limited scientific information on exposure to toxic metals through the use of eye cosmetics in Peru.
2. Materials and Methods
2.1. Reagents and Equipment
Absolute ethanol, 30% hydrogen peroxide, and suprapure nitric acid obtained from Merck (Darmstadt, Germany) were used to perform the main analyses of the eye shadows. Ultrapure water was obtained from the Type 1 water purifier, Simplicity UV, Merck. Spectrophotometric analysis for eye shadow color analysis was performed using the Genesys 150 Spectrophotometer, Thermo Scientific (Waltham, MA, USA). Characterizations were performed by Attenuated Total Reflectance Fourier Transform Infrared Spectroscopy on the ATR-FTIR Cary 360, Agilent (Santa Clara, CA, USA). Likewise, for microscopic characterization and elemental analysis, a Scios 2 DualBeam Scanning Electron Microscope with Energy-Dispersive Spectroscopy detector, Thermo Scientific, was used. Digests of the eye shadows were performed in the MARS6 Digester (CEM Corporation, Matthews, NC, USA).
2.2. Eye Shadows
Twelve eye shadows of different brands were purchased from different shopping centers in the city of Arequipa, Peru, where cosmetics are frequently sold. Tables S1–S3 show the places of purchase and geographic location of each purchase center, as well as photos of the eye shadows. The eye shadows were coded as M1, M2, M3, M4, M5, M6, M7, M8, M9, M10, M11, and M12. Characterization analyses were performed on the red eye shadows in each sample. The eye shadow samples purchased are the most widely sold brands in these cosmetic stores. Sampling was non-probabilistic and by convenience.
2.3. UV-Vis Spectrophotometric Analysis of Eye Shadows
The eye shadows were analyzed by UV-vis spectrophotometry, and the process is schematized in Figure S1. The procedure consisted of weighing 0.01 g of eye shadow powder in a 10 mL volumetric flask, where it was dissolved with absolute ethanol under ultrasound for 5 min and then topped off to complete the volume of the volumetric flask. The solutions were then centrifuged in 15 mL conical centrifuge tubes at 4000 rpm for 10 min to separate the insoluble substances. The supernatant was then transferred to a quartz cuvette for further analysis by UV-vis spectrophotometry by making spectrophotometric sweeps in the range of 350 to 750 nm. This analysis was performed to find similarities and differences in the dyes used in each red eye shadow.
2.4. ATR-FTIR Analysis of Eye Shadows
The FTIR analysis is schematized in Figure S2. The procedure consisted of taking an appropriate amount of eye shadow powder from each sample to the Cary 360 ATR-FTIR. ATR-FTIR analysis was performed to identify the functional groups present in the structures in the eye shadows in order to find similarities and differences between the samples. The baseline correction was applied automatically using Agilent MicroLab 5.8 software, with a spectral resolution of 4 cm−1. Each sample spectrum was obtained by averaging 32 scans in the range of 4000–650 cm−1.
2.5. Morphological and Elemental Analysis of Eye Shadow by SEM-EDS
Morphological characterization was performed by Scanning Electron Microscopy (SEM) and elemental analysis by Energy-Dispersive Spectroscopy (EDS). The SEM-EDS analysis procedure is presented in Figure S3. The procedure consisted of placing an adequate amount of eye shadow on a SEM Carbon Conductive Tape stuck on a Pin Stub-type SEM sample holder, and then the 12 samples were taken to the multiple sample holder of a scanning electron microscope to obtain the microphotographs and elemental composition.
2.6. Heavy Metal Determination in Eye Shadows
Quantification of heavy metals in cosmetics was performed by inductively coupled plasma mass spectrometry (ICP-MS). The procedure is schematized in Figure 1, which consisted of weighing 150 mg of eye shadow powder into TFM or PTFE (polytetrafluoroethylene) digestion vessels, where 100 μL of 30% H2O2 and 2 mL of suprapure HNO3 were added. Then, the digestion vessels were taken to the MARSXpress vessel of the MARS 6 microwave digester, where the samples were digested at 200 °C for 20 min. The digested samples were placed in 50 mL volumetric flasks, where they were made up to the mark with ultrapure water [50]. Finally, the solutions were taken to the accredited water analysis laboratory (CERPER, CERTIFICACIONES DEL PERÚ S.A.; −16.3916788, −71.5137242) in Arequipa, Peru, for analysis of the concentrations of heavy metals by ICP-MS using the Agilent 7900 ICP-MS. The concentrations obtained were used for multivariate analysis and calculation of the health risks. All analyses were performed in triplicate. The quality of the digestion results was guaranteed by using “blanks” (solutions where eye shadows were not digested) to rule out contamination of the samples. The analysis of the digested solutions of the cosmetics that were analyzed by the CERPER-accredited laboratory was contrasted using certified reference materials obtained from Qmx Laboratories.
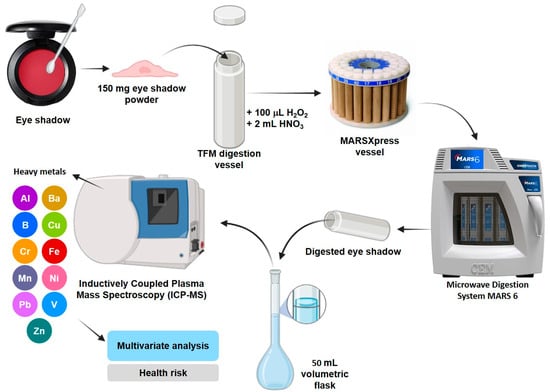
Figure 1.
Heavy metal analysis process in eye shadow.
2.7. Univariate, Bivariate, and Multivariate Analyses
Heavy metal concentrations were expressed as mean ± standard deviation. With these results, univariate analysis was performed using a one-way analysis of variance (ANOVA), and then multiple comparisons were performed using Tukey’s post hoc test. The significance level was 95%, and a value of p < 0.05 indicates a significant difference. Also, a bivariate analysis was performed, which corresponds to the Pearson Correlation Coefficient (PCC) that evaluated the linear relationship between pairs of heavy metals in eye shadows with the purpose of grouping according to the similarity of the concentrations of heavy metals. Two multivariate analyses were also performed, with the first corresponding to principal component analysis (PCA) to reduce the dimensionality of the heavy metal concentration and find patterns of variation among the eye shadows; likewise, a hierarchical cluster analysis (HCA) was performed.
2.8. Health Risk Assessment
2.8.1. Margin of Safety (MoS)
For the health risk assessment of the presence of heavy metals in eye shadows, the margin of safety (MoS) was calculated using Equation (1). A MoS level equal to or greater than 100 is considered safe and acceptable according to the guidelines established by the World Health Organization (WHO) [51]. Equation (1) is as follows:
where NOAEL corresponds to the exposure level where no adverse effect is observed and was calculated using Equation (2) [51]. Equation (2) is as follows:
where UF corresponds to the uncertainty factor, which is 1, and MF corresponds to the modifying factor, which was 100 [51]. RfD corresponds to the reference dermal dose in mg/kg/day of the different heavy metals [51]. The RfD values used in the present study are as follows” (Cr = 0.015; Pb = 0.42) [3], (Al = 1; Cr = 0.04; Mn = 0.00184; Ni = 0.0054) [51], (Ba = 14) [52], (B = 0.2; V = 0.007) [53], and (Fe = 70; Zn = 30) [54].
SED corresponds to the systemic exposure dose that was calculated using Equation (3):
where Cs corresponds to the metal concentration in mg/kg. AA is the amount of eye shadow applied (0.02 g/cm2). SSA is the skin surface on which the eye shadow is applied (24 cm2). F is the frequency of eye shadow application (2 products/day). RF is the retention factor (RF = 1). BF is the bioaccessibility factor of 50% [3,50,51,54,55] and 10%. Bioaccessibility corresponds to the fraction of metal that is released from a matrix, such as eye shadow, and becomes available for absorption by the skin [56]. BW is the body weight (70 kg) [54]. Finally, 10−3 corresponds to the conversion of units for expression in mg/kg [51].
2.8.2. Hazard Quotient (HQ)
The hazard quotient (HQ) corresponds to the ratio between the potential exposure to a given substance and the level at which no adverse effects are observed [54]. The HQ serves to assess the health risks from exposure to a specific substance and was calculated using Equation (4) [51].
When HQ is ≤1, it indicates that exposure to the metals does not pose a significant non-carcinogenic health risk. In contrast, a value of HQ > 1 suggests that exposure to the metal may harm human health as it exceeds the safety threshold [51].
2.8.3. Hazard Index (HI)
The hazard index (HI) assesses the cumulative risk from exposure to multiple metals and was calculated using Equation (5), where HI is obtained from the sum of the HQ values of all metals [51].
An HI > 1 value indicates a potential health risk due to combined exposure to multiple hazardous substances [51].
2.8.4. Lifetime Cancer Risk
The lifetime cancer risk (LCR) is calculated for metals associated with cancer development and was calculated using Equation (6) [51,54]:
where SF is the carcinogenicity slope factor and measures the cancer risk per unit dose of a substance over a lifetime, and is expressed in mg/kg/day. The e SF values used in the calculations are Pb = 0.0085, Cr = 0.5, Cu = 1.5, Ni = 0.91, and Al = 0.0014 [51]. For a heavy metal, an LCR below 1 × 10⁻⁶ is considered negligible and the cancer risk can be disregarded, whereas an LCR above 1 × 10⁻⁴ is considered detrimental and the cancer risk is problematic [52].
Lifetime cancer risk was also calculated based on the long-term relevant daily systemic exposure dose (LCR′) using Equation (7) [54].
HT25 is the human equivalent animal dose (T25) and was calculated using Equation (8) [57]:
where T25 is a dose that caused cancer in 25% of the animals tested or the chronic dose rate normally expressed in units of mg/kg body weight/day that will produce tumors in a specific tissue area in 25% of the animals, after correction for spontaneous incidents and within the standard life span of the species [57]. bw is the weight of the human (70 kg), and w is the weight of the female rat (0.35 kg) [58]. The values for available T25 [54] were Cr (0.04 mg/kg), Ni (0.047 mg/kg), and Pb (39.3 mg/kg).
3. Results and Discussion
3.1. UV-Vis Spectrophotometry Analysis
Figure 2 shows the spectrophotometric scans of the eye shadows performed by UV-vis spectroscopy from 350 to 700 nm. Figure 2a shows the spectrophotometric scans performed on eye shadows M2, M3, M6, M7, M10, and M11, which were grouped in this way because of the similarity in the wavelengths of maximum light absorption at 420 nm and 508 nm. This would be because these eye shadow brands contain the same colorant or red pigment in the making of eye shadows.
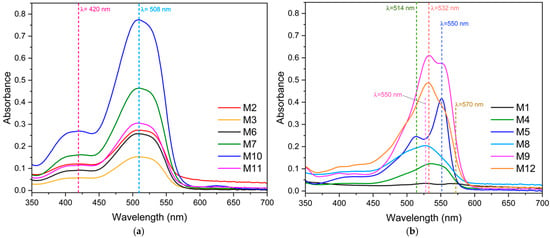
Figure 2.
Spectrophotometric scans of eye shadows by UV-vis spectrophotometry. (a) Eye shadows M2, M3, M6, M7, M10, and M11. (b) Eye shadows M1, M4, M5, M8, M9, and M12.
In contrast, spectrophotometric scans of eye shadows M1, M4, M5, M8, M9, and M12 are presented in Figure 2b. M1 shows peaks of maximum absorbance at 550 and 570 nm, M4 at 532 nm, M5 at 514 and 550 nm, M8 at 532 nm, M9 at 532 and 550 nm, and M12 at 532 nm. The differences in the scans are due to the presence of different dyes or red pigments. The similarities and differences of the pigments or dyes used are important because they can be a source of heavy metal contamination. This is confirmed by Velusamy et al. [58], who found that some dyes or colorants may contain heavy metals as impurities, including Cu, Fe, Mn, Ba, Pb, and Cr. Similarly, Lee et al. [59] found heavy metals (Sb, Co, Cu, Pb, Zn, and Ba) in pigments used in the production of tattoos.
3.2. ATR-FTIR Analysis
Figure 3a shows the ATR-FTIR spectra of eye shadows M2, M3, M6, M7, M10, and M11, and Figure 3b shows the spectra of M1, M4, M5, M8, M9, and M12. They were grouped in this way because of their similarities in the signals obtained in the ATR-FTIR spectra. A peak at 3675 cm−1, characteristic of the stretching vibrations of the O-H groups, is observed in M1, M2, M6, M7, M8, M9, M10, M11, and M12. Also, peaks of lower intensity at 3624 cm−1 are observed in M3, M4, M5, M6, M7, M8, M9, M10, M11, and M12, which are also characteristic of the stretching vibrations of O-H groups. Likewise, M1 and M12 present a peak at 3346 cm−1 due to the stretching vibrations of O-H groups. According to Meng et al. [59], these O-H vibrations could be associated with the Mg3OH species present in talc, which is a common excipient in eye shadow formulations.
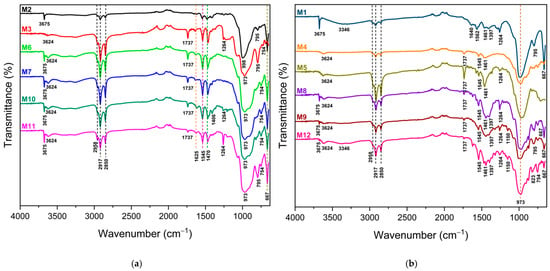
Figure 3.
ATR−FTIR spectra of eye shadows: (a) M2, M3, M6, M7, M10, and M11, and (b) M1, M4, M5, M8, M9, and M12.
Peaks of different intensity are observed at 2958, 2917, and 2850 cm−1 in all the analyzed eye shadows, corresponding to the stretching vibrations of C-H groups of the hydrocarbon -CH2- chains. Also, the presence of peaks at 1737 cm−1 is observed in eye shadows M3, M4, M5, M6, M7, M8, M9, M10, M11, and M12; this peak corresponds to C=O group stretching vibrations. In M2, M3, M4, M6, M7, M10, and M11, a peak is observed at 1625 cm−1, which corresponds to stretching vibrations of C=C groups.
A peak at 1625 cm−1 is observed in M2, M3, M4, M6, M7, M10, and M11. In M1, there are peaks at 1640 and 1562 cm−1, and in M2, M3, M4, M5, M6, M7, M8, M9, M10, and M12, a peak at 1545 cm−1 is observed. These peaks are related to vibrations of amide groups by bending of N-H /NH2 or stretching of N-C=O. The same results were found in the study by Chophi et al. [60], where they also analyzed eye shadow samples by FTIR.
A peak at 1470 cm−1 is observed in M2, M3, M6, M7, M10, and M11, and a peak at 1461 cm−1 is observed in M1, M4, M5, M8, M9, and M12, which correspond to C-H deformation vibrations of the -CH3 groups. Likewise, a peak at 1406 cm−1 is observed in M10, and a peak at 1397 cm−1 is observed in M1, M8, M9, and M12, which correspond to -CH2- group deformation vibrations. A peak at 1264 cm−1 is evident in M1, M3, M5, M8, M9, M10, M11, and M12, corresponding to C-H rocking vibrations. A peak at 1150 cm−1 is observed in eye shadows M9 and M12 that corresponds to C-C rocking vibrations. In all eye shadows, peaks are present at 998, 973, 823, 795, 754, and 667 cm−1; these peaks, according to Chophi et al. [60], correspond to the Si-H band vibrations of the silica group present in eye shadows.
3.3. SEM Analysis
Figure 4 presents the micrographs of all eye shadows, M1, M2, M3, M4, M5, and M6, performed by Scanning Electron Microscopy (SEM). Figure 4a shows the micrograph of eye shadow M1, where irregular structures with some small cubic-shaped particles, approximately 1 μm in size, are observed. Figure 4b shows the micrograph of eye shadow M2, where an irregular and amorphous structure is observed, formed with some smaller amorphous particles and other spherical particles, with an approximate size of between 0.25 and 1 μm. Moreover, Figure 4c shows the micrograph of eye shadow M3, where clay and lamellar particle structures with sizes between 10 and 50 μm can be observed. Figure 4d shows the micrograph of eye shadow M4, where irregular particle structures and a heterogeneous surface are observed. Figure 4e shows the micrograph of eye shadow M5, where clayey, rough, and amorphous particulate structures with porosity are observed. Likewise, Figure 4f shows the micrograph of eye shadow M6, where structures of clay particles with heterogeneous and irregular surfaces can be distinguished.
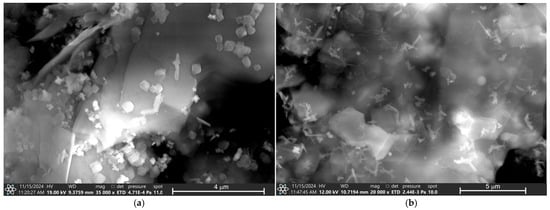
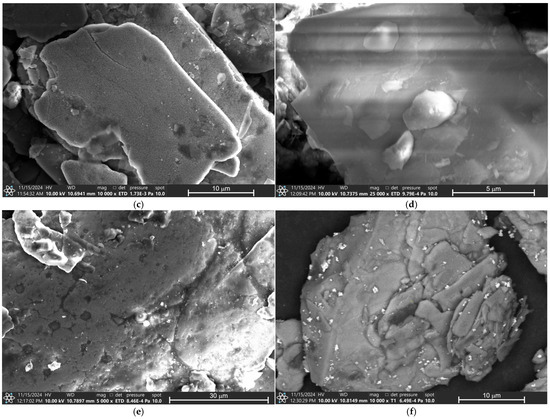
Figure 4.
SEM analysis of eye shadows (a) M1, (b) M2, (c) M3, (d) M4, (e) M5, and (f) M6.
The micrographs of all eye shadows, M7, M8, M9, M9, M10, M11, and M12, performed by Scanning Electron Microscopy (SEM) are presented in Figure 5. Figure 5a presents the micrograph of eye shadow M7, where porous surface clay particle structures are observed. The micrograph of eye shadow M8 is presented in Figure 5b, where laminar particulate structures of heterogeneous surface with smaller particles of approximately 0.25 μm on its surface are visible.
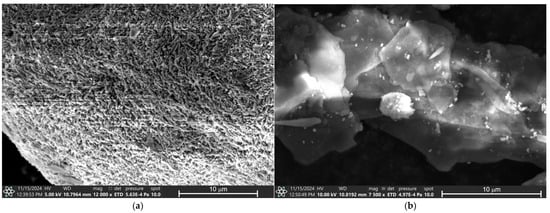
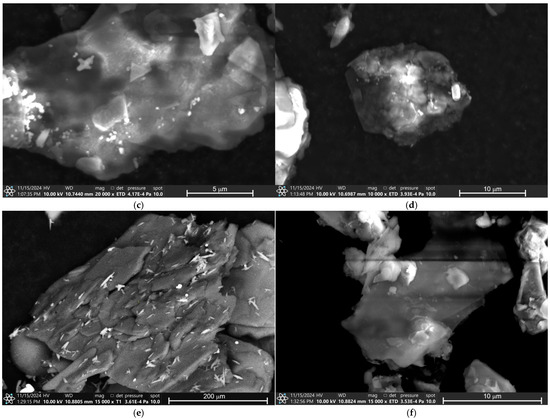
Figure 5.
SEM analysis of eye shadows (a) M7, (b) M8, (c) M9, (d) M10, (e) M11, and (f) M12.
Similarly, Figure 5c shows the microphotograph of the M9 eye shadow, where laminar particle structures of heterogeneous surface with particles measuring approximately 0.25 to 4 μm on its surface are observed. Figure 5d shows the micrograph of the M10 eye shadow, where heterogeneous and irregular surface structures are observed. In contrast, Figure 5d shows the micrograph of eye shadow M11, where heterogeneous surface clay structures are observed. Finally, Figure 5f shows the micrograph of the M12 eye shadow, where lamellar and irregular particle structures are observed.
3.4. EDS Analysis
Figure 6 presents the elemental analysis obtained by Energy-Dispersive Spectroscopy (EDS) of eye shadows M1, M2, M3, M4, M5, and M6. Figure 6a shows that eye shadow M1 is composed of C, O, Mg, Al, Si, Ca, Ti, and Fe with Wt% of 13, 49.56, 13.23, 0.21, 20.47, 0.23, 0.53, and 2.77, respectively. Likewise, Figure 6b shows that eye shadow M2 is composed of C, O, Mg, Al, Si, K, Ti, and Fe with Wt% of 11.06, 44.69, 6.14, 12.31, 19.77, 3.41, 0.29, and 2.33, respectively. Figure 6c shows that eye shadow M3 is composed of C, O, Mg, Al, Si, K, and Fe with Wt% of 3.45, 30.57, 3.89, 1.72, 12, 2.93, and 45.44%, respectively. Moreover, Figure 6d shows that eye shadow M4 is composed of C, O, F, Mg, Al, Si, S, and K with Wt% of 14.31, 43.03, 0.31, 0.83, 13.57, 19.44, 0.98, and 7.53%, respectively. Figure 6e shows that eye shadow M5 is composed of C, O, F, Mg, Al, Si, K, and Ti with Wt% of 12.92, 31.50, 4, 10.08, 4.84, 13.45, 6.03, and 17.18%, respectively. Similarly, Figure 6f shows that eye shadow M6 is composed of C, O, F, Na, Mg, Al, Si, and K with Wt% of 12.49, 41.15, 0.12, 0.41, 6.91, 9.42, 23.41, and 6.09%, respectively.
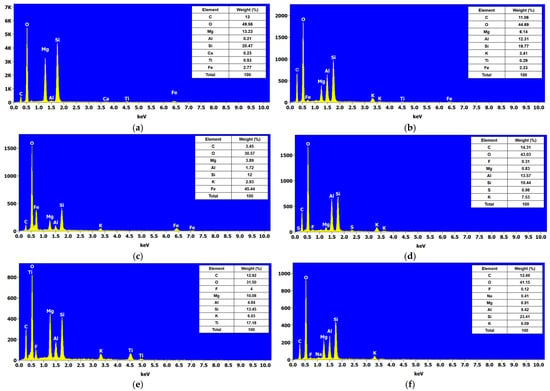
Figure 6.
EDS analysis of shadows by eyes: (a) MI, (b) M2, (c) M3, (d) M4, (e) M5, and (f) M6.
Figure 7 shows the elemental analysis obtained by Energy-Dispersive Spectroscopy (EDS) of eye shadows M7, M8, M9, M10, M11, and M12. Figure 7a shows that the M7 eye shadow is composed of C, O, Mg, Al, Si, and Fe with Wt% of 31.06, 24.17, 0.86, 1.19, 3.85, and 38.87, respectively. Figure 7b shows that eye shadow M8 is composed of C, O, Na, Mg, Al, Si, K, Ca, and Fe with Wt% of 6.66, 43.95, 0.39, 1.83, 14.56, 21.78, 7.11, 1.19, and 2.53%, respectively. Likewise, Figure 7c shows that eye shadow M9 is composed of Be, C, O, Na, Mg, Al, Si, Cl, K, Ca, Ti, and Fe with Wt% of 1.74, 26.85, 31.97, 0.23, 1.08, 6.34, 10.16, 0.16, 3.04, 6.15, 0.92, and 13.1%, respectively. Figure 7d shows that eye shadow M10 is composed of C, O, Na, Mg, Al, Si, S, S, K, Ti, Fe, and Ba with Wt% of 4.91, 23.4, 0.52, 0.76, 5.63, 7.39, 9.33, 2.7, 0.57, 1.91, and 42.88%, respectively. Similarly, Figure 7e shows that the M11 eye shadow is composed of C, O, Na, Si, S, and Fe with Wt% of 3.71, 23.69, 0.20, 7.54, 0.42, and 64.44%, respectively. Finally, Figure 7f shows that eye shadow M12 is composed of C, O, Mg, Al, Si, S, K, Ca, and Ba with Wt% of 4.75, 20.35, 0.64, 1.27, 2.6, 12.57, 0.55, 1.32, and 55.95%, respectively.
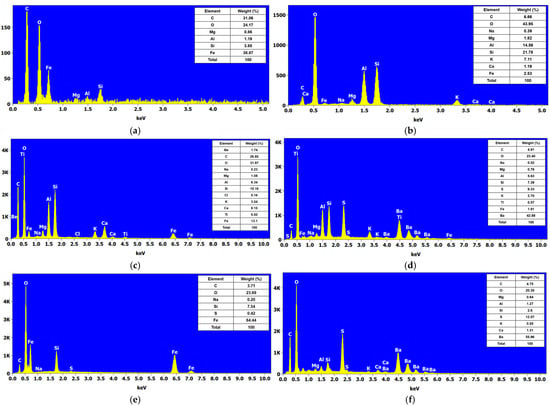
Figure 7.
EDS analysis of the shadows by eyes: (a) M7, (b) M8, (c) M9, (d) M10, (e) M11, and (f) M12.
3.5. Heavy Metals in Eye Shadow
Table 1 presents the concentrations of heavy metals found in the eye shadows studied, where Al, Ba, B, Cu, Cr, Fe, Mn, Ni, Pb, V, and Zn were present. In another similar study conducted on skin care products (cleanser, cream, and ointment), the presence of Al, Zn, Cu, Ni, Cr, Pb, Hg, Cd, and As was found [61]. In another study, Pb, Cd, As, Fe, Ni, Cr, and Hg were found in body lotion, cream, eyeliner, and lipstick [50].

Table 1.
Concentration of metals (mg/kg) in eye shadows.
3.5.1. Univariate Analysis
Aluminum
According to Table 1, the concentration of Al in the eye shadows studied is in the range of 2393 to 3133 mg/kg. The eye shadows with the highest Al concentration are M12 (24,800 ± 12.29 mg/kg), M7 (28,000 ± 15.15 mg/kg), M10 (28,333 ± 13.75 mg/kg), and M5 (28,333 ± 13.75 mg/kg). The other eye shadows showed concentrations of less than 15,000 mg/kg. One-way analysis of variance (ANOVA) (Figure 8a) showed that the Al concentration of all eye shadows differed significantly (p < 0.05); likewise, Tukey’s analysis confirmed that M5, M7, M10, and M12 had significantly higher Ba levels than the other eye shadows. Similarly, in another study conducted on cleansers and creams, they found Al concentrations ranging from 2.890 to 397.6 mg/kg [61]. Taking into account that Al is present in different cosmetics due to the use of additives such as Al powders and colorants containing this metal, it has also been reported that this metal can penetrate the skin barrier, which would result in accumulation in different tissues [51], causing serious health problems due to prolonged exposure. In addition, the high levels of Al in cosmetic products are due to the lack of regulation of this metal, which results in the absence of regulations limiting its concentration in cosmetic products [61].
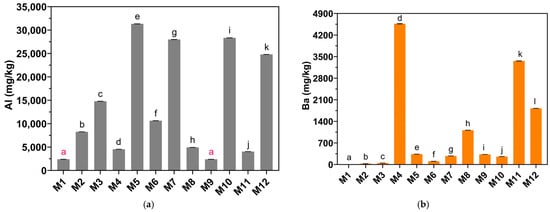
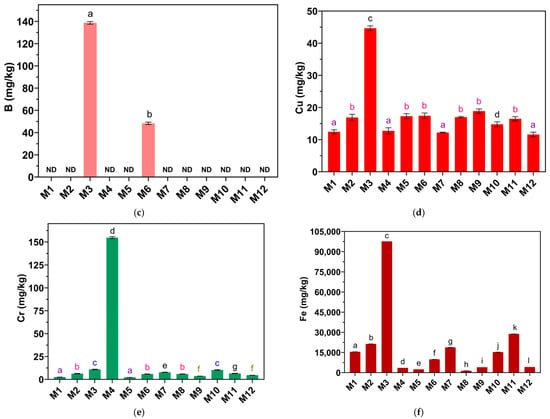
Figure 8.
Concentrations of (a) Al, (b) Ba, (c) B, (d) Cu, (e) Cr, and (f) Fe in mg/kg in eye shadows. ND indicates that the metal was not detected by the method. Equal letters indicate no significant difference (p > 0.05).
Barium
The concentration of Ba in the eye shadows studied is in the range of 5.03 to 4567 mg/kg (Table 1). The eye shadows with the highest concentration of Ba are M8 (1113 ± 4.25 mg/kg), M12 (1823 ± 6.35 mg/kg), M11 (3360 ± 6.78 mg/kg), and M4 (4567 ± 6.24 mg/kg). The other eye shadows presented concentrations lower than 400 mg/kg. One-way analysis of variance (ANOVA) (Figure 8b) showed that the Ba concentrations of all eye shadows differed significantly (p < 0.05); likewise, Tukey’s analysis showed that M4, M8, M11, and M12 presented significantly higher Ba levels than the other eye shadows. According to the European Commission, Ba may be present in pigments that are often used in cosmetics [62]. Ba in cosmetics is used as an opacifying agent [63].
Boron
B was quantified in eye shadows M3 and M6 (Table 1), and in the other eye shadows, it was not detectable. The concentration of B in eye shadow M3 was 138.7 ±1.19 mg/kg, and in M6 it was 48.33 ± 1.09 mg/kg. The Student’s t-test analysis (Figure 8c) showed that the B concentration of M3 is significantly higher than the B concentration of M6. B in eye shadow is used as boron nitride [64] for its lubricating effect and is used in quantities of up to 25% [65].
Copper
The Cu concentration of the eye shadows studied is in the range of 11.60 to 44.67 mg/kg (Table 1). The eye shadow with the highest Cu concentration is M3 (44.67 ± 0.74 mg/kg). The other eye shadows presented concentrations lower than 20 mg/kg. One-way analysis of variance (ANOVA) (Figure 8d) showed that the Cu concentration of at least one eye shadow sample differed significantly (p < 0.05), and Tukey’s analysis showed that the Cu concentrations of M1, M4, M7, and M12 did not differ significantly (p > 0. 05). Likewise, the Cu concentrations of M2, M5, M6, M8, M9, and M11 were not significantly different (p > 0.05); however, eye shadow M3 presents a significantly higher Cu concentration than the other eye shadows (p < 0.05). While it is true that Cu is useful in the skin due to its intervention in angiogenesis and the synthesis and stabilization of cutaneous proteins of the extracellular matrix [66], this metal, at high concentrations in cosmetics, can trigger allergic responses in consumers as well as skin irritation and redness [51].
Chromium
The Cr concentration of the eye shadows studied is in the range of 2.17 to 154.7 mg/kg (Table 1). The eye shadow with the highest Cr concentration is M4 (154.7 ± 1.12 mg/kg). The other eye shadows showed concentrations of less than 11 mg/kg. One-way analysis of variance (ANOVA) (Figure 8e) showed that the Cr concentration of at least one eye shadow sample differed significantly (p < 0.05) and Tukey’s analysis showed that the Cr concentrations of M1 and M5 did not differ significantly (p > 0.05); likewise, the Cr concentrations of M2, M6, and M8 did not differ significantly (p > 0.05), and the Cr levels in M9 and M12 also did not differ significantly (p > 0.05). The Cr concentrations of M3 and M10 did not differ significantly (p > 0.05). In contrast, the Cr concentrations of M4, M7, and M11 did differ significantly compared to the other eye shadows (p < 0.05). The Cr concentration of M4 is significantly higher than all the eye shadows studied (p < 0.05). Cr is a metal widely used in the cosmetic industry and is present in eye shadows [67]. According to the FDA, there are no regulations limiting Cr levels in cosmetics; however, in color additives of cosmetics, the maximum limit for Cr in cosmetics is 50 mg/kg [68].
Iron
The Fe concentration of the eye shadows studied is in the range of 1390 to 97,667 mg/kg (Table 1). The eye shadow with the highest Fe concentration is M3 (97,667 ± 8.76 mg/kg). The other eye shadows showed concentrations of less than 30,000 mg/kg. One-way analysis of variance (ANOVA) (Figure 8f) showed that the Fe concentration of at least one eye shadow sample differed significantly (p < 0.05), and Tukey’s analysis showed that the Fe concentration of all eye shadows differed significantly (p < 0.05). The Fe concentration of M3 is significantly higher than all eye shadows studied (p < 0.05). Fe is used in different cosmetics such as eye shadow [69]. One of the main sources of Fe contamination in eye shadows could be the incorporation of iron oxides that could irritate the skin or trigger allergic responses [51].
Manganese
The concentration of Mn in the eye shadows studied is in the range of 29.03 to 7133 mg/kg (Table 1). The eye shadow with the highest Mn concentration is M4 (7133 ± 8.75 mg/kg). The other eye shadows showed concentrations of less than 200 mg/kg. One-way analysis of variance (ANOVA) (Figure 9a) showed that the Mn concentration of at least one eye shadow sample differed significantly (p < 0.05), and Tukey’s analysis showed that the Mn concentrations of M1, M2, M5, M6, and M11 did not differ significantly (p > 0.05). The Mn concentration of M4 is significantly higher than all eye shadows studied (p < 0.05).
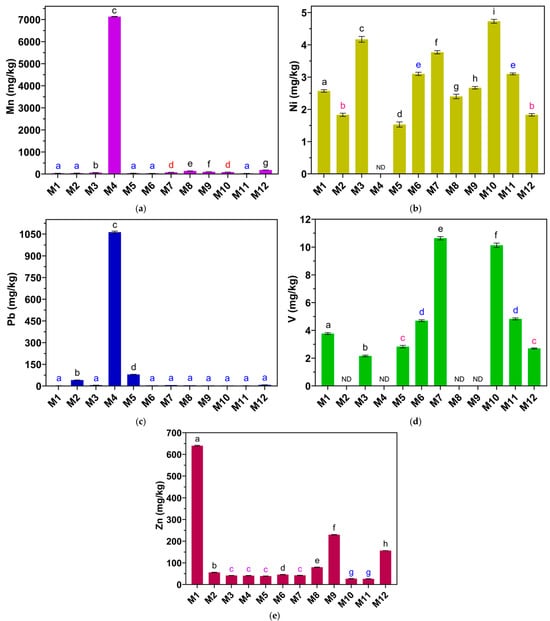
Figure 9.
Concentrations of (a) Mn, (b) Ni, (c) Pb, (d) V, and (e) Zn in mg/kg in eye shadows. ND indicates that the metal was not detected by the method. Equal letters indicate no significant difference (p > 0.05).
Nickel
The concentration of Ni in the eye shadows studied is in the range of 29.03 to 7133 mg/kg (Table 1). Ni concentration was not detectable in the M4 eye shadow. One-way analysis of variance (ANOVA) (Figure 9b) showed that the Ni concentration of at least one eye shadow sample differed significantly (p < 0.05), and Tukey’s analysis showed that the Ni concentrations of M1 and M12 did not differ significantly (p > 0.05). Likewise, the Ni concentrations of M6 and M11 did not differ significantly (p > 0.05). In contrast, the Ni concentrations of eye shadows M1, M3, M5, M7, M8, M9, and M10 differed significantly from all eye shadows. Ni in eye shadows can trigger allergic responses; for this reason, the European Union (EU) bans the presence of Ni in any cosmetic product [51].
Lead
The concentration of Pb in the eye shadows studied is in the range of 2.27 to 1063 mg/kg (Table 1). The eye shadow with the highest Mn concentration is M4 (1063 ± 6.86 mg/kg). The other eye shadows showed concentrations of less than 80 mg/kg. One-way analysis of variance (ANOVA) (Figure 9c) showed that the Pb concentration of at least one eye shadow sample differed significantly (p < 0.05), and Tukey’s analysis showed that the Pb concentrations of M1, M3, M6, M7, M8, M9, M10, M11, and M12 did not differ significantly (p > 0.05).
In contrast, the Pb concentrations of M2, M4, and M5 eye shadows differed significantly from all eye shadows (p > 0.05). The Pb concentration of M4 is significantly higher than all eye shadows studied (p < 0.05). The acceptable limit for Pb in cosmetics according to the EU is 0.5 mg/kg, according to WHO it is 10 mg/kg, and according to the United States Food and Drug Administration (USFDA) it is 20 mg/kg [50]. Considering this, no eye shadow sample complies with EU regulations; however, the concentrations of Pb in M1, M2, M3, M6, M7, M8, M9, M10, M11, and M12 would meet the maximum limits set by WHO and USFDA. Eye shadows M2, M4, and M5 are above all the limits stipulated by the other standards, with M4 being the eye shadow with the highest concentration of Pb, which is of concern due to the various negative health effects related to this metal.
Vanadium
The concentration of V in the eye shadows studied is in the range of 2.16 to 10.63 mg/kg (Table 1). V concentration was not detectable in the M2, M4, M8, and M9 eye shadows. One-way analysis of variance (ANOVA) (Figure 9d) showed that the Ni concentration of at least one eye shadow sample differed significantly (p < 0.05), and Tukey’s analysis showed that the V concentrations of M5 and M12 did not differ significantly (p > 0.05); likewise, the V concentrations of M6 and M11 did not differ significantly. In contrast, the concentrations of V in eye shadows M1, M3, M7, and M10 differed significantly from all eye shadows (p < 0.05).
Zinc
The concentration of Zn in the eye shadows studied is in the range of 26.33 to 640 mg/kg (Table 1). The eye shadow with the highest Zn concentration is M1 (640 ± 2.19 mg/kg). The other eye shadows presented concentrations lower than 230 mg/kg. One-way analysis of variance (ANOVA) (Figure 9e) showed that the Zn concentration of at least one eye shadow sample differed significantly (p < 0.05), and Tukey’s analysis showed that the Zn concentrations of M3, M4, M5, and M7 did not differ significantly (p > 0.05); likewise the Zn concentrations of M10 and M11 did not differ significantly. In contrast, the Zn concentrations of eye shadows M1, M2, M6, M8, M9, and M12 differed significantly from all eye shadows (p > 0.05). The Zn concentration of M1 is significantly higher than all eye shadows studied (p < 0.05). In cleansers and creams, Zn concentrations between 2.423 and 233.5 mg/kg mg/kg have been found [61].
3.5.2. Bivariate Analysis
The Pearson Correlation Coefficient (PCC) analysis is presented in Figure 10. Significant associations between some metals were found in this analysis. Very strong positive correlations were found between Fe-Cu (0.94), Ni-Cr (0.92), and strong positive correlations were found between Fe-Cr (0.65) and V-Ni (0.62), which could suggest a common source of contamination. However, moderate negative correlations were found between Zn-Al (−0.5), Pb-Cr (−0.5), Zn-Cr (−0.53), and Pb-Ni (−0.58), which could suggest different sources of contamination since when the concentration of one increases, the other decreases. The other correlations indicate independent sources of contamination.
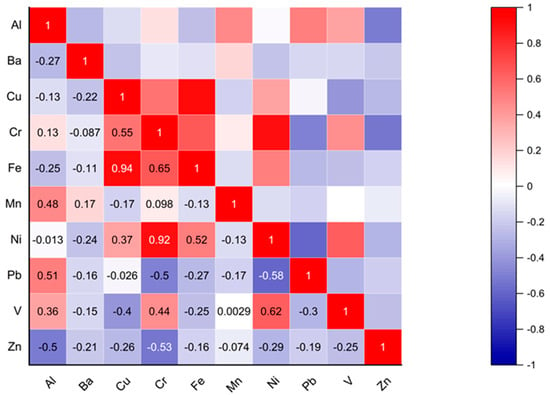
Figure 10.
Pearson’s correlation between heavy metals in eye shadows.
3.6. Multivariate Analysis
Using the heavy metal concentrations from Table 1 of the 12 eye shadow samples, a principal component analysis (PCA) was performed. This analysis is presented in Figure 11, where up to 68% of the variance is explained by PC1 = 43.31% and PC2 = 34.69%. The main contributors to negatively charged PCA1 are V followed by Al and Zn. While for PCA2, strong positive charges are observed for Cr, Mn, Pb, and Ba. Likewise, strong negative charges are observed for Ni, Fe, Cu, and B. It is observed that samples M1, M2, M5, M6, M7, M8, M9, M10, M11, and M12 are correlated; however, M3 and M4 are not correlated with the other samples, indicating differences in metal concentrations. According to Saah et al. [70], who evaluated heavy metals in lipsticks, the negative correlations found indicate that the presence of one of the metals could suppress the presence of the other.
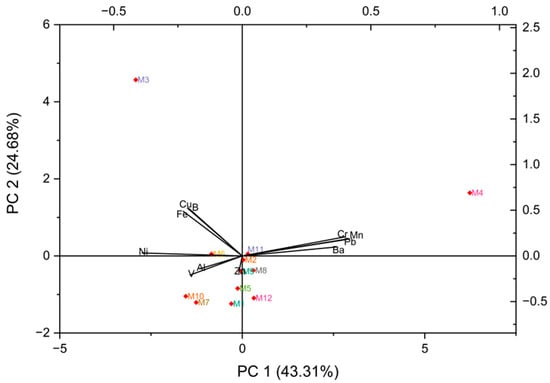
Figure 11.
Biplot principal component analysis (PCA) with heavy metal variables in eye shadow.
Figure 12a shows the Scree plot where three components are observed, the first with an eigenvalue of 4.76, the second with a value of 2.72, and the third with a value of 1.73, which could indicate that the toxic metals come from three different sources of contamination. Likewise, in another study by Ahmend et al. [51], using the Scree plot, it was found that the concentrations of heavy metals in massage cream, cleanser, mud mask, skin polish, scrub, lipstick, foundation, lotion, facial powder, and highlighter cosmetics were grouped into five clusters.
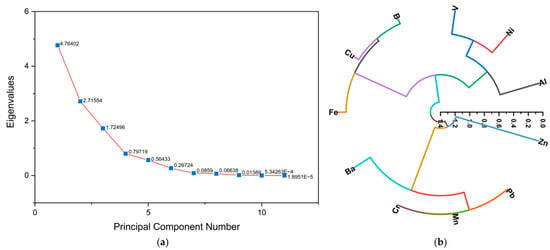
Figure 12.
(a) Scree plot of heavy metals in eye shadow and (b) hierarchical cluster analysis (HCA) of heavy metals in eye shadow.
Hierarchical cluster analysis (HCA) (Figure 12b) was used to group metals into correlated classes within a variable space, identifying three distinct groups. One group consisted of V, Ni, and Al, the second group consisted of B, Cu, and Fe, and the third group consisted of Ba, Cr, Mn, Pb, and Zn. Ba and Zn presented fewer associations with the other metals; this could indicate an independent source of contamination [51].
3.7. Health Risk Analysis
3.7.1. Systemic Exposure Dose
The systemic exposure doses (SEDs) were calculated with bioaccessibility factors of 10 and 50%, the results of which are presented in Table 2, where it can be seen that the highest values correspond to Al and Fe.

Table 2.
SED values (mg/kg/day) of heavy metal concentrations in eye shadows at 10 and 50% bioaccessibility.
3.7.2. Margin of Safety
The margin of safety (MoS) values for heavy metals in eye shadows are shown in Table 3 using a bioaccessibility factor of 10 and 50%. It is observed that almost all values are greater than 100, indicating that the levels of metals are safe. However, at 50% bioaccessibility, the concentration of Mn in M4 (MoS = 3.76) would not be safe; likewise, at 10% bioaccessibility, the levels of Mn in M4 (MoS = 18.8) would also not be safe.

Table 3.
MoS values of heavy metal concentrations in eye shadows at 10 and 50% bioaccessibility.
At 50% bioaccessibility, in comparison to another study where they analyzed the health risks in different cosmetics, where eye shadow was included, the MoS values of Mn levels were above 100 [54]. Similarly, in another eye shadow study, the MoS values for Mn concentration were greater than 100 [55]. However, at 100% bioaccessibility, Ahmed et al. [51] found that in the case of Al the MoS values were less than 100 in cleanser, lotion, facial powder, mud mask, skin polish, massage cream, and scrub cosmetics; likewise, in the case of Fe at 100% bioaccessibility, the MoS values were less than 100; in the case of metals such as Co, Cr, Ni, Pb, Sb, Hg, and Mn, at both 50% and 100% bioaccessibility, the MoS values were less than 100 in cleanser, lotion, facial powder, mud mask, skin polish, massage cream, and scrub cosmetics; finally, the MoS ranges for Zn at 100% bioaccessibility were below 100 in all cosmetic products except for lotion and massage cream. Based on these results, this study concludes that the cosmetics analyzed show unsafe and evident levels of risk.
3.7.3. Hazard Quotient
The risk quotient values for bioaccessibility factors of 10 and 50% of heavy metal concentrations in eye shadow are presented in Table 4. The results gave values less than 1 (HQ < 1), indicating that there is no risk to consumers; however, at 50% (Table 4) bioaccessibility, the Mn concentration of M4 is greater than 1 (HQ > 1), indicating that Mn levels could represent a risk to consumers. At 10% bioaccessibility, the Mn concentration of M4 was also greater than 1 (HQ > 1), which represents unsafe Mn concentrations. Similarly, considering 100% bioaccessibility, Gyamfi et al. [50] also found considerable health risks regarding the presence of Pb, Cd, Cr, Fe, Ni, and Hg in lotions, creams, eyeliners, and lipstick, finding hazard quotient values exceeding 1 (HQ > 1), which demonstrates the potential health risk.

Table 4.
HQ values of heavy metal concentrations in eye shadows at 10 and 50% bioaccessibility.
3.7.4. Hazard Index
Table 5 shows the hazard index (HI) values, which correspond to the sum of the HQ values of the heavy metals in each eye shadow studied. At 50% bioaccessibility, it is observed that M4 presents an HI > 1, which indicates the potential risk for the consumption of this product. Moreover, the consumption of eye shadow M4 at 10% bioaccessibility also represents a risk for consumers, with an HI > 1. Another study by Arshad et al. [3] found that the presence of Cd, Cr, Fe, Ni, and Pb was found in lotions and sunscreens with HI > 1 values of 50 and 100% bioaccessibility, which indicates that the excessive use of these cosmetics represents a health risk. In contrast, Kicińska et al. [54], who analyzed the health risks of different cosmetics, found HI < 1 values for eye shadows from Great Britain, the United States of America, and Germany. Different results were found by Gyamfi et al. [50], who found HI levels >1 in imported lotions and eyeliners that pose a threat to human health. Similarly, Ghaderpoori et al. [55] found HI > 1 values in creams.

Table 5.
HI values of heavy metal concentrations in eye shadows at 10 and 50% bioaccessibility.
3.7.5. Cancer Risk Assessment
Lifetime cancer risk (LCR) was calculated for Al, Cu, Cr, Ni, and Pb. Table 6 presents the results assuming 10 and 50% bioaccessibility. It is observed that all LCR values are less than 1 × 10⁻³, indicating that there is no risk of cancer in the use of eye shadows. In another study, Gyamfi et al. [50] found cancer risk in these products with respect to Cr concentrations in cream and lotion samples. Moreover, Ahmed et al. [51] found the LCR value less than 1 × 10⁻³ for Cu concentration in lipsticks, which implies a cancer risk. The lifetime cancer risk was also calculated based on the long-term relevant daily systemic exposure dose (LCR′) at 10 and 50% bioaccessibility (Table 7). It is observed that the Cr concentrations of M3, M4, M7, and M10 resulted in an LCR′ higher than 1 × 10⁻³ at 50% bioaccessibility. Moreover, assuming 10% bioaccessibility, the Cr concentrations of M4 exceed 1 × 10⁻³, which could represent a potential cancer risk.

Table 6.
LCR values of heavy metal concentrations in eye shadows at 10 and 50% bioaccessibility.

Table 7.
LCR′ values of heavy metal concentrations in eye shadows at 10 and 50% bioaccessibility.
It is important to take into account the regulation of excipients because the presence of Cr in the form of salt can increase permeability. Likewise, the type of Cr species present in the cosmetic could affect the permeation process since Cr (III) has lower permeation than Cr (VI), considering that one of the most abundant elements in eye shadows is Fe, and this, in its ferrous sulfate form, can reduce the absorption of both species of chromium, favoring its retention in the skin. However, it has also been shown that sweat with a pH of 4.5 can oxidize Cr, thus favoring its penetration through the skin [71].
3.7.6. Limitations of the Study
This study has certain limitations that should be taken into account when interpreting the results. Although the results obtained by ICP-MS provide a very sensitive and accurate quantification of the metal content in eye shadows, these results are used to estimate the risks using formulas to obtain a theoretical perspective but do not reflect the actual dermal absorption and systemic bioavailability of these metals under real conditions of use, nor do they reflect individual variability in consumer behavior or physiological responses. In contrast, in vitro and in vivo studies can provide more accurate data on percutaneous absorption and systemic exposure. However, such studies are beyond the scope of the present work. Therefore, the results presented here should be interpreted as a conservative estimate of potential risk, and future research should aim to incorporate experimental absorption data to better inform regulatory decisions and consumer safety assessments.
4. Conclusions
In the present study, different heavy metals of interest to human health were quantified in twelve different brands of eye shadows. Characterization by UV/vis and ATR-FTIR spectroscopy allowed the products to be grouped into two categories, offering preliminary insights into potential sources of contamination. SEM-EDS analysis provided complementary information on the surface morphology and elemental composition, with Al and Fe detected in most samples.
Univariate, bivariate, and multivariate analyses revealed differences in metal concentrations and associations among brands, highlighting the need for further investigation into contamination sources and distribution. Health risk assessments using SED, MoS, HI, LCR, and LCR′ showed that certain samples, particularly M3, M4, M7, and M10, presented non-carcinogenic and carcinogenic risks. For example, assuming 50% bioaccessibility, M4 showed an HI of 2.67 × 101 and an LCR of 1.06 × 10⁻³ for Cr, both exceeding acceptable safety thresholds. These findings suggest potential health concerns under specific exposure scenarios.
It is important to emphasize that these conclusions are limited to the specific samples and conditions analyzed in this study. Broader claims about all eye shadow formulations or other cosmetic products require further validation through larger-scale investigations.
Future studies should move beyond laboratory-based analysis and incorporate in vivo or clinical research to better understand how heavy metals from eye shadows are absorbed and processed by the human body, particularly in the sensitive eye area. Long-term product stability under varying storage conditions, such as temperature, humidity, and light exposure, should also be assessed to determine changes in metal content or bioavailability over time. Additionally, the potential for skin irritation or allergic reactions with prolonged use warrants further investigation. A more comprehensive toxicological framework that reflects real-life exposure scenarios would enhance risk assessment and support the development of more robust safety regulations.
Supplementary Materials
The following supporting information can be downloaded at https://www.mdpi.com/article/10.3390/cosmetics12050185/s1, Table S1: Code, place of purchase, and location of the eye shadows obtained in two malls in Arequipa, Peru; Table S2: Code, place of purchase, and location of the eye shadows obtained in two well-known shopping centers in the city of Arequipa, Peru; Table S3: Code, place of purchase, and location of the eye shadows obtained from a cosmetics wholesale high street; Figure S1: Process of eye shadow analysis by UV-vis spectrophotometry; Figure S2: Process of eye shadow analysis by Attenuated Total Reflectance Fourier Transform Infrared Spectroscopy (ATR-FTIR); Figure S3: Process of eye shadow analysis by Scanning Electron Microscopy (SEM) and Energy-Dispersive Spectroscopy (EDS).
Author Contributions
Conceptualization, E.G.G.-C., R.L.A.-G., and J.A.V.-S.; methodology, E.G.G.-C., E.E.Y.-I., C.C.-Q., and R.L.A.-G.; software, E.G.G.-C. and F.M.M.-Q.; validation, E.G.G.-C., C.C.-Q., and R.L.A.-G.; formal analysis, E.G.G.-C., E.E.Y.-I., R.L.A.-G., and J.A.V.-S.; investigation, E.G.G.-C., E.E.Y.-I., and R.L.A.-G.; resources, R.L.A.-G., E.E.Y.-I., A.C.-S.-D.-V., and J.A.V.-S.; data curation, E.G.G.-C., C.C.-Q., and A.C.-S.-D.-V.; writing—original draft preparation, E.G.G.-C., E.E.Y.-I., and R.L.A.-G.; writing—review and editing, E.G.G.-C., C.C.-Q., and R.L.A.-G.; visualization, E.G.G.-C., and F.M.M.-Q.; supervision, C.C.-Q., and J.A.V.-S.; project administration, A.C.-S.-D.-V., and F.M.M.-Q. All authors have read and agreed to the published version of the manuscript.
Funding
This research received no external funding.
Institutional Review Board Statement
Not applicable.
Informed Consent Statement
Not applicable.
Data Availability Statement
Data are contained within the article.
Conflicts of Interest
The authors declare no conflicts of interest.
Abbreviations
The following abbreviations are used in this manuscript:
| AA | Amount of eye shadow applied |
| ANOVA | Analysis of variance |
| ATR-FTIR | Attenuated total reflectance Fourier transform infrared spectroscopy |
| BF | Bioaccessibility factor |
| BW | Body weight |
| Cs | Metal concentration |
| EDS | Energy-Dispersive Spectroscopy |
| EU | European Union |
| F | Frequency of eye shadow application |
| HCA | Hierarchical cluster analysis |
| HI | Hazard index |
| HQ | Hazard quotient |
| HT25 | Human equivalent animal dose (T25) |
| LCR | Lifetime cancer risk |
| LCR′ | Long-term relevant daily systemic exposure dose |
| MF | Modifying factor |
| MoS | Margin of safety |
| NOAEL | Exposure Level where no adverse effect is observed |
| PCA | Principal component analysis |
| PCC | Pearson correlation coefficient |
| PTFE | Polytetrafluoroethylene |
| RF | Retention factor |
| RfD | Reference dermal dose |
| SED | Systemic exposure dose |
| SEM | Scanning electron microscopy |
| SF | Carcinogenicity slope factor |
| SSA | Skin surface on which the eye shadow is applied |
| T25 | Dose that caused cancer in 25% of the animals tested |
| UF | Uncertainty factor |
| USFDA | United States Food and Drug Administration |
| WHO | World Health Organization |
References
- Gyamfi, O.; Aboko, J.; Ankapong, E.; Marfo, J.T.; Awuah-Boateng, N.Y.; Sarpong, K.; Dartey, E. A Systematic Review of Heavy Metals Contamination in Cosmetics. Cutan. Ocul. Toxicol. 2024, 43, 5–12. [Google Scholar] [CrossRef]
- Abed, M.S.; Moosa, A.A.; Alzuhairi, M.A. Heavy Metals in Cosmetics and Tattoos: A Review of Historical Background, Health Impact, and Regulatory Limits. J. Hazard. Mater. Adv. 2024, 13, 100390. [Google Scholar] [CrossRef]
- Arshad, H.; Mehmood, M.Z.; Shah, M.H.; Abbasi, A.M. Evaluation of Heavy Metals in Cosmetic Products and Their Health Risk Assessment. Saudi Pharm. J. 2020, 28, 779–790. [Google Scholar] [CrossRef]
- Borowska, S.; Brzóska, M.M. Metals in Cosmetics: Implications for Human Health. J. Appl. Toxicol. 2015, 35, 551–572. [Google Scholar] [CrossRef]
- Mitra, S.; Chakraborty, A.J.; Tareq, A.M.; Emran, T.B.; Nainu, F.; Khusro, A.; Idris, A.M.; Khandaker, M.U.; Osman, H.; Alhumaydhi, F.A.; et al. Impact of Heavy Metals on the Environment and Human Health: Novel Therapeutic Insights to Counter the Toxicity. J. King Saud. Univ. Sci. 2022, 34, 101865. [Google Scholar] [CrossRef]
- Abd Elnabi, M.K.; Elkaliny, N.E.; Elyazied, M.M.; Azab, S.H.; Elkhalifa, S.A.; Elmasry, S.; Mouhamed, M.S.; Shalamesh, E.M.; Alhorieny, N.A.; Abd Elaty, A.E.; et al. Toxicity of Heavy Metals and Recent Advances in Their Removal: A Review. Toxics 2023, 11, 580. [Google Scholar] [CrossRef] [PubMed]
- Dinake, P.; Motswetla, O.; Kereeditse, T.T.; Kelebemang, R. Assessment of Level of Heavy Metals in Cosmetics. Toxicol. Res. Appl. 2023, 7, 23978473231156620. [Google Scholar] [CrossRef]
- Alam, M.F.; Akhter, M.; Mazumder, B.; Ferdous, A.; Hossain, M.D.; Dafader, N.C.; Ahmed, F.T.; Kundu, S.K.; Taheri, T.; Atique Ullah, A.K.M. Assessment of Some Heavy Metals in Selected Cosmetics Commonly Used in Bangladesh and Human Health Risk. J. Anal. Sci. Technol. 2019, 10, 2. [Google Scholar] [CrossRef]
- Ungureanu, E.L.; Mustatea, G.; Ungureanu, E.L.; Mustatea, G. Toxicity of Heavy Metals. In Environmental Impact and Remediation of Heavy Metals; IntechOpen: London, UK, 2022; ISBN 978-1-80355-526-3. [Google Scholar]
- Naqvi, S.A.R.; Idrees, F.; Sherazi, T.A.; Hassan, S.U.; Ishfaq, N. Toxicology Associated with Heavy Metals Found in Cosmetics. J. Chil. Chem. Soc. 2022, 67, 5615–5622. [Google Scholar] [CrossRef]
- Bocca, B.; Pino, A.; Alimonti, A.; Forte, G. Toxic Metals Contained in Cosmetics: A Status Report. Regul. Toxicol. Pharmacol. 2014, 68, 447–467. [Google Scholar] [CrossRef]
- Attard, T.; Attard, E.; Attard, T.; Attard, E. Heavy Metals in Cosmetics. In Environmental Impact and Remediation of Heavy Metals; IntechOpen: London, UK, 2022; ISBN 978-1-80355-526-3. [Google Scholar]
- Igbokwe, I.O.; Igwenagu, E.; Igbokwe, N.A. Aluminium Toxicosis: A Review of Toxic Actions and Effects. Interdiscip. Toxicol. 2019, 12, 45–70. [Google Scholar] [CrossRef]
- Cooke, K.; Gould, M.H. The Health Effects of Aluminium—A Review. J. R. Soc. Health 1991, 111, 163–168. [Google Scholar] [CrossRef]
- Oskarsson, A. Chapter 4—Barium. In Handbook on the Toxicology of Metals, 5th ed.; Nordberg, G.F., Costa, M., Eds.; Academic Press: Cambridge, MA, USA, 2022; pp. 91–100. ISBN 978-0-12-822946-0. [Google Scholar]
- Gad, S.C. Barium. In Encyclopedia of Toxicology, 5th ed.; Wexler, P., Ed.; Academic Press: Oxford, UK, 2024; pp. 911–915. ISBN 978-0-323-85434-4. [Google Scholar]
- Moffett, D.; Smith, C.; Stevens, Y.; Ingerman, L.; Swarts, S.; Chappell, L. Toxicological Profile for Barium and Barium Compounds. Health Effects; Agency for Toxic Substances and Disease Registry (US): Atlanta, GA, USA, 2007.
- Sevim, Ç.; Kara, M.; Sevim, Ç.; Kara, M. Boron and Boron-Containing Compounds Toxicity. In The Toxicity of Environmental Pollutants; IntechOpen: London, UK, 2022; ISBN 978-1-80355-580-5. [Google Scholar]
- Duydu, Y.; Başaran, N. Effects of Boron Exposure on Human Reproduction and Development. Curr. Opin. Toxicol. 2023, 34, 100403. [Google Scholar] [CrossRef]
- Williams, M.; Mumtaz, M.; Fay, M.; Scinicariello, F.; Jenkins, K.; Lumpkin, M.; Chappell, L.; McClure, P.R. Toxicological Profile for Boron. In Toxicological Profile for Boron; Agency for Toxic Substances and Disease Registry (US): Atlanta, GA, USA, 2010. [Google Scholar]
- Royer, A.; Sharman, T. Copper Toxicity. In StatPearls; StatPearls Publishing: Treasure Island, FL, USA, 2025. [Google Scholar]
- Binesh, A.; Venkatachalam, K. Copper in Human Health and Disease: A Comprehensive Review. J. Biochem. Mol. Toxicol. 2024, 38, e70052. [Google Scholar] [CrossRef]
- Uauy, R.; Maass, A.; Araya, M. Estimating Risk from Copper Excess in Human Populations1. Am. J. Clin. Nutr. 2008, 88, 867S–871S. [Google Scholar] [CrossRef] [PubMed]
- Rafati Rahimzadeh, M.; Rafati Rahimzadeh, M.; Kazemi, S.; Moghadamnia, A.A. Copper Poisoning with Emphasis on Its Clinical Manifestations and Treatment of Intoxication. Adv. Public Health 2024, 2024, 6001014. [Google Scholar] [CrossRef]
- Saha, B.; Amine, A.; Verpoort, F. Special Issue: Hexavalent Chromium: Sources, Toxicity, and Remediation. Chem. Afr. 2022, 5, 1779–1780. [Google Scholar] [CrossRef]
- Ukhurebor, K.E.; Aigbe, U.O.; Onyancha, R.B.; Nwankwo, W.; Osibote, O.A.; Paumo, H.K.; Ama, O.M.; Adetunji, C.O.; Siloko, I.U. Effect of Hexavalent Chromium on the Environment and Removal Techniques: A Review. J. Environ. Manag. 2021, 280, 111809. [Google Scholar] [CrossRef] [PubMed]
- Layek, M.; Khatun, N.; Karmakar, P.; Kundu, S.; Mitra, M.; Karmakar, K.; Mondal, S.; Bhattarai, A.; Saha, B. Toxicity of Hexavalent Chromium: Review. In Chromium in Plants and Environment; Kumar, N., Walther, C., Gupta, D.K., Eds.; Springer Nature: Cham, Switzerland, 2023; pp. 191–215. ISBN 978-3-031-44029-8. [Google Scholar]
- Costa, M. Toxicity and Carcinogenicity of Cr(VI) in Animal Models and Humans. Crit. Rev. Toxicol. 1997, 27, 431–442. [Google Scholar] [CrossRef]
- Ponka, P.; Tenenbein, M.; Eaton, J.W. CHAPTER 30—Iron. In Handbook on the Toxicology of Metals, 3rd ed.; Nordberg, G.F., Fowler, B.A., Nordberg, M., Friberg, L.T., Eds.; Academic Press: Burlington, NJ, USA, 2007; pp. 577–598. ISBN 978-0-12-369413-3. [Google Scholar]
- Eid, R.; Arab, N.T.T.; Greenwood, M.T. Iron Mediated Toxicity and Programmed Cell Death: A Review and a Re-Examination of Existing Paradigms. Biochim. Biophys. Acta (BBA)-Mol. Cell Res. 2017, 1864, 399–430. [Google Scholar] [CrossRef]
- Kontoghiorghes, G.J. Iron Load Toxicity in Medicine: From Molecular and Cellular Aspects to Clinical Implications. Int. J. Mol. Sci. 2023, 24, 12928. [Google Scholar] [CrossRef]
- Keen, C.L.; Ensunsa, J.L.; Lönnerdal, B.; Zidenberg-Cherr, S. Manganese. In Encyclopedia of Human Nutrition, 3rd ed.; Caballero, B., Ed.; Academic Press: Waltham, MA, USA, 2013; pp. 148–154. ISBN 978-0-12-384885-7. [Google Scholar]
- Evans, G.R.; Masullo, L.N. Manganese Toxicity. In StatPearls; StatPearls Publishing: Treasure Island, FL, USA, 2025. [Google Scholar]
- Miah, M.R.; Ijomone, O.M.; Okoh, C.O.A.; Ijomone, O.K.; Akingbade, G.T.; Ke, T.; Krum, B.; da Cunha Martins, A.; Akinyemi, A.; Aranoff, N.; et al. The Effects of Manganese Overexposure on Brain Health. Neurochem. Int. 2020, 135, 104688. [Google Scholar] [CrossRef]
- Genchi, G.; Carocci, A.; Lauria, G.; Sinicropi, M.S.; Catalano, A. Nickel: Human Health and Environmental Toxicology. Int. J. Env. Res. Public Health 2020, 17, 679. [Google Scholar] [CrossRef]
- Zambelli, B.; Uversky, V.N.; Ciurli, S. Nickel Impact on Human Health: An Intrinsic Disorder Perspective. Biochim. Biophys. Acta (BBA)-Proteins Proteom. 2016, 1864, 1714–1731. [Google Scholar] [CrossRef]
- Buxton, S.; Garman, E.; Heim, K.E.; Lyons-Darden, T.; Schlekat, C.E.; Taylor, M.D.; Oller, A.R. Concise Review of Nickel Human Health Toxicology and Ecotoxicology. Inorganics 2019, 7, 89. [Google Scholar] [CrossRef]
- Denkhaus, E.; Salnikow, K. Nickel Essentiality, Toxicity, and Carcinogenicity. Crit. Rev. Oncol./Hematol. 2002, 42, 35–56. [Google Scholar] [CrossRef]
- Boreiko, C.J. SAFETY|Materials Toxicity. In Encyclopedia of Electrochemical Power Sources; Garche, J., Ed.; Elsevier: Amsterdam, The Netherlands, 2009; pp. 233–240. ISBN 978-0-444-52745-5. [Google Scholar]
- Wani, A.L.; Ara, A.; Usmani, J.A. Lead Toxicity: A Review. Interdiscip. Toxicol. 2015, 8, 55–64. [Google Scholar] [CrossRef] [PubMed]
- Jaishankar, M.; Tseten, T.; Anbalagan, N.; Mathew, B.B.; Beeregowda, K.N. Toxicity, Mechanism and Health Effects of Some Heavy Metals. Interdiscip. Toxicol. 2014, 7, 60–72. [Google Scholar] [CrossRef] [PubMed]
- Balali-Mood, M.; Naseri, K.; Tahergorabi, Z.; Khazdair, M.R.; Sadeghi, M. Toxic Mechanisms of Five Heavy Metals: Mercury, Lead, Chromium, Cadmium, and Arsenic. Front. Pharmacol. 2021, 12, 643972. [Google Scholar] [CrossRef] [PubMed]
- Olaolorun, F.A.; Olopade, F.E.; Usende, I.L.; Lijoka, A.D.; Ladagu, A.D.; Olopade, J.O. Chapter Ten—Neurotoxicity of Vanadium. In Advances in Neurotoxicology; Aschner, M., Costa, L.G., Eds.; Neurotoxicity of Metals: Old Issues and New Developments; Academic Press: Cambridge, MA, USA, 2021; Volume 5, pp. 299–327. [Google Scholar]
- Zwolak, I. Protective Effects of Dietary Antioxidants against Vanadium-Induced Toxicity: A Review. Oxidative Med. Cell. Longev. 2020, 2020, 1490316. [Google Scholar] [CrossRef]
- Ścibior, A.; Llopis, J.; Dobrakowski, P.P.; Męcik-Kronenberg, T. CNS-Related Effects Caused by Vanadium at Realistic Exposure Levels in Humans: A Comprehensive Overview Supplemented with Selected Animal Studies. Int. J. Mol. Sci. 2023, 24, 9004. [Google Scholar] [CrossRef] [PubMed]
- Meng, Y.; Xiang, C.; Huo, J.; Shen, S.; Tang, Y.; Wu, L. Toxicity Effects of Zinc Supply on Growth Revealed by Physiological and Transcriptomic Evidences in Sweet Potato (Ipomoea batatas (L.) Lam). Sci. Rep. 2023, 13, 19203. [Google Scholar] [CrossRef]
- Hussain, S.; Khan, M.; Sheikh, T.M.M.; Mumtaz, M.Z.; Chohan, T.A.; Shamim, S.; Liu, Y. Zinc Essentiality, Toxicity, and Its Bacterial Bioremediation: A Comprehensive Insight. Front. Microbiol. 2022, 13, 900740. [Google Scholar] [CrossRef] [PubMed]
- Schoofs, H.; Schmit, J.; Rink, L. Zinc Toxicity: Understanding the Limits. Molecules 2024, 29, 3130. [Google Scholar] [CrossRef] [PubMed]
- Agnew, U.M.; Slesinger, T.L. Zinc Toxicity. In StatPearls; StatPearls Publishing: Treasure Island, FL, USA, 2025. [Google Scholar]
- Gyamfi, O.; Aboko, J.; Ankapong, E.; Marfo, J.T.; Awuah-Boateng, N.Y.; Agyei, V.; Sarpong, K.; Dartey, E. Heavy Metals in Local and Imported Cosmetics in Ghana and Their Health Risk Assessment. Cogent Public Health 2023, 10, 2217693. [Google Scholar] [CrossRef]
- Ahmed, M.; Ahmad, M.; Sohail, A.; Sanaullah, M.; Saeed, A.; Qamar, S.; Wani, T.A.; Zargar, S.; Alkahtani, H.M.; Khalid, K. Multivariate Statistical Analysis of Cosmetics Due to Potentially Toxic/Heavy Metal(Loid) Contamination: Source Identification for Sustainability and Human Health Risk Assessment. Sustainability 2024, 16, 6127. [Google Scholar] [CrossRef]
- Mohammadi, A.A.; Zarei, A.; Majidi, S.; Ghaderpoury, A.; Hashempour, Y.; Saghi, M.H.; Alinejad, A.; Yousefi, M.; Hosseingholizadeh, N.; Ghaderpoori, M. Carcinogenic and Non-Carcinogenic Health Risk Assessment of Heavy Metals in Drinking Water of Khorramabad, Iran. MethodsX 2019, 6, 1642–1651. [Google Scholar] [CrossRef]
- U.S. Environmental Protection Agency. Available online: https://www.epa.gov/home (accessed on 10 May 2025).
- Kicińska, A.; Kowalczyk, M. Health Risks from Heavy Metals in Cosmetic Products Available in the Online Consumer Market. Sci. Rep. 2025, 15, 316. [Google Scholar] [CrossRef]
- Ghaderpoori, M.; Kamarehie, B.; Jafari, A.; Alinejad, A.A.; Hashempour, Y.; Saghi, M.H.; Yousefi, M.; Oliveri Conti, G.; Mohammadi, A.A.; Ghaderpoury, A.; et al. Health Risk Assessment of Heavy Metals in Cosmetic Products Sold in Iran: The Monte Carlo Simulation. Environ. Sci. Pollut. Res. 2020, 27, 7588–7595. [Google Scholar] [CrossRef]
- Ragnarsdóttir, O.; Abdallah, M.A.-E.; Harrad, S. Dermal Bioaccessibility of Perfluoroalkyl Substances from Household Dust; Influence of Topically Applied Cosmetics. Environ. Res. 2023, 238, 117093. [Google Scholar] [CrossRef]
- Helgesen, L.I.; Gjernes, E. A Way of Qualifying Amine Based Capture Technologies with Respect to Health and Environmental Properties. Energy Procedia 2016, 86, 239–251. [Google Scholar] [CrossRef]
- Lim, D.S.; Roh, T.H.; Kim, M.K.; Kwon, Y.C.; Choi, S.M.; Kwack, S.J.; Kim, K.B.; Yoon, S.; Kim, H.S.; Lee, B.-M. Non-Cancer, Cancer, and Dermal Sensitization Risk Assessment of Heavy Metals in Cosmetics. J. Toxicol. Environ. Health A 2018, 81, 432–452. [Google Scholar] [CrossRef] [PubMed]
- Meng, Y.; Xie, W.; Wu, H.; Tariq, S.M.; Yang, H. Evolution of Black Talc upon Thermal Treatment. Minerals 2022, 12, 155. [Google Scholar] [CrossRef]
- Chophi, R.; Sharma, S.; Jossan, J.K.; Singh, R. Rapid and Non-Destructive Analysis of Eye-Cosmetics Using ATR-FTIR Spectroscopy and Chemometrics. Forensic Sci. Int. 2021, 329, 111062. [Google Scholar] [CrossRef] [PubMed]
- Meng, Y.; Li, Y.; Zheng, N.; Hou, S.; Li, Y.; Wang, S.; Sun, S.; Hua, X.; Liang, D. Potential Health Risks of Metals in Skin Care Products Used by Chinese Consumers Aged 19–29 Years. Ecotoxicol. Environ. Saf. 2021, 216, 112184. [Google Scholar] [CrossRef]
- CosIng—Cosmetics—GROWTH—European Commission. Available online: https://ec.europa.eu/growth/tools-databases/cosing/details/29985 (accessed on 6 July 2025).
- Johnson, W., Jr.; Bergfeld, W.F.; Belsito, D.V.; Hill, R.A.; Klaassen, C.D.; Liebler, D.C.; Marks, J.G., Jr.; Shank, R.C.; Slaga, T.J.; Snyder, P.W.; et al. Safety Assessment of Barium Sulfate as Used in Cosmetics. Int. J. Toxicol. 2018, 37, 5S–11S. [Google Scholar] [CrossRef] [PubMed]
- Bhushan, B.; Nayak, A.; Bhatnagar, G.; Chauhan, A.; Kashyap, D. Boron Nitride and Its Functionalized Derivatives: An Overview and Comparative Assessment of Their Structure, Properties and Application with a Special Focus as Water-Based Adsorbent. J. Water Process Eng. 2024, 66, 105916. [Google Scholar] [CrossRef]
- Fiume, M.M.; Bergfeld, W.F.; Belsito, D.V.; Hill, R.A.; Klaassen, C.D.; Liebler, D.C.; Marks, J.G.; Shank, R.C.; Slaga, T.J.; Snyder, P.W.; et al. Safety Assessment of Boron Nitride as Used in Cosmetics. Int. J. Toxicol. 2015, 34, 53S–60S. [Google Scholar] [CrossRef]
- Borkow, G. Using Copper to Improve the Well-Being of the Skin. Curr. Chem. Biol. 2014, 8, 89–102. [Google Scholar] [CrossRef]
- Bruzzoniti, M.C.; Abollino, O.; Pazzi, M.; Rivoira, L.; Giacomino, A.; Vincenti, M. Chromium, Nickel, and Cobalt in Cosmetic Matrices: An Integrated Bioanalytical Characterization through Total Content, Bioaccessibility, and Cr(III)/Cr(VI) Speciation. Anal. Bioanal. Chem. 2017, 409, 6831–6841. [Google Scholar] [CrossRef]
- Food and Drug Administration. FDA’s Testing of Cosmetics for Arsenic, Cadmium, Chromium, Cobalt, Lead, Mercury, and Nickel Content; Food and Drug Administration: Silver Spring, MD, USA, 2024. [Google Scholar]
- Lansdown, A.B.G. Iron: A Cosmetic Constituent but an Essential Nutrient for Healthy Skin. Int. J. Cosmet. Sci. 2001, 23, 129–137. [Google Scholar] [CrossRef] [PubMed]
- Saah, S.A.; Boadi, N.O.; Sakyi, P.O.; Smith, E.Q. Human Health Risks of Lead, Cadmium, and Other Heavy Metals in Lipsticks. Heliyon 2024, 10, e40576. [Google Scholar] [CrossRef] [PubMed]
- Franken, A.; Eloff, F.C.; Du Plessis, J.; Du Plessis, J.L. In Vitro Permeation of Metals through Human Skin: A Review and Recommendations. Chem. Res. Toxicol. 2015, 28, 2237–2249. [Google Scholar] [CrossRef] [PubMed]
Disclaimer/Publisher’s Note: The statements, opinions and data contained in all publications are solely those of the individual author(s) and contributor(s) and not of MDPI and/or the editor(s). MDPI and/or the editor(s) disclaim responsibility for any injury to people or property resulting from any ideas, methods, instructions or products referred to in the content. |
© 2025 by the authors. Licensee MDPI, Basel, Switzerland. This article is an open access article distributed under the terms and conditions of the Creative Commons Attribution (CC BY) license (https://creativecommons.org/licenses/by/4.0/).