Abstract
The objective of this study was to reexamine the general statement declaring that cationic and anionic species cannot be compatible in cosmetic products. This research demonstrated that there are considerable differences between the binding of cationic preservatives and various anionic compounds used in cosmetics, depending on the anionic functional group. Sulfate- and sulfonate-based molecules showed significantly stronger interactions with cationic surfactants than carboxylate-based anionic surfactants: This difference of affinity could reach a ratio of 1 to 10. We validated that conductimetry and isothermal titration calorimetry (ITC) can be used as predictive tools to determine the molecular interactions between any cationic and anionic species. Consequently, the correlation between compatible and incompatible cationic/anionic mixtures were verified and their corresponding anti-microbial activity using the challenge test was assessed.
Keywords:
preservation; antimicrobials; compatibility; cationic; anionic; conductometry; calorimetry 1. Introduction
Cosmetic formulations contain a variety of materials that can potentially interact with each other and, particularly, with the preservative components, which might in turn affect the preservative system efficacy. Since the formulations are complex, the interactions between all ingredients and their impact on the formulation are hard to predict.
Anionic surfactants are widely used in cosmetic products and in bigger quantities than any other type of surfactants due to their high detergency and low manufacturing cost [1,2]. Oppositely charged mixed surfactants attracted the attention of numerous researchers [3,4,5,6,7,8,9,10,11,12,13,14]. Aqueous mixtures of anionic and cationic surfactants may exhibit unique properties that arise from the strong electrostatic interactions between the oppositely charged headgroups [4,5,6,7,10,12,13,14]. These mixtures were studied extensively due to their widespread applications in various household and industrial products and processes such as pharmaceuticals, nanomaterials, cosmetics, wastewater treatment, food industries, detergency, etc. [8,9,10,11,12,13,14]
Several types of anionic and cationic surfactant systems were reported to exhibit a strong ability to form mixed micelles and induce a surface tension reduction in the solution [15]. However, strong interactions between cationic and anionic surfactant or other molecules may have consequences for their practical application [16]. Therefore, the use of cationic preservative molecules in cosmetic formulation containing a high content of anionic species is often avoided since anionic and cationic compounds are commonly considered incompatible.
It was reported that the strong interactions between the cationic surfactant ethyl lauroyl arginate (ELA) and other anionic or hydrophobic components altered its solubility in aqueous solutions and, therefore, affected the stability of final products [16]. The authors assumed that interactions between the cationic ELA and other components within the complex system might affect the preservative ability to approach and interact with bacterial cell membranes, thus questioning its antimicrobial activity [17,18].
In the pharmaceutical field, the occurrence of molecular interactions between cationic and anionic species can be critical as well. The feasibility of electrostatic interactions between opposite charged drugs, insulin and benzoic acid, and chitosan, a natural preservative, was reported; however, no ionic interaction between the carboxyl group of benzoic acid and the amine group of chitosan was detected [19].
These concerns and studies show the importance of developing an ability to determine the degree of interaction leading to the adequate selection of cationic preservatives to a given cosmetic anionic formulation, in order to maintain their activity. At present, to the best of our knowledge, the related information is lacking and there is a great need for such an investigation.
Isothermal titration calorimetry (ITC) is a well-known technique that quantitatively determine the thermodynamic aspect of molecular interactions in solution. However, it was mostly used to study biomolecular interactions and binding affinity between molecules such as ligands, proteins, and pharmaceutical compounds to biological macromolecules (e.g., DNA, proteins, and polymers) [16,20,21,22]. ITC measures the binding process directly by monitoring the heat evolution associated with the molecular interactions, thereby determining the values of the binding constant (Ka), the stoichiometry (n), and the enthalpy of binding (ΔH) [21].
Considerable attention was given to conductimetric methods that were applied to characterize ionic surfactants behavior in solution [23,24,25,26]. Ionization degree and critical micellar concentration (CMC) were indirectly identified and calculated based on a graph breaking point of conductance vs. surfactant concentration [23,24]. In addition, the formation of complexes composed of two opposite charged molecules (anionic dye and cationic surfactant) was investigated using conductimetry [25,26]. The authors found that the overall conductivity was unexpectedly deviated from the sum of the two tested compounds and concluded that a less-conducting dye-surfactant complex was formed [25,26].
In this study, the electrical conductivity and the ITC were combined to determine the degree of ionic interactions between cationic surfactants and anionic compounds, commonly, but separately, used in cosmetic formulations. The ability to differentiate between strong and weak ionic interactions is essential for the rational development and selection of antimicrobial compounds in potential cosmetic applications.
Therefore, this work seeks to quantitate the ionic interactions between cationic surfactants and various types of anionic species; and to interpret those molecular interactions in terms of compatibility or incompatibility between oppositely charged molecules for cosmetic uses. Furthermore, the intensity of these cationic/anionic interactions will be correlated with the performance of cationic preservative systems operating within anionic formulations, due to results gathered from challenge tests.
2. Materials and Methods
All compounds used in the present work, including their chemical and trade name, molecular structure, and abbreviation, are listed in Table 1. DDAC (Didecyldimethylammonium chloride) was purchased from Lonza (Basel, Switzerland). CLC, DCCA, P-80, and M-78 were bought from Colonial Chemical, Inc. (Pittsburg, TN, USA), and ELA from AF Biochem (Chengdu, China). Isethionate, Glutamate, and Glycinate were purchased from Innospec (Littleton, CO, USA); SLS and Sarcosinate from Sigma-Aldrich (Jerusalem, Israel), and SLE2S from Zohar Dalia (Dalia, Israel). Carbonate buffer pH 9, used for ITC experiments, was composed of 9/1 vol/vol 0.1 M Na2HCO3 and 0.1 M Na2CO3.

Table 1.
Chemical and trade names, molecular structure, and abbreviation of the diverse cationic and anionic molecules studied in this work.
2.1. Conductometry
Electrical conductivity was determined using a single-channel 912 conductometer (Metrohm, Herisau, Switzerland). The conductivity experiments were carried out at 25 °C ± 0.1 °C. Temperature control was maintained by placing the tested solution into a temperature-controlled water bath. The water used to prepare the solutions was double distilled. The conductance range was 0.1 µS–500 mS with a conductivity accuracy of ±1%.
2.2. Isothermal Titration Calorimetry
The microcalorimetric study was carried out using MicroCal PEAQ-ITC system (Malvern Panalytical, Malvern, UK). The reference cell and the sample cells were approximately 280 μL each. The titration was carried out at 25.0 ± 0.1 °C, using sequential injections of 2 μL of 20 mM cationic solution from a 40 μL injection syringe into the sample cell filled with 2.83 or 4.28 mM anionic surfactant solution and then mixed at 750 rpm. The heat released or absorbed after each injection during titration was directly measured by the ITC unit, which produced the raw heat signal. Integration of each peak of the raw data provided the differential enthalpy curve for the titration.
2.3. Challenge Test
Microorganisms’ strains and growth conditions were described previously [27]. Challenge tests for preservative efficacy in formulations were performed according to the ISO 11930 regulation. Specifically, the antimicrobial and antifungal efficacy of the preservative system were evaluated in an anionic shampoo formulation. Samples were inoculated separately with Escherichia coli (ATCC 8739) and Candida albicans (ATCC 10231), at a final concentration of 106 and 105 CFU/mL, respectively. Samples were incubated in the dark at 22 °C for 28 days. The preservative efficacy was determined by sampling 1 g from the formulation at each time-point to enumerate the viable microorganisms.
3. Results and Discussion
Cationic preservative molecules and anionic surfactants, used in the cosmetic industry, have a variety of structures. The authors chose to initially focus on DDAC, which is a highly effective antimicrobial quaternary ammonium-based molecule and may be used in cosmetic preservative solutions [28]. In addition, DDAC was used as a molecular model representing a cationic surfactant which is relatively easy to analyze. In aqueous medium, surfactant’s self-aggregation can be detected via conductivity measurements. A representative plot of electric conductivity profile of DDAC is given in Figure 1.
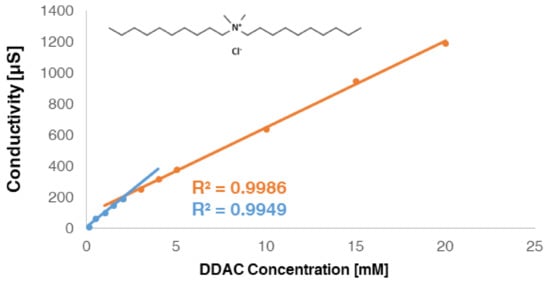
Figure 1.
The electric conductivity of DDAC solution concentration, showing linear fits below (blue) and above (orange) the inflexion extrapolated point, which is the CMC.
The conductivity linearly increased as the concentration of DDAC increased until a break point was observed. Above this point, conductivity still linearly increased with concentration but with a lower slope. The abrupt change, which corresponded to the surfactant CMC, was extensively studied and was reported to be due to different degree of ionization of surfactants below and above the CMC [29,30,31].
Below the CMC, ionic surfactants dissociated completely into their ions, while above this concentration, aggregates were formed, ionic dissociation weakened as micelles were partially ionized and the overall charged molecules’ mobility was decreased [29,30,31,32].
The CMC value for DDAC was found to be ~2 mM, which is in reasonable agreement with the literature [33].
Similar plots were obtained in all other surfactants’ cases (not shown).
3.1. DDAC and Anionic Species—Conductivity
The interactions of DDAC with various kinds of anionic species, typically used in cosmetics, were examined. These anionic surfactants were chosen since they have different molecular structures and charge characteristics, as illustrated in Table 1.
The molecular interactions between cationic and anionic species were investigated by monitoring the conductivity of a 1:1 molar ratio of DDAC:anionic surfactant. It was found that for each mixture of cationic:anionic molecules, the ‘measured conductance’ deviated from the sum of conductivities of the individual ions in solution (termed as the ‘theoretical conductance’).
Figure 2 shows the ‘measured to theoretical conductivity ratio’ for each DDAC:anionic surfactant pair at the concentration range of 0.75–10 mM (at 25 °C). In general, increasing the concentration of the molecules increased the ‘measured to theoretical conductivity ratio’ of the mixtures. At 10 mM of each charged molecule, which was the highest concentration, the majority of the ‘measured to theoretical conductivity ratio’ values exceeded 100%. The conductance behavior of the combined cationic and anionic molecules was expected to differ from the sum of the single component solution’s once molecular interactions between the oppositely charged molecules took place. The stronger the molecular interactions are, the larger the deviation is expected to be.
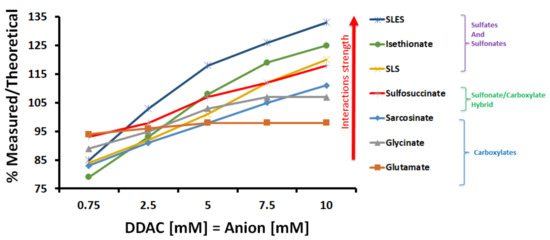
Figure 2.
‘Measured to theoretical conductivity ratio’ for each DDAC:anionic surfactant pair (1:1 molar ratio) at the concentration range of 0.75–10 mM (at 25 °C).
From the interpretation of these results, it is apparent that the individual mixtures exhibited different conductivity behavior that could be divided into two main trends, as seen in Figure 2. Mixtures of DDAC and anionic molecules having sulfate or sulfonate functional groups exhibited conductivity profiles with higher slopes compared to DDAC-carboxylate ones. At the highest concentration of 10 mM for each surfactant, when DDAC was mixed with SLS, isethionate, or SLES, the ‘measured to theoretical conductivity ratios’ were the highest and reached values of 120–135% (Figure 2). However, incorporating DDAC with either glutamate, glycinate or sarcosinate gave lower ‘measured to theoretical conductivity’ values of 95–110%.
It should be noted that mixtures of DDAC and nonionic molecules (e.g., dextran) were tested as controlled experiments and revealed that in the absence of potential ionic molecular interactions, the ‘measured to theoretical conductivity ratios’ were approximately 100%.
Hoffmann and Hao previously showed that excess of salt was formed when cationic and anionic surfactants were mixed, while their counterions were Br−, Cl−, and Na+, K+, NH4+, respectively [34]. In the current study, the contribution of the counterions Na+ and Cl− to the conductivity was tested and found to be approximately 90% of the total conductivity (Table 2). This means that the detected conductance values were mainly due to Na+ and Cl− dissociation.

Table 2.
Conductivity values of NaCl, the organic moieties of SLES and DDAC without contribution of Na+ and Cl−, and the two surfactants including the counterions.
Given the increment of the measured conductivity values compared to theoretical levels upon mixing the oppositely charged molecules (Table 2), it can be presumed that the formation of NaCl salt was responsible for the resulting higher conductance levels. When ionic molecular interactions occurred, ion pairing of the two charged headgroups would reduce area per headgroup and charges repellent phenomenon, and lead to higher dissociations of counterions; therefore, the conductivity would rise [34]. Stronger interactions would result in more counterions dissociations; hence, higher measured conductivities compared to theoretical values.
Conductimetric results from Table 2 indicated that the quaternary ammonium group strongly binds the highly electronegative sulfate or sulfonate headgroups, suppressing the binding of chloride and sodium, respectively. This results in higher levels of counterions dissociation, which caused higher ‘measured to theoretical conductivity values’. On the other hand, the less polar carboxylate headgroup forms weaker ionic interactions with the DDAC’s ammonium headgroup; hence, less dissociation of counterions occurs and, as a result, lower ‘measured to theoretical conductivity ratios’ are observed [35,36].
3.2. DDAC and Anionic Species—ITC
The molecular interactions between the cationic DDAC and opposite charged molecules were further detected by microcalorimetry. The raw calorimetric data for the titration of DDAC by a 0.1 M bicarbonate-carbonate buffer, neutral dextran, and anionic SLS solutions are shown in Figure 3A–C. The heat flow versus time profiles resulting from sequential injections of 2 μL aliquots of DDAC solution (20 mM) into a titration cell containing each solution were measured and are discussed below.
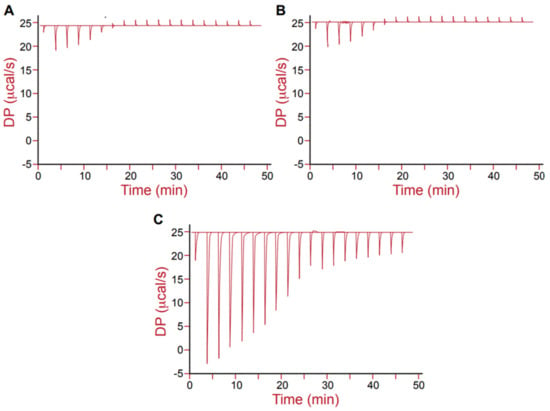
Figure 3.
Heat flow versus time profiles resulting from injection of 2 μL aliquots of DDAC (20 mM) into a 280 μL titration cell containing different aqueous solutions, from left to right: (A) 0.1 M carbonate/bicarbonate buffer; (B) 2.83 mM dextran and (C) 2.83 mM SLS.
The first two experiments (Figure 3A,B) showed exothermic peaks in the beginning of the injection and endothermic peaks in the following course. Titration of DDAC to a carbonate/bicarbonate buffer exhibited the lowest enthalpy changes, which can be attributed to micelle dissociation, since DDAC concentration in the injector was initially well above the CMC, while its concentration in the reaction cell was well below the CMC. The CMC of surfactant can be determined from the inflexion point of the ΔH versus surfactant concentration curves [19]. In this study, the CMC of DDAC was found to be ~1.8 mM, which is in accordance with a previous literature report [33].
The presence of 2.83 mM dextran in the reaction cell (Figure 3B) did not affect the enthalpy curves, compared to the control buffer sample in the reaction cell (Figure 3A). These findings are in agreement with the previous conductivity results, indicating that there were no additional interactions between the neutral polysaccharide and the cationic DDAC.
Titrating DDAC into 2.83 mM SLS in the reaction cell (Figure 3C) led to a substantial change in the enthalpic titration curve, even though the overall profile was comparable with the control. Higher enthalpy changes were observed when DDAC was incorporated within SLS, suggesting that molecular interactions occurred and can be detected using the ITC methodology. It is likely that the positive headgroups of the DDAC molecules were binding to the negative sulfate groups of the SLS molecules through electrostatic attraction.
The molecular interactions between the cationic DDAC and various opposite charged molecules were further detected by ITC. The integrated data of the enthalpy variation (ΔH) per mole of DDAC were plotted versus the DDAC/anionic surfactant molar ratio in the titration cell (Figure 4).
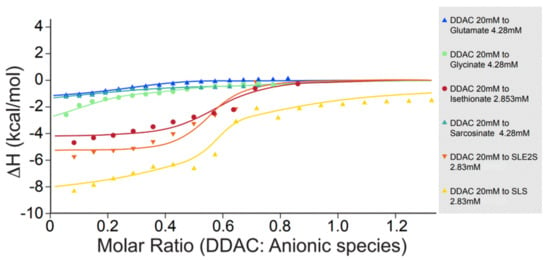
Figure 4.
Enthalpy variation per injection vs. DDAC/anionic surfactant molar ratio. DDAC was injected into the reaction cell containing different aqueous anionic solutions at 25 °C.
The enthalpy measurements in Figure 4 indicate a difference in the behavior of different types of anionic surfactants with DDAC. Anionic surfactants having sulfate and sulfonate groups demonstrate higher enthalpy changes when mixed with DDAC, compared with carboxylate-based surfactants.
The inflexion point of the sigmoidal titration curve can be translated into the molecular stoichiometry (n), and the slope yields the binding affinity (Ka) between DDAC and other anionic molecules [21]. Table 3 summarizes the thermodynamic parameters of the cationic-anionic binding process, including n, Ka, and ΔH for each functional group combination.

Table 3.
The thermodynamic parameters calculated from ITC data (presented in Figure 4) of the cationic-anionic binding process, including n, Ka, and ΔH for each functional group combination.
As depicted in Table 3, SLS, SLES, and isethionate bound larger amounts of DDAC molecules until saturation was reached. Each sulfate or sulfonate-based molecule attached to 0.6–0.7 of DDAC molecule (~3 sulfate/sulfonate molecules bind 2 molecules of DDAC). On the other hand, to each carboxylate-based molecule, only ~0.1 of DDAC molecule was bound (~10 carboxylate molecules interact with one DDAC molecule). Additionally, the enthalpy variation (ΔH) per mole of DDAC was 2–3 folds higher in the case of sulfate or sulfonate headgroups compared to carboxylate, where the interactions seemed considerably weaker (less than ~2 kcal/mol). Furthermore, the affinity of DDAC to SLS, SLES, and isethionate was ten folds larger than its affinity to glutamate, glycinate or sarcosinate.
The differences in total charge between headgroups of SO4, SO3, and CO2 can be an important factor in understanding headgroup interactions. The charge distribution in the anionic surfactant molecule may provide insight into the variation of electrostatic interactions with the cationic molecule [37]. The charge distribution in common ionic surfactant molecules on their headgroup, α-CH2 and alkyl chain, was previously estimated by P.D.T. Huibers, using quantum-chemical methods [38]. It was found that SO4 headgroup had more negative charges that distributed towards α-CH2 than that of SO3, which is itself considerably higher than that of CO2 [38]. Consequently, the electrostatic interactions of SO4 or SO3 headgroups and the quaternary ammonium were significantly stronger than CO2, as was observed by conductivity and ITC measurements.
3.3. SLES and Cationic Preservatives—Conductivity
In order to widen this study, molecular interactions between SLES and additional cationic preservatives molecules were examined using conductimetry. The choice of SLES was based on the fact that this sulfate-based compound displayed the strongest interactions with DDAC—both by conductimetry and ITC (vide supra).
Figure 5 shows the ‘measured to theoretical conductivity ratio’ for each SLES:cationic preservative mix (1:1 molar ratio) at the concentration range of 0.75–10 mM. Higher ‘measured to theoretical conductivity ratios’ were observed when SLES was blended with either DDAC or ELA. However, mixing SLES with CLC, M-78, or P-80 led to lower measured to theoretical ratios. Consequently, it would seem that SLES had stronger interactions with DDAC or ELA rather than CLC, M-78, or P-80.
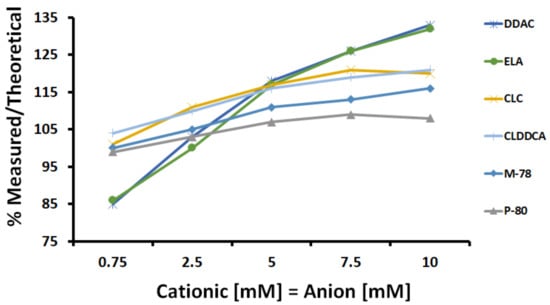
Figure 5.
The ‘measured to theoretical conductivity ratio’ for each SLES:cationic preservative mix (1:1 molar ratio) at the concentration range of 0.75–10 mM (at 25 °C).
The various tested cationic molecules differed in their structural configuration (Table 1) and molecular weight, which both may impact the binding possibilities and complexes formation, e.g., monomers versus clusters [16,39].
The nature of interactions as well as structural configurations of the diverse molecules can be further investigated and characterized. At this point, the authors focused on the ability to distinguish between molecular interactions of common anionic species and cationic antimicrobials in cosmetic formulations.
3.4. Heat Maps
The degree of ionic interactions between cationic and anionic species is summarized in the heat maps depicted in Figure 6A,B, based on conductivity and ITC experiments, respectively. Conductivity measurements were evaluated as the ‘measured to theoretical ratios’ (at 10 mM of each ingredient) and were converted into a heat map according to the scale shown in the figure.
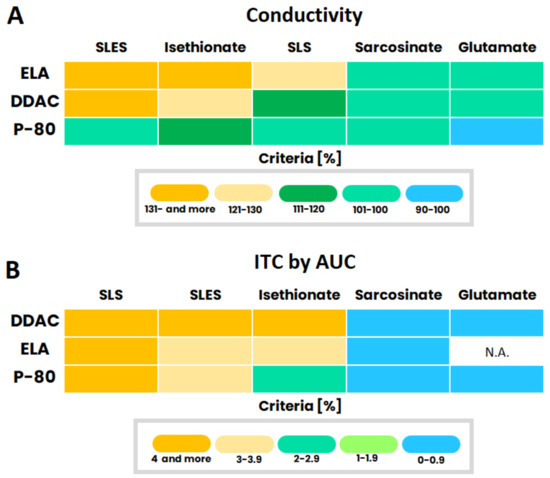
Figure 6.
Heat maps summarizing the degree of ionic interactions between cationic and anionic species based on conductivity (A); and ITC (B).
ITC data, including all three parameters (n, ΔH, Ka), were taken into consideration by calculating the area under the curve (AUC). One should bear in mind that the two techniques differed in the tested molar ratio of the compounds. In conductivity measurements, the components molar ratio was constant (1:1), while in ITC, the ratio of compounds was dynamic. The cationic solution was titrated into the anionic one, meaning that at initial stages, the ratio of cationic antimicrobial to anionic species mimics a typical cosmetic formulation. Additional titration increases cationic molar presence up to an equivalent ratio between cationic and anionic compounds. Furthermore, not all ingredients were examined above their CMC, since molecular concentrations were limited by a rapid phase separation in the case of conductimetry and saturation when ITC was used.
Even though there are differences between the two techniques and their measurements’ conditions, the outcome guidance for compatible and incompatible ionic pairs based on both tools is almost equivalent with the exception of P-80 and sulfate-base molecules blends. The ionic interaction level dependency on the anionic surfactant polar headgroup was clearly observed in both heat maps for each cationic molecule. Once again, anionic molecules with a sulfate or sulfonate headgroup exhibited strong ionic interactions, symbolized by warmer colors. On the other hand, anionic molecules with a carboxylate headgroup showed weak interactions, as symbolized by cold colors.
3.5. Microbiological Correlation by Challenge Test
The following challenge tests included two types of microorganisms out of the five pharmacopeia strains, a Gram-negative bacteria (E. coli) and a Yeast (C. albicans) [40]. These challenge tests, shown in Table 4, examined the antimicrobial efficacy of the cationic preservative surfactant (0.5% of the total final formulation) within the designated cosmetic anionic shampoo, containing anionic surfactants.

Table 4.
Challenge tests of 0.5% preservative mixtures containing DDAC or P-80 in anionic shampoo cosmetic formulation containing SLES or glutamate, respectively.
Two pairs of anionic and cationic surfactants were selected, SLES–DDAC and Glutamate-P80, representing the strongest and weakest interactions. SLES-DDAC pair did not exhibit any significant reduction in E. coli and did not pass the EP nor the USP criteria for cosmetic challenge assay. On the contrary, the Glutamate-P-80 mixture resulted with maximum microorganism’s reduction, both in E. coli and in C. albicans. These challenge results passed both EP and USP criteria [41].
4. Conclusions
Our study demonstrated that the general overstatement claiming that anionic species and cationic preservative elements are not compatible in a cosmetic formulation environment is indeed markedly erroneous. Thus, it was shown that the family of anionic species can be subdivided in two groups: sulfates/sulfonates on one hand, displaying strong interactions with cationic surfactants, and carboxylates on the other hand, displaying weak interactions with cationic surfactants.
Two methodologies were used to explore these anionic/cationic interactions from qualitative and quantitative perspectives: conductivity was successfully utilized to determine the degree of binding between cationic surfactants and anionic cosmetics species. ‘Measured to theoretical conductivity ratios’ showed significant differences depending on the nature of the ionic headgroups.
Isothermal titration calorimetry (ITC) reinforced the conductivity outcomes and was shown to provide valuable information about molecular interactions. The technique was able to quantify enthalpy variations associated with micelles formation and electrostatic bindings and, thus, distinguish between weak and strong molecular interactions. The enthalpy variations’ profiles highlighted that different phenomena occurred in the cationic-anionic solutions depending on the charged headgroup.
Moreover, an adaptation of the microbiological challenge test correlated well with the physico-chemical methods’ results by confirming that the degree of molecular interactions affected the antimicrobial abilities of the tested cationic antimicrobial molecules. Strong ionic interactions of sulfate-based molecule and DDAC led to decreased preservation performance, while weak ionic interactions between carboxylate-based molecule and P-80 did not detract from the cationic antimicrobial activity, resulting in an excellent performance. Hence, the ability to identify the degree of ionic interaction can have a significant contribution for the application of cationic preservative molecules as an antimicrobial ingredient in cosmetic and other industrial applications.
Author Contributions
Conceptualization, I.Y. and I.T.; methodology, I.Y., I.T. and P.S.; software, I.T.; validation, I.Y., I.T. and P.S.; formal analysis, I.Y.; investigation, I.T.; resources, P.S.; data curation, I.T.; writing—original draft preparation, I.Y.; writing—review and editing, P.S. and I.T.; visualization, P.S.; supervision, P.S.; project administration, I.T.; funding acquisition, P.S. All authors have read and agreed to the published version of the manuscript.
Funding
This research was funded by the Israeli Innovation Authority, grant number 70161.
Institutional Review Board Statement
Not applicable.
Informed Consent Statement
Not applicable.
Data Availability Statement
Not applicable.
Acknowledgments
We are thankful to Noa Ziklo for the fruitful discussions which led to a better manuscript. Our appreciation goes also to Orel Shem-Tov, Laila Boursha, and Inna Minazov from the Department of Chemical Engineering at Shenkar College (Tel Aviv, Israel) for their technical support during their internship at Sharon Personal Care.
Conflicts of Interest
The authors declare no conflict of interest. The funders had no role in the design of the study; in the collection, analyses, or interpretation of data; in the writing of the manuscript, or in the decision to publish the results.
References
- Gubitosa, J.; Rizzi, V.; Fini, P.; Cosma, P. Hair Care Cosmetics: From Traditional Shampoo to Solid Clay and Herbal Shampoo, A Review. Cosmetics 2019, 6, 13. [Google Scholar] [CrossRef]
- Cornwell, P.A. A review of shampoo surfactant technology: Consumer benefits, raw materials and recent developments. Int. J. Cosmet. Sci. 2018, 40, 16–30. [Google Scholar] [CrossRef]
- Filipović-Vinceković, N.; Bujan, M.; Dragčević, D.; Nekić, N. Phase behavior in mixtures of cationic and anionic surfactants in aqueous solutions. Colloid Polym. Sci. 1995, 273, 182–188. [Google Scholar] [CrossRef]
- Boglioni, P. Surfactants in Solution; Mittal, K.L., Bothorel, P., Eds.; Plenum: New York, NY, USA, 1987; Volume 4, p. 393. [Google Scholar]
- Herrington, K.L.; Kaler, E.W.; Miller, D.D.; Zasadzinski, J.A.; Chiruvolu, S. Phase behavior of aqueous mixtures of dodecyltrimethylammonium bromide (DTAB) and sodium dodecyl sulfate (SDS). J. Phys. Chem. 1993, 97, 13792–13802. [Google Scholar] [CrossRef]
- Matsuki, H.; Aratono, M.; Kaneshina, S.; Motomura, K. Extremely Strong Interaction of Sodium Decyl Sulfate and Decyltrimethylammonium Bromide in Molecular Aggregates. J. Colloid Interface Sci. 1997, 191, 120–130. [Google Scholar] [CrossRef] [PubMed]
- Halle, B.; Landgren, M.; Jönsson, B. The shape of ionic micelles. J. Phys. Fr. 1988, 49, 235–1259. [Google Scholar] [CrossRef]
- Sachin, K.M.; Karpe, S.A.; Singh, M.; Bhattarai, A. An Interaction of Anionic- and Cationic-Rich Mixed Surfactants in Aqueous Medium through Physicochemical Properties at Three Different Temperatures. J. Chem. 2018, 2018, 4594062. [Google Scholar] [CrossRef]
- Xu, X.; Chow, P.; Quek, C.; Hng, H.; Gan, L. Nanoparticles of polystyrene latexes by semicontinuous microemulsion polymerization using mixed surfactants. J. Nanosci. Nanotechnol. 2003, 3, 235–240. [Google Scholar] [CrossRef]
- Li, P.; Ma, K.; Thomas, R.K.; Penfold, J. Analysis of the asymmetric synergy in the adsorption of zwitterionic−ionic surfactant mixtures at the air−water interface below and above the critical micelle concentration. J. Phys. Chem. B 2016, 120, 3677–3691. [Google Scholar] [CrossRef]
- Pal, A.; Pillania, A. Thermodynamic and aggregation properties of aqueous dodecyltrimethylammonium bromide in the presence of hydrophilic ionic liquid 1,2-dimethyl-3-octylimidazolium chloride. J. Mol. Liq. 2015, 212, 818–824. [Google Scholar] [CrossRef]
- Wang, R.; Li, Y.; Li, Y. Interaction between cationic and anionic surfactants: Detergency and foaming properties of mixed systems. J. Surfactants Deterg. 2014, 17, 881–888. [Google Scholar] [CrossRef]
- Sharma, K.; Chauhan, S. Effect of biologically active amino acids on the surface activity and micellar properties of industrially important ionic surfactants. Colloids Surf A Physicochem. Eng. Asp. 2014, 453, 78–85. [Google Scholar] [CrossRef]
- Tiwari, A.K.; Saha, S.K. Study on mixed micelles cationic gemini surfactants having hydroxyl groups in the spacers with conventional cationic surfactants: Effects of spacer and hydrocarbon tail length. Ind. Eng. Chem. Res. 2013, 52, 5895–5905. [Google Scholar]
- Sohrabi, B.; Gharibi, H.; Tajik, B.; Javadian, S.; Hashemianzadeh, M. Molecular interactions of cationic and anionic surfactants in mixed monolayers and aggregates. J. Phys. Chem. B 2008, 112, 14869–14876. [Google Scholar] [CrossRef]
- Bonnaud, M.; Weiss, J.; Mcclements, D.J. Interaction of a Food-Grade Cationic Surfactant (Lauric Arginate) with Food-Grade Biopolymers (Pectin, Carrageenan, Xanthan, Alginate, Dextran, and Chitosan). J. Agric. Food Chem. 2010, 58, 9770–9777. [Google Scholar] [CrossRef]
- Benford, D.; Harrison, R.; Larsen, J.; DiNovi, M. Safety Evaluation of Certain Food Additives: Ethyl Lauroyl Arginate; World Health Organization: Geneva, Switzerland, 2009; pp. 30–85. [Google Scholar]
- Dai, Y.M.; Normand, M.D.; Weiss, J.; Peleg, M. Modeling the efficacy of triplet antimicrobial combinations: Yeast suppression by lauric arginate, cinnamic acid, and sodium benzoate or potassium sorbate as a case study. J. Food Prot. 2010, 73, 515–523. [Google Scholar] [CrossRef] [PubMed]
- Boonsongrit, Y.; Mueller, B.W.; Mitrevej, A. Characterization of drug–chitosan interaction by 1 H NMR, FTIR and isothermal titration calorimetry. Eur. J. Pharm. Biopharm. 2008, 69, 388–395. [Google Scholar] [CrossRef]
- Pierce, M.M.; Raman, C.S.; Nall, B.T. Isothermal Titration Calorimetry of Protein–Protein Interactions. Methods 1999, 19, 213–221. [Google Scholar] [CrossRef]
- Callies, O.; Daranas, A.H. Application of isothermal titration calorimetry as a tool to study natural product interactions. Nat. Prod. Rep. 2016, 33, 881–904. [Google Scholar] [CrossRef]
- Wang, C.; Tam, K.C. Interactions between Poly(acrylic acid) and Sodium Dodecyl Sulfate: Isothermal Titration Calorimetric and Surfactant Ion-Selective Electrode Studies. J. Phys. Chem. B 2005, 109, 5156–5161. [Google Scholar] [CrossRef]
- Benrraou, M.; Bales, B.L.; Zana, R. Effect of the Nature of the Counterion on the Properties of Anionic Surfactants. 1. Cmc, Ionization Degree at the Cmc and Aggregation Number of Micelles of Sodium, Cesium, Tetramethylammonium, Tetraethylammonium, Tetrapropylammonium, and Tetrabutylammonium Dodecyl Sulfates. J. Phys. Chem. B 2003, 107, 13432–13440. [Google Scholar] [CrossRef]
- Hirata, H.; Hattori, N.; Ishida, M.; Okabayashi, H.; Frusaka, M.; Zanas, R. Small-Angle Neutron-Scattering Study of Bis(quaternary ammonium bromide) Surfactant Micelles in Water. Effect of the Spacer Chain Length on Micellar Structure. J. Phys. Chem. 1995, 99, 17778–17784. [Google Scholar] [CrossRef]
- Khan, M.N.; Sarwar, A. Study of dye–surfactant interaction: Aggregation and dissolution of yellowish in N-dodecyl pyridinum chloride. Fluid Phase Equilib. 2006, 239, 166–171. [Google Scholar] [CrossRef]
- Tunc, S.; Duman, O. Investigation of interactions between some anionic dyes and cationic surfactants by conductometric method. Fluid Phase Equilib. 2007, 251, 1–7. [Google Scholar] [CrossRef]
- Ziklo, N.; Tzafrir, I.; Shulkin, R.; Salama, P. Salicylate UV-Filters in Sunscreen Formulations Compromise the Preservative System Efficacy against Pseudomonas aeruginosa and Burkholderia cepacia. Cosmetics 2020, 7, 63. [Google Scholar] [CrossRef]
- Salama, P.; Gliksberg, A. The Use of Catalytic Amounts of Selected Cationic Surfactants in the Design of New Synergistic Preservative Solutions. Cosmetics 2021, 8, 54. [Google Scholar] [CrossRef]
- Domínguez, A.; Fernández, A.; González, N.; Iglesias, E.; Montenegro, L. Determination of Critical Micelle Concentration of Some Surfactants by Three Techniques. J. Chem. Educ. 1997, 74, 1227–1231. [Google Scholar] [CrossRef]
- Cookey, G.A.; Nwokobia, F.U. Conductivity Studies of Binary Mixtures of Ionic and Non-ionic Surfactants at different Temperatures and Concentrations. J. Appl. Sci. Environ. Mana. 2014, 18, 530–534. [Google Scholar] [CrossRef]
- López-Díaz, D.; Velázquez, M.M. Variation of the critical micelle concentration with surfactant structure: A simple method to analyze the role of the attractive-repulsive forces on the micellar association. J. Chem. Educ. 2007, 7, 327–330. [Google Scholar]
- Tyowua, A.T.; Yiase, S.G.; Wuanna, R.A. Manipulation of Concentration-Conductivity Data of Sodium Dodecyl Sulphate and Sodium Dodecylbenzene Sulphonate in KCl Solution in Relation to Micellisation Parameters. J. Chem. Sci. 2012, 79, 3–8. [Google Scholar] [CrossRef]
- Park, E.-J.; Seong, E.; Kang, M.-S.; Lee, G.-H.; Kim, D.-W.; Han, J.-S.; Lim, H.-J.; Lee, S.H.; Hanf, H.-Y. Formation of lamellar body-like structure may be an initiator of didecyldimethylammonium chloride-induced toxic response. Toxicol. Appl. Pharmacol. 2020, 404, 115182–115196. [Google Scholar] [CrossRef]
- Hao, J.; Hoffmann, H. Self-assembled structures in excess and salt-free catanionic surfactant solutions. Curr. Opin. Colloid Interface Sci. 2004, 9, 279–293. [Google Scholar] [CrossRef]
- Mukhim, T.; Dey, J.; Das, S.; Ismail, K. Aggregation and adsorption behavior of cetylpyridinium chloride in aqueous sodium salicylate and sodium benzoate solutions. J. Colloid Interface Sci. 2010, 350, 511–515. [Google Scholar] [CrossRef] [PubMed]
- Srinivasan, V.; Blankschtein, D. Effect of Counterion Binding on Micellar Solution Behavior: 2. Prediction of Micellar Solution Properties of Ionic Surfactant−Electrolyte Systems. Langmuir 2003, 19, 9946–9961. [Google Scholar] [CrossRef]
- Yan, P.; Xiao, J.X. Polymer–surfactant interaction: Differences between alkyl sulfate and alkyl sulfonate. Colloids Surf. A Physicochem. Eng. Asp. 2004, 244, 39–44. [Google Scholar] [CrossRef]
- Huibers, P.D.T. Quantum-Chemical Calculations of the Charge Distribution in Ionic Surfactants. Langmuir 1999, 15, 7546–7550. [Google Scholar] [CrossRef]
- Weers, J.G.; Rathman, J.F.; Axe, F.U.; Crichlow, C.A.; Foland, L.D.; Scheuing, D.R.; Wiersema, R.J.; Zielske, A.G. Effect of the Intramolecular Charge Separation Distance on the Solution Properties of Betaines and Sulfobetaines. Langmuir 1991, 7, 854–867. [Google Scholar] [CrossRef]
- Russell, A.D. Challenge testing: Principles and practice. Int. J. Cosmet. Sci. 2003, 25, 147–153. [Google Scholar] [CrossRef]
- Connolly, P.; Bloomfield, S.F.; Denyerl, S.P. The use of impedance for preservative efficacy testing of pharmaceuticals and cosmetic products. J. Appl. Bacteriol. 1994, 76, 68–74. [Google Scholar] [CrossRef]
Disclaimer/Publisher’s Note: The statements, opinions and data contained in all publications are solely those of the individual author(s) and contributor(s) and not of MDPI and/or the editor(s). MDPI and/or the editor(s) disclaim responsibility for any injury to people or property resulting from any ideas, methods, instructions or products referred to in the content. |
© 2023 by the authors. Licensee MDPI, Basel, Switzerland. This article is an open access article distributed under the terms and conditions of the Creative Commons Attribution (CC BY) license (https://creativecommons.org/licenses/by/4.0/).


