Article

Supply Risk Considerations for the Elements in Nickel-Based Superalloys

1
Resource Lab, University of Augsburg, Universitaetsstr. 16, 86159 Augsburg, Germany
2
Max Planck Institute for Plasma Physics, Boltzmannstraße 2, 85748 Garching, Germany
3
Fritz Haber Institute of the Max Planck Society, Faradayweg 4-6, 14195 Berlin, Germany
*
Author to whom correspondence should be addressed.
Resources 2020, 9(9), 106; https://doi.org/10.3390/resources9090106
Submission received: 20 July 2020 / Revised: 20 August 2020 / Accepted: 26 August 2020 / Published: 31 August 2020

Abstract

:
Nickel-based superalloys contain various elements which are added in order to make the alloys more resistant to thermal and mechanical stress and to the adverse operating environments in jet engines. In particular, higher combustion temperatures in the gas turbine are important, since they result in higher fuel efficiency and thus in lower CO2 emissions. In this paper, a semi-quantitative assessment scheme is used to evaluate the relative supply risks associated with elements contained in various Ni-based superalloys: aluminium, titanium, chromium, iron, cobalt, niobium, molybdenum, ruthenium, tantalum, tungsten, and rhenium. Twelve indicators on the elemental level and four aggregation methods are applied in order to obtain the supply risk at the alloy level. The supply risks for the elements rhenium, molybdenum and cobalt are found to be the highest. For three of the aggregation schemes, the spread in supply risk values for the different alloy types (as characterized by chemical composition and the endurance temperature) is generally narrow. The fourth, namely the cost-share’ aggregation scheme, gives rise to a broader distribution of supply risk values. This is mainly due to the introduction of rhenium as a component starting with second-generation single crystal alloys. The resulting higher supply risk appears, however, to be acceptable for jet engine applications due to the higher temperatures these alloys can endure.

Graphical Abstract

1. Introduction

Single crystal nickel-based superalloys are state of the art materials for the hot sections of high-pressure turbines that contain the blades, vanes, shrouds and nozzles. They not only withstand the high temperatures generated by fuel combustion in a jet engine, but also endure the extreme mechanical stress. They are also resistant to corrosion [1]. To achieve this result, Ni-based superalloys can contain up to 15 alloying elements, including Al, Ti, Cr, Fe, Co, Nb, Mo, Ru, Ta, W, and Re, often in small quantities. The role of each element depends on the overall composition. As described in detail by Darolia [2], the elements can be added in order to (i) reinforce the solid solution-strengthened gamma ( γ ) matrix, (ii) form and strengthen the cuboid-shaped gamma prime ( γ ) precipitates, (iii) form a protective scale and provide for its adhesion, (iv) avoid topologically close-packed phases, (v) minimise the density increase or (vi) increase oxidation resistance and hot-corrosion resistance. The book by Reed [3] provides an overview of the history and properties of superalloys. In general, Ni-based superalloys can be classified into wrought, cast, power-processed, directionally solidified, and single-crystal superalloys; the latter can be further divided into six consecutively numbered “generations” [4]. The casting of aircraft turbine blades consisting of alloy single crystals may be seen as an outstanding achievement of materials technology [5].
The global demand for superalloys is dominated by the aviation industry. Further applications are in gas turbines for power generation and ship turbines [6], but it is the growth of the aviation industry that determines the overall demand. The manufacturer Airbus announced in 2019 that it expects a demand for 39,000 new aircraft over the next two decades, thus doubling the global fleet size from 23,000 to 48,000 aircraft for passenger and freight transport [7]. Although passenger travel activity has dropped sharply in 2020 due to the COVID-19 pandemic, a long-term recovery and a return to rapid growth in the aviation industry are expected.
An aircraft usually has two to four engines, for which the main requirements are thrust, reliability, low noise generation and high fuel efficiency. The turbine is driven by the energy transfer from the hot compressed gases to the rotating blades, after re-direction through static nozzle guide vanes [6]. In particular, the high-pressure turbine blades are mostly single-crystal superalloys, with complicated geometries allowing for continuous cooling of the blades during operation. There is currently no suitable substitute for superalloys in this function, although they may be replaced at some time in the future by ceramic matrix composites, which are expected to be able to endure even higher temperatures [8,9].
A significant property of superalloys is their ability to withstand “creep” which is an irreversible deformation of the alloy occurring after prolonged exposure to heat and mechanical strain. The key material performance parameter for this property is the so-called “endurance”, or “creep life” temperature. The latter is the highest temperature at which the alloy can endure creep testing under specified conditions of temperature and pressure. The creep life temperature has increased by about 25–30 °C in each single-crystal generation [2,10]. The majority of single-crystal superalloys at present in use belong to the second and third generations, which are capable of enduring around 1000 °C [2]. Turbine entry temperatures may well be even higher than the endurance temperatures of the blade materials, as a result of special coatings and continuous cooling of the blades. Thanks to the decades-long development of superalloys, in particular at companies like General Electric, Pratt & Whitney, and Rolls-Royce, turbines operate today at substantially higher turbine entry temperatures of about 1500 °C and therefore higher thermodynamic efficiencies and reduced fuel consumption than a few decades ago [5,11,12]. Roughly speaking, a 30 °C higher engine temperature can increase the efficiency of a jet turbine by up to 0.5%, with the potential to reduce fuel costs by about 20,000 USD per year per engine [6]. Higher engine temperatures played an important role in reducing average fuel burn in new aircraft by 45% from 1968 to 2014 [13]. New commercial jet aircraft in the 1970s used to have an average fuel burn of more than 40 g per passenger-km. In the 2010s, the fuel burn, which is directly linked to greenhouse gas emissions, has been reduced to about 26 grams fuel per passenger-km. Despite these achievements, the aviation industry is still at risk of falling behind its own fuel efficiency goals [13].
Despite their even higher endurance temperature, the steps to the fourth, fifth and sixth generations have not been taken, or perhaps, have not yet been taken. According to Schafrik [14] and Pollock [15], this reluctance on the part of turbine design engineers is due to the perception that metals of very low abundance in the Earth’s crust such as rhenium, will soon become more difficult to extract and, as a result, noticeably depleted, with concomitant steep price rises. Rhenium, for example, is mostly recovered as a by-product from molybdenum concentrates obtained in turn from copper porphyry deposits. Its crustal abundance is estimated to lie between 0.2 and 2 ppb [16]. Apart from superalloys the other major use of Re is as a component of bimetallic petroleum-reforming platinum catalysts. Following actual price increases for rhenium of up to a factor five in the first decade of this century (see Millensiffer et al. [16] for a figure showing this curve), turbine manufacturers began to take notice. One of the measures taken by General Electric, for example, has been the development of a new low-Re superalloy René N515 [15] with considerably less rhenium (1.2%wt Re) and with similar mechanical properties to the second generation René N5 [2]. The response of GE to perceived shortages of rhenium by minimizing the amount of critical metals in superalloys was described by Griffin and colleagues [17] as an example of successful company-level management strategies for combating raw material criticality. General Electric’s researchers have reported several times on the strategy of the corporation concerning critical raw materials, in particular rhenium, in reports and scientific articles [18,19,20]. Superalloy producer Cannon-Muskegon has also introduced new alloys containing low Re or even no Re [21], whereas Pratt & Whitney appear to have a secure Re supply with long-term delivery contracts [22]. Darolia [2] also stresses the poor environmental properties and higher densities of the fourth to sixth-generation alloys, which in addition to the higher costs, are additional reasons for their rejection by turbine designers. For aerospace applications, weight is critical to fuel consumption and therefore dense alloys are also a disadvantage, in particular for the rapidly rotating blades.
The present paper deals with semi-quantitative estimates of the comparative supply risks associated with superalloys, whereby one aspect, namely the rhenium component, is of particular interest. Despite a possibly increased future use of recycled material, an increase in demand for rhenium would have a strong effect on the market price. Considerations of supply risks and, in a broader sense, raw material criticality on a technology-level have previously been assessed, for example, for thin-film photovoltaic cells [23,24], lithium-ion battery materials [25], steel [23], the Ni-based second generation single-crystal superalloy CMSX-4 [26], or bulk metallic glasses [27]. The supply risks associated with superalloys are compared based on the average chemical composition of various Ni-based superalloy types. These are the, mostly older, polycrystalline alloy types, “wrought”, “powder-processed”, “conventionally cast” and “directionally solidified”, as well as six generations of single-crystal alloys and a group of newly developed low Re-containing single-crystal alloys. The next section describes the characteristics of the superalloy types in terms of the constituent elements, the contribution of these metals to the raw material costs of the alloy, and the endurance temperatures of superalloys. The method section briefly summarizes the supply risk approach used for technology-level assessments. The results and discussions section shows the supply risk scores on the elemental level (compared with raw material prices) and their aggregation to give the final scores at the alloy level (compared with endurance temperatures). The article ends with some brief conclusions.

2. Characteristics of Ni-Based Superalloy Types

Before commencing with the supply risk analysis, it is instructive to look briefly at the list of alloying elements and to note their function and properties. The selection of the superalloy types for the assessment in the present paper results in a list of eleven alloying elements in addition to Ni itself: Al, Ti, Cr, Fe, Co, Nb, Mo, Ru, Ta, W, and Re. Elements with lower concentrations, normally less than 0.5%wt, are not considered. All 11 of the above alloying elements are added either to strengthen the γ matrix or to promote the formation of, and strengthen, the γ ′ precipitates [2]. Al and Cr provide resistance to corrosion by forming a protective oxide layer. Re and Ru improve creep properties. Ru also has a positive effect on the high temperature rupture strength. The list of these observations is long [2], but in some instances the addition of certain elements can also have a concentration-dependent adversary effect.
Figure 1 shows the average density of superalloy types and their average chemical composition, as a compilation of the literature data. The values are averages for each of the eleven superalloy types, based on up to seven representative alloys already discussed in reviews on superalloy materials [2,3,4,10,28,29]. The sixth generation of single-crystal alloys is an exception, because the alloy called TMS-238 is the only of this type. The chemical compositions as well as the densities for the individual alloys can be found in the Supplementary Material (Table S1).
In all superalloy types considered here, nickel makes up more than half of the weight. The wrought alloy Inconel 718 is the only nickel-iron-based superalloy in the selection. Consequently, iron and niobium only appear in the average for wrought superalloys. Rhenium and ruthenium were introduced in the second and fourth generations, respectively, of single-crystal superalloys. Typical second-generation single-crystal alloys contain about 3%wt rhenium. This concentration was subsequently increased to about 6%wt in the third generation. The fourth generation is characterized by small additions of Ru which were increased in the fifth generation to about 5%wt. For the sixth generation a further optimization of ingredients took place, in particular to provide increased oxidation resistance [30]. The material content for Al, Co, Ta, and W is rather stable over time. Ti, and Mo are only used in small quantities. The chromium content of average superalloy types decreased throughout the single-crystal generations, but, more recently, has increased again in the sixth-generation alloy TMS-238 and in the new, low Re-containing superalloys.
Densities of superalloys range from 8.2 to 9.2 grams per cubic centimeter. There has been a progressive shift to denser materials in each single-crystal generation. On the other hand, the development of the new, low Re-containing alloys has had the effect of reducing the density [2]. The Supplementary Material (Table S4) gives an overview of the superalloys used to calculate the average composition for each type of superalloy and of the data sources for mass-share and density.
Figure 2 shows as a histogram (scale on the left) the specific raw material costs of the superalloy types per unit volume of superalloy. For this diagram, the mass content of each (average) alloy from Figure 1 is multiplied by the specific material costs of each element. Raw material prices are averaged for the year 2015 from trading-day specific market data [31,32] and are listed in the Supplementary Material (Table S5) as well as later in Figure 3. The raw material costs of the wrought, powder-processed, conventionally cast and directionally solidified alloy types are largely determined by the nickel values. The total raw material price, for example for wrought alloys, is therefore comparatively low at about 100 USD per liter of volume. While nickel is still the main component in terms of mass for the single-crystal superalloys, it is responsible for only a small share of the material costs. Starting with the second generation single-crystal alloys, rhenium raw material prices are the main factor in the alloy material costs. Considering single-crystal superalloys of the second and third generations, rhenium gives rise to the third highest material costs (after nickel and ruthenium) in the whole jet engine, including the fans, compressors, combustors and low-pressure turbines. The addition of ruthenium, starting with the fourth generation, has further increased the specific material costs. TMS-238 in the sixth generation has 60% of its raw material costs determined by rhenium and 30% by ruthenium, with all elements in total costing about 2400 USD per liter. All the other elements contained within make up less than 10% of the total raw material costs of the superalloy. However, single crystal superalloys of the fourth generation and beyond have so far not been used in commercial aircraft. Instead, there has been a considerable research effort in newly developed low-Re superalloys [33], which also do not contain ruthenium. Figure 2 shows that material costs are lower than for the second or third single-crystal generation, but the alloys cannot compete with the thermal endurance of the fourth to sixth generations.
A typical high-pressure single-crystal turbine blade of the second or third generation contains about 15 g of rhenium and weighs in total about 300 g. In a Rolls-Royce Trent XWB jet engine, there are 68 such single-crystal turbine blades. A single-crystal blade is operational in a jet engine for approximately 25,000 h before overhaul [1]. Therefore, about 20 kg of Ni-based single-crystal components are contained in such an engine and need to be replaced at least once throughout the lifetime of the aircraft. Given the raw material prices of 2015, this adds up to up to 3000 USD raw material value for the Ni-based single crystal superalloys in each jet engine if, e.g., a third-generation alloy is used for the turbine blades. There are likely to be more superalloys used in the engine for vanes and nozzles; these are exposed to the same thermal and environmental stress as the blades, but less mechanical stress. For example, Pratt & Whitney’s new engine family, the PW1000G, is estimated to contain in total over 5 kg of rhenium, which sums up to raw material costs of 12,000 USD per engine [34].
Figure 2 additionally shows the gradually increasing average creep life temperatures which the various alloy types can endure (data points, scale on the right) [2]. “Creep life” tests can be carried out for different mechanical stress (higher stress leads to lower creep life temperature), for different durations (longer time leads to lower creep life temperature) or at different creep tolerance levels (higher creep tolerance leads to higher creep life temperature). The figure shows the average of the estimated maximum creep life temperature for which the superalloy shows a maximum of 1% deformation (“creep”) after a 1000 h test duration and 137 MPa mechanical stress as a compilation of the literature data. The focus on these latter conditions enables an easier comparison of alloy types; in the literature there appears to be no set of standard conditions for performing such tests.

3. Supply Risk Assessment Method

The evaluation method used in this article to assess the supply risks associated with Ni-based single-crystal superalloys follows the approach presented in detail in previous articles by the authors [24,25]. The present description of the methodology thus focusses on the essential features of the evaluation method and the decisions to be made that are specific to the case of the assessment of superalloys. The method is based on the Augsburg method of criticality assessment [35], but with a small modification concerning the sector competition index [36], which has recently been introduced. Firstly, it evaluates the relative supply risk of twelve elements contained in various Ni-based superalloys (Al, Ti, Cr, Fe, Co, Ni, Nb, Mo, Ru, Ta, W, and Re). Secondly, it goes on to sum the supply risk “scores” at the alloy level for the various types of superalloy developed over the past few decades (wrought, powder-processed, conventionally cast, and directionally-solidified alloys; first to fifth generation single-crystal, TMS-238 as the only sixth-generation single-crystal, and low-Re single-crystal alloys). Excluded from the evaluation are alloying elements usually present in the superalloys with a mass-share of less than 0.5%wt, such as B, C, Y, Zr, or Hf. Even these minor constituents may be important for the material properties [2], but their influence on the supply risk assessment would be negligible (see also Section 4.5).
The relative supply risk for the elements is divided into four categories: (i) risk of supply reduction, (ii) risk of demand increase, (iii) market concentration risk and (iv) political risk. The risk categories each contain two to four indicators. The Supplementary Material (Table S2) contains more details of each indicator as well as its application and normalization onto a common scale of 0 (lowest supply risk) to 100 (highest supply risk). These “final” numbers are to be interpreted as relative supply risk scores, i.e., they are only to be compared with other supply risk scores derived in the context of this article. They are not estimates of the absolute likelihood of supply being unable to meet demand within a specific risk scenario.
The weighting of the twelve indicators differs from previous articles [24,25] insofar as each category is weighted with 25% of the total score, and all indicators within one category are weighted equally. Therefore, each of the four indicators in the category “demand increase risk” determines 6.3% of the final supply risk score of each element, and each of the two indicators in the category “market concentration risk” is weighted with 12.5%. We refrained from carrying out a sector-specific analytic hierarchy process similar to that carried out in previous studies, because those results showed that essentially the same conclusions would have been drawn, if equal weighting of the indicators had been applied [24,25]. Table 1 gives an overview of the twelve supply risk indicators used in the evaluation and their respective weightings.
The second step of the assessment determines the supply risk score on the alloy level, i.e., for each of the superalloy types, by aggregating the results for the individual elements. The results are displayed using the four different possibilities for aggregation: the simple arithmetic mean (Equation (1)), the arithmetic mean with mass-share weighting (Equation (2)), the arithmetic mean with cost-share weighting (Equation (3)) and the “maximum” approach (Equation (4)). For the simple arithmetic mean, each element has the same weighting in the calculation. Mass-share weighting considers each element according to the contribution of its mass; cost-share weighting considers both its mass and the raw material costs. The maximum method considers only the element with the highest supply risk score.
S R m e a n = i A l l o y S R i i A l l o y   1
S R m a s s = i m i S R i
S R c o s t = i p i m i S R i
S R m a x = max i A l l o y S R i
This supply risk assessment scheme is applied with the ultimate aim of comparing the results on the alloy level with the key technical performance parameter for superalloys, namely, the endurance temperature. Given comparable density, similar environmental properties and roughly the same prices, alloy types have a competitive advantage if they can endure higher temperatures at similar supply risks, or if they show similar endurance temperatures at substantially lower levels of supply risk. If, however, higher endurance temperatures come at the cost of higher levels of supply risk, a trade-off situation pertains, and further discussion is required.

4. Results and Discussions

4.1. Supply Risk Data

As explained in the previous section, the supply risk assessment starts with the determination of the values for all twelve indicators for each of the twelve metals under consideration. With the exception of Co, Ru, and Re (see below), the metals are mined in their own right, not as by-products. Mining production is often reported in terms of the tonnage of the corresponding mineral or ore: Al is mined as bauxite, Ti as ilmenite or rutile, and Fe as iron ore. Table 2 gives a summary of the indicator values, or supply risk scores, in the units as calculated. More details can be found in the Supplementary Material (Table S2).
The static reach of the reserves of the twelve elements ranges from values of 35 years for tungsten and 36 years for nickel to about a thousand years for ruthenium. Nickel also has the lowest value for the static reach of the resources with 60 years. Cobalt has values of over 1000 years. Nb, Ru, and Ta have values of at least 200 years without a specific figure being given for the quantity of the resources [38]. Static reaches are interpreted as a measure of the market pressure for further mineral prospecting and subsequent mining activity [25]. End-of-life recycling input rates are highest for tungsten with 37%, and lowest for tantalum with only 1% [39].
Among the twelve elements evaluated, future technology demand is expected to be particularly important for Re, Ta, and Co. It is expected that there will be 150%, 120%, and 90% additional demand, respectively, for these three metals from future technologies in 2035, compared to production in 2013 [40]. For Al, Cr, Fe, Ni, Mo, and W, there is no additional demand expected from rapidly expanding future technologies. Re and Ru are only produced as by-products [41]. Rhenium is derived mainly as a by-product in molybdenum mining, with the company MolyMet in Chile being the main producer. Ruthenium is a platinum group metal and can only be separated in refiners for platinum or palladium. Al, Ti, Cr, Fe, Ni, and W are almost entirely main mining products. Sector competition is less of an issue for the metals contained in the superalloys. Rhenium has the highest value with 48 points, because it is also a component of a reforming catalyst used in the petrochemical industry. Lowest sector competition values are observed for Cr, Nb, and Fe with 20–24 points [36]. These are metals which are used mainly in the steel and steel alloying industry with a comparatively lower added value for each use. So-called substitutability is mostly an issue for Re, Cr, and Mo, for which there are hardly any other possible materials. For Ta, Nb, and Al, in contrast, substitutes are available; they are characterised by values of less than 50 points [42].
Market concentration is measured at the company level as well as at the national level. On the Herfindahl–Hirschman-Index (HHI) scale ranging from 0 to 10,000 [43,44], the country-based concentration of production is low for Ti and Ni with values below HHI 1500. The highest country concentrations are obtained for Nb, Ru and W with values above HHI 6000. Niobium is mainly produced in Brazil, ruthenium in South Africa and tungsten in China [38]. W and Nb also have the highest company concentrations with HHI values above 6000 [45]. Low company concentrations are observed for Ni, Ti, and Ru [45].
Political risk is determined by an evaluation of political stability in producing countries according to three distinct categories: stability, the perception of policy towards mining and the possibility of stronger regulation. The producing countries for all twelve metals are, on average, estimated as rather unstable with negative values of the “Political Stability and Absence of Violence/Terrorism” (WGI-PV) indicator of the Worldwide Governance Indicators [46]. Particularly, the high share of production of Co and Ta in the Democratic Republic of Congo is of concern. Cobalt and tantalum are also the metals with the lowest values on the Policy Perception Index. In contrast, the high share of production in Chile results in a high Policy Perception Index of 73 points for rhenium [47]. The producing countries have the highest Human Development Index for rhenium with 0.84 and nickel with 0.81. Tantalum-producing countries can be considered least “developed” with an average value of only 0.53 [48].

4.2. Normalization and Weighting

As described above, the next step is to normalize the values of each indicator to a common scale and then to apply the weighting of the indicators. The supply risk scores for the twelve indicators for each of the twelve elements following normalization are shown in Figure 3 (values are also given in Table S2 in the Supplementary Material). High values (up to 100) indicate a high supply risk. The highest average supply risk scores of the 12 elements are observed for the end-of-life recycling input rate (on average 85 points), the company concentration (77) and the country concentration (76). In contrast, future technology demand (10 points) and static reach of resources (18) have the lowest average supply risk scores. The spread of the supply risk scores is lowest for the risk emerging from policy perception (standard deviation of 7.5 points with a range of 26 points). The by-product dependence with 39 points standard deviation and scores ranging from 0 to 100 has the highest spread. The average supply risk score for all categories and all twelve elements is 54 points.

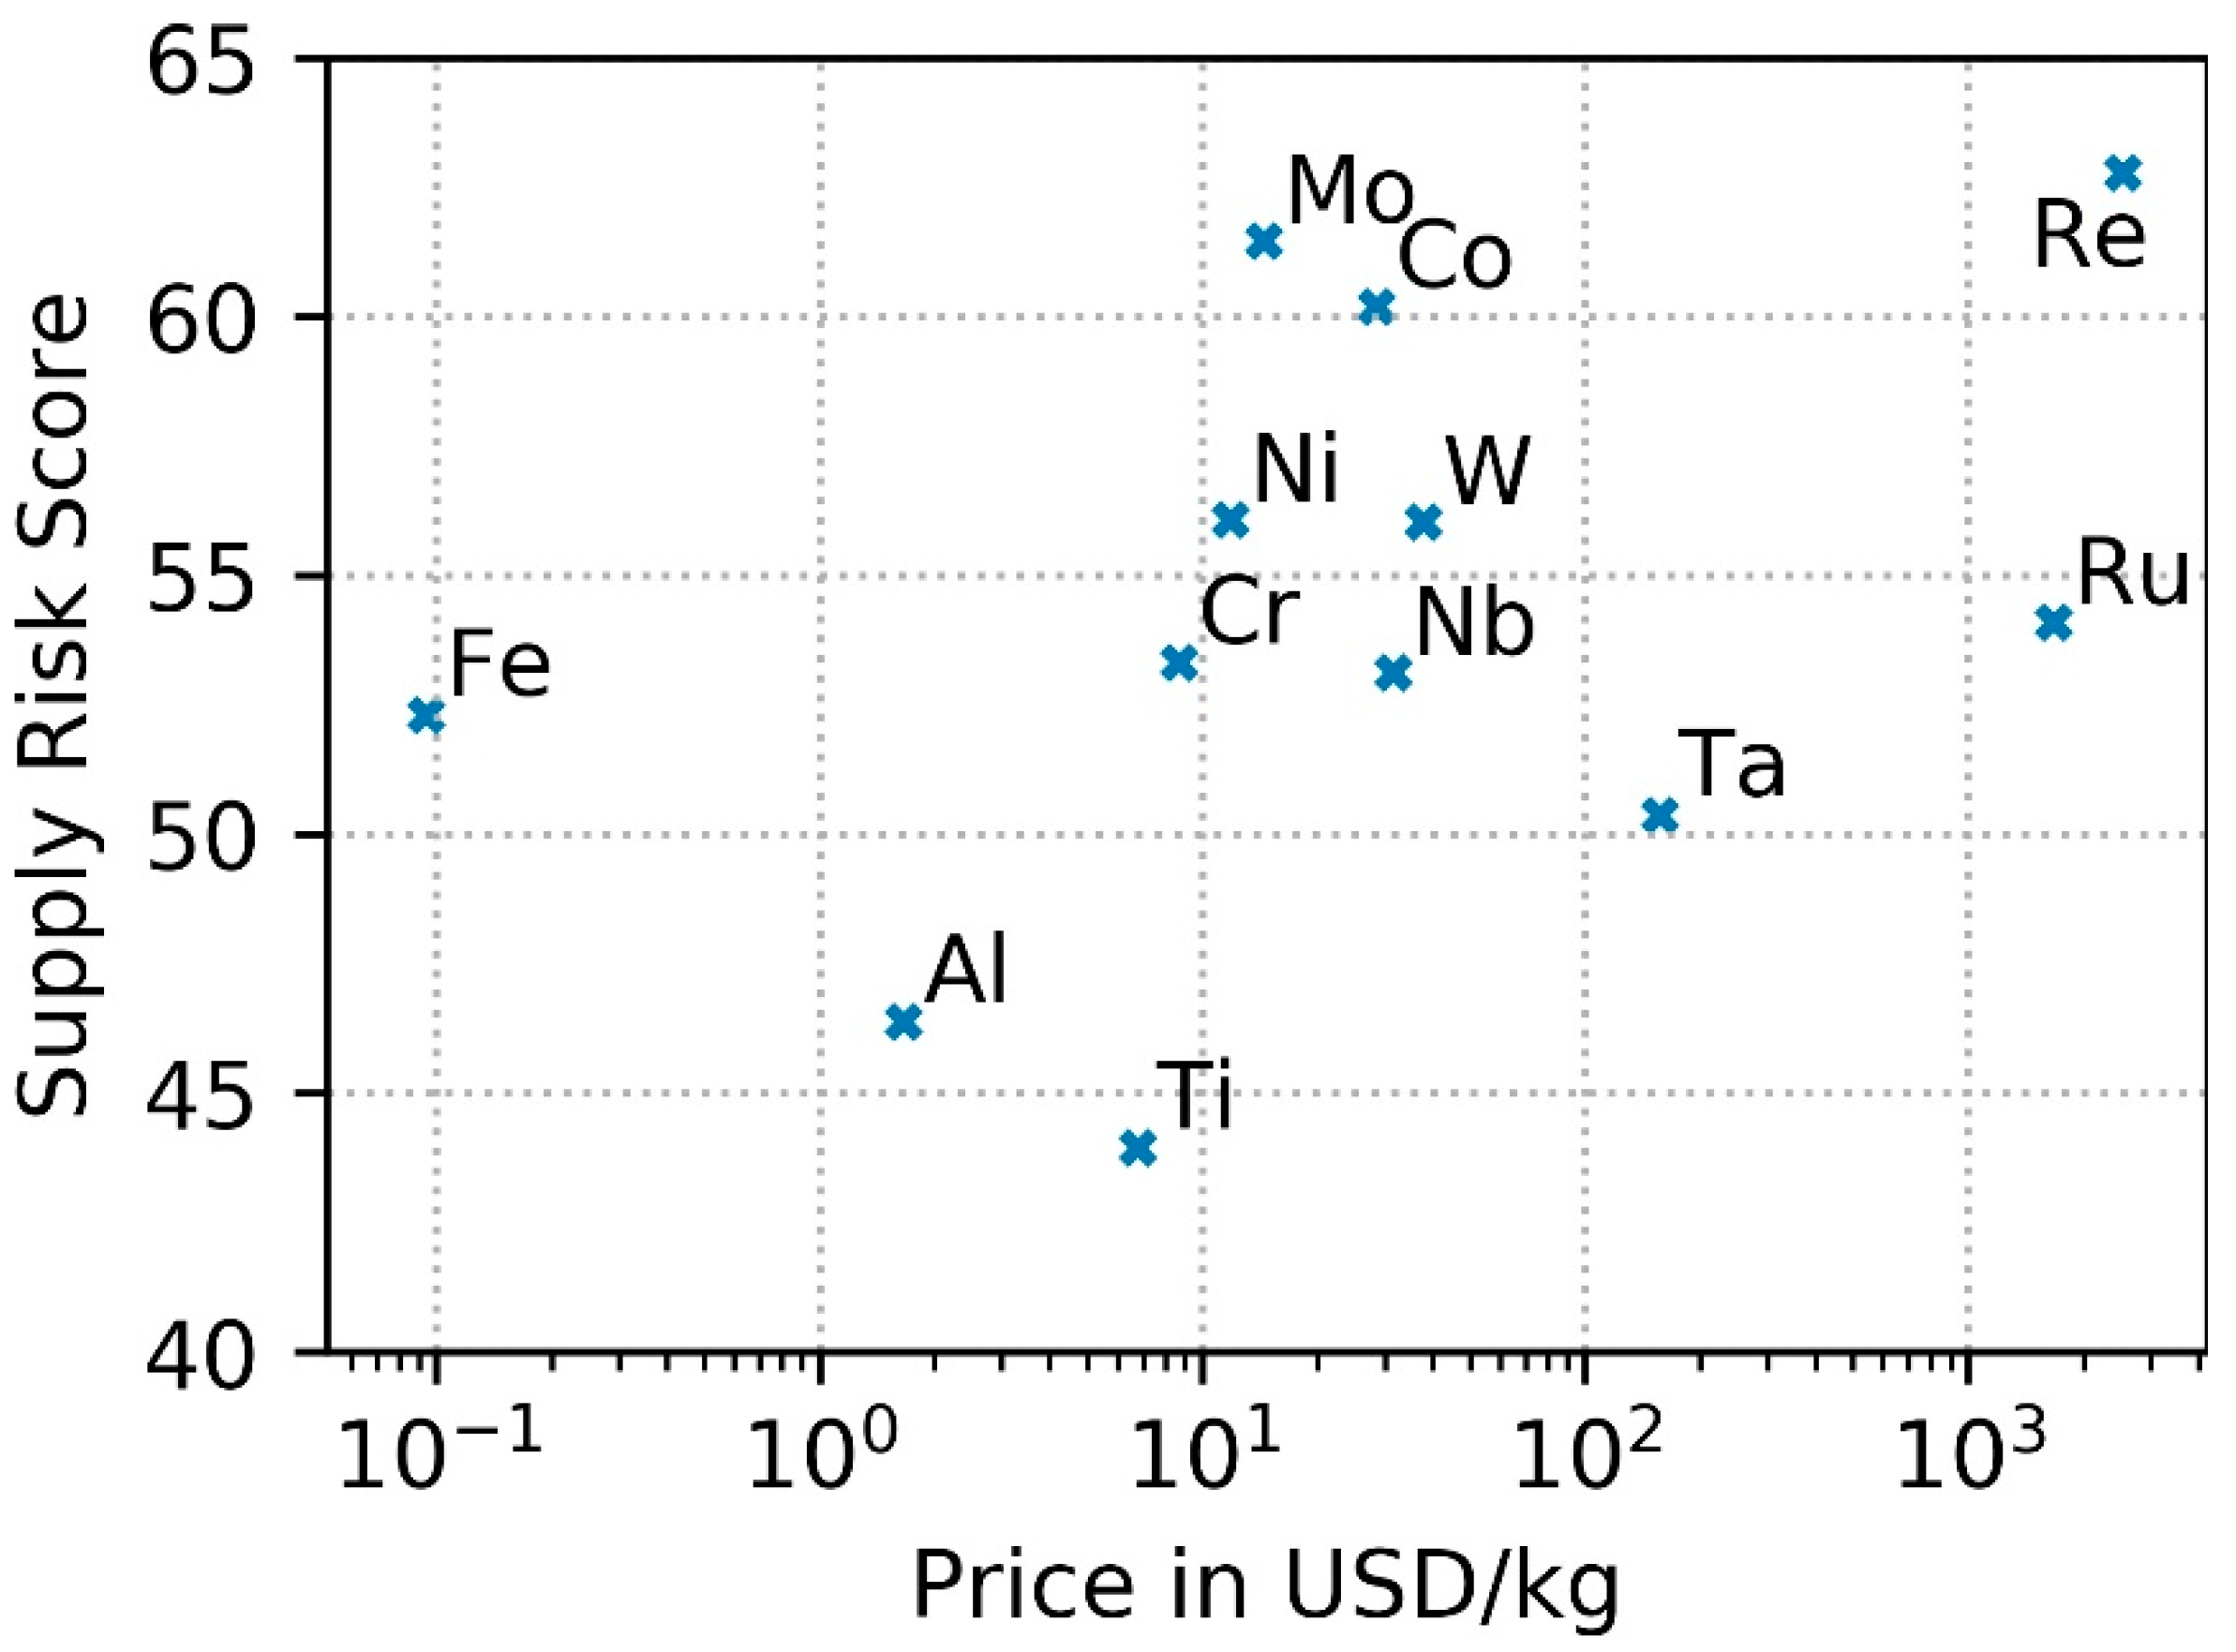
4.3. Supply Risk on the Elemental Level

Following normalization and weighting, the aggregation of the indicator values gives the relative supply risk scores for each of the twelve elements (Al, Ti, Cr, Fe, Co, Ni, Nb, Mo, Ru, Ta, W, and Re), as shown in Figure 4, where they are plotted against the raw material price. This semi-log plot allows us to check if the supply risks are already sufficiently taken into account by the commodity prices. This would be the case, if there was a high coefficient of determination (the R2 value) close to 1 in the statistical analysis of the linear trend between the logarithm of the price and the supply risk. From Figure 4 we note that rhenium (63 points), molybdenum (61), and cobalt (60) show the highest aggregated supply risks. In contrast, titanium (44) and aluminium (46) show the lowest supply risks. However, the spread in the aggregated supply risk values is only 20 points on a 0–100 scale for this set of twelve metals. This already tells us that the spread of the aggregated results on the alloy level cannot be larger than 20 points and will, most likely, be considerably narrower.
In addition, rhenium happens to be the metal both with the highest price and the highest supply risk. However, the R2 value of the linear trend calculated from these twelve elements is only 0.18 and, therefore, high supply risks do not necessarily result in high prices. This observation is important, however, because supply risk assessments are intended to be test cases for the likelihood of future supply disruption events, expressed in physical shortages or price increases (not current prices) [49,50].

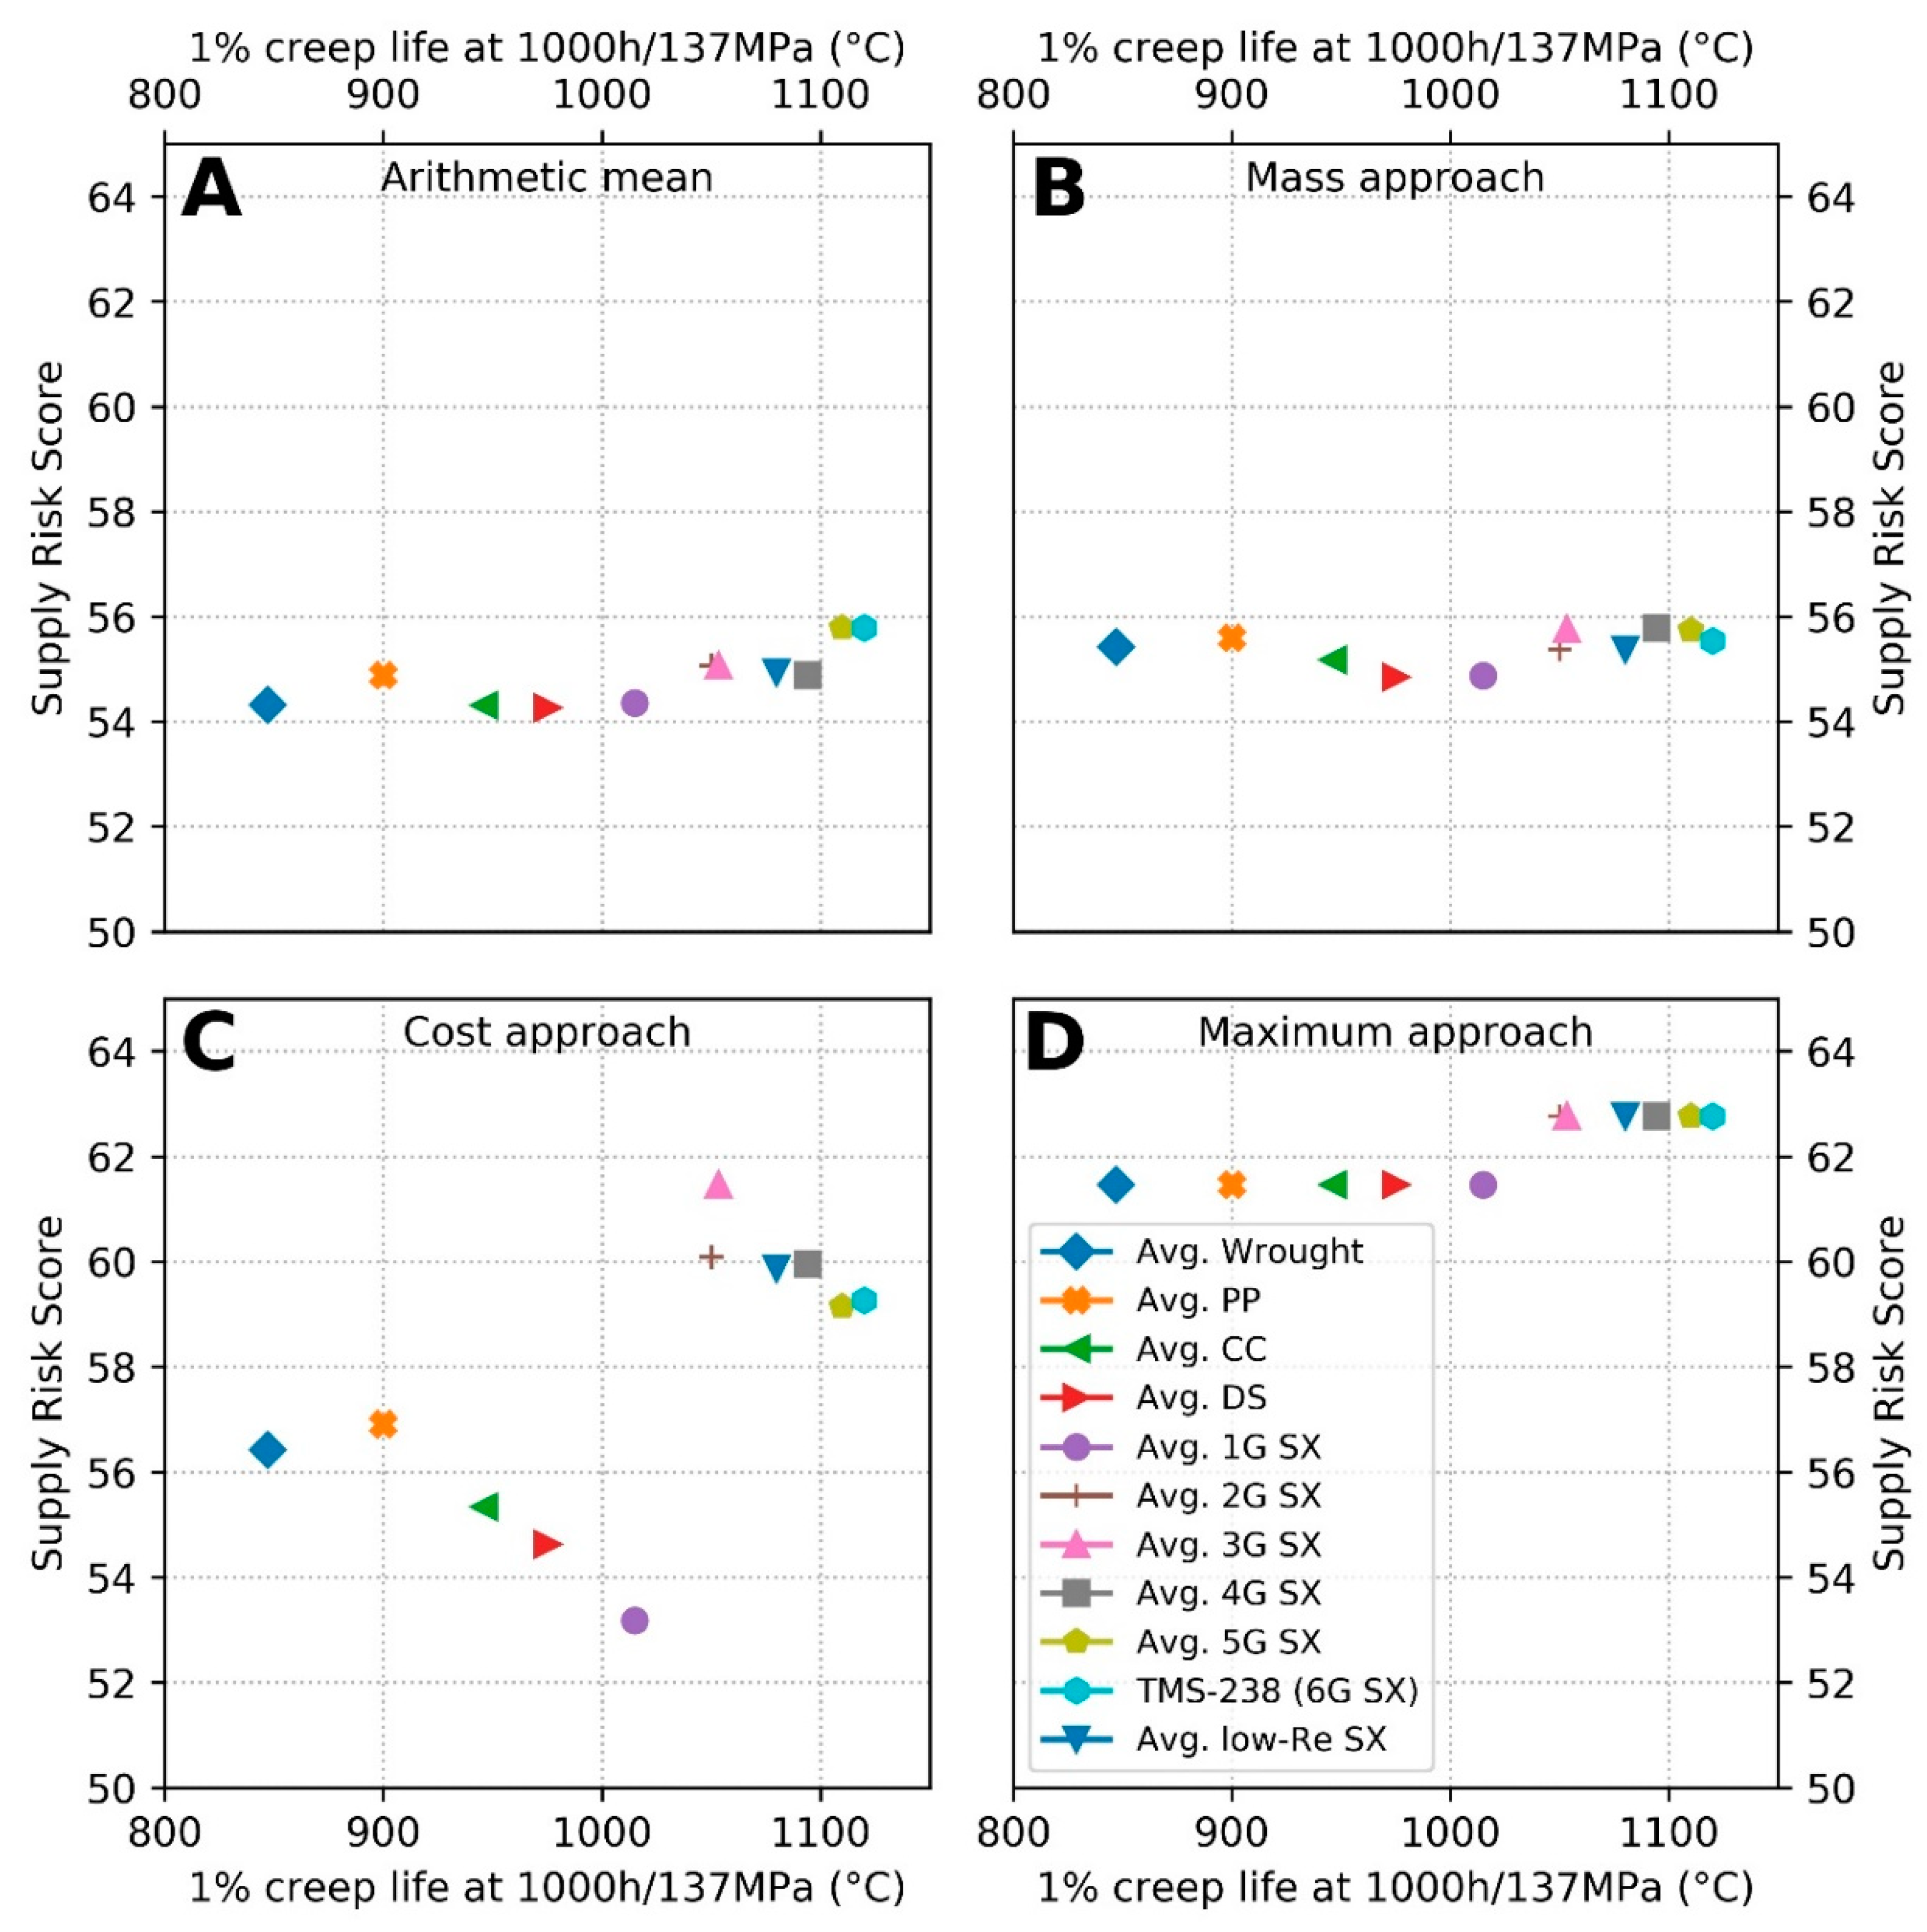
4.4. Supply Risk on the Alloy Level

In order to compare the results for different superalloys, supply risk scores on the elemental level need to be aggregated to give comparative supply risks on the alloy level (which we have previously also referred to as the “technology” level [24,25]). The results for the different superalloys and the four different aggregation methods in the present work are shown in Figure 5; the exact values of the supply risk scores can be found in Table S6 in the Supplementary Material. All four data sets are plotted against the average approximate 1% creep life temperature for 1000 h and 137 MPa (already introduced in Figure 2) to display the potential trade-off between the thermal properties of the alloy type and the supply risk.
In the case of the simple arithmetic mean (Figure 5A), for which case each element contained has the same weighting, the fifth and sixth single-crystal generations give the highest supply risks with 56 points. Wrought, cast and directionally solidified alloys as well as the Re-free first generation of single-crystal superalloys show a somewhat smaller supply risk of 54 points. The mass-share approach (Figure 5B) results in a strong contribution from the nickel supply risk, so that the differences between the different generations are even smaller with values of 55 or 56 points. Applying the “maximum” approach (Figure 5D) is not very helpful and, at the most, allows us only to differentiate between the Re-containing (63 points) and the Re-free superalloy types (61 points).
Compared to the thin-film photovoltaic and Li-ion battery materials [24,25,51], the spread in the supply risk scores for superalloys on the technology level is thus small, in particular for the aggregation schemes arithmetic mean, mass-share aggregation and maximum approach. The supply risk values for arithmetic mean and mass share schemes remain close to 55 points with little or no correlation with creep life. This results from the averaging over a large number of alloying elements with similar supply risk values (see Figure 4). Moreover, the list of alloying elements employed in each case (the chemical composition) does actually vary from alloy to alloy, but not strongly. Rhenium, for example, the element with the highest supply risk score, is contained in all alloy types from the second single-crystal generation onwards. As far as the arithmetic mean, mass-share and maximum approaches are concerned, there is no trade-off between creep life temperature and supply security for the alloy types.
On the other hand, the supply risk scores in the cost-share aggregation scheme (Figure 5C) have a substantially larger spread than in the other three schemes, namely 53 to 61 points, largely because of the difference in raw material costs for the alloy types (see Figure 2). (Note that the cost-based approach considers both the mass and the raw material price.) The contribution to raw material costs differs between the alloy types to a much larger extent and therefore the supply risk scores in the cost-share aggregation scheme at the technology level also have a substantially larger spread. The alloys of the single crystal third generation with supply risk scores of 61 points, have the highest supply risk. The lower supply risk for the similarly expensive ruthenium content in the fourth generation leads to a slightly reduced supply risks score of 60 points in this approach, despite a high rhenium content. The Re-free first generation single-crystal superalloys and the directionally solidified superalloys have only 53 and 55 points, respectively. Figure 5C shows that there are two groups of alloy type: The group up to the first single-crystal generation (which contained no rhenium) with lower supply risk in the cost-share aggregation, but also lower creep life temperatures, and all other Re-bearing single-crystal superalloys. Consequently, there is a trade-off between creep life and supply security in this specific perspective.
The results clearly show that the numerical supply risks at the technology level are indeed very similar for the different alloys on the basis of three of the four aggregation procedures. However, there may be factors, in this case raw material costs, which, because of their importance and the time period over which they are relevant, may deserve special attention within the aggregation scheme. From the methodological point of view, the result tells us that we should probably look more closely at the concept of “cost” and how it fits into a more general description of supply risk, as it is applied, for example, in the present paper. From the perspective of the airline or a jet engine manufacturer, the total costs of operation need to be considered. For aircraft and jet engines, the costs of operation are heavily determined by in-flight costs, i.e., fuel consumption. If, as demonstrated for Ni-based superalloys, the risk of cost increases for raw material supply is the main concern in terms of supply risks, then potential extra costs for supply need to be compared with savings potential during the operations phase. We have described above the potential for obtaining such savings from higher creep life temperatures. The higher supply risk score of Re-containing single-crystal superalloys therefore seems acceptable.
The fact that the cost-share perspective is a key factor for the evaluation of supply risks of Ni-based superalloy elements, stresses the importance of rhenium supply for the aviation industry. This includes management of rhenium supply risks throughout the supply chain from molybdenum mining to turbine producers. The industry is apparently aware of these Re supply risks [17], and mitigation strategies range from the development of low-Re superalloys, to recycling efforts, new separation technologies and long-term supply contracts. It should be noted that rhenium is traded mainly over-the-counter instead of on the free market [16]. Almost half of the annual production of about 50 metric tons comes from Chile where one supplier dominates. As we have seen from the indicators used above, there are several factors potentially contributing to supply risk, including the political situation in producer countries, international conflicts, the existence of monopolies or oligopolies, other high-tech applications of the element concerned and, also, “geochemical scarcity”. The latter concept covers the possible decline in ore grades, more difficult mining conditions and the increasing demand for energy and/or water. It is also sometimes referred to as “mineral depletion”. Generally speaking, mineral depletion is not (yet) a significant factor in the mining industry [52], although attention often focusses on the so-called static reach of the resources, i.e., the ratio of identified global resources to annual production rate.

4.5. Limitations

The use of the adjectives “relative” and “semi-quantitative” for the supply risk assessment scheme applied both here and in previous work [24,25] deserves comment. The numbers obtained on elemental and alloy level are relative supply risks scores and, therefore, should only be compared to scores obtained in this article. Consideration of the list of indicators in Table S2 of the Supplementary Material reveals that some lend themselves quickly and simply to a quantitative treatment. End-of-life recycling rate, substitutability and by-product dependence are cases in point. For other indicators, for example, those assessing market concentration and political risks, there is often no other alternative but to use risk assessments which have, at least in part, a strong subjective component. Hence, our emphasis on the word “semi-quantitative”.
When considering further “limitations” of the work, it is necessary not just to consider overarching, “global” problems, but also to look at those cases where the application of the model gives rise to specific difficulties. Firstly, we note that supply risk considerations in the present assessment are based on the elements actually contained in superalloy types, not those just used in the production of the alloys. The indicator data cover the three raw material production stages: mining, smelting and refining (if applicable). Further processing of intermediates or semi-finished products before the manufacturing of Ni-based superalloys is not considered. This is justified by the present focus on the material supply risks, rather than on general supply chain risk assessments [53]. Secondly, the assessment as shown does not cover potential supply risks for elements contained with less than 0.5%wt, such as boron, carbon, yttrium, zirconium or hafnium. These elements would only have small effect on the overall results, in particular when using the mass-share and cost-share aggregation schemes. Moreover, these elements may not always be contained in all of the individual alloys of one superalloy type. Thirdly, semi-quantitative indicator-based supply risk assessments depend on the selection and weighting of the indicators and on whether there is a dynamic assessment [54]. The indicator choice of supply risk has been discussed by Achzet and Helbig [55] and, more recently, for criticality assessments in general by Schrijvers and colleagues [50]. The indicators used here do not constitute a dynamic assessment, but rather a snapshot in time, or “static” assessment [56]. For example, while the static reaches extend at least a few decades into the future, they are calculated from the recent production rate and current estimations of reserves or resources. The data used by the indicator calculations used here are based on the year 2015, whenever available. Unfortunately, the data for the recycling rate and all four indicators in the category “Risk of demand Increase” are not available on an annual basis.

5. Conclusions

Using a previously developed semi-quantitative assessment scheme [24], we have evaluated the supply risks associated with elements contained in average Ni-based superalloy types. Based on the twelve indicators in four supply risk categories, rhenium, molybdenum and cobalt are found to have the highest supply risk scores, titanium and aluminium the lowest. In the aggregations for arithmetic mean, mass-share aggregation and maximum approach, the supply risk scores of the superalloy generations are very similar. Only in the cost-share approach do the single-crystal superalloys from the second generation onwards show a substantially higher supply risk than other alloy types, because of the increased share of rhenium (up to 6%wt). Despite having a reduced Re content, the new low-Re generation is still within the group of higher supply risk alloy types, showing a substantially higher supply risk than first-generation single-crystal or non-single-crystal alloy types.
We conclude, however, that the increased costs and the relatively small increases in the supply risk scores for fourth to sixth generation single crystal superalloys are not so high that these higher generations would not be used at all. Admittedly, the supply risks are higher in the cost-share approach, but alloy composition and the fuel consumption also need to be considered. The higher generations are particularly suited to reduce costs for airlines from fuel consumption. Therefore, in the case of Ni-based superalloys, managing the supply risks of rhenium is more important than avoiding those supply risks. On the company level, these management options include hedging, stockpiling, alternative suppliers, material substitution, material and technology development, and ongoing assessment of material supply risks [17].
Following thin-film photovoltaics and Li-ion battery materials [24,25] this has been the third application of the present supply risk assessment scheme to a potential supply problem in the “hightech” sector. Future applications should also review the choice of indicators, based on recent reviews of state-of-the art in criticality assessments [50] and on upcoming reviews of evidence-based supply risk indicators.

Supplementary Materials

The following are available online at https://www.mdpi.com/2079-9276/9/9/106/s1, Table S1: Alloys info, Table S2: Elements info, Table S3: Elements prices, Table S4: Chemical composition, Table S5: Cost contribution, Table S6: Supply risk alloys.

Author Contributions

Conceptualization, C.H. and A.M.B.; methodology, C.H. and A.T. (Andrea Thorenz); software, C.H.; formal analysis, C.H.; data curation, C.H.; writing—original draft preparation, C.H. and A.M.B.; writing—review and editing, A.T. (Andrea Thorenz) and A.T. (Axel Tuma); visualization, C.H.; supervision, A.T. (Andrea Thorenz) and A.T. (Axel Tuma). All authors have read and agreed to the published version of the manuscript.

Funding

This research received no external funding.

Acknowledgments

We thank Ralph Gilles, Surendra Kumar Makineni, Winfried Petry, Dierk Raabe und Joachim Rösler for very useful discussions on superalloys.

Conflicts of Interest

The authors declare no conflict of interest.

References

  1. Langston, L. Each blade a single crystal. Am. Sci. 2015, 103, 30. [Google Scholar] [CrossRef]
  2. Darolia, R. Development of strong, oxidation and corrosion resistant nickel-based superalloys: Critical review of challenges, progress and prospects. Int. Mater. Rev. 2019, 64, 355–380. [Google Scholar] [CrossRef]
  3. Reed, R.C. The Superalloys: Fundamentals and Applications; Cambridge University Press: Cambridge, UK, 2006; ISBN 9780521859042. [Google Scholar]
  4. Pollock, T.M.; Tin, S. Nickel-based superalloys for advanced turbine engines: Chemistry, microstructure, and properties. J. Propuls. Power 2006, 22, 361–374. [Google Scholar] [CrossRef]
  5. Langston, L.S. Single-crystal turbine blades earn ASME milestone status. Mach. Des. 2018, 90, 46–52. [Google Scholar]
  6. The Jet Engine; Rolls-Royce Plc: Manchester, UK, 2005.
  7. Airbus Airbus Forecasts Need for over 39,000 New Aircraft in the Next 20 Years. Available online: https://www.airbus.com/newsroom/press-releases/en/2019/09/airbus-forecasts-need-for-over-39000-new-aircraft-in-the-next-20-years.html (accessed on 12 February 2020).
  8. Schafrik, R.; Sprague, R. Superalloy technology—A perspective on critical innovations for turbine engines. Key Eng. Mater. 2008, 380, 113–134. [Google Scholar] [CrossRef] [Green Version]
  9. Steibel, J. Ceramic matrix composites taking flight at GE Aviation. Am. Ceram. Soc. Bull. 2019, 98, 30–33. [Google Scholar]
  10. Long, H.; Mao, S.; Liu, Y.; Zhang, Z.; Han, X. Microstructural and compositional design of Ni-based single crystalline superalloys―A review. J. Alloy. Compd. 2018, 743, 203–220. [Google Scholar] [CrossRef]
  11. Xu, L.; Bo, S.; Hongde, Y.; Lei, W. Evolution of rolls-royce air-cooled turbine blades and feature analysis. Procedia Eng. 2015, 99, 1482–1491. [Google Scholar] [CrossRef] [Green Version]
  12. Perepezko, J.H. The hotter the engine, the better. Science 2009, 326, 1068–1069. [Google Scholar] [CrossRef]
  13. Kharina, S.; Rutherford, D. Fuel Efficiency Trends for New Commercial Jet Aircraft: 1960 to 2014; International Council on Clean Transportation: Washington, DC, USA, 2015. [Google Scholar]
  14. Schafrik, R.E. Materials for a non-steady-state world. Metall. Mater. Trans. B 2016, 47, 1505–1515. [Google Scholar] [CrossRef] [Green Version]
  15. Pollock, T.M. Alloy design for aircraft engines. Nat. Mater. 2016, 15, 809–815. [Google Scholar] [CrossRef] [PubMed]
  16. Millensiffer, T.A.; Sinclair, D.; Jonasson, I.; Lipmann, A. Rhenium. In Critical Metals Handbook; Gunn, G., Ed.; John Wiley & Sons Ltd.: Hoboken, NJ, USA, 2014; pp. 340–360. [Google Scholar]
  17. Griffin, G.; Gaustad, G.; Badami, K. A framework for firm-level critical material supply management and mitigation. Resour. Policy 2019, 60, 262–276. [Google Scholar] [CrossRef] [Green Version]
  18. Ku, A.Y.; Loudis, J.; Duclos, S.J. The impact of technological innovation on critical materials risk dynamics. Sustain. Mater. Technol. 2018, 15, 19–26. [Google Scholar] [CrossRef]
  19. Ku, A.Y.; Hung, S. Manage Raw Material Supply Risks. Chem. Eng. Prog. 2014, 110, 28–35. [Google Scholar]
  20. Duclos, S.J.; Otto, J.P.; Konitzer, D.G. Design in an era of constrained resources: As global competition for materials strains the supply chain, companies must know where a shortage can hurt and then plan around it. Mech. Eng. 2010, 132, 36–40. [Google Scholar] [CrossRef] [Green Version]
  21. Wahl, J.B.; Harris, K. New single crystal superalloys, CMSX®-8 and CMSX®-7. Proc. ASME Turbo Expo 2014, 6, 179–188. [Google Scholar] [CrossRef] [Green Version]
  22. Lipmann, A. Pratt & Whitney/Molymet Write Largest Deal in Rhenium History. Available online: https://www.lipmann.co.uk/articles/metal-matters/pratt-whitney-molymet-write-largest-deal-in-rhenium-history/ (accessed on 12 February 2020).
  23. Graedel, T.E.; Nuss, P. Employing considerations of criticality in product design. JOM 2014, 66, 2360–2366. [Google Scholar] [CrossRef]
  24. Helbig, C.; Bradshaw, A.M.; Kolotzek, C.; Thorenz, A.; Tuma, A. Supply risks associated with CdTe and CIGS thin-film photovoltaics. Appl. Energy 2016, 178, 422–433. [Google Scholar] [CrossRef]
  25. Helbig, C.; Bradshaw, A.M.; Wietschel, L.; Thorenz, A.; Tuma, A. Supply risks associated with lithium-ion battery materials. J. Clean. Prod. 2018, 172, 274–286. [Google Scholar] [CrossRef]
  26. Goddin, J.R.J. Identifying supply chain risks for critical and strategic materials. In Critical Materials-Underlying Causes and Sustainable Mitigation Strategies; World Scientific Publishing Co. Pte. Ltd.: Singapore, 2019; pp. 117–150. [Google Scholar]
  27. Mota, R.M.O.; Graedel, T.E.; Pekarskaya, E.; Schroers, J. Criticality in bulk metallic glass constituent elements. JOM 2017, 69, 2156–2163. [Google Scholar] [CrossRef] [Green Version]
  28. Sato, A.; Harada, H.; Yeh, A.-C.; Kawagishi, K.; Kobayashi, T.; Koizumi, Y.; Yokokawa, T.; Zhang, J.-X. A 5th generation sc superalloy with balanced high temperature properties and processability. In Proceedings of the Superalloys 2008 (Eleventh International Symposium), Seven Springs, PA, USA, 14–18 September 2008; pp. 131–138. [Google Scholar]
  29. Caron, P.; Khan, T. Evolution of Ni-based superalloys for single crystal gas turbine blade applications. Aerosp. Sci. Technol. 1999, 3, 513–523. [Google Scholar] [CrossRef]
  30. Kawagishi, K.; Yeh, A.; Yokokawa, T.; Kobayashi, T.; Koizumi, Y.; Harada, H. Development of an oxidation-resistant high-strength sixth-generation single-crystal superalloy TMS-238. In Proceedings of the Superalloys 2012, Seven Springs, PA, USA, 9–13 September 2012; pp. 189–195. [Google Scholar]
  31. Bloomberg. Available online: www.bloomberg.com (accessed on 14 December 2019).
  32. Fastmarkets Metal Bulletin. Available online: www.metalbulletin.com (accessed on 14 December 2019).
  33. Fink, P.J.; Miller, J.L.; Konitzer, D.G. Rhenium reduction—Alloy design using an economically strategic element. JOM 2010, 62, 55–57. [Google Scholar] [CrossRef]
  34. Roskill Rhenium Outlook to 2029, 11th Edition. Available online: https://roskill.com/market-report/rhenium/ (accessed on 12 February 2020).
  35. Kolotzek, C.; Helbig, C.; Thorenz, A.; Reller, A.; Tuma, A. A company-oriented model for the assessment of raw material supply risks, environmental impact and social implications. J. Clean. Prod. 2018, 176, 566–580. [Google Scholar] [CrossRef]
  36. Helbig, C.; Kolotzek, C.; Thorenz, A.; Reller, A.; Tuma, A.; Schafnitzel, M.; Krohns, S. Benefits of resource strategy for sustainable materials research and development. Sustain. Mater. Technol. 2017, 12, 1–8. [Google Scholar] [CrossRef] [Green Version]
  37. Helbig, C. Metalle im Spannungsfeld technoökonomischen Handelns: Eine Bewertung der Versorgungsrisiken und der dissipativen Verluste mit Methoden der Industrial Ecology; Universität Augsburg: Augsburg, Germany, 2019. [Google Scholar]
  38. USGS. Mineral Commodity Summaries 2018; U.S. Geological Survey: Reston, VA, USA, 2018.
  39. Graedel, T.E.; Allwood, J.M.; Birat, J.-P.; Reck, B.K.; Sibley, S.F.; Sonnemann, G.; Buchert, M.; Hagelüken, C. Recycling Rates of Metals—A Status Report, A Report of the Working Group on the Global Metal Flows to the International Resource Panel; UNEP: Nairobi, Kenya, 2011. [Google Scholar]
  40. Marscheider-Weidemann, F.; Langkau, S.; Hummen, T.; Erdmann, L.; Tercero Espinoza, L.A.; Angerer, G.; Marwede, M.; Benecke, S. Rohstoffe für Zukunftstechnologien 2016; Deutsche Rohstoffagentur (DERA): Berlin, Germany, 2016. [Google Scholar]
  41. Nassar, N.T.; Graedel, T.E.; Harper, E.M. By-product metals are technologically essential but have problematic supply. Sci. Adv. 2015, 1, e1400180. [Google Scholar] [CrossRef] [PubMed] [Green Version]
  42. Graedel, T.E.; Harper, E.M.; Nassar, N.T.; Reck, B.K. On the materials basis of modern society. Proc. Natl. Acad. Sci. USA 2015, 112, 6295–6300. [Google Scholar] [CrossRef] [PubMed] [Green Version]
  43. Herfindahl, O.C. Concentration in the US Steel Industry; Columbia University: New York, NY, USA, 1950. [Google Scholar]
  44. Hirschman, A.O. National Power and the Structure of Foreign Trade; University of California Press: Berkeley, CA, USA, 1980; ISBN 9780520040823. [Google Scholar]
  45. Buchholz, P.; Huy, D.; Liedtke, M.; Schmidt, M. DERA-Rohstoffliste 2014; Deutsche Rohstoffagentur (DERA): Berlin, Germany, 2015. [Google Scholar]
  46. Kaufmann, D.; Kraay, A. Worldwide Governance Indicators. Available online: http://info.worldbank.org/governance/wgi/index.aspx (accessed on 1 December 2015).
  47. Jackson, T.; Green, K.P. Annual Survey of Mining Companies 2016; Fraser Institute: Vancouver, BC, Canada, 2017. [Google Scholar]
  48. UNDP. Human Development Report 2015; UNDP: New York, NY, USA, 2015. [Google Scholar]
  49. Frenzel, M.; Kullik, J.; Reuter, M.A.; Gutzmer, J. Raw material ‘criticality’—Sense or nonsense? J. Phys. D Appl. Phys. 2017, 50, 123002. [Google Scholar] [CrossRef]
  50. Schrijvers, D.; Hool, A.; Blengini, G.A.; Chen, W.-Q.; Dewulf, J.; Eggert, R.; van Ellen, L.; Gauss, R.; Goddin, J.; Habib, K.; et al. A review of methods and data to determine raw material criticality. Resour. Conserv. Recycl. 2020, 155, 104617. [Google Scholar] [CrossRef]
  51. Helbig, C.; Bradshaw, A.M.; Wietschel, L.; Thorenz, A.; Tuma, A. Corrigendum to “Supply risks associated with lithium-ion battery materials”. J. Clean. Prod. 2019, 221, 899–903. [Google Scholar] [CrossRef]
  52. Tilton, J.E. On Borrowed Time: Assessing the Threat of Mineral Depletion; Resources for the Future: Washington, DC, USA, 2002. [Google Scholar]
  53. Chopra, S.; Sodhi, M.S. Managing risk to avoid supply-chain breakdown. MIT Sloan Management Review, 15 October 2004. [Google Scholar]
  54. Erdmann, L.; Graedel, T.E. Criticality of non-fuel minerals: A review of major approaches and analyses. Environ. Sci. Technol. 2011, 45, 7620–7630. [Google Scholar] [CrossRef]
  55. Achzet, B.; Helbig, C. How to evaluate raw material supply risks—An overview. Resour. Policy 2013, 38, 435–447. [Google Scholar] [CrossRef]
  56. Yuan, Y.; Yellishetty, M.; Mudd, G.M.; Muñoz, M.A.; Northey, S.A.; Werner, T.T. Toward dynamic evaluations of materials criticality: A systems framework applied to platinum. Resour. Conserv. Recycl. 2020, 152, 104532. [Google Scholar] [CrossRef]
Figure 1. Average chemical composition of each superalloy type (left-hand scale) and its density (right-hand scale). PP: Powder-Processed. CC: Conventionally Cast. DS: Directionally Solidified. SX: Single-Crystal. Data are in the Supplementary Material (Tables S1 and S4) [2,3,4,10,28].
Resources 09 00106 g001
Figure 2. Average raw material costs (left-hand scale) and 1% creep life temperature at 1000 h and 137 MPa of each superalloy type (right-hand scale). PP: Powder-Processed. CC: Conventionally Cast. DS: Directionally Solidified. SX: Single-Crystal. Data are in the Supplementary Material (Tables S1 and S5) [2,3,4,10,28].
Resources 09 00106 g002
Figure 3. Supply risk values for all twelve indicators and all twelve elements after normalization. S1: Static Reach Reserves. S2: Static Reach Resources. S3: End-of-Life Recycling Input Rate D1: Future Technology Demand. D2: By-Product Dependence. D3: Sector Competition. D4: Substitutability. C1: Country Concentration. C2: Company Concentration. P1: Political Stability (WGI-PV). P2: Policy Perception (PPI). P3: Regulation (HDI).
Resources 09 00106 g003
Figure 4. Supply risk score on the elemental level and the raw material price in a semi-logarithmic plot. Values are given in Tables S2 and S3 in the Supplementary Material.
Resources 09 00106 g004
Figure 5. (A) Supply risk score and endurance temperature on the technology level, using the arithmetic mean as the aggregation scheme. (B) Results using the mass approach. (C) Results using the cost approach. (D) Results using the maximum approach. Raw data are given in Tables S1 and S6 in the Supplementary Material.
Resources 09 00106 g005
Table 1. The supply risk indicators considered in this article and their weightings. Additional information on each indicator is available in the Supplementary Material (Tables S1 and S2) [37]. τ R 1 : Static reach of reserves in years; τ R 2 : Static reach of resources in years; E o L R I R : End-of-life recycling input rate in percent; δ t , t : Annual growth factor from future technology demand; S C I : Sector Competition Index in points; H H I : Herfindahl–Hirschman-Index; W G I : Worldwide Governance Indicators Political Stability and Absence of Violence; P P I : Policy Perception Index; H D I : Human Development Index.
CategoryIDIndicatorNormalizationWeightings
Risk of Supply ReductionS1Static Reach Reserves S 1 = 100 0.2 τ R 1 0.008 τ R 1 2 1/12 = 8.3%
S2Static Reach Resources S 2 = 100 0.1 τ R 2 0.002 τ R 2 2 1/12 = 8.3%
S3End-of-Life Recycling Input Rate S 3 = 100 E o L R I R 1/12 = 8.3%
Risk of Demand IncreaseD1Future Technology Demand D 1 = 1000 δ t , t 1/16 = 6.3%
D2By-Product Dependence D 2 = 100 C o m p a n i o n a l i t y 1/16 = 6.3%
D3Sector Competition D 3 = S C I 1/16 = 6.3%
D4Substitutability D 4 = S u b s t i t u t a b i l i t y 1/16 = 6.3%
Market Concentration RiskC1Country Concentration C 1 = 21.64 ln H H I c o u n t r y 99.31 1/8 = 12.5%
C2Company Concentration C 2 = 15.81 ln H H I c o m p a n y 45.62 1/8 = 12.5%
Political RiskP1Political Stability (WGI-PV) P 1 = 20 ( 2.5 W G I ) 1/12 = 8.3%
P2Policy Perception (PPI) P 2 = 100 P P I 1/12 = 8.3%
P3Regulation (HDI) P 3 = 100 H D I 0.352 0.949 0.352 1/12 = 8.3%
Table 2. Compilation of supply risk indicators on the elemental level before normalization. For an explanation of the indicators and further information on assumptions concerning the data, see Supplementary Material (Table S2). Data sources: [36,38,39,40,41,42,45,46,47,48]. ⊕: Higher figures indicate higher risk. ⊖: Lower figures indicate higher risk.
IndicatorDimensionRiskAlTiCrFeCoNiNbMoRuTaWRe
S1years941071660583668521029843550
S2years184258384161120160>20068>200>200306221
S3%166132216271011111379
D1%020009002031200150
D2%0021852246100285100
D3qualitative284220244229202843443548
D4qualitative446376575462427063415390
C1HHI305712213033332131411450826628896958234666793374
C2HHI222113171854226919021191644121831373200269202533
P1qualitative−0.24−0.21−0.36−0.33−1.20−0.21−0.20−0.15−0.29−1.04−0.44−0.44
P2qualitative615158685056596251494773
P3qualitative0.790.720.730.820.780.810.790.790.700.530.750.84

