Article

The Soil Moisture during Dry Spells Model and Its Verification

by
Małgorzata Biniak-Pieróg
1,*,
Mieczysław Chalfen
2,
Andrzej Żyromski
1,
Andrzej Doroszewski
3 and
Tomasz Jóźwicki
3
1
Institute of Environmental Development and Protection, Wrocław University of Environmental and Life Sciences, Plac Grunwaldzki 24, 50-363 Wrocław, Poland
2
Department of Mathematics, Wrocław University of Environmental and Life Sciences, Grunwaldzka Street 53, 50-357 Wrocław, Poland
3
Department of Agrometeorology and Applied Informatics, Institute of Soil Science and Plant Cultivation—State Research Institute, Czartoryskich Street 8, 24-100 Puławy, Poland
*
Author to whom correspondence should be addressed.
Resources 2020, 9(7), 85; https://doi.org/10.3390/resources9070085
Submission received: 19 May 2020 / Revised: 3 July 2020 / Accepted: 7 July 2020 / Published: 9 July 2020
(This article belongs to the Special Issue Analysis of Extreme Hydrometeorological Events)

Abstract

:
The objective of this study was the development and verification of a model of soil moisture decrease during dry spells—SMDS. The analyses were based on diurnal information of the occurrence of atmospheric precipitation and diurnal values of soil moisture under a bare soil surface, covering the period of 2003–2019, from May until October. A decreasing exponential trend was used for the description of the rate of moisture decrease in six layers of the soil profile during dry spells. The least squares method was used to determine, for each dry spell and soil depth, the value of exponent α , which described the rate of soil moisture decrease. Data from the years 2003–2015 were used for the identification of parameter α of the model for each of the layers separately, while data from 2016–2019 were used for model verification. The mean relative error between moisture values measured in 2016–2019 and the calculated values was 3.8%, and accepted as sufficiently accurate. It was found that the error of model fitting decreased with soil layer depth, from 8.1% for the surface layer to 1.0% for the deepest layer, while increasing with the duration of the dry spell at the rate of 0.5%/day. The universality of the model was also confirmed by verification made with the use of the results of soil moisture measurements conducted in the years 2009–2019 at two other independent locations. However, it should be emphasized that in the case of the surface horizon of soil, for which the process of soil drying is a function of factors occurring in the atmosphere, the developed model may have limited application and the obtained results may be affected by greater errors. The adoption of calculated values of coefficient α as characteristic for the individual measurement depths allowed calculation of the predicted values of moisture as a function of the duration of a dry spell, relative to the initial moisture level adopted as 100%. The exponential form of the trend of soil moisture changes in time adopted for the analysis also allowed calculation of the duration of a hypothetical dry spell t, after which soil moisture at a given depth drops from the known initial moisture θ0 to the predicted moisture θ. This is an important finding from the perspective of land use.

Graphical Abstract

1. Introduction

Soil water resources play an important role in the water cycle in the plant-soil-atmosphere system, and particularly in the surface layer of soil [1,2,3,4,5]. This system affects energy flux and supplies water vapor to the atmosphere as a result of the process of evaporation from bare soil, or evapotranspiration from areas covered with vegetation of diverse kinds. This leads to the exhaustion of water resources in soil, while supplying the atmosphere with water vapor, thereby creating the basis for the formation of precipitation, which is the main source of the water supply of the soil profile independently of human influence. The important elements are the amount of precipitation, its intensity, and its distribution in time. The effect of precipitation is particularly visible in the surface layer of soil, where moisture exhibits a significant variation over time and decreases with greater depths [6,7,8,9]. As soil moisture is a key variable in the climate system, it plays a major role in climate change projections [5]. As a consequence of predicted global warming, changes in terrestrial water storage are expected [10,11,12,13]. As reported by Giorgi et al. [14] an increase of the intensity of precipitation and of the duration of non-rainfall periods, with simultaneous limitation of the reach of precipitation and shortening of the duration of wet periods, can have an impact on the time, location, and availability of water. As follows from the study by Huang et al. [15], at a global scale, arid areas could constitute more than 50% of the Earth’s total landmass, the majority of which could be found in developing countries.
According to Grillakis [16], changes to soil water resources in the European region are expected as a consequence of predicted climate change. In this regard, in recent years, the occurrence of increasingly long series of rainless days, lasting for as long as several weeks, have been observed, representing atmospheric anomalies. The direct effect of such events is a disturbed water balance in a given area, caused by rainfall deficit, which leads to the occurrence of the phenomenon of so-called atmospheric drought (also called meteorological drought). Poland is situated in a zone of a moderate climate of the transitional type, and destructive droughts occur within its territory, causing a depletion of water resources and, thus, a major economic, environmental, and societal problem. According to the climate-soil moisture regime described by Budyko (after [2,5]), the region belongs to a transitional climate regime, where soil moisture constrains evapotranspiration variation. Drought occurs in Poland at several-year intervals, and results in serious economic losses.
Agriculture is the most sensitive element of the economy in many countries. Atmospheric drought lasting for several weeks results in the exhaustion of water resources in the soil, which leads to the appearance of a soil drought. In such conditions, the growth of plants is hampered; thus a distinct drop in soil water resources is later reflected in low yields of crop plants [17,18]. The occurrence of soil drought can be accelerated or delayed by individual properties of soil, in particular, its particle size distribution. In the case of heavy soils, in which capillary rise replenishes water resources in the root zone from deeper layers, that process delays the occurrence of soil drought. In light gavel and sandy soils, no such possibilities exist, and soil drought will appear much sooner. Rainfall deficit causes strong crusting of the surface layer of soil, hindering the infiltration of water into deeper soil layers, in which the rate of infiltration is dependent on the moisture status of the soil [19,20,21]. In agriculture, it is difficult to clearly separate soil drought from agricultural drought. In the simplest terms, soil drought is treated as a deficit of soil water for plants, while the effect on plant growth is taken into account in the case of agricultural drought [17].
Droughts are a threat to correct plant growth and development, but studies conducted by the authors of the present paper indicate that the occurrence of non-rainfall periods in certain inter-phase periods of crop plants can have a positive effect in the form of increased yields [22,23,24]. However, droughts represent a primary threat to the water balance of a given area. Among the relevant variables relating to drought impacts, the intensity of atmospheric drought occurrence is the easiest to estimate. Input data used in the calculation of a meteorological drought index are predominantly total precipitation and, less frequently, evaporation. Due to information availability, the most frequently used indicators for the estimation of meteorological drought are the series of non-rainfall days, relative precipitation index (RPI), effective drought index (EDI), climatic water balance (CWB), or standardized climatic water balance (SCWB), and the well-known and commonly used Sielianinov coefficient [25,26,27,28,29,30,31,32]. At the global scale, many indices for the estimation of meteorological drought exist, but the most frequently used is the standardized precipitation index (SPI), based on atmospheric precipitation. This index allows both short- and long-term prediction of the effects of drought and permits comparative analyses of drought intensity in various regions of the world [33,34,35,36,37].
Due to the fact that direct measurements of soil moisture are time and labor consuming, as well as costly, many indirect methods are used for the identification and estimation of the intensity of soil drought. Such indices are formulated on the basis of meteorological factors and soil moisture conditions for various time intervals, and, in the case of crop plants, for the periods between different plant development phases. The most sensitive interphase periods for crop plants are referred to as the critical periods. Indices based on the meteorological elements allow the identification of periods of potential drought threat, which does not always translate directly into soil drought. In turn, indices based on soil moisture require direct measurements, with short time periods, e.g., one day. Such a short time interval requires costly specialized equipment, and, for this reason, the measurements are usually made at the scale of a single measurement point. As reported by Łabędzki and Bąk [27], the most popular indices of this type used globally include the crop drought index (CDI), soil moisture index (SMI), crop yield reduction (CYR), Palmer drought severity index (PDSI), crop moisture index (CMI), Z index, drought severity index (DSI), and soil moisture deficit index (SMDI) [16,38,39,40,41,42,43], amongst many others. Their detailed review, together with description of the required input data and of application limitations, is given in the Word Meteorological Organization (WMO) manual. In spite of such a large number of existing tools, research continues to be undertaken to develop new indices, and into possibilities for their use for the estimation of meteorological drought and the occurrence of soil drought [44,45,46,47]. Independently from that direction of research, complex models have also been developed, allowing the estimation of soil moisture on the basis of a broad spectrum of meteorological elements and soil characteristics [48,49,50,51]. In the search for methods of estimation of the spatial occurrence of soil drought, remote sensing techniques have also been employed [52,53,54,55,56,57,58].
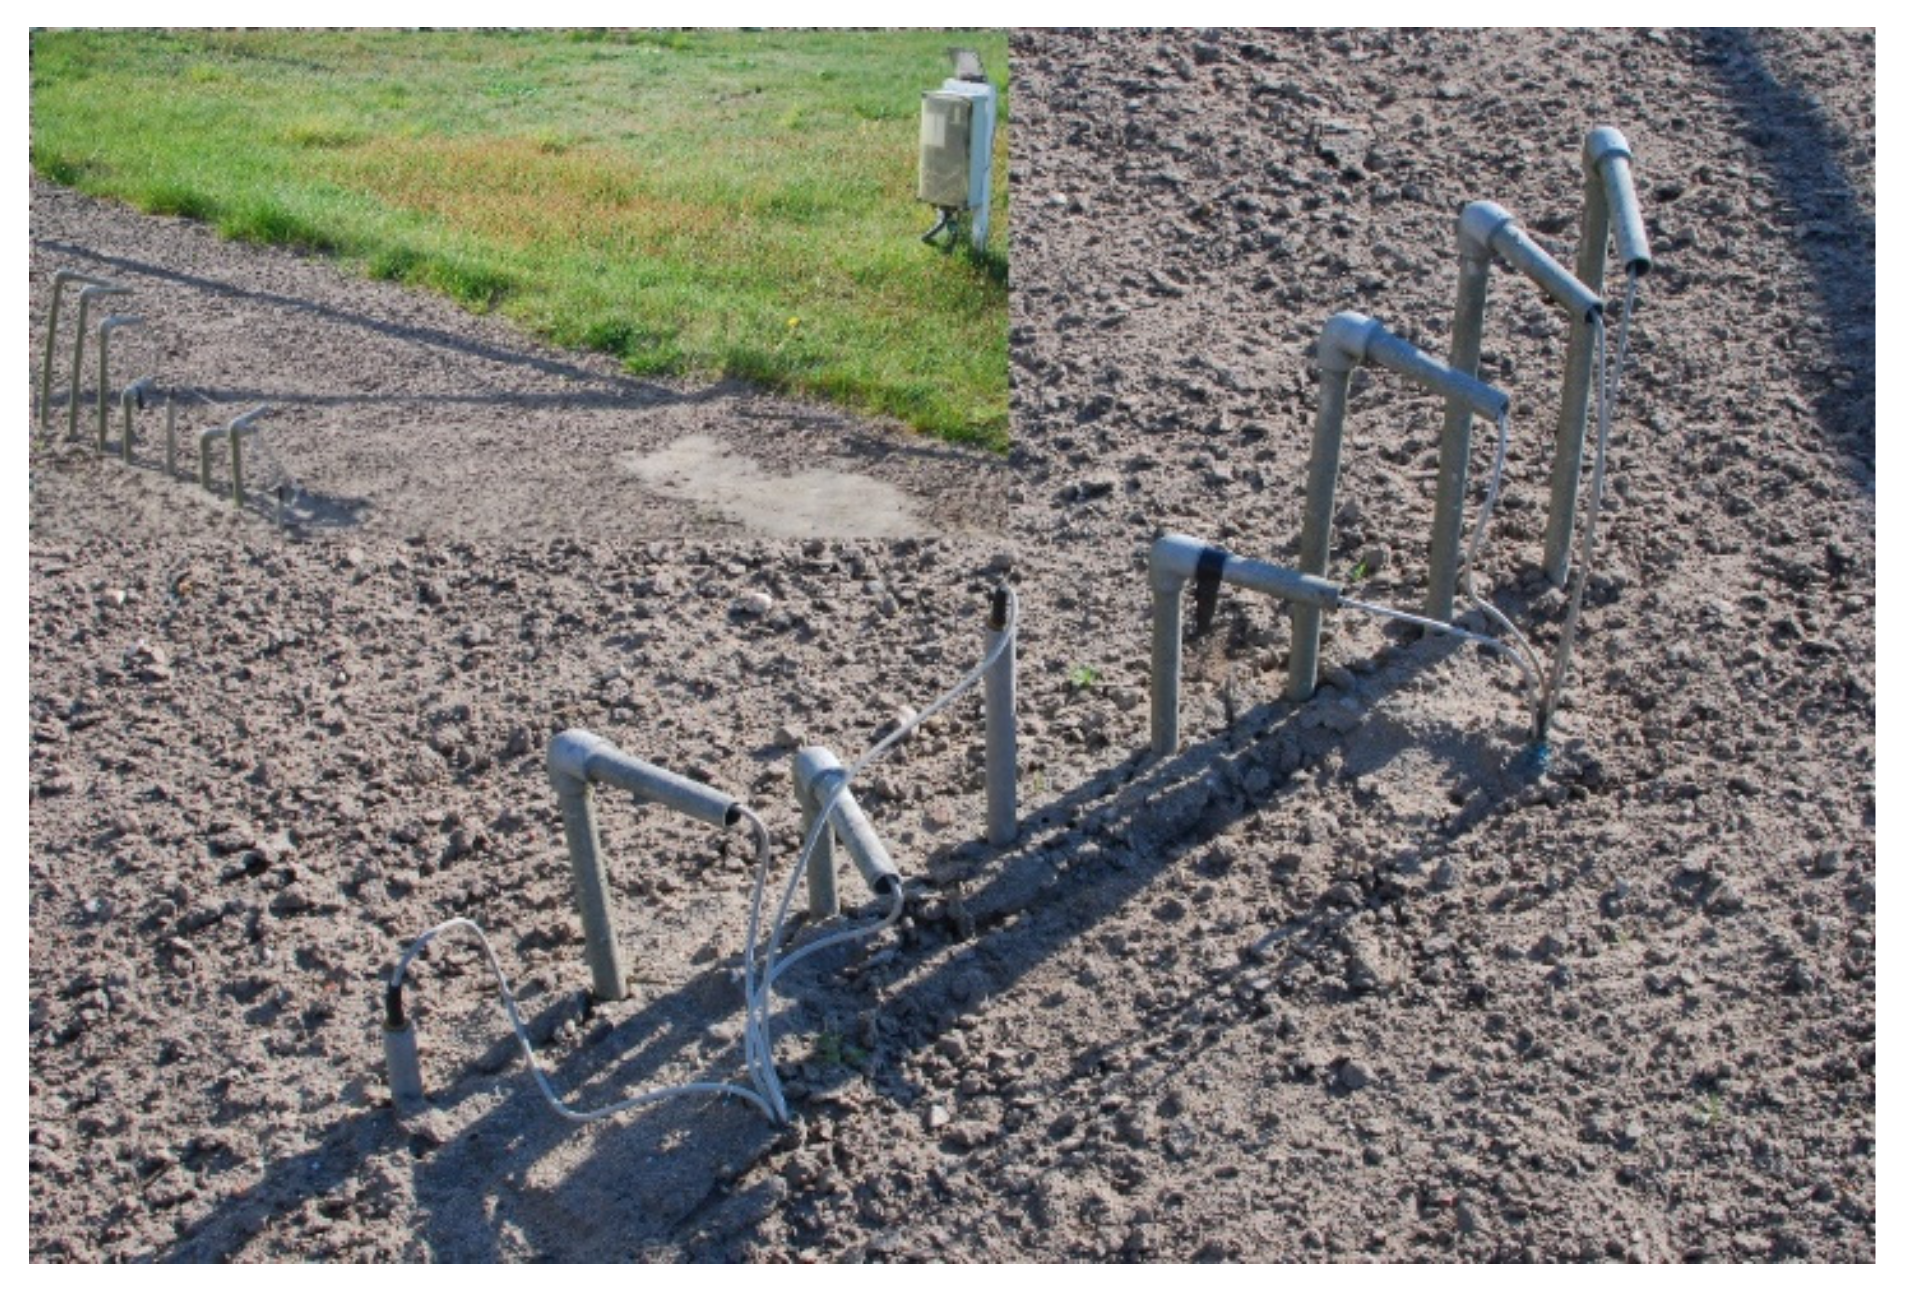
Nonetheless, methods developed and used to date, despite their numerous advantages, have limitations, as they do not provide information on the actual status of soil moisture during dry spells. Such information can only be obtained at the cost of labor-consuming field measurements, as changes in soil moisture relate to the impact of atmospheric conditions and plant cover, and are determined by the retention capacity of soil, which, in turn, is a function of the soil particle size distribution. Twenty-four-hour monitoring of the state of soil moisture under bare soil as a reference surface has been conducted since 2003 at the Institute of Environmental Development and Protection, Wrocław University of Environmental and Life Sciences, Poland. The reference status of this surface results from the fact that the bare surface directly intercepts the effect of atmospheric elements and is the background for assessing the impact of plant cover on soil water balance. Studies on soil moisture under bare soil have been conducted for years in many research centers [59,60,61,62].
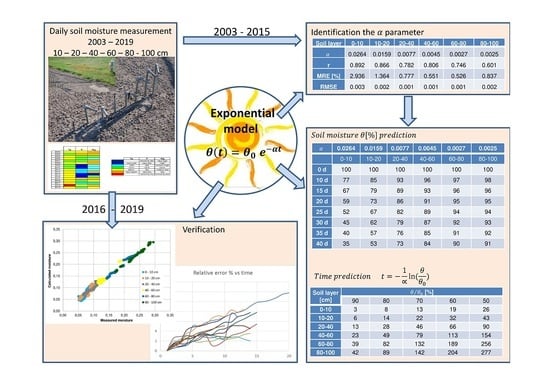
Given the above, the objective of the current study was the development and verification of a model of soil moisture decrease during dry spells (SMDS). The analyses were based on diurnal information on the occurrence of atmospheric precipitation and diurnal values of soil moisture under bare soil. These allowed the development of a simple mathematical model describing the rate of moisture decrease in the soil profile at various depths during dry spells. Theoretical mathematical models describing soil moisture, based on a deterministic description of the phenomenon, such as the Richards equation, e.g., [63], are frequently used. The diffusion coefficient in the Richards equation depends on soil characteristics. However, these models require continuous measurement of soil moisture in the surface layer (boundary condition), or the artificial assumption that soil moisture on the surface is constant, invariable over time. In this paper, the authors’ intention was to find an operational model of soil moisture decrease only on the basis of the duration of dry spells, eliminating the need for conducting soil moisture measurements. This type of model is much easier to apply in agricultural practice. The developed model is a methodological contribution for further analysis taking into consideration plant-covered surfaces, e.g., those covered by grass.

2. Materials and Methods

2.1. Site Description

Soil moisture measurements were conducted in the area of the Faculty Agro and Hydrometeorology Observatory, Wrocław University of Environmental and Life Sciences, Poland, during the summer half-year (May until October), in the years 2003–2019. Data from 2003–2015 (13 years) were used to determine the model parameter, while those from 2016–2019 (4 years) were used to verify the model. The observatory is situated in the north-eastern part of the city, and is separated from the urban heat island by a complex of parks, stadiums, meadows, and fields, and the Odra-Widawa Canal (Figure 1). The observatory is situated at an elevation of 120.7 m a.s.l., latitude 51°07′, longitude 17°07′.
In addition, for model verification, the authors used data from soil moisture measurements conducted in the period 2009–2019 (11 years) at two other locations: Jelcz Laskowice (Dolnośląskie Province, ca. 25 km south-east from Wrocław, 51°02′07″ N, 17°20′28″ E) and Baborówko (Wielkopolskie Province, ca. 150 km north from Wrocław, 52°35′09″ N, 16°37′54″ E) (Figure 1). These stations are included in the network of soil moisture measurements within the scope of the Agricultural Drought Monitoring System (ADMS) in Poland, conducted by the Institute of Soil Science and Plant Cultivation—State Research Institute (IUNG-PIB) on behalf of the Ministry of Agriculture and Rural Development.

2.1.1. Soil

In the surface layers, the soils in the area of the observatory are characterized by the occurrence of fine-grain loamy sands, which in deeper layers change to weakly loamy and loose sands with intrusions of mainly loamy sands and sandy loams (Table 1). The sand layer has thickness from 90 to 150 cm overlaying the loam. At the depth of 100–120 cm, the soils are completely saturated with water for several months a year. Periodically, as a result of capillary rise or in periods of intense rainfall, the saturation can reach the level of 50–70 cm below the surface of the ground. Typologically, the soils are proper fluvisols. In the international classification of FAO-WRB [64], these are cultured soils with preserved features of alluvial deposits. Most frequently, they are classified in the group of Phaeozems (Fluvic Gleyic Phaeozems (Anthric, Arenic)). Total porosity of the soils is in the range of 40–45%. Hydraulic conductivity in the sandy layers varies from 2.9 × 10³ to 4.6 × 103 cm/s, while in the sandy loam at the depth of 120–150 cm, it attains the lowest value of 1.9 × 103 cm/s. The soils in the area of the observatory are characterized by low retention capacity. The field water capacity in the sandy layers with suction force pF = 2.0 varies from 6.0% to 12.5% [65].

2.1.2. Agroclimate

Characterization of the agrometeorological conditions in the area of the observatory was conducted on the basis of the normative multi-year period of 1971–2000, due to the fact that the currently valid norm recommended by WMO—that is, the 30-year period of 1981–2010—includes the years adopted for the analyses [66]. Figure 2 presents the characteristics of the summer half-years adopted for the analyses. The characteristics include such elements as air temperature, atmospheric precipitation, and the level of the ground water table.
The mean half-year values of air temperature, with the exception of 2018, were characterized by small variation, as they varied from 15.1 °C in 2007 and 2010 to 16.5 °C in 2006. The exception was the mentioned 2018, with an average temperature of 17.6 °C, classified as a very warm period. In a vast majority of cases, deviations from the norm for the multi-year period of 1971–2000 of 14.8 °C [67] were classified as warm periods. Only in the years 2004, 2007, 2009, and 2010 did the values of the deviations not exceed 0.5 °C, and thus corresponded to normal conditions.
The analyzed summer half-years were characterized by notably greater variation of the rainfall conditions, which basically results from the random character of this factor and its large variation year to year. The half-year precipitation totals varied from 259 mm in 2004 and 264 mm in 2015, to 541 mm in 2013, while the mean value for the normative multi-year period is 369 mm. Their interpretation was conducted on the basis of the RPI (relative precipitation index) [27]. As can be seen in Figure 2, the period adopted for the analyses covered years with precipitation totals conforming to the norm, as well as years with either a precipitation deficit or excess. Note should be taken of the outstanding period of 2009–2014, with an accumulation of summer half-years with precipitation totals corresponding to wet and very wet periods, and the period of 2005–2007 with normal precipitation totals.
The depths of the ground water table level were characterized on the basis of the norm proposed by Biniak-Pieróg [59]. From the ground surface, the mean half-year depths of the ground water table level varied from 164 cm in 2008 and 2018 to 100 cm in 2013, and the mean multi-year value was 126 cm. The most frequently observed were half-year periods with ground water levels corresponding to low states (7 cases), followed by medium-high states (5 cases).
The summer half-years of 2016–2019 adopted for verification of the model parameter were characterized by variability of the agrometeorological conditions, in particular, taking into account rainfall conditions (Figure 2). They included both warm periods with excess precipitation and a medium-high groundwater level (2017), or warm periods with normative precipitation but a medium-low groundwater level (2016 and 2019).

2.2. Data

The analyses were based on diurnal values of soil moisture under the bare surface, adopted as the reference surface, and information on the occurrence of atmospheric precipitations. Soil moisture was measured every day, at the time of morning observations, i.e., at 6.00 UTC, in the hydrological summer half-year, lasting 1 May–31 October, in the years 2003–2019, using the TDR (time domain reflectometry) method. This approach is one of the most modern methods of measurement, consisting of the generation of an electromagnetic wave pulse, which, entering the analyzed medium—in this case, soil—is reflected, and recording of the moment of return of the attenuated reflected pulse. The value of attenuation of the reflected wave that is returned depends primarily on the content of water in the soil, in addition to the concentration of electrolytes and the content of clays [68]. The main advantages of the method include its high temporal and spatial resolution; high measurement accuracy, reaching 1–2% of volumetric moisture; minimized calibration requirements; zero risk of radiation, as is the case when using the gammametric or neutron methods; and the possibility of conducting continuous, rapid, and non-destructive measurements with any chosen time interval [69,70]. In the current study, a modern apparatus was used, in the form of TDR/MUX/mpts instruments and data loggers MIDL_GPRS for field installation, the sole manufacturer of which in Poland is the Institute of Agrophysics PAS in Lublin [71]. These instruments allow continuous measurement of soil moisture, temperature, and salinity at the same point. They work together with a set of TDR probes installed at depths of 10, 20, 30, 40, 50, 60, 80, and 100 cm under the bare soil surface (Figure 3), calibrated at the beginning of each measurement season by means of the software provided by the manufacturer [71].
Soil moisture values in the layers of 0–10, 10–20, 20–40, 40–60, 60–80, and 80–100 cm were used for the analyses, for the summer half-years of 2003–2019. Table 1 presents the extreme and mean values of soil moisture from the layers adopted for the analyses. The years in which the lowest values were observed are differentiated in relation to the soil layer. For the surface layers of 0–10 and 10–20 cm, the lowest values of soil moisture were noted in 2004 at 0.019 and 0.035, respectively. This year was classified as very dry, with the ground water table at low states (Figure 2). Whereas, for the layers of 20–40 and 40–60 cm, the lowest values of soil moisture were noted in 2003—a warm and dry year, with a low state of the ground water table at 0.052 and 0.062, respectively. In the case of the deepest layers of 60–80 and 80–100 cm, the lowest values were observed in 2015 and 2016, respectively. In this case, the medium-low and low states of the ground water table were important. Irrespective of the analyzed soil layer, under bare soil, the maximum values were observed in 2013. This was a normal half-year in terms of air temperatures, and with above-norm rainfalls corresponding to a very wet period with a medium state of the ground water table. In addition, in several preceding years, the summer half-years were characterized by above-norm rainfalls and ground water table states, which allowed replenishment of the water resources in the soil profile, and their maintenance (Table 2).
Diurnal information on atmospheric precipitation was acquired by means of the standard Hellmann rain gauge. With regard to the scope of the analyses, the important information was the occurrence or lack of atmospheric precipitation. The number of non-rainfall days varied from 80 in the very wet summer half-year of 2012 to 121 in the dry half-year of 2018. Due to the random character of rainfall and its high variation, the number of days with no rainfall did not correspond with the characteristics of the precipitation conditions. For example, similar numbers of non-rainfall days (approximately 110) were observed in a normal year (2006), a dry year (2015), and a wet year (2011).
The information acquired as described above was the basis for the determination of the start and end points of non-rainfall periods. It was assumed that a series of non-rainfall days was defined as 1 day with rainfall below 1 mm or 2 successive days with combined precipitation total below 1 mm, while one day with precipitation of 1 mm and above was not counted as belonging to such a series [72]. The diurnal values of the moisture of bare soil were referenced to the series of non-rainfall days determined in this way for each of the 6 soil layers from 0–10 to 80–100 cm.

2.3. Exponential Model SMDS

The soil moisture decrease in dry spells can be described by means of various relationships. The adoption of the simplest linear relationship between soil moisture and the duration of a dry spell is equivalent to the hardly acceptable assumption that the decrease of moisture on every day is constant and independent of the initial soil moisture of that day. In addition, when constructing a longer forecast of soil moisture based on the decreasing linear trend, one could obtain negative values of soil moisture. Similar problems are encountered in the case of polynomial and exponential models—lack of physical foundations and lack of monotonicity of solutions for longer time horizons. In addition, the authors wanted to create a model that would not be overly complicated while also being universally applicable, and that would describe the decrease of the moisture of bare soil for various locations with similar soil and atmospheric conditions by means of a single functional relationship with parameters that have subject-matter justification. Such initial assumptions are met by a single-parameter exponential model. It has a substantiated physical basis (Equation (1)), the single parameter of the model has a clear physical interpretation, and the model produces credible monotonic solutions and is universally applicable.
In consideration of these factors, a decreasing exponential trend was applied for the description of the rate of soil moisture decrease during dry spells, for each of the six layers of 0–10, 10–20, 20–40, 40–60, 60–80, and 80–100 cm. The exponential form of the trend results from the prior assumption adopted that the value of the diurnal drop of soil moisture is proportional to the initial moisture of each day, according to the formula:
θ t + 1 θ t = k   ·   θ t ,
where:
  • θ t —volumetric moisture (-),
  • t—time (day), and
  • k—coefficient of proportionality, −1 < k < 0.
Coefficient k is negative because soil moisture decreases during dry spells. Similarly, k > −1 because the decrease of moisture during one day cannot be greater that the moisture at the beginning of this day.
The truth of the assumption of a linear relationship between the moisture drop and the initial moisture according to Equation (1) is substantiated statistically in Section 3.2.
From the assumption of Equation (1), one can infer the exponential form of soil moisture as a function of time:
θ t = θ 0 e α t ,
where θ 0 —moisture on the initial day of the dry spell, and:
α = ln 1 + k .
Coefficient α > 0 is a numerical characteristic of the rate of moisture decrease: α close to zero means that the rate of moisture decrease is very low, α = 0 would mean that soil moisture does not decrease at all during a dry spell and is constant. On the other hand, an increase of the value of parameter α characterizes a dynamic decrease of soil moisture during a dry spell. Coefficient α characterizes the kind of soil, and in this paper, a method is proposed for its determination for each soil layer separately.
For further analysis, only those dry spells were selected that lasted at least 10 days. For each dry spell and for each soil layer separately, the value of α was determined with the method of least squares, minimizing the value of the root of the mean square error (RMSE) according to the formula:
d α = 1 n i = 1 n o b s d c a l d α 2 ,
where:
  • d α —RMSE,
  • n—dry spell duration (days),
  • o b s d moisture measurement at depth d (-), and
  • c a l d α moisture at depth d (-) calculated from Equation (2).
Data from the years 2003–2015 were used for the identification of parameter α of the model for each soil layer separately, while independent data from 2016 to 2019 were used for model verification.
Additionally, in the following section of this article, a mean absolute percentage error (MAPE) is calculated according to the formula:
M A P E = 1 n i = 1 n o b s i c a l i o b s i 100 % .

3. Results

3.1. Characterization of Dry Spells

In the years 2003–2015, there were 39 series of observations covering dry spells lasting at least 10 days, but their frequency in the individual months of the year was not uniform (Table 3).
The largest number of dry spells was noted in the spring and autumn months (May, September, and October), and the smallest in the summer (June to August). In addition, the duration distribution of individual dry spells was not homogeneous. Notably, the largest number of dry spells lasted for 10–12 days, with the longest lasting for 38 days (Figure 4). The mean duration of dry spells within the analyzed group of dry spells of at least a 10-day duration was 13.67 days.
In each dry spell, soil moisture in the analyzed layers, with a few exceptions, decreased monotonously with the passage of time (Figure 5).
Appendix A presents soil moisture characteristics for the individual dry spells, i.e., soil moisture on the first day of the dry spell (SMb), % decrease of soil moisture in relation to the initial value (SM%), and % decrease of soil moisture per day (SM%/d). The infrequent negative values (in bold) mean that, during a dry spell, the final value of moisture was higher than the initial value. Such a situation occurs sporadically at greater depths, where the effect of changes of the ground water table on soil moisture in the aeration zone becomes observable. Table 4 presents average values and standard deviations of SM% and SM%/d for the soil depths adopted for the analyses.

3.2. Statistical Substantiation of Assumption (Equation (1))

The truth of the assumption of the linear character of Equation (1) was statistically substantiated. For each of the 39 dry spells and for each of the 6 analyzed soil layers, the coefficient of correlation r between the initial moisture of each day θ t and moisture decrease during one day θ t + 1 θ t was calculated. The mean values of r for the depths and the statistics of the student’s t-test used for testing the significance of the coefficient of correlation are given in Table 5.
The limit value of the student’s t-test statistic for the mean dry spell duration of 13.67 days at a significance level of 0.05 is 2.15, and at a significance level 0.1, it is 1.76. In the conducted correlation analysis, the mean value of the t-test statistic for all dry spells was 2.21, which, at the significance level 0.05, confirms the significance of the coefficient of correlation, and thus confirms the initial assumption in Equation (1). Only in the case of the layer of 40–60 cm was the assumption of linear correlation not met at a significance level of 0.1.

3.3. Identification of the SMDS Model Parameter

In the next stage of the study, for each dry spell and for each soil layer, in accordance with Equation (4), coefficient α in Equation (2) was determined, which describes the rate of moisture decrease. The variation of coefficient α for each of the 39 dry spells for the analyzed soil layers is illustrated in Figure 6.
At this point, it is worthwhile to explain the cause of the very high values of coefficient α for dry spells 11 and 12 (see Figure 6a). These were 10-day dry spells, which started on 11 June 2013 and 30 June 2013. On 9 June 2013, a very strong rainfall was noted, amounting to 28.4 mm, which resulted in a high increase of moisture in the surface horizon of the soil. In the case of dry spell 11, this value was 0.0329, and for dry spell 12, 0.0245. In the summer months, the moisture in the soil layer of 0–10 cm usually did not exceed 0.01 at the start of a dry spell. In consequence, the moisture in the soil layer of 0–10 cm decreased during the 10 days of dry spell 11 by 49%, and, in the case of dry spell 12, by 48%. Similarly, high decreases of soil moisture were noted in the layers of 10–20 cm (45% and 43%, respectively, for dry spell 11 and 12), 20–40 cm (41% and 35%, respectively, for dry spell 11 and 12).
The greatest variation of parameter α was noted for the layer of 0–10 cm, and the oscillations of coefficient α decreased with increasing depth. This supports the decrease of moisture variation with depth. Detailed values are given in Table 6. The third column presents the mean values of coefficient α , which are adopted in a later analysis of this paper as a characteristic of the particular depths in the soil profile. Table 7 presents the decrease of the values of the correlation coefficient r with increasing depth in the soil profile.
Due to the large variation of parameter α obtained for the surface horizon of the soil, in particular the layer of 0–10 cm (Figure 6a), two mean values of this parameter were calculated for that soil layer: α = 0.0208 for the months of May, September, and October, and for the typically summer months of June–August, the calculated value was α = 0.0426 .
For each of the 39 dry spells, the correlation coefficient r was also determined, for the correlation between the soil moisture calculated from Equation (2) and the series of measured moisture values, for each soil layer separately. For each soil depth, a significant correlation was obtained between the model and the measured values (r > 0.60), with mean values of r decreasing with depth (Table 7). This indicates that the soil moisture in soil layers down to 60 cm is strongly dependent on moisture conditions on the surface of the ground. At depths from 60 to 100 cm, the meteorological conditions on the ground surface play a lesser role, although they are still statistically significant. At these depths, the effect of the ground water table becomes apparent, but this was not taken into account in the model.
Detailed results of parameter α identification and approximation errors are given in Table 8.
It is worth noting that MAPE (Equation (5) did not exceed 10% for any dry spell and any soil layer. It can be assumed, therefore, that the values of parameter α given in Table 5 and Table 7 describe the dynamics of moisture decrease during dry spells well.

3.4. Verification of SMDS Model

Model verification was performed following two pathways:
  • With the use of independent moisture measurements, conducted at the same points as the measurements used for the construction of the model, in the area of the Faculty Agro and Hydrometeorology Observatory of the Wrocław University of Environmental and Life Sciences, taken in 2016–2019; and
  • With the use of moisture measurements of bare soil, taken at the two additional measurement locations, i.e., Jelcz Laskowice and Baborówko (Section 2.1), in the years 2009–2019.

3.4.1. Verification Based on Data from Wrocław (Faculty Agro and Hydrometeorology Observatory)

During the 4-year period 2016–2019, 12 dry spells of at least 10 days were identified, according to the adopted methodology. Figure 7 presents the dependences between the measured and calculated values.
Table 9 presents the values of MAPE (%) for each measurement depth separately and the mean value for the entire soil profile, calculated with the use of the data from measurements conducted in the area of the Faculty Agro and Hydrometeorology Observatory.
The MAPE error for all soil layers between moisture values observed in these years and values calculated using Equation (2) was 3.8%. This value was accepted as sufficiently accurate. It was found that the model fitting error decreased with the soil layer depth, from 8.1% for the surface layer to 1.0% for the deepest layer (Table 9). In other words, the accuracy of the exponential model improves with depth in the profile. This results from moisture stabilization at greater soil depths during dry spells. At the same time, the fitting error increased with the duration of the dry spell, at the rate of about 0.5%/day (Figure 8).
The drastic increase of the relative error Re (%) for dry spell 4 between days 10 and 11 of its duration was caused by sporadic errors in the measurement data. In this case, the measuring apparatus recorded a high decrease of the soil moisture between days 10 and 11 of the duration of the dry spell (i.e., between15 and 16 September 2016) only in the layers of 0–10 and 40–60 cm. It is surprising that in the remaining layers, the soil moisture changed only minimally or not at all (Table 10). The authors did not apply any corrections to the doubtful data, nor did they eliminate those data from the data base.

3.4.2. Verification Based on Data from Jelcz Laskowice and Baborówko

Model verification was also performed with the use of the results of soil moisture measurements conducted in the years 2009–2019 at two other locations in Poland, Jelcz Laskowice and Baborówko (Figure 1). As mentioned in Section 2.1, these stations are included in the soil moisture measurement network within the scope of the Agricultural Drought Monitoring System (ADMS) in Poland, conducted by the Institute of Soil Science and Plant Cultivation—State Research Institute (IUNG-PIB). They represent light soils, accounting for nearly 70% of all soils in Poland and in central Europe. From the viewpoint of particle size distribution, they are light loamy sands and light silty sands, and strong loamy sands and strong loams. In terms of susceptibility to droughts, the soils are classified in category II with a particle size distribution of light silty loamy sand [73]. Moisture measurements at these locations were taken by means of the profile probe PR2 Delta-T® at 5 depths in the soil profile: 10, 20, 40, 60, and 100 cm [74].
During the period of 2009–2019, 20 dry spells in Jelcz Laskowice and 35 in Baborówko were identified, in conformance with the adopted method, each lasting at least 10 days. The locality of Baborówko is situated in the Wielkopolskie Province, classified as one of the driest regions in Poland. This was also supported by the more frequent identification of dry spells numbering longer than 20 days at this measurement location. It should be mentioned that the verified model of soil drying during dry spells was created on the basis of dry spells that lasted, in the vast majority, for 10–20 days, which resulted from the duration of dry spells in Wrocław in the 13-year period adopted for the analyses. SMDS model verification performed on the basis of this material also allowed an assessment of the response of the model to dry spells lasting for longer than 20 days.
Figure 9 and Figure 10 present the relationships between the measured and the calculated values of soil moisture for Jelcz Laskowice and Baborówko, respectively.
Table 11, on the other hand, presents the values of MAPE (%) for each of the measurement depths separately, and the mean value for the entire soil profile, calculated with the use of data from both measurement locations that were used for the verification.
Model verification performed with the use of the data from Jelcz Laskowice and Baborówko demonstrated that the model, apart from the surface horizon of the soil, yielded results with errors smaller than 10%, which should be accepted as satisfactory results. This supports the conclusion that the model is a universal one and can be used for other objects characterized by soil conditions similar to those of the Faculty Agro and Hydrometeorology Observatory in Wrocław. In the surface soil horizons, in particular in the layer of 0–10 cm, the errors of verification reached or exceeded 30%. This results from the fact that during dry spells, soil moisture in those layers is also affected by other meteorological factors that influence the dry spell duration not accounted for in the model.

3.5. Prediction

The adoption of the values of the coefficient α given in Table 6 and Table 8 as a characteristic for the particular soil layers allows calculation, using Equation (2), of the predicted moisture values in relation to the duration of the dry spell, relative to the initial moisture accepted as 100%. Examples of predicted values are given in Table 12. For example, for a dry spell lasting for 15 days, in the layer of 20–40 cm, the moisture predicted according to the model will decrease to 89% of the initial moisture.
The exponential form of the trend of moisture changes over time adopted for the analyses also allows the calculation, using Equation (2), of the duration of the dry spell t after which soil moisture at a selected depth will decrease from the known value of the initial moisture ϴ0 to moisture ϴ, which is important for the land use of the area:
t = 1 α ln θ θ 0 .
Obviously, time t depends on the value of the decrease rate coefficient α and on the ratio of the expected moisture ϴ and the initial moisture ϴ0. Examples of such lead times are given in Table 13. For example, in the layer of 20–40 cm, characterized by parameter α = 0.0077, soil moisture will decrease to 80% of the initial value after a dry spell lasting for 28 days.

4. Discussion

Extreme phenomena—in this case droughts—appear in various regions of the world and many research teams are looking for methods of closer elucidation of those phenomena. However, this research is most frequently conducted with the use of known tools and methods. The simple and non-standard method developed and described in detail herein can help agricultural science and practice, and expand knowledge on the dynamics of drought. The permanent layout of measurement points and round-the-clock monitoring of the state of soil moisture at various depths allow the acquisition of highly valuable information on soil water resources. The innovative approach, i.e., simplicity of the model and departure from the standards, consisting in estimating the amount of soil moisture changes through indirect methods based on various available sets of meteorological elements, can contribute to a certain progress in the development of knowledge on drought as an extreme phenomenon.
The proposed exponential SMDS model of soil moisture decrease in dry spells allows estimation of the reduction of soil water content only on the basis of information on the state of soil moisture on the first day of a dry spell and its duration. In practice, this means that on the basis of available information on the lack of rainfall, obtained in the form of a prediction, it is possible to determine the potential decrease of soil moisture without any need for direct labor-consuming and costly measurements of the state of soil moisture. The developed SMDS model relates to bare soil because it is the standard reference surface and allows spatial comparison of results irrespective of the location of studies. The only significant factor differentiating the analyzed bare surfaces is the particle size composition of the soils. Soil drying occurs and is observably faster in light soils, while in compact soils the process proceeds more slowly and has a smaller range at greater soil thicknesses. This results from the fact that such soils have a potentially greater water folding capacity. An absence of vegetation cover on the soil creates such conditions that its moisture is the sole resultant of the effect of agro and hydrometeorological factors. In the literature, the authors of numerous publications indicate the justifiability of referencing the results obtained to surfaces of this type [75,76,77,78,79].
The process of soil drying is no more than the transfer of moisture from one medium to another (soil–air) [80]. The process begins when there is a demand for moisture in the atmosphere, when there is an influx of radiant energy to the ground surface, and when there is wind, which allows air mass exchange above the area where the process of evaporation takes place. In such a situation, the decrease of soil moisture is a function of factors occurring in the atmosphere. Soil evaporation models have been developed for many years, e.g., [81,82,83]. They are characterized by various degrees of complexity and various numbers of parameters. Wang et al. [81] proposed a normalized soil water index (NSWI) based on the water balance equation. Teng et al. [82] developed an analytical model consisting of three partial differential equations that respectively govern the vapor flow, liquid water flow, and heat transfer. Merlin et al. [83] proposed a model for soil evaporative efficiency (SEE) estimation defined as the ratio of actual to potential soil evaporation. According to Brutsaert [63], the soil drying process can be described as isothermal linear diffusion in a finite depth domain. The soil drying model proposed in this paper is based on the results of detailed long-term monitoring of the state of soil moisture as a function of agrometeorological factors represented by the single coefficient α .
It is also difficult to confront the results obtained in this study with those of other authors addressing similar subject matter, due to the fact that the estimation of the extent of soil drying is most frequently referenced to the commonly used indicators of meteorological drought [45,46,47]. A similar problem was also addressed by Miler et al. [84]. Their study on the change of volumetric moisture of soil under a forest in non-rainfall periods in the years 2013–2016 demonstrated an average decrease, without taking into account the duration of the dry spells, of approximately 40% at the depth of 85 cm. At greater depths, the observed changes were only slight. The results of the current study for a bare soil surface were different. In the current case, irrespective of the duration of dry spells, the average moisture decrease varied from 3% for 10-day dry spells to 10% for those lasting for 40 days. The most sensitive to the lack of rainfall are bare soil layers with a thickness down to 40 cm. The results of the analyses demonstrated that, after a dry spell lasting for only 10 days, the moisture decrease varied from 7% for the layer of 20–40 cm to 19% and 35%, respectively, for the adopted α coefficient for the layer of 0–10 cm, while a 40-day non-rainfall period caused soil moisture to decrease by 27% for the layer of 20–40 cm and 57% and 82%, respectively, for the layer of 0–10 cm (Table 12). According to the research of Flammini et al. [79] on the dynamics of evaporation in bare soil in dry summer periods, the initial soil moisture affects the drying process. Gomboš et al. [85] indicate, on the basis of simulated soil moisture values, that during non-rainfall periods, water retention in soil under vegetation cover largely depends on the value of actual evapotranspiration. The level of limitation of the process in dry spell conditions can be an indicator of the drying of the soil profile. Drying begins when water migration towards plant roots becomes reduced. The results, however, should also be referenced to a bare soil surface, as, depending on the plant species and the active depth of the root zone, the process of water loss in the form of evapotranspiration is strongly diversified in the period of vegetation. In contrast, as mentioned earlier, a bare soil surface, as a result of the process of evaporation, responds primarily to a lack of precipitation water influx. At the same time, surface dynamics are also dependent on the degree of saturation of the atmosphere layer close to soil surface with water vapor, and on the dynamics of the movement of air masses adjacent to the ground surface. This indicates the need for conducting the analyses discussed herein to acquire knowledge about other aspects of soil drought with the use of non-standard tools.
In this study, SMDS model verification was conducted with the use of independent data originating from the measurement point on the basis of which the model was created. This verification demonstrated, for a model based only on a number of consecutive days with no rainfall produced, an error of 8% in the surface horizon of the soil (0–10 cm). Furthermore, only in this zone can the potential effect of other factors (e.g., other meteorological elements, such as air temperature and humidity, wind, soil properties, and soil cultivation treatments) be discussed. In the deeper layers of the soil profile, the developed model produces errors in the range of 1–5%, which shows that potential inclusion of the abovementioned other factors does not have any justifiable significance. This regularity was supported by the results of verification conducted for two other independent locations (Section 3.4.2), with the exception of the surface horizon of the soil, with a depth of 0–10 cm. It should be emphasized that in the case of this layer, for which the process of soil drying is a function of factors occurring in the atmosphere, the developed model may have limited application and the obtained results may be affected by greater errors. The initiation of this process is possible only when the following conditions are met—there is a demand for moisture in the atmosphere (deficit of air humidity), there is an influx radiant energy to the ground surface (solar radiation), and there is wind, which stimulates the dynamics of air mass exchange over the area from which the process of evaporation takes place. It should be assumed that including these elements in the model would certainly improve the quality of the estimated decrease in soil moisture in this layer. On the other hand, the absence of a direct bond between the model and the local meteorological conditions enhances its universal character, at the expense of a small loss of accuracy, especially in the surface horizon of soil. However, from the viewpoint of agricultural cultivations, this layer is of slight importance, yet is nonetheless the most sensitive to the effect of external factors. The results of the verification also confirmed the correct behavior of the model for dry spells of longer duration.
The current authors recognize a number of potential modifications for improving the accuracy of the model, while taking into account the model’s fundamental purpose of being easy to use in operational conditions. Firstly, it is possible to determine the value of parameter α separately for every layer and for every month, which will make the model bigger and more complex. One can expect, however, that with such a treatment, the errors will be smaller than those obtained in the presented study, especially in the soil layer of 0–10 cm, which is exposed directly to the effect of meteorological factors. Another solution would be to adopt the assumption that the value of coefficient α also depends on the state of soil moisture on the first day of a dry spell. A third variant could take into account soil temperature as a secondary element of energy influx to the soil, with a significant effect on the rate of soil drying, especially at its surface horizon. Such methods of making the model more general could improve its accuracy.
The proposed SMDS model of the dynamics of soil moisture during dry spells, as opposed to dedicated soil drought indicators based on many meteorological elements, water balance, or evapotranspiration appears to be uncomplicated and with high application possibilities. It can be used to impart greater precision to models of water balance with various levels of complexity and is much easier to apply in agricultural practice.

5. Conclusions

The presented analyses, conducted on original and extensive measurement material containing information on non-rainfall periods and water resources of bare soil, permit the formulation of the following conclusions:
  • The analyses of observation materials and the calculations performed indicate that the exponential trend describes well the decrease of soil moisture during dry spells. Its goodness of fit decreases with increasing depth of measurement.
  • The coefficient of the moisture decrease rate α decreases with depth. Its greatest variation was noted for the depth of 10 cm, and with increasing depth, smaller oscillations of the coefficient were observed.
  • The developed Equation (6) allows determination of the duration of a dry spell after which the soil moisture will decrease to an expected value.
  • As a result of the analyses performed, satisfactory results were obtained at the stage of verification of the developed SMDS model using data originating from the same station as the data used for the determination of the parameters of the model. The mean relative error was 3.8%. It was found that the error of model fitting decreases with increasing depth, from 8.1% for the surface layer to 1.0% for the deepest soil layer, while increasing with the time of the dry spell duration at the rate of 0.5%/day.
  • The verification performed using the measurement material from Jelcz Laskowice and Baborówko also gave satisfactory results. In the case of the deeper soil horizons, the calculated values of MAPE% were less than 8%, and only in the layer of 0–10 cm did the error exceed the level of 30%. The results obtained support the possibility of using the SMDS model for other locations.
  • The method of estimation of SMDS model parameters developed in this study and described in detail herein can also be applied for other types of soil. The only condition is the availability of a several-year string of observations of diurnal totals of atmospheric precipitation and values of soil moisture at various depths.

Author Contributions

Conceptualization, M.B.-P., M.C. and A.Ż; methodology, M.B.-P., M.C. and A.Ż.; formal analysis, M.B.-P., M.C.; investigation, M.B.-P.; data curation, M.B.-P., M.C., A.D. and T.J.; writing—original draft preparation, M.B.-P. and M.C.; writing—review and editing, M.B.-P., M.C. and A.Ż.; visualization, M.B.-P. and M.C.; supervision, M.B.-P. All authors have read and agreed to the published version of the manuscript.

Funding

This study was conducted within the project “Technological innovations and system of monitoring, forecasting and planning of irrigation and drainage for precise water management on the scale of drainage/irrigation system (INOMEL)” under the BIOSTRATEG3 program, funded by the Polish National Centre for Research and Development, Contract No. BIOSTRATEG3/347837/11/NCBR/2017. The measurement of soil moisture conducted at Jelcz Laskowice and Baborówko were financed by the Ministry of Agriculture and Rural Development within the scope of the project “Agricultural Drought Monitoring System in Poland in the years 2007–2019”.

Acknowledgments

Meteorological data from the Faculty Observatory of Agro- and Hydrometeorology Wrocław-Swojec (WOAiHW-S) were used in this paper.

Conflicts of Interest

The authors declare no conflict of interest.

Appendix A

Table A1. Characteristics for each soil moisture drought adopted for analysis at the stage of model parameter determination.
Dry Spell (Days)CharacteristicsSoil Layer (cm)
0–1010–2020–4040–6060–8080–100
22SMb0.060.100.080.110.220.23
SM%30.9419.666.388.050.620.14
SM%/d1.410.890.290.370.030.01
11SMb0.110.090.230.200.260.37
SM%25.5325.5615.8011.112.050.36
SM%/d2.322.321.441.010.190.03
12SMb0.090.090.200.260.290.32
SM%15.2918.6011.225.732.102.18
SM%/d1.271.550.940.480.170.18
11SMb0.100.100.170.250.280.32
SM%27.0828.878.677.722.911.58
SM%/d2.462.620.790.700.260.14
11SMb0.060.090.090.140.250.29
SM%25.0010.235.757.616.531.74
SM%/d2.270.930.520.690.590.16
18SMb0.100.110.080.130.200.26
SM%30.6115.7412.2015.5612.062.69
SM%/d1.700.870.680.860.670.15
11SMb0.080.080.070.090.160.17
SM%11.6913.165.841.132.580.00
SM%/d1.061.200.530.100.230.00
10SMb0.080.080.070.090.150.17
SM%16.2512.995.972.333.330.00
SM%/d1.631.300.600.230.330.00
21SMb0.120.160.200.240.250.26
SM%46.0930.7721.4816.211.571.96
SM%/d2.191.471.020.770.070.09
10SMb0.070.130.100.140.230.28
SM%35.1433.3319.024.362.650.00
SM%/d3.513.331.900.440.270.00
10SMb0.330.290.290.280.250.26
SM%47.1138.1934.9010.918.3311.41
SM%/d4.713.823.491.090.831.14
10SMb0.250.230.230.250.240.26
SM%46.5336.4824.304.065.7612.55
SM%/d4.653.652.430.410.581.25
14SMb0.120.140.160.240.230.24
SM%22.5016.3113.419.264.372.10
SM%/d1.611.170.960.660.310.15
12SMb0.090.090.100.130.140.17
SM%24.4425.5312.955.121.423.55
SM%/d2.042.131.080.430.120.30
16SMb0.060.060.080.080.130.16
SM%16.138.934.733.665.3018.47
SM%/d1.010.560.300.230.331.15
11SMb0.070.090.070.080.180.20
SM%45.7717.124.553.202.581.54
SM%/d4.161.560.410.290.230.14
12SMb0.040.060.110.140.130.17
SM%43.9310.293.134.404.646.55
SM%/d3.660.860.260.370.390.55
10SMb0.070.130.130.100.160.23
SM%40.0018.662.874.042.74−0.88
SM%/d4.001.870.290.400.27−0.09
11SMb0.100.060.130.140.160.17
SM%33.00−3.890.802.923.51−1.93
SM%/d3.00−0.350.070.270.32−0.18
16SMb0.090.060.120.130.150.17
SM%32.273.230.542.512.830.58
SM%/d2.020.200.030.160.180.04
11SMb0.090.060.140.150.230.29
SM%44.7912.504.333.452.453.29
SM%/d4.071.140.390.310.220.30
11SMb0.060.050.130.140.220.28
SM%35.945.163.757.093.621.05
SM%/d3.270.470.340.640.330.10
12SMb0.080.130.120.090.150.22
SM%38.2216.270.562.300.910.47
SM%/d3.191.360.050.190.080.04
12SMb0.090.060.120.160.220.23
SM%20.455.17−1.61−1.27−0.461.32
SM%/d1.700.43−0.13−0.11−0.040.11
12SMb0.070.070.180.210.250.26
SM%10.7711.594.527.110.00−1.54
SM%/d0.900.970.380.590.00−0.13
11SMb0.060.060.170.190.250.26
SM%5.173.392.984.150.00−0.38
SM%/d0.470.310.270.380.00−0.03
16SMb0.100.100.110.170.250.28
SM%13.689.906.057.046.850.71
SM%/d0.860.620.380.440.430.04
14SMb0.130.150.160.220.210.24
SM%20.6117.1210.094.332.340.85
SM%/d1.471.220.720.310.170.06
10SMb0.090.090.100.130.160.17
SM%12.7915.734.063.122.582.87
SM%/d1.281.570.410.310.260.29
27SMb0.060.050.080.070.120.10
SM%8.478.003.731.353.486.00
SM%/d0.310.300.140.050.130.22
13SMb0.040.090.100.120.110.16
SM%34.8811.76−1.68−1.34−2.6319.75
SM%/d2.680.90−0.13−0.10−0.201.52
10SMb0.070.060.120.130.140.17
SM%13.302.210.820.000.69−0.60
SM%/d1.330.220.080.000.07−0.06
17SMb0.080.070.130.130.210.28
SM%28.2935.210.522.290.640.48
SM%/d1.662.070.030.130.040.03
11SMb0.080.060.120.160.220.22
SM%12.66−5.45−0.810.640.462.27
SM%/d1.15−0.50−0.070.060.040.21
12SMb0.150.190.230.240.280.27
SM%35.1728.0418.795.22−1.082.58
SM%/d2.932.341.570.43−0.090.22
12SMb0.090.130.170.220.270.26
SM%11.6311.026.714.133.750.00
SM%/d0.970.920.560.340.310.00
38SMb0.120.120.110.160.230.29
SM%31.7122.038.293.484.805.23
SM%/d0.830.580.220.090.130.14
14SMb0.100.110.110.150.200.18
SM%26.2129.9112.8313.38−14.294.42
SM%/d1.872.140.920.96−1.020.32
11SMb0.060.050.080.070.110.10
SM%1.822.131.271.350.893.09
SM%/d0.170.190.120.120.080.28
AverageSM%26.2015.937.695.072.382.99
SM%/d2.101.260.620.390.190.23
SMb—soil moisture on the 1st day of dry spell; SM%—% decrease of soil moisture relative to the initial value; SM%/d—% decrease of soil moisture per day.

References

  1. Daniels, E.E.; Hutjes, R.W.A.; Lenderink, G.; Ronda, R.J.; Holtslag, A.A.M. Land Surface Feedbacks on Spring Precipitation in the Netherlands. J. Hydrometeorol. 2015, 16, 232–243. [Google Scholar] [CrossRef]
  2. Schwingshackl, C.; Hirschi, M.; Seneviratne, S.I. Quantifying Spatiotemporal Variations of Soil Moisture Control on Surface Energy Balance and Near-Surface Air Temperature. J. Clim. 2017, 30, 7105–7124. [Google Scholar] [CrossRef]
  3. Castelli, G.; Castelli, F.; Bresci, E. Mesoclimate regulation induced by landscape restoration and water harvesting in agroecosystems of the horn of Africa. Agric. Ecosyst. Environ. 2019, 275, 54–64. [Google Scholar] [CrossRef]
  4. Hauser, M.; Orth, R.; Seneviratne, S.I. Role of soil moisture versus recent climate change for the 2010 heat wave in western Russia. Geophys. Res. Lett. 2016, 43, 2819–2826. [Google Scholar] [CrossRef] [Green Version]
  5. Seneviratne, S.I.; Corti, T.; Davin, E.L.; Hirschi, M.; Jaeger, E.B.; Lehner, I.; Orlowsky, B.; Teuling, A.J. Investigating soil moisture–climate interactions in a changing climate: A review. Earth Sci. Rev. 2010, 99, 125–161. [Google Scholar] [CrossRef]
  6. Zhu, B.; Xie, X.; Meng, S.; Lu, C.; Yao, Y. Sensitivity of soil moisture to precipitation and temperature over China: Present state and future projection. Sci. Total Environ. 2020, 705, 135774. [Google Scholar] [CrossRef]
  7. Biniak-Pieróg, M. Monitoring of Atmospheric Precipitation and Soil Moisture as Basis for the Estimation of Effective Supply of Soil Profile with Water; Editorial Office of Wrocław University of Environmental and Life Sciences: Wrocław, Poland, 2017; ISBN 978-83-7717-277-3. (In Polish) [Google Scholar]
  8. Parent, A.-C.; Anctil, F.; Parent, L.-É. Characterization of temporal variability in near-surface soil moisture at scales from 1 h to 2 weeks. J. Hydrol. 2006, 325, 56–66. [Google Scholar] [CrossRef]
  9. Zhang, Y.; Liu, J.; Xu, X.; Tian, Y.; Li, Y.; Gao, Q. The response of soil moisture content to rainfall events in semi-arid area of Inner Mongolia. Procedia Environ. Sci. 2010, 2, 1970–1978. [Google Scholar] [CrossRef] [Green Version]
  10. Fu, Q.; Feng, S. Responses of terrestrial aridity to global warming. J. Geophys. Res. 2014, 119, 7863–7875. [Google Scholar] [CrossRef]
  11. Langridge, R.; Fencl, A. Implications of Climate Change to Groundwater; Elsevier: Toronto, ON, Canada, 2019; ISBN 978-0-12-409548-9. [Google Scholar]
  12. Koutroulis, A.G. Dryland changes under different levels of global warming. Sci. Total Environ. 2019, 655, 482–511. [Google Scholar] [CrossRef]
  13. Girotto, M.; Rodell, M. Chapter Two—Terrestrial water storage. In Extreme Hydroclimatic Events and Multivariate Hazards in a Changing Environment: A Remote Sensing Approach; Maggioni, V., Massari, C., Eds.; Elsevier: Amsterdam, The Netherlands, 2019; pp. 41–64. ISBN 978-0-12-814899-0. [Google Scholar]
  14. Giorgi, F.; Coppola, E.; Raffaele, F. A consistent picture of the hydroclimatic response to global warming from multiple indices: Models and observations. J. Geophys. Res. Atmos. 2014, 119, 11695–11708. [Google Scholar] [CrossRef]
  15. Huang, J.; Yu, H.; Guan, X.; Wang, G.; Guo, R. Accelerated dryland expansion under climate change. Nat. Clim. Chang. 2015, 6, 166–171. [Google Scholar] [CrossRef]
  16. Grillakis, M.G. Increase in severe and extreme soil moisture droughts for Europe under climate change. Sci. Total Environ. 2019, 660, 1245–1255. [Google Scholar] [CrossRef] [PubMed]
  17. Łabędzki, L. Agricultural Droughts. An Outline of Problems and Methods of Monitoring and Classification; Editoral Office of IMUZ: Falenty, Poland, 2006; ISBN 83-88763-63-6. [Google Scholar]
  18. Przybylak, R.; Oliński, P.; Koprowski, M.; Filipiak, J.; Pospieszyńska, A.; Chorążyczewski, W.; Puchałka, R.; Dąbrowski, H.P. Droughts in the area of Poland in recent centuries in the light of multi-proxy data. Clim. Past 2020, 16, 627–661. [Google Scholar] [CrossRef] [Green Version]
  19. Liu, Y.; Cui, Z.; Huang, Z.; López-Vicente, M.; Wu, G.-L. Influence of soil moisture and plant roots on the soil infiltration capacity at different stages in arid grasslands of China. CATENA 2019, 182, 104147. [Google Scholar] [CrossRef]
  20. Darvishan, A.K.; Banasik, K.; Sadeghi, S.H.; Gholami, L.; Hejduk, L. Effects of rain intensity and initial soil moisture on hydrological responses in laboratory conditions. Int. Agrophysics 2015, 29, 165–173. [Google Scholar] [CrossRef]
  21. Dos Santos, J.C.N.; de Andrade, E.M.; Guerreiro, M.J.S.; Medeiros, P.H.A.; de Queiroz Palácio, H.A.; de Araújo Neto, J.R. Effect of dry spells and soil cracking on runoff generation in a semiarid micro watershed under land use change. J. Hydrol. 2016, 541, 1057–1066. [Google Scholar] [CrossRef]
  22. Szulczewski, W.; Żyromski, A.; Biniak-Pieróg, M.; Machowczyk, A. Modelling of the effect of dry periods on yielding of spring barley. Agric. Water Manag. 2010, 97, 587–595. [Google Scholar] [CrossRef]
  23. Szulczewski, W.; Zyromski, A.; Biniak-Pieróg, M. New approach in modeling spring wheat yielding based on dry periods. Agric. Water Manag. 2012, 103, 105–113. [Google Scholar] [CrossRef]
  24. Żyromski, A.; Szulczewski, W.; Biniak-Pieróg, M.; Zmuda, R. Application of the MoDrY model for the estimation of potato yielding. Int. J. Plant Prod. 2013, 7, 505–516. [Google Scholar]
  25. Łabędzki, L. Estimation of local drought frequency in central Poland using the standardized precipitation index SPI. Irrig. Drain. 2007, 56, 67–77. [Google Scholar] [CrossRef]
  26. Ziernicka-Wojtaszek, A. Comparison of selected indices for the assessment of atmospheric drought in the Podkarpackie Province in the years 1901–2000. Water Environ. Rural Areas 2012, 12, 365–376. [Google Scholar]
  27. Łabędzki, L.; Bąk, B. Meteorological and agricultural drought indices used in drought monitoring in Poland: A review. Meteorol. Hydrol. Water Manag. 2015, 2, 3–14. [Google Scholar] [CrossRef] [Green Version]
  28. Radzka, E. Periods of days without precipitation during the growing season in central-eastern Poland (1971–2005). Acta Agrophys. 2014, 21, 483–491. [Google Scholar]
  29. Wójcik, K.; Treder, W.; Zbudniewek, A. Estimation of plant water requirements during sequences of days without precipitation in 2011–2015. Infrastruct. Ecol. Rural Areas 2017, 3, 1187–1200. [Google Scholar] [CrossRef]
  30. Szyga-Pluta, K. Variability of drought occurrence during growing season in Poland in years 1966–2015. Przegląd Geofiz. 2018, 63, 51–67. [Google Scholar]
  31. Biniak-Pieróg, M. Occuarance of atmospheric drought in summer half-year in Wroclaw–Swojec during years 1961–2010. Infrastruct. Ecol. Rural Areas 2014, 3, 945–957. [Google Scholar]
  32. Żyromski, A.; Biniak-Pierog, M.; Szumiejko, F. Spring Drought Estimation in a Point Scale. In Crisis Management—Restricting the Negative Effects of Extreme Phenomena; University of Opole: Opole, Poland, 2010; pp. 197–210. [Google Scholar]
  33. Karavitis, C.A.; Alexandris, S.; Tsesmelis, D.E.; Athanasopoulos, G. Application of the Standardized Precipitation Index (SPI) in Greece. Water Switz. 2011, 3, 787–805. [Google Scholar] [CrossRef]
  34. Caloiero, T. SPI Trend Analysis of New Zealand Applying the ITA Technique. Geosciences 2018, 8, 101. [Google Scholar] [CrossRef] [Green Version]
  35. Jang, D. Assessment of Meteorological Drought Indices in Korea Using RCP 8.5 Scenario. Water 2018, 10, 283. [Google Scholar] [CrossRef] [Green Version]
  36. Merabti, A.; Martins, D.S.; Meddi, M.; Pereira, L.S. Spatial and time variability of drought based on SPI and RDI with various time scales. Water Resour. Manag. 2018, 32, 1087–1100. [Google Scholar] [CrossRef]
  37. Šebenik, U.; Brilly, M.; Šraj, M. Drought analysis using the standardized precipitation index (SPI). Acta Geogr. Slov. 2017, 57, 31–49. [Google Scholar] [CrossRef] [Green Version]
  38. Bayissa, Y.; Maskey, S.; Tadesse, T.; van Andel, S.J.; Moges, S.; van Griensven, A.; Solomatine, D. Comparison of the performance of six drought indices in characterizing historical drought for the upper Blue Nile Basin, Ethiopia. Geoscience 2018, 8, 81. [Google Scholar] [CrossRef] [Green Version]
  39. Cammalleri, C.; Micale, F.; Vogt, J. A novel soil moisture-based drought severity index (DSI) combining water deficit magnitude and frequency. Hydrol. Process. 2016, 30, 289–301. [Google Scholar] [CrossRef] [Green Version]
  40. Narasimhan, B.; Srinivasan, R. Development and evaluation of Soil Moisture Deficit Index (SMDI) and Evapotranspiration Deficit Index (ETDI) for agricultural drought monitoring. Agric. For. Meteorol. 2005, 133, 69–88. [Google Scholar] [CrossRef]
  41. Palmer, W.C. Meteorological Drought. Research Paper No. 45; U.S. Department of Commerce, Weather Bureau: Washington, DC, USA, 1965.
  42. Yu, H.; Zhang, Q.; Xu, C.Y.; Du, J.; Sun, P.; Hu, P. Modified Palmer Drought Severity Index: Model improvement and application. Environ. Int. 2019, 130, 104951. [Google Scholar] [CrossRef]
  43. Rossato, L.; Marengo, J.A.; de Angelis, C.F.; Pires, L.B.M.; Mendiondo, E.M. Impact of soil moisture over Palmer Drought Severity Index and its future projections in Brazil. Braz. J. Water Resour. 2017, 22, 1–16. [Google Scholar] [CrossRef] [Green Version]
  44. Wu, W.; Geller, M.A.; Dickinson, R.E. The response of soil moisture to long-term variability of precipitation. J. Hydrometeorol. 2002, 3, 604–613. [Google Scholar] [CrossRef]
  45. Huang, S.; Huang, Q.; Chang, J.; Leng, G.; Xing, L. The response of agricultural drought to meteorological drought and the influencing factors: A case study in the Wei River Basin, China. Agric. Water Manag. 2015, 159, 45–54. [Google Scholar] [CrossRef]
  46. Gwak, Y.S.; Kim, Y.T.; Won, C.H.; Kim, S.H. The relationships between drought indices (SPI, API) and in-situ soil moisture in forested hillslopes. WIT Trans. Ecol. Environ. 2017, 220, 217–224. [Google Scholar] [CrossRef] [Green Version]
  47. Halwatura, D.; McIntyre, N.; Lechner, A.M.; Arnold, S. Capability of meteorological drought indices for detecting soil moisture droughts. J. Hydrol. Reg. Stud. 2017, 12, 396–412. [Google Scholar] [CrossRef]
  48. Sheffield, J.; Goteti, G.; Wen, F.; Wood, E.F. A simulated soil moisture based drought analysis for the United States. J. Geophys. Res. D Atmos. 2004, 109, D24108. [Google Scholar] [CrossRef]
  49. Sheffield, J.; Wood, E.F. Global trends and variability in soil moisture and drought characteristics, 1950–2000, from observation-driven simulations of the terrestrial hydrologic cycle. J. Clim. 2008, 21, 432–458. [Google Scholar] [CrossRef] [Green Version]
  50. Kim, E.S. Simulation of daily soil moisture content and reconstruction of drought events from the early 20th century in Seoul, Korea, using a hydrological simulation model, BROOK. J. Ecol. F. Biol. 2010, 33, 47–57. [Google Scholar] [CrossRef] [Green Version]
  51. Leeper, R.D.; Bell, J.E.; Vines, C.; Palecki, M. An evaluation of the North American Regional Reanalysis simulated soil moisture conditions during the 2011–2013 drought period. J. Hydrometeorol. 2017, 18, 515–527. [Google Scholar] [CrossRef]
  52. Sánchez, N.; González-Zamora, Á.; Piles, M.; Martínez-Fernández, J. A New Soil Moisture Agricultural Drought Index (SMADI) integrating MODIS and SMOS products: A case of study over the Iberian Peninsula. Remote Sens. 2016, 8, 287. [Google Scholar] [CrossRef] [Green Version]
  53. Keshavarz, M.R.; Vazifedoust, M.; Alizadeh, A. Drought monitoring using a Soil Wetness Deficit Index (SWDI) derived from MODIS satellite data. Agric. Water Manag. 2014, 132, 37–45. [Google Scholar] [CrossRef]
  54. Carrão, H.; Russo, S.; Sepulcre-Canto, G.; Barbosa, P. An empirical standardized soil moisture index for agricultural drought assessment from remotely sensed data. Int. J. Appl. Earth Obs. Geoinf. 2016, 48, 74–84. [Google Scholar] [CrossRef]
  55. Srivastava, P.K.; Pandey, P.C.; Petropoulos, G.P.; Kourgialas, N.N.; Pandey, V.; Singh, U. GIS and Remote Sensing Aided Information for Soil Moisture Estimation: A Comparative Study of Interpolation Techniques. Resources 2019, 8, 70. [Google Scholar] [CrossRef] [Green Version]
  56. Blyverket, J.; Hamer, P.D.; Schneider, P.; Albergel, C.; Lahoz, W.A. Monitoring Soil Moisture Drought over Northern High Latitudes from Space. Remote Sens. 2019, 11, 1200. [Google Scholar] [CrossRef] [Green Version]
  57. Suzuki, K.; Matsuo, K.; Yamazaki, D.; Ichii, K.; Iijima, Y.; Papa, F.; Yanagi, Y.; Hiyama, T. Hydrological Variability and Changes in the Arctic Circumpolar Tundra and the Three Largest Pan-Arctic River Basins from 2002 to 2016. Remote Sens. 2018, 10, 402. [Google Scholar] [CrossRef] [Green Version]
  58. Riordan, B.; Verbyla, D.; McGuire, A.D. Shrinking ponds in subarctic Alaska based on 1950–2002 remotely sensed images. J. Geophys. Res. Biogeosci. 2006, 111. [Google Scholar] [CrossRef]
  59. Biniak-Pieróg, M. Dynamics of water content in light bare soil in summer half-year in the period of 2003-2012 and its agro-meteorological determinants. J. Water Land Dev. 2014, 22, 41–50. [Google Scholar] [CrossRef]
  60. Gao, L.; Shi, B.; Tang, C.; Gu, K. Variation of soil moisture under bare soil, grass and concrete covers. Electron. J. Geotech. Eng. 2014, 19, 3495–3505. [Google Scholar]
  61. Novak, M.D. Dynamics of the near-surface evaporation zone and corresponding effects on the surface energy balance of a drying bare soil. Agric. For. Meteorol. 2010, 150, 1358–1365. [Google Scholar] [CrossRef]
  62. Wang, T.; Singh, S.K.; Bárdossy, A. On the use of the critical event concept for quantifying soil moisture dynamics. Geoderma 2019, 335, 27–34. [Google Scholar] [CrossRef]
  63. Brutsaert, W. Daily evaporation from drying soil: Universal parameterization with similarity. Water Resour. Res. 2014, 50, 3206–3215. [Google Scholar] [CrossRef]
  64. IUSS Working Group WRB. World Reference Base for Soil Resources 2006; World Soil Resources Reports No. 103; FAO: Rome, Italy, 2006. [Google Scholar]
  65. Żyromski, A.; Biniak-Pierog, M.; Szulczewski, W.; Kordas, L.; Kabała, C.; Gałka, B. Mathematical Modelling of Evapotranspiration of Selected Energy Crops; Wyd. UP we Wrocławiu: Wrocław, Poland, 2016; ISBN 978-83-7717-253-7. [Google Scholar]
  66. World Meteorological Organisation. Guide to Meteorological Instruments and Methods of Observation, 7th ed.; World Meteorological Organisation: Geneva, Switzerland, 2008. [Google Scholar]
  67. IMGW. Monthly Agrometeorological Review, 1975–2000; IMGW: Warszawa, Poland, 2000. [Google Scholar]
  68. Topp, G.C.; Davis, J.L.; Annan, A.P. Electromagnetic determination of soil water content: Measurements in coaxial transmission lines. Water Resour. Res. 1980, 16, 574–582. [Google Scholar] [CrossRef] [Green Version]
  69. Skierucha, W.; Sławiński, C.; Wilczek, A.; Żyromski, A.; Biniak-Pierog, M. Telemetric system for the measurement of soil moisture based on the TDR technique. Water Environ. Rural Areas 2012, 12, 257–267. [Google Scholar]
  70. Susha Lekshmi, S.U.; Singh, D.N.; Shojaei Baghini, M. A critical review of soil moisture measurement. Measurement 2014, 54, 92–105. [Google Scholar] [CrossRef]
  71. Skierucha, W.; Wilczek, A.; Szypłowska, A.; Sławiński, C.; Lamorski, K. A TDR-based soil moisture monitoring system with simultaneous measurement of soil temperature and electrical conductivity. Sens. Switz. 2012, 12, 13545–13566. [Google Scholar] [CrossRef] [PubMed]
  72. Schmuck, A. Dry spells and high atmospheric precipitation in the Wrocław voivodship in 1950–1959. Geogr. J. 1962, 33, 411–440. [Google Scholar]
  73. ADMS—Soil Categories. Available online: http://www.susza.iung.pulawy.pl/en/kategorie/ (accessed on 14 June 2020).
  74. Doroszewski, A.; Jadczyszyn, J.; Kozyra, J.; Pudełko, R.; Stuczyński, T.; Mizak, K.; Łopatka, A.; Kozyra, P.; Górski, T.; Wróblewska, E. Fundamentals of the Agricultural Drought Monitoring System. Water Environ. Rural Areas 2012, 12, 77–91. [Google Scholar]
  75. Aydin, M.; Yang, S.L.; Kurt, N.; Yano, T. Test of a simple model for estimating evaporation from bare soils in different environments. Ecol. Modell. 2005, 182, 91–105. [Google Scholar] [CrossRef]
  76. Babaeian, E.; Homaee, M.; Montzka, C.; Vereecken, H.; Norouzi, A.A.; van Genuchten, M.T. Soil moisture prediction of bare soil profiles using diffuse spectral reflectance information and vadose zone flow modeling. Remote Sens. Environ. 2016, 187, 218–229. [Google Scholar] [CrossRef]
  77. Gorrab, A.; Simonneaux, V.; Zribi, M.; Saadi, S.; Baghdadi, N.; Lili Chabaane, Z.; Fanise, P. Bare soil hydrological balance model “MHYSAN”: Calibration and validation using SAR moisture products and continuous thetaprobe network measurements over bare agricultural soils (Tunisia). J. Arid Environ. 2017, 139, 11–25. [Google Scholar] [CrossRef] [Green Version]
  78. Quinn, R.; Parker, A.; Rushton, K. Evaporation from bare soil: Lysimeter experiments in sand dams interpreted using conceptual and numerical models. J. Hydrol. 2018, 564, 909–915. [Google Scholar] [CrossRef]
  79. Flammini, A.; Corradini, C.; Morbidelli, R.; Saltalippi, C.; Picciafuoco, T.; Giráldez, J.V. Experimental Analyses of the Evaporation Dynamics in Bare Soils under Natural Conditions. Water Resour. Manag. 2018, 32, 1153–1166. [Google Scholar] [CrossRef]
  80. Alvenäs, G.; Jansson, P.-E. Model for evaporation, moisture and temperature of bare soil: Calibration and sensitivity analysis. Agric. For. Meteorol. 1997, 88, 47–56. [Google Scholar] [CrossRef]
  81. Wang, Y.; Magliulo, V.; Yan, W.; Shangguan, Z. Assessing land surface drying and wetting trends with a normalized soil water index on the Loess Plateau in 2001–2016. Sci. Total Environ. 2019, 676, 120–130. [Google Scholar] [CrossRef]
  82. Teng, J.; Zhang, X.; Zhang, S.; Zhao, C.; Sheng, D. An analytical model for evaporation from unsaturated soil. Comput. Geotech. 2019, 108, 107–116. [Google Scholar] [CrossRef]
  83. Merlin, O.; Olivera-Guerra, L.; Aït Hssaine, B.; Amazirh, A.; Rafi, Z.; Ezzahar, J.; Gentine, P.; Khabba, S.; Gascoin, S.; Er-Raki, S. A phenomenological model of soil evaporative efficiency using surface soil moisture and temperature data. Agric. For. Meteorol. 2018, 256–257, 501–515. [Google Scholar] [CrossRef] [Green Version]
  84. Miler, A.T.; Urbaniak, M.; Krysztofiak-Kaniewska, A. Changes of soil moisture in the unsaturated zone during rainless periods in the Martew Forest Area. Infrastruct. Ecol. Rural Areas 2017, 2, 631–644. [Google Scholar]
  85. Gomboš, M.; Kandra, B.; Tall, A.; Pavelková, D. Analysis of non-rainfall periods and their impacts on the soil water regime. In Hydrology—The Science of Water; IntechOpen: London, UK, 2019; p. 20. [Google Scholar]
Figure 1. Location of the Faculty Agro and Hydrometeorology Observatory, Wrocław University of Environmental and Life Sciences, and stations used for additional verification: Jelcz Laskowice and Baborówko.
Resources 09 00085 g001
Figure 2. Agrometeorological characterization (air temperature, tp; precipitation, P; ground water level, Wg) of the summer half-year in the years 2003–2019 in relation to the normative multi-year period of 1971–2000.
Resources 09 00085 g002
Figure 3. Measurement of soil moisture with the use of TDR/MUX/mpts and MIDL_GPRS data acquisition loggers at the Faculty Agro and Hydrometeorology Observatory.
Resources 09 00085 g003
Figure 4. Histogram of dry spell duration.
Resources 09 00085 g004
Figure 5. Decrease of soil moisture on consecutive days and sequential soil layers for an exemplary dry spell lasting 18 days.
Resources 09 00085 g005
Figure 6. Fluctuation of coefficient α at the adopted soil layers: (a) 0–10, 10–20, 20–40 cm; (b) 40–60, 60–80, 80–100 cm.
Resources 09 00085 g006
Figure 7. Dependences between the measured and calculated values of soil moisture for the verified years 2016–2019 for Wrocław.
Resources 09 00085 g007
Figure 8. Variability of relative errors R e = C a l O b s O b s   ·   100 % with time for verified dry spells for Wrocław.
Resources 09 00085 g008
Figure 9. Relationship between measured and calculated values of soil moisture for the verified years 2009–2019 for Jelcz Laskowice.
Resources 09 00085 g009
Figure 10. Relationship between measured and calculated values of soil moisture for the verified years 2009–2019 for Baborówko.
Resources 09 00085 g010
Table 1. Particle size distribution (PSD) of the soils in the area of the observatory [65].
DepthPercentage Share of Fraction With Diameter (mm)PSD Group
cm>22.0–1.01.0–0.50.5–0.250.25–0.10.1–0.050.05–0.020.02–0.002<0.002
0–2802823428872loamy sand
28–39019244361061loamy sand
39–77029204811631weakly-loamy sand
77–106021633432211loose sand
106–122241723423119loose sand
122–150215183577918sandy loam
Table 2. Extreme and average values of soil moisture in summer half-years in the period of 2003–2019.
Soil Depth (cm)
0–1010–2020–4040–6060–8080–100
2003min0.0220.0450.052 *0.062 *0.0850.102
max0.0780.0910.0840.0930.1240.185
average0.0470.0630.066 *0.073 *0.1020.122
2004min0.019 *0.035 *0.0620.0870.0870.101
max0.0800.0830.1160.1640.1690.209
average0.038 *0.053 *0.0870.1110.1200.136
2005min0.0220.0450.0910.1030.1140.124
max0.1340.1010.1330.1570.1710.215
average0.0580.0660.1030.1220.1370.159
2006min0.0350.0390.0780.0870.1070.128
max0.1580.1020.1650.1770.1980.232
average0.0650.0610.1020.1150.1410.171
2007min0.0330.0700.0960.0920.1040.126
max0.1090.1310.1410.1370.1550.182
average0.0550.0890.1110.1080.1220.145
2008min0.0620.0600.0920.1130.1380.153
max0.1160.1010.1520.1900.2140.235
average0.0760.0720.1050.1310.1580.179
2009min0.0540.0550.1080.1330.1610.181
max0.2160.2800.2670.2570.2550.258
average0.0860.0900.1420.1670.1870.202
2010min0.0570.0740.1100.1320.1580.176
max0.3090.2960.2810.2700.2730.272
average0.1000.1180.1510.1710.1910.204
2011min0.0420.0610.0650.0880.1200.152
max0.1830.1970.3150.2960.2990.299
average0.0860.0970.0950.1210.1530.179
2012min0.0650.0610.0720.0780.0970.118
max0.1610.1570.1290.1350.1540.176
average0.0800.0780.0830.0870.1070.133
2013min0.0700.0720.0830.0910.1290.154
max0.329 *0.309 *0.321 *0.328 *0.310 *0.305 *
average0.124 *0.135 *0.152 *0.177*0.1870.197
2014min0.0660.0680.0760.0890.1010.111
max0.1030.1070.1090.1240.1620.172
average0.0810.0820.0880.1010.1140.125
2015min0.0510.0500.0620.0670.0780.081 *
max0.1400.0950.0890.0850.0980.112
average0.0660.0630.0700.0730.087 *0.097 *
2016min0.0510.0520.0580.0660.072 *0.108
max0.0840.0820.0880.1320.1600.188
average0.0660.0650.0700.0990.1160.144
2017min0.0530.0710.0630.0930.1680.235
max0.1020.1220.1000.1610.2490.275
average0.0650.0900.0810.1170.2130.260
2018min0.0640.0610.1010.1280.1750.177
max0.1540.1410.1390.1650.2430.256
average0.0850.0930.1080.1410.2020.221
2019min0.0760.0760.0890.1390.1930.204
max0.1700.1400.1570.2240.2580.245
average0.1090.0960.1070.1590.215 *0.225
* absolute values.
Table 3. Number of dry spells in particular months of the summer half-year.
MonthsVVIVIIVIIIIXX
Number of dry spells8433129
Table 4. Average values and standard deviations of SM% and SM%/d for the analyzed soil depths.
Soil Layer (cm)0–1010–2020–4040–6060–8080–100
SM%26.2015.937.695.072.382.99
SM%/d2.101.260.620.390.190.23
St. dev SM%12.6210.937.774.083.804.78
St. dev SM%/d1.200.990.720.290.280.38
Table 5. Mean values of r for the adopted soil depths and the statistics of the student’s t-test used for testing the significance of the coefficient of correlation.
Soil Layer (cm)0–1010–2020–4040–6060–8080–100Average
Correlation coefficient r0.660.480.410.310.410.460.46
Student’s t-test4.222.371.731.211.801.912.21
Table 6. Values of the coefficient α at subsequent measuring depths.
Soil Layer (cm) Variability of Coefficient α Mean Values of Coefficient α
0–100.02–0.08 (VI–VIII)0.0426
<0.03 (V, IX, X)0.0208
10–200.01–0.03 (VI 0.055)0.0159
20–40<0.01 (VI 0.055)0.0077
40–60<0.010.0045
60–80<0.010.0027
80–100<0.010.0025
Table 7. Mean values of correlation coefficient r between the model and the measured values and standard deviations with the adopted soil depth.
Soil Layer (cm)0–1010–2020–4040–6060–8080–100
Correlation coefficient r0.890.870.780.810.750.60
Standard deviation0.190.280.320.300.310.33
Table 8. Detailed results of parameter α identification and approximation errors.
Soil Layer (cm)0–1010–2020–4040–6060–8080–100
α 0.0208 (V, IX, X)0.01590.00770.00450.00270.0025
0.0426 (VI–VIII)
r0.8920.8660.7820.8060.7460.601
MAPE (%)2.9361.3640.7770.5510.5260.837
RMSE0.0030.0020.0010.0010.0010.002
Table 9. Variability of MAPE (%) and parameters of regression and correlation with depths for verified dry spells for Wrocław.
Soil Layer (cm)0–1010–2020–4040–6060–8080–100Mean
MAPE (%)8.15.33.73.02.11.03.8
a1.131.091.061.091.091.041.08
b−0.01−0.01−0.00−0.01−0.01−0.01−0.01
r20.830.930.910.950.980.990.93
a, b—parameters of regression line Cal = a × Obs + b; Cal—calculated moisture; Obs—measured moisture; r2—square of correlation coefficient.
Table 10. Soil moisture values with depths on the 15th and 16th of September 2016.
Day0–10 cm10–20 cm20–40 cm40–60 cm60–80 cm80–100 cm
15 September 20160.0630.0560.0720.1400.1460.222
16 September 20160.0510.0550.0720.1240.1460.220
Table 11. Variability of MAPE (%) and parameters of regression and correlation with depths for verified dry spells for Jelcz Laskowice and Baborówko.
Soil Layer (cm)0–1010–2020–4040–6060–8080–100Mean
Laskowice MAPE (%)27.77.53.42.6-2.28.7
a0.890.980.980.97-0.769.92
b0.020.000.000.00-0.000.00
r20.750.930.980.96-0.740.87
Baborówko MAPE (%)37.516.68.44.2-3.514.4
a0.850.920.910.92-0.890.90
b0.030.020.020.02-0.040.03
r20.750.780.900.91-0.840.84
a, b—parameters of regression line; Cal = a × Obs + b; Cal—calculated moisture; Obs—measured moisture; r2—square of correlation coefficient.
Table 12. Prediction of soil moisture (%) depending on time and soil layer.
α 0.02080.04260.01590.00770.00450.00270.0025
Time (Day)Soil Layer (cm)
0–100–1010–2020–4040–6060–8080–100
0 d100100100100100100100
10 d81658593969798
15 d73537989939696
20 d66437386919595
25 d60346782899494
30 d54286279879293
35 d48225776859192
40 d43185373849091
Table 13. Time (days) required to achieve values of soil moisture θ at the adopted soil layers.
Soil Layer (cm) α θ / θ 0 (%)
9080706050
0–100.0208510172433
0–100.04262581116
10–200.0159614223243
20–400.00771328466690
40–600.0045234979113154
60–800.00273982132189256
80–1000.00254289142204277

