1. Introduction
Waste management is a complex process, in particular during a waste crisis, and requires proper handling. The interactions among its main elements and their evolution over time require adequate analysis tools and systemic approaches that can support policy decisions by providing a comprehensive representation of those systems [
1].
The current EU policy on waste is outlined in the context of the Waste Framework Directive [
2], which lays down measures to protect the environment and human health by preventing or reducing the adverse impacts of the generation and management of waste and by reducing overall impacts of resource use and improving the efficiency of such use (Art. 1). The Directive introduces also the concept of waste hierarchy, the definition of which should be the basis for the prioritisation of waste-management options. Although the waste hierarchy is a sound theoretical principle regarding the handling of some waste streams, in practice the selection of specific waste management solutions should be tested and validated by using life-cycle assessment (LCA) and cost-benefit or cost-effectiveness indicators [
3,
4,
5] to ensure the overall sustainability and viability of the selected system. Also, Article 4(2) of the Waste Framework Directive allows deviations from the waste hierarchy where this is justified by LCA results.
Waste legislation is closely interlinked with circular economy (CE) concepts, which are promoted at European level through the Circular Economy Package, adopted by the European Commission in 2015, including legislative proposals and other initiatives [
6].
This implies the definition, on the one side, of proper waste management plans starting from local and small scales [
7,
8] up to national and international levels and, on the other side, of consistent methodologies for the environmental assessment of new technologies and practices for waste management and emissions prevention and reduction [
9,
10,
11,
12].
Under normal conditions, according to the waste hierarchy and to CE concepts, besides prevention, recycling ranks higher than incineration with energy recovery, while landfilling ranks lowest. Therefore, good waste management systems should seek optimal planning along three essential steps: waste forecasting [
13,
14]; waste collection; and waste disposal or other end-of-life treatments.
This type of management can be strongly affected by the sudden closure of a strategic final disposal site, which may cause difficulties in respecting the waste hierarchy and can result in serious environmental and health hazards. In particular, this situation requires the rapid identification of new sites to be used for waste disposal. Under these circumstances, waste collection and transportation become even more significant issues in the waste management sector, leading to the need for a vehicle routing optimization and fleets and facilities definition in order to minimize operational times and costs [
15,
16]
Despite several optimization models being developed for waste management systems, there is a gap of knowledge concerning model and tools that can support policy decisions under emergency conditions.
Under normal circumstances, Galante et al. [
17] propose a model for the localization and the dimensioning of transfer stations from municipalities to the incinerator; the model considers both initial investment and operative costs related to waste transport. The aim of the study was the determination of Pareto optimal solutions, allowing the decision maker to define a waste management strategy. Lee et al. [
18] suggest a comprehensive waste management system for Hong Kong apt to minimize the overall costs made of management costs, cost of moving replacement truck to waste collection point and incinerator, truck cost, and the revenue from incinerator. Santibañez-Aguilar et al.’s mathematical model [
19] for the optimal planning of a waste management system for a set of different neighbouring cities divided in several sites accounts several costs and revenue functions associated with waste management, and sets some technical, environmental and economic constraints. The model can also select processing technologies and facilities and waste reuse and recycling in order to maximize profit. Currently, besides economic and environmental concerns, the social impact of waste management systems is also starting to be taken into account [
20].
A waste crisis may be caused by different events and, under such emergency circumstances, several actions can be and have been taken, both in Italy and worldwide. Between 2001 and 2009 the area of Naples, South Italy, repeatedly hit the headlines of national and international media due to the waste management crisis, threatening not only the endurance of the waste management system but also presenting a risk for the health of the citizens [
21]. The persistence of the crisis led to a still-ongoing scientific debate on the specific case-study, with several researchers offering different solutions and improvements for the Neapolitan waste management system [
1,
22]. On a global scale, as China started refusing solid waste imports because of the decline in the price of recyclable waste, several countries had to face a transition for their waste management systems. As a result, recycling companies in South Korea started refusing to collect recyclable waste, which caused a solid waste management crisis in April 2018, making many people unable to discard their recyclable waste [
23].
This study analysed the case-study of Genoa, Northern Italy, following the closure of the Scarpino landfill previously dedicated to the disposal of waste generated in this municipality.
Over the years, waste management in the municipality of Genoa has inspired a significant body of literature. Fiorucci et al. [
24] developed a decision support system (DSS) to assist the planner in waste management at a municipal scale. The model was meant for the planning of the optimal number of landfills and treatment plants, accounting for the constraints defined by legislation, technical issues or landfill exploitation (minimum filling time), and the cost function to be minimized included recycling, transportation, and maintenance costs. Costi et al. [
25] improved the previous model with different options of facilities (i.e., incinerators), a more detailed cost function and the definition of an environmental constraint on emissions and noxious substances generated by processes and facilities of the waste management system. Minciardi et al. [
26] implemented a multi-objective model allowing a decision maker to define an optimal waste management strategy in terms of four different objective functions related to economic costs, unrecycled waste, sanitary landfill disposal, and environmental impact.
With the objective of filling the aforementioned knowledge gap, the aim of this study was the definition of a DSS, allowing decision makers to set up a waste management strategy in an emergency scenario relying only on third parties’ plants for waste disposal.
2. Materials and Methods
Liguria Region is located in Northern Italy. It has 1,550,640 inhabitants split into 234 Municipalities (January 2019). From an administrative point of view, the Region is split into four Provinces: Genova, Savona, Imperia, and La Spezia. Waste management in the Municipality of Genoa is managed by AMIU (Municipal Urban Health Enterprise, Genoa, Italy). The collection of waste (differentiated and not) takes place through road containers accessible to all, with the exception of the historical centre where, for the delivery of the waste, special premises called eco-points were organized. The collection of waste is performed daily, on average, with one emptying of bins expected per day [
27].
The company is equipped, for its waste collection and transfer system, with two pressing plants where unsorted waste is transferred and compacted in large articulated trucks which carry it to the final disposal site. Until the year 2014, about 200,000 ton/year of unsorted waste were conferred to the Scarpino landfill, built in 1968 above a 400,000 m
2 area on the hills of Genoa, between the two sides of the mountain, at an elevation of 590 m above sea level [
11].
The Scarpino landfill, which, with a surface area of 575,681 m2, was one of Italy’s biggest landfill sites, was closed by authorities in 2014. This event has required a total reorganisation of the Municipality’s waste management system and the implementation of a DSS based on a multicriteria analysis.
The methodology followed in this study and the implementation of the model are presented in the following paragraph.
2.1. Methodology
The optimization problem and multi-objective analysis were implemented, referring to the basic transportation theory [
28]: usually this kind of system is made of a set of destination points with fixed requests demanding specific resources from a set of source points with a maximum availability, with the two sets connected one-by-one a priori. In contrast, this case-study presents a sort of “push logic” since the two sources—the two collection centres—are characterized by a daily amount of generic waste that needs to be redistributed on a set of disposal centres with a limited semi-annual capacity. The analysis was implemented using the MATLAB Optimization Toolbox.
The system implements tools for the definition of long-term optimizations, as well as a day-to-day scheduling, on a weekly basis, which has to be referred to the disposal plants. The two different models have to work synergistically so that the long-term optimization—the one able to guarantee the pursuit of a planning strategy—can set week by week the weekly constraints for the day-to-day scheduling.
According to the actual scenario, separate fleets of collecting vehicles are dedicated to waste collection in different areas of the municipality and refer to different collection centres for weighing procedures and possible waste redistribution operations:
Since they are served by the same fleet of vehicles, these last two centres have been considered as a unique collection centre (centre 2).
In order to manage waste disposal in emergency conditions, 15 disposal plants located in Municipalities in Liguria or in neighbouring regions have been identified:
Plants P1 to P8 in Piedmont;
Plants P9 to P11 in Liguria;
Plants P12 to P14 in Lombardy;
Plant P15 in Tuscany.
In order to deal with this emergency situation and perform both semi-annual (long term) and weekly (short term) optimizations of waste distribution among the disposal centres, two models were developed. Long term optimization was performed foreseeing the hypothesis of new contracts stipulation, with different scenarios and strategies to be discussed at the end of the emergency situation. Short term optimization was instead used for day-to-day scheduling, taking into account all those conditions that can be known and evaluated only in the short term, i.e., extraordinary closures of the plants, holidays, closing of the road sections, and so on.
With the purpose of formalising the mathematical definition of the problem, from now on the following indices will be used to characterise data and variables:
i = C1, C2 for the city collection centres (“starting nodes”);
j = P1, …, P15 for the different disposal plants (“arrival nodes”);
k = 1, …, 7 identifying the specific day of the week;
l = 1, …, 26 identifying the specific week of the semester.
Thus, both weekly and semi-annual optimizations have been computed by means of two different variables, respectively, related to the amount of waste to dispose of in each plant and coming from each collection centre and to the number of vehicles needed for the different transports:
xl,k,ij and nl,k,ij for daily values;
Xl,ij and Nl,ij for weekly values.
2.2. Mathematical Definition of the Problem
All data are related to and change with the collection centres, the disposal plants and days and weeks considered. For ease of listing, the data are divided into the ones related to the collection centres (
Table 1) and the ones related to the disposal plants (
Table 2).
Since representing existing positive quantities, all variables are bound to be positive and
nl,k,ij and
Nl,ij—the amount of trucks—have to be integers as well.
In addition, other constraints are imposed owing to the nature of the system, and they are divided in equalities and inequalities.
On the one side, a set of equalities is defined so that:
the weekly disposal for each disposal plant is equal to the sum of the daily ones in that week:
at the end of each day and each week the overall amount of waste collected must have been transferred to the disposal plants:
some links between collection centres and disposal plants are blocked a priori because of internal features of the system:
On the one side, a set of equalities is defined so that:
the maximum reception capacity of the plants must be respected for daily, weekly and semi-annual waste disposal:
the minimum quantity of waste must be guaranteed to the disposal plants both in the weekly and semi-annual period:
the number of garbage trucks activated for each link
ij must allow the transport of the predicted amount of waste:
2.3. Objective Functions
The performed optimization was oriented to the reduction of the overall costs and emissions of transport and disposal and, in accordance with legislative provisions and a principle of proximity, to a good exploitation of the disposal plants located in the Liguria Region. Therefore, three different objective functions are defined. All functions are given in the form of both weekly and semi-annual optimization:
minimisation of the overall costs is defined as:
or
minimisation of the GHG emissions is defined as:
or
maximization of the exploitation of Ligurian disposal plants is defined as:
or
2.4. Strategy Definition
The first step for the long-term planning is the definition of a management strategy reflecting the company policy and the relevance that the decision maker attributes to the different “objective functions” controlling the system.
Mostly if planning new waste management systems from scratch, the tendency of more recent studies is to define a unique objective function with variable weighing coefficients for each element of the function related to a different issue (i.e., economic, environmental and emissions, social factors) [
20].
The companies’ policies are usually cost-oriented, but they can’t neglect the regulatory framework that promotes the principles of territorial self-sufficiency and proximity in the matter of waste management and environmental issues. Thus, the proposed approach also provides the definition of a set of Pareto efficiencies the decision maker can choose from in order to define a management strategy balancing the needs of the company and the environmental and legislative aspects. In order to reduce the calculation time, the Pareto front [
29] is defined—using the genetic algorithm method—according to the following simplified problem that eludes the short-term scheduling:
are integers
where
is the semi-annual amount of waste disposed at disposal plant j coming from the collection centre i and
is the overall quantity of transporting vehicles needed for each waste flow.
As mentioned previously, the so-structured problem does not consider all the constraints on a weekly and daily scale that, with their uncertainty and unpredictability, could make the selected planning unfeasible.
The choice of a determined Pareto efficiency has to be intended as the definition of an ideal long-term objective on which basis the decision maker can define the strategy for renewing the contracts and set the semi-annual constraints; therefore, on the one hand, the total disposal availability derived from the contracts must ensure a reasonable gap over the expected volumes so as to allow a margin of adaptation to the real case—in terms of both variations in expected waste volumes and unforeseen limitations on infrastructures or on reception of the plants—and, on the other hand, in the semester in progress, the decision maker will have to evaluate the modification of the semi-annual constraints if it becomes necessary for the feasibility of the problem.
2.5. Data Collection
According to the mathematical formalisation presented in its generic form, the model was applied to the specific case study. With this purpose, data related to collection centres and disposal plants were collected.
The different locations of centres C1 and C2 and the morphology of the connection roads that link them to the main infrastructures imply the utilization of trucks with different sizes and loading capacities:
As far as emissions are concerned, the Greenhouse Gas (GHG) emissions were calculated using specific emission factors (EF) retrieved from the Ecoinvent 3.1 database [
30]. To determine the EF, i.e., the tCO
2-eq (carbon dioxide equivalent) per unit of process considered, the IPCC (Intergovernmental Panel on Climate Change) 2013 method [
31] was used. Thus, the fixed EF were neglected and the overall amount was evaluated as equally distributed among the tons of waste transported, as reported in
Table 3.
The total waste collected in 2016 amounted to 219,954.47 tons. The monthly distribution of the waste volumes collected are shown in
Table 4, whereas the weekly distribution is presented in
Table 5.
Most data were defined by the agreements taken by the waste management company with the disposal plants, as reported in
Table 6; contracts are stipulated on a semi-annual or annual basis and define a contractual maximum quantity and a fixed unitary cost for waste disposal. Few disposal plants also present daily or weekly limits. Each disposal plant is also characterised by specific travel distances and transportation costs.
3. Results
Some possible uses of the model are presented, and their results using real data are shown. In particular, the results refer to the cases of costs and emissions minimizations and to the sensitivity analysis.
All the scenarios presented are based on the agreements signed for the first semester of 2017 (
Table 6). Waste flows coming from the collection centre C1 are neglected for the disposal plants P7, P9 and P10; this being the fleet of transporting vehicles unsuitable for transit along the infrastructure connecting the plants. Some agreements are set on an annual basis; their semi-annual limits are considered equal to the half of the annual ones except for the disposal plant P10.
According to the data presented in
Table 4—here considered as the forecasted volumes for the semester to be analysed and optimized—the results of all the objective functions are presented in
Table 7.
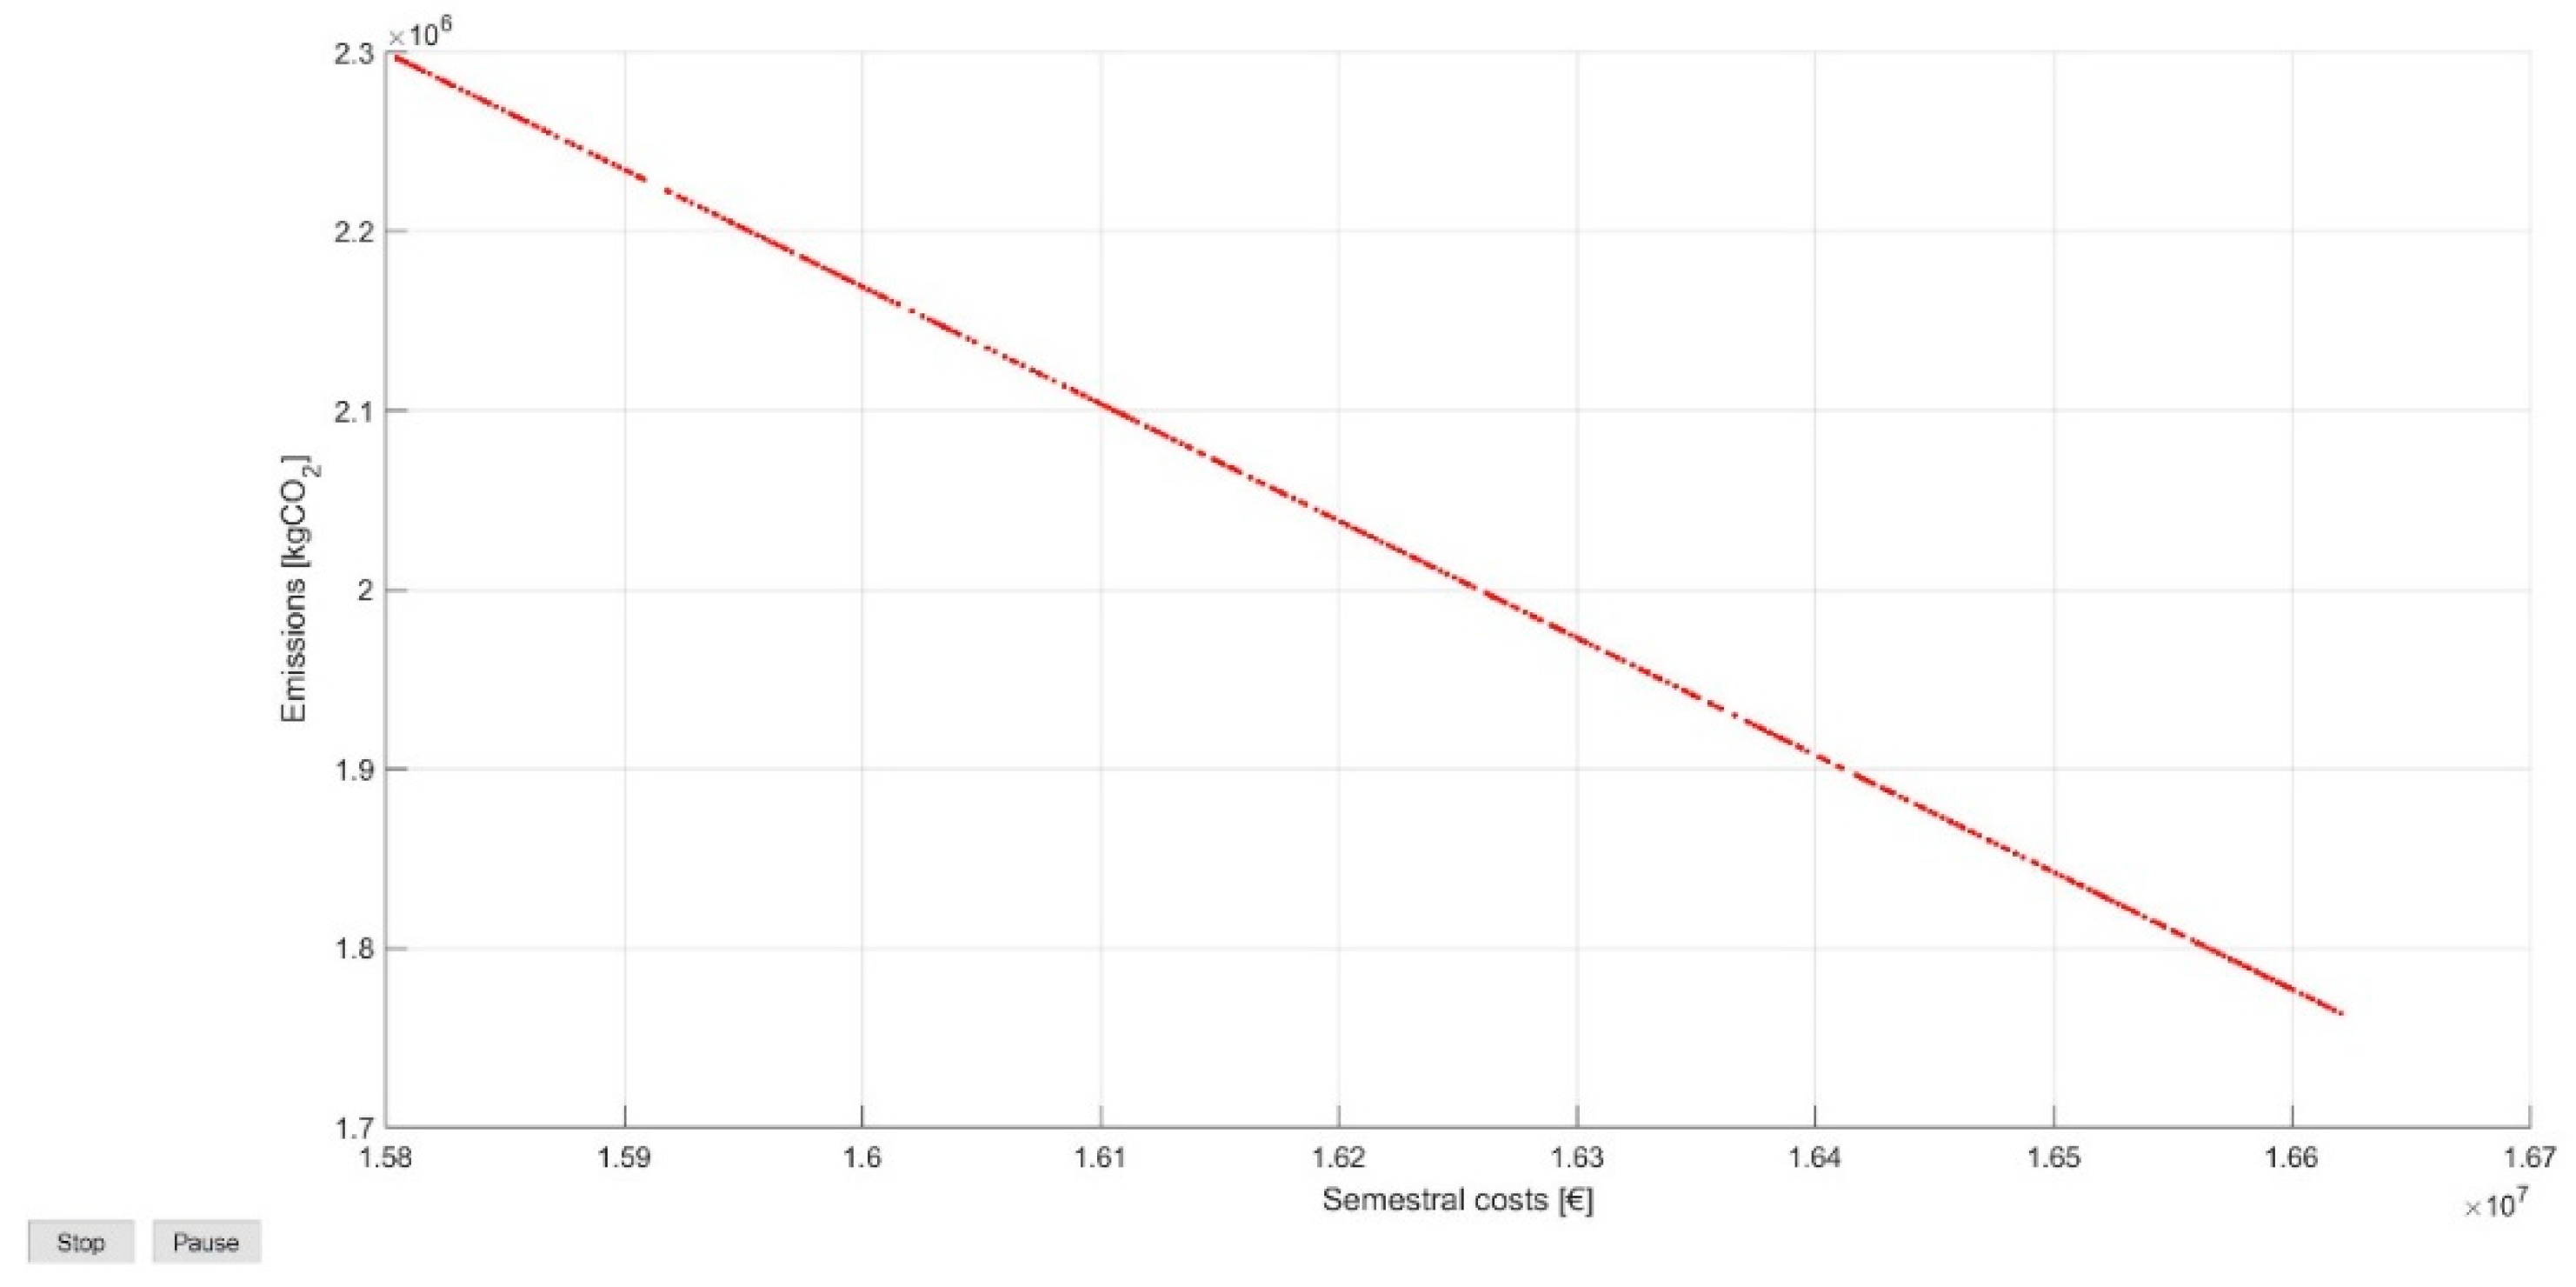
Costs and emissions objective functions displayed somewhat conflicting behaviour, whereas the optimal solution calculated according to the maximization of the exploitation of the Ligurian plant results was equal to the one obtained for the emissions minimization.
Even though the economical aspect is usually the first one companies look at—especially in extraordinary management conditions—a trade-off among different targets (e.g., economical costs, environmental issues) should be pursued for the sustainability of the system. Therefore, multi-criteria analysis should apply, overcoming the conflicting behaviour of selected objective functions, and an optimal semi-annual strategy can be defined choosing among Pareto efficiency solutions lying on the Pareto front (
Figure 1).
In order to accurately investigate the solution space, the initial population of the Genetic Algorithm was set as equal to 400 individuals, and part of them was initialized with the optimal solutions for each of the objective functions composing the fitness function.
Sensitivity Analysis
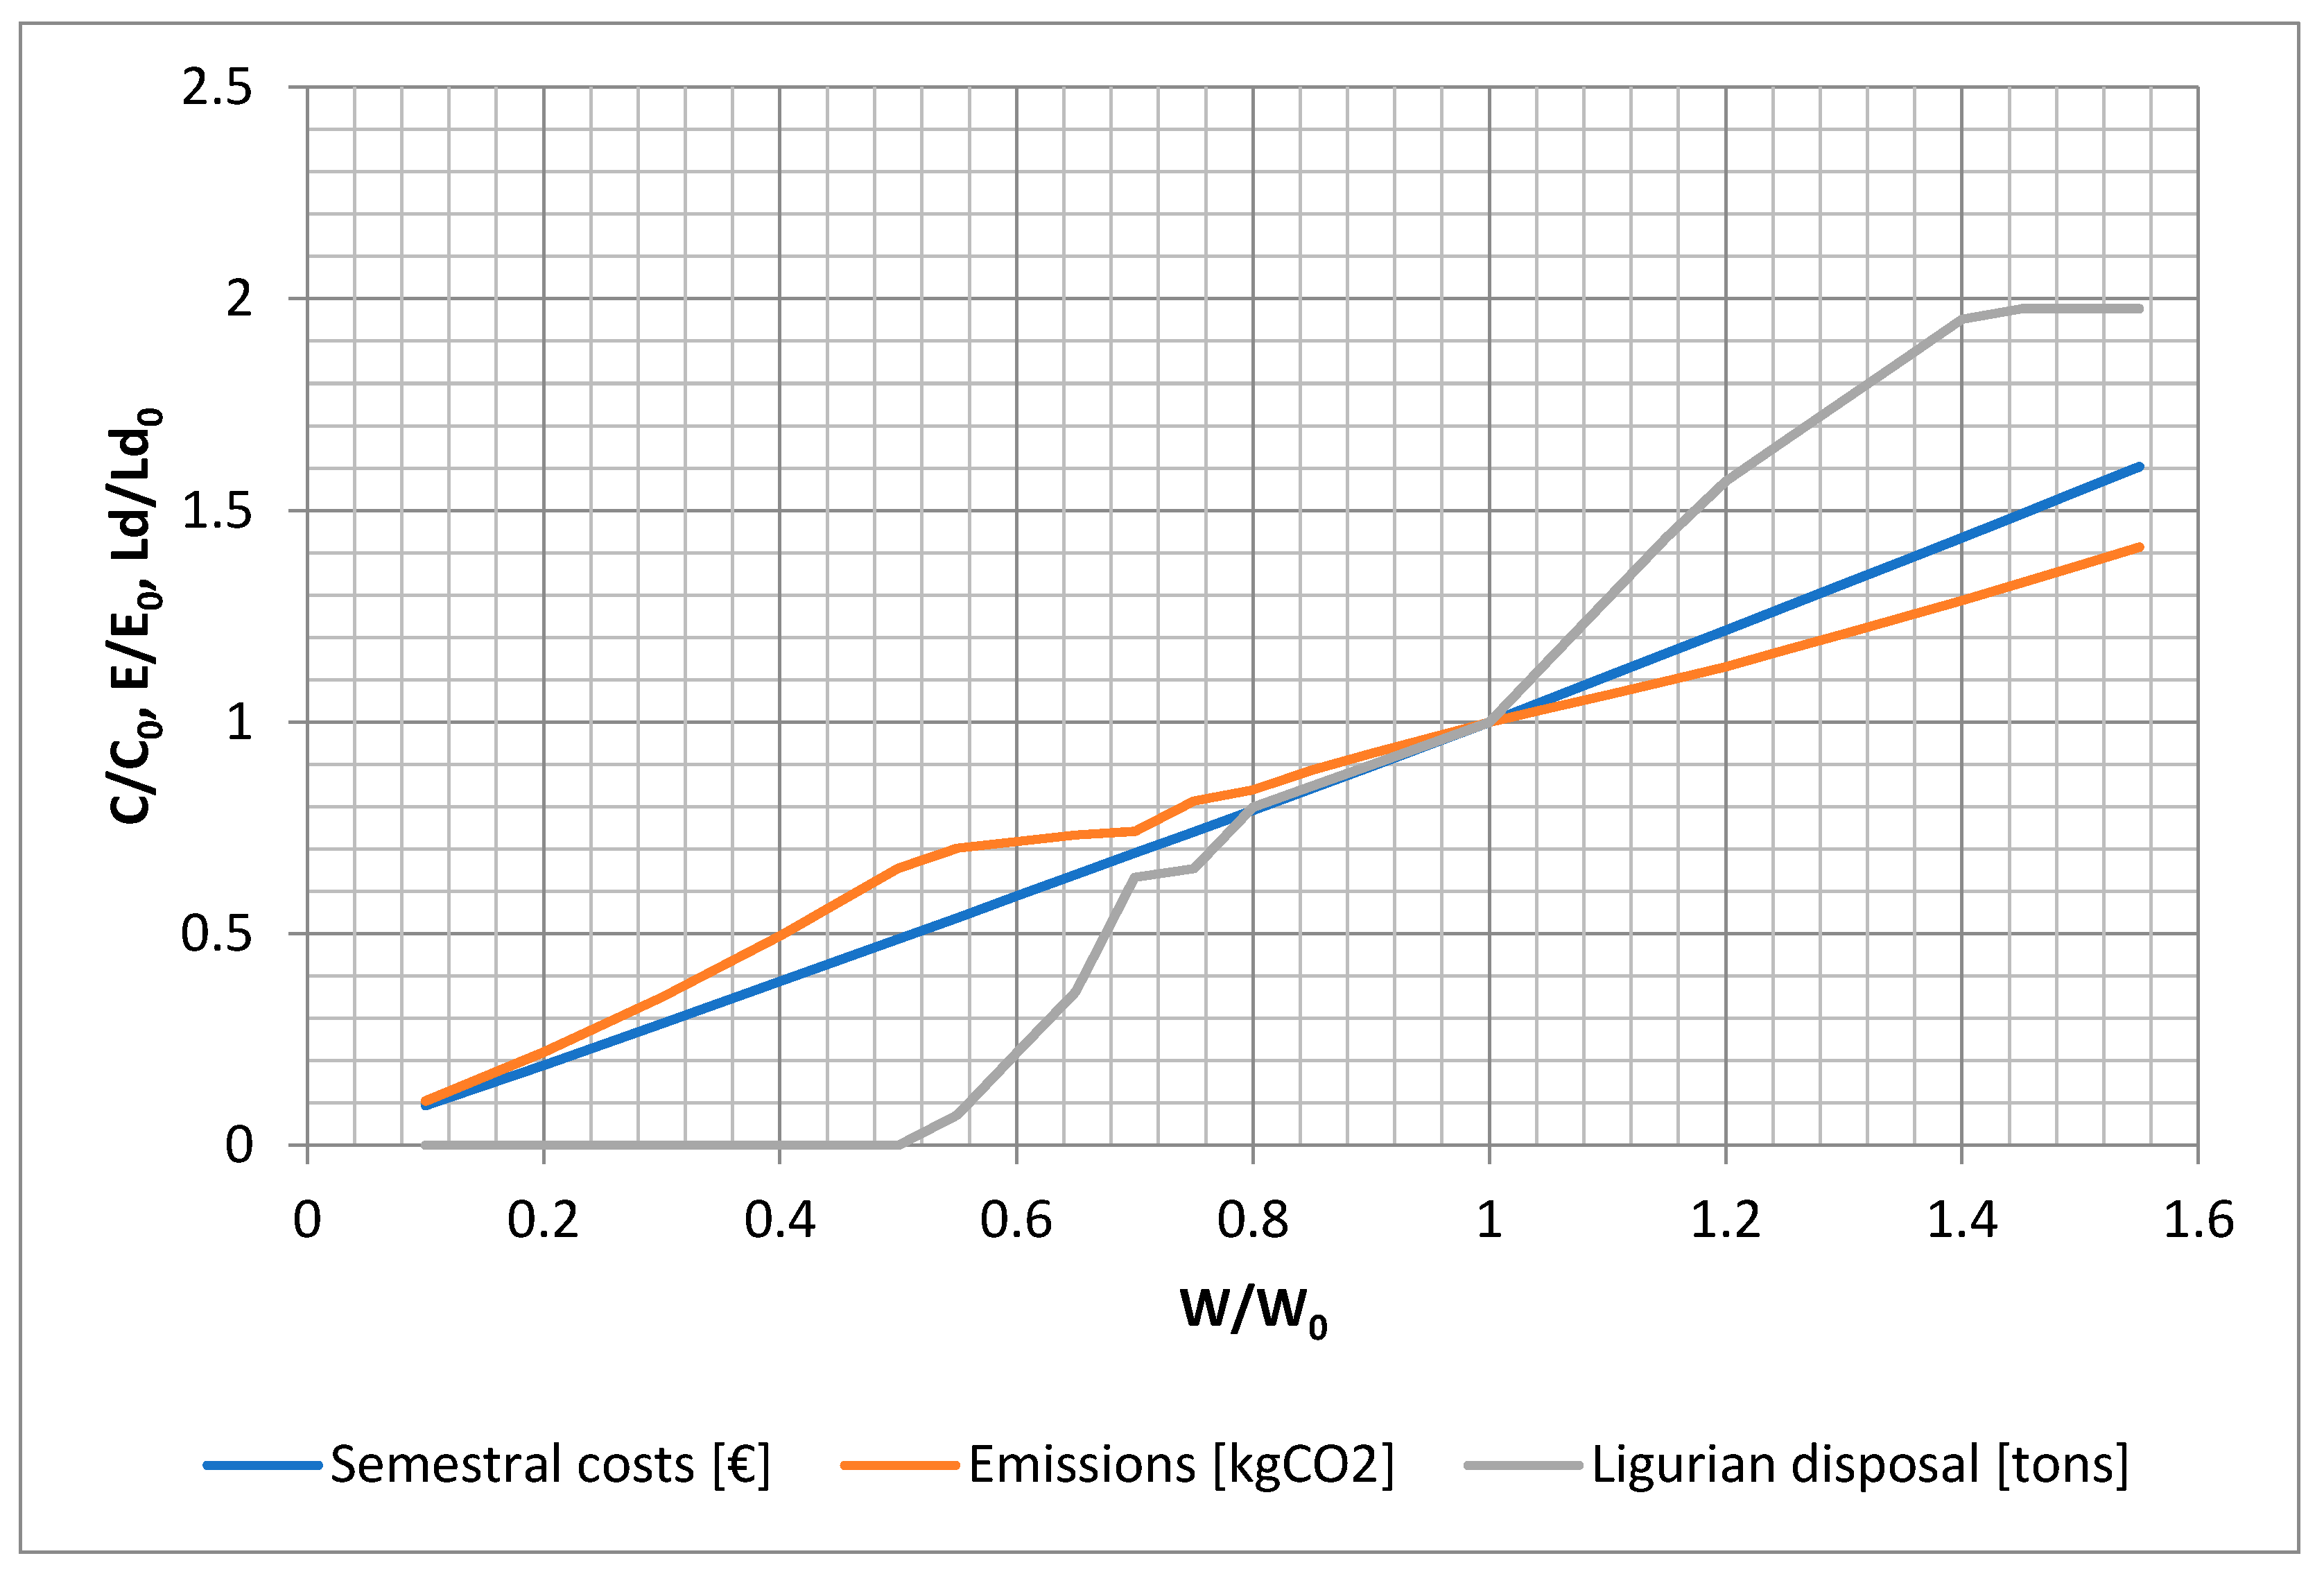
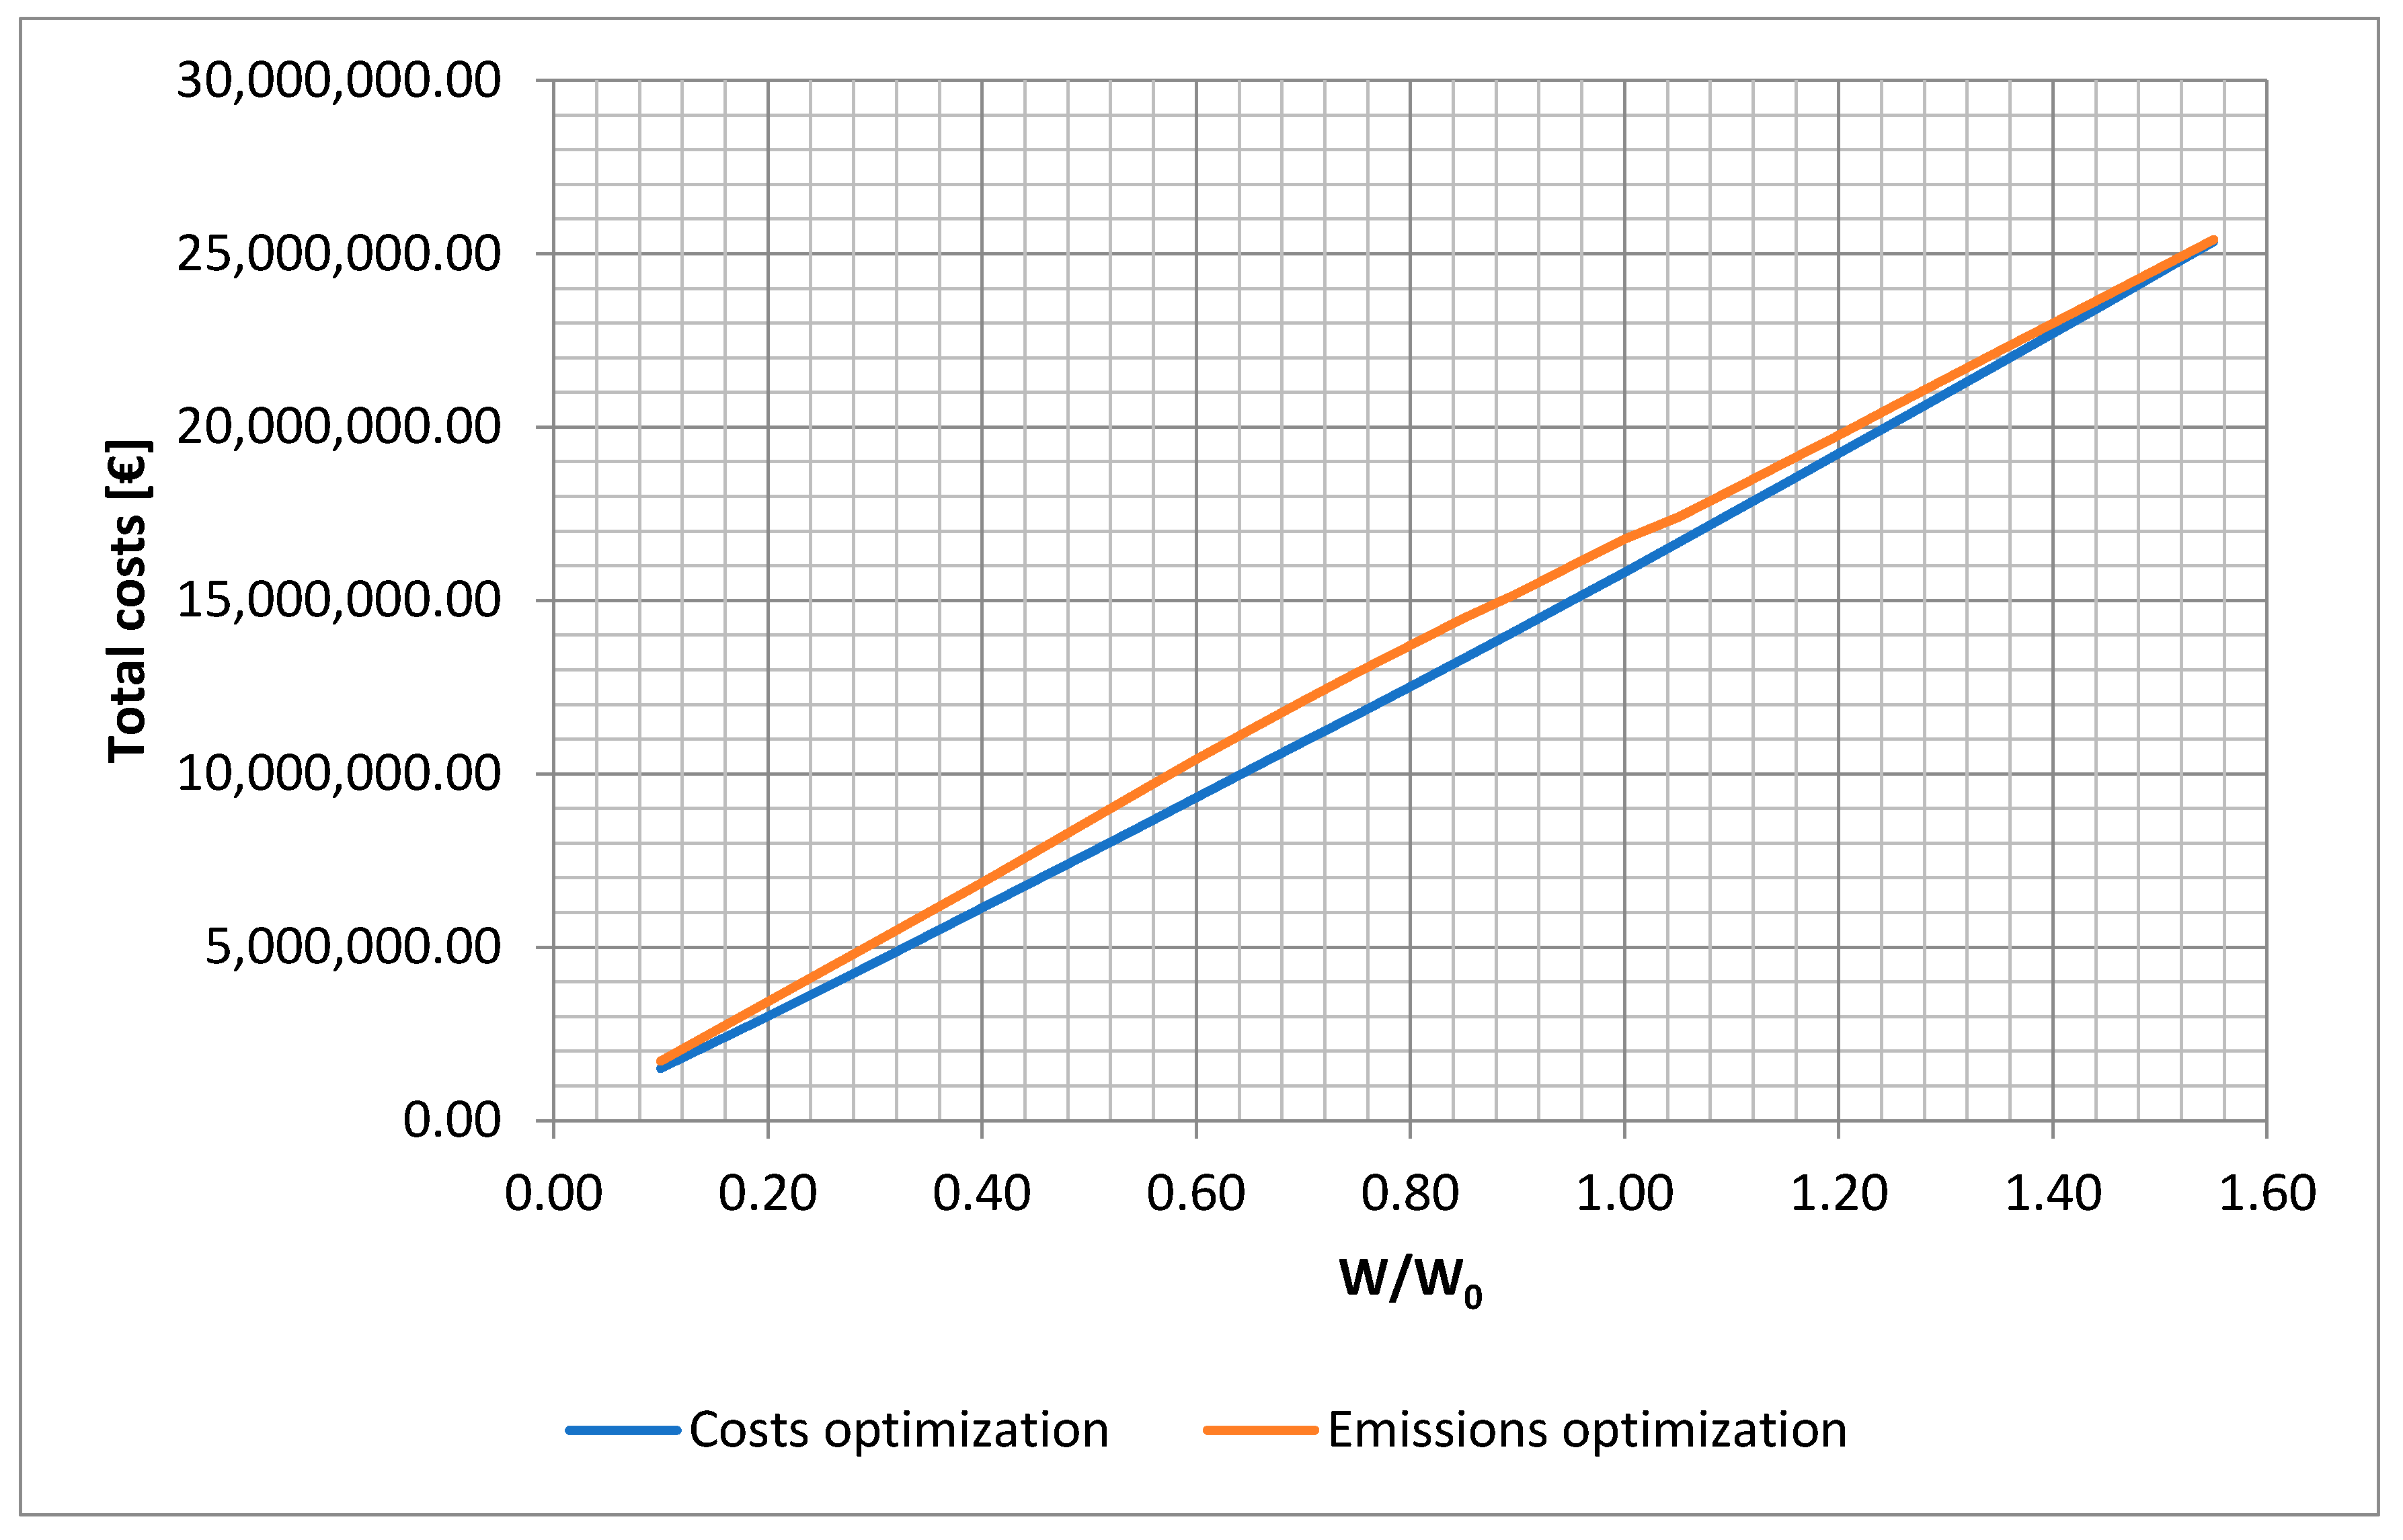
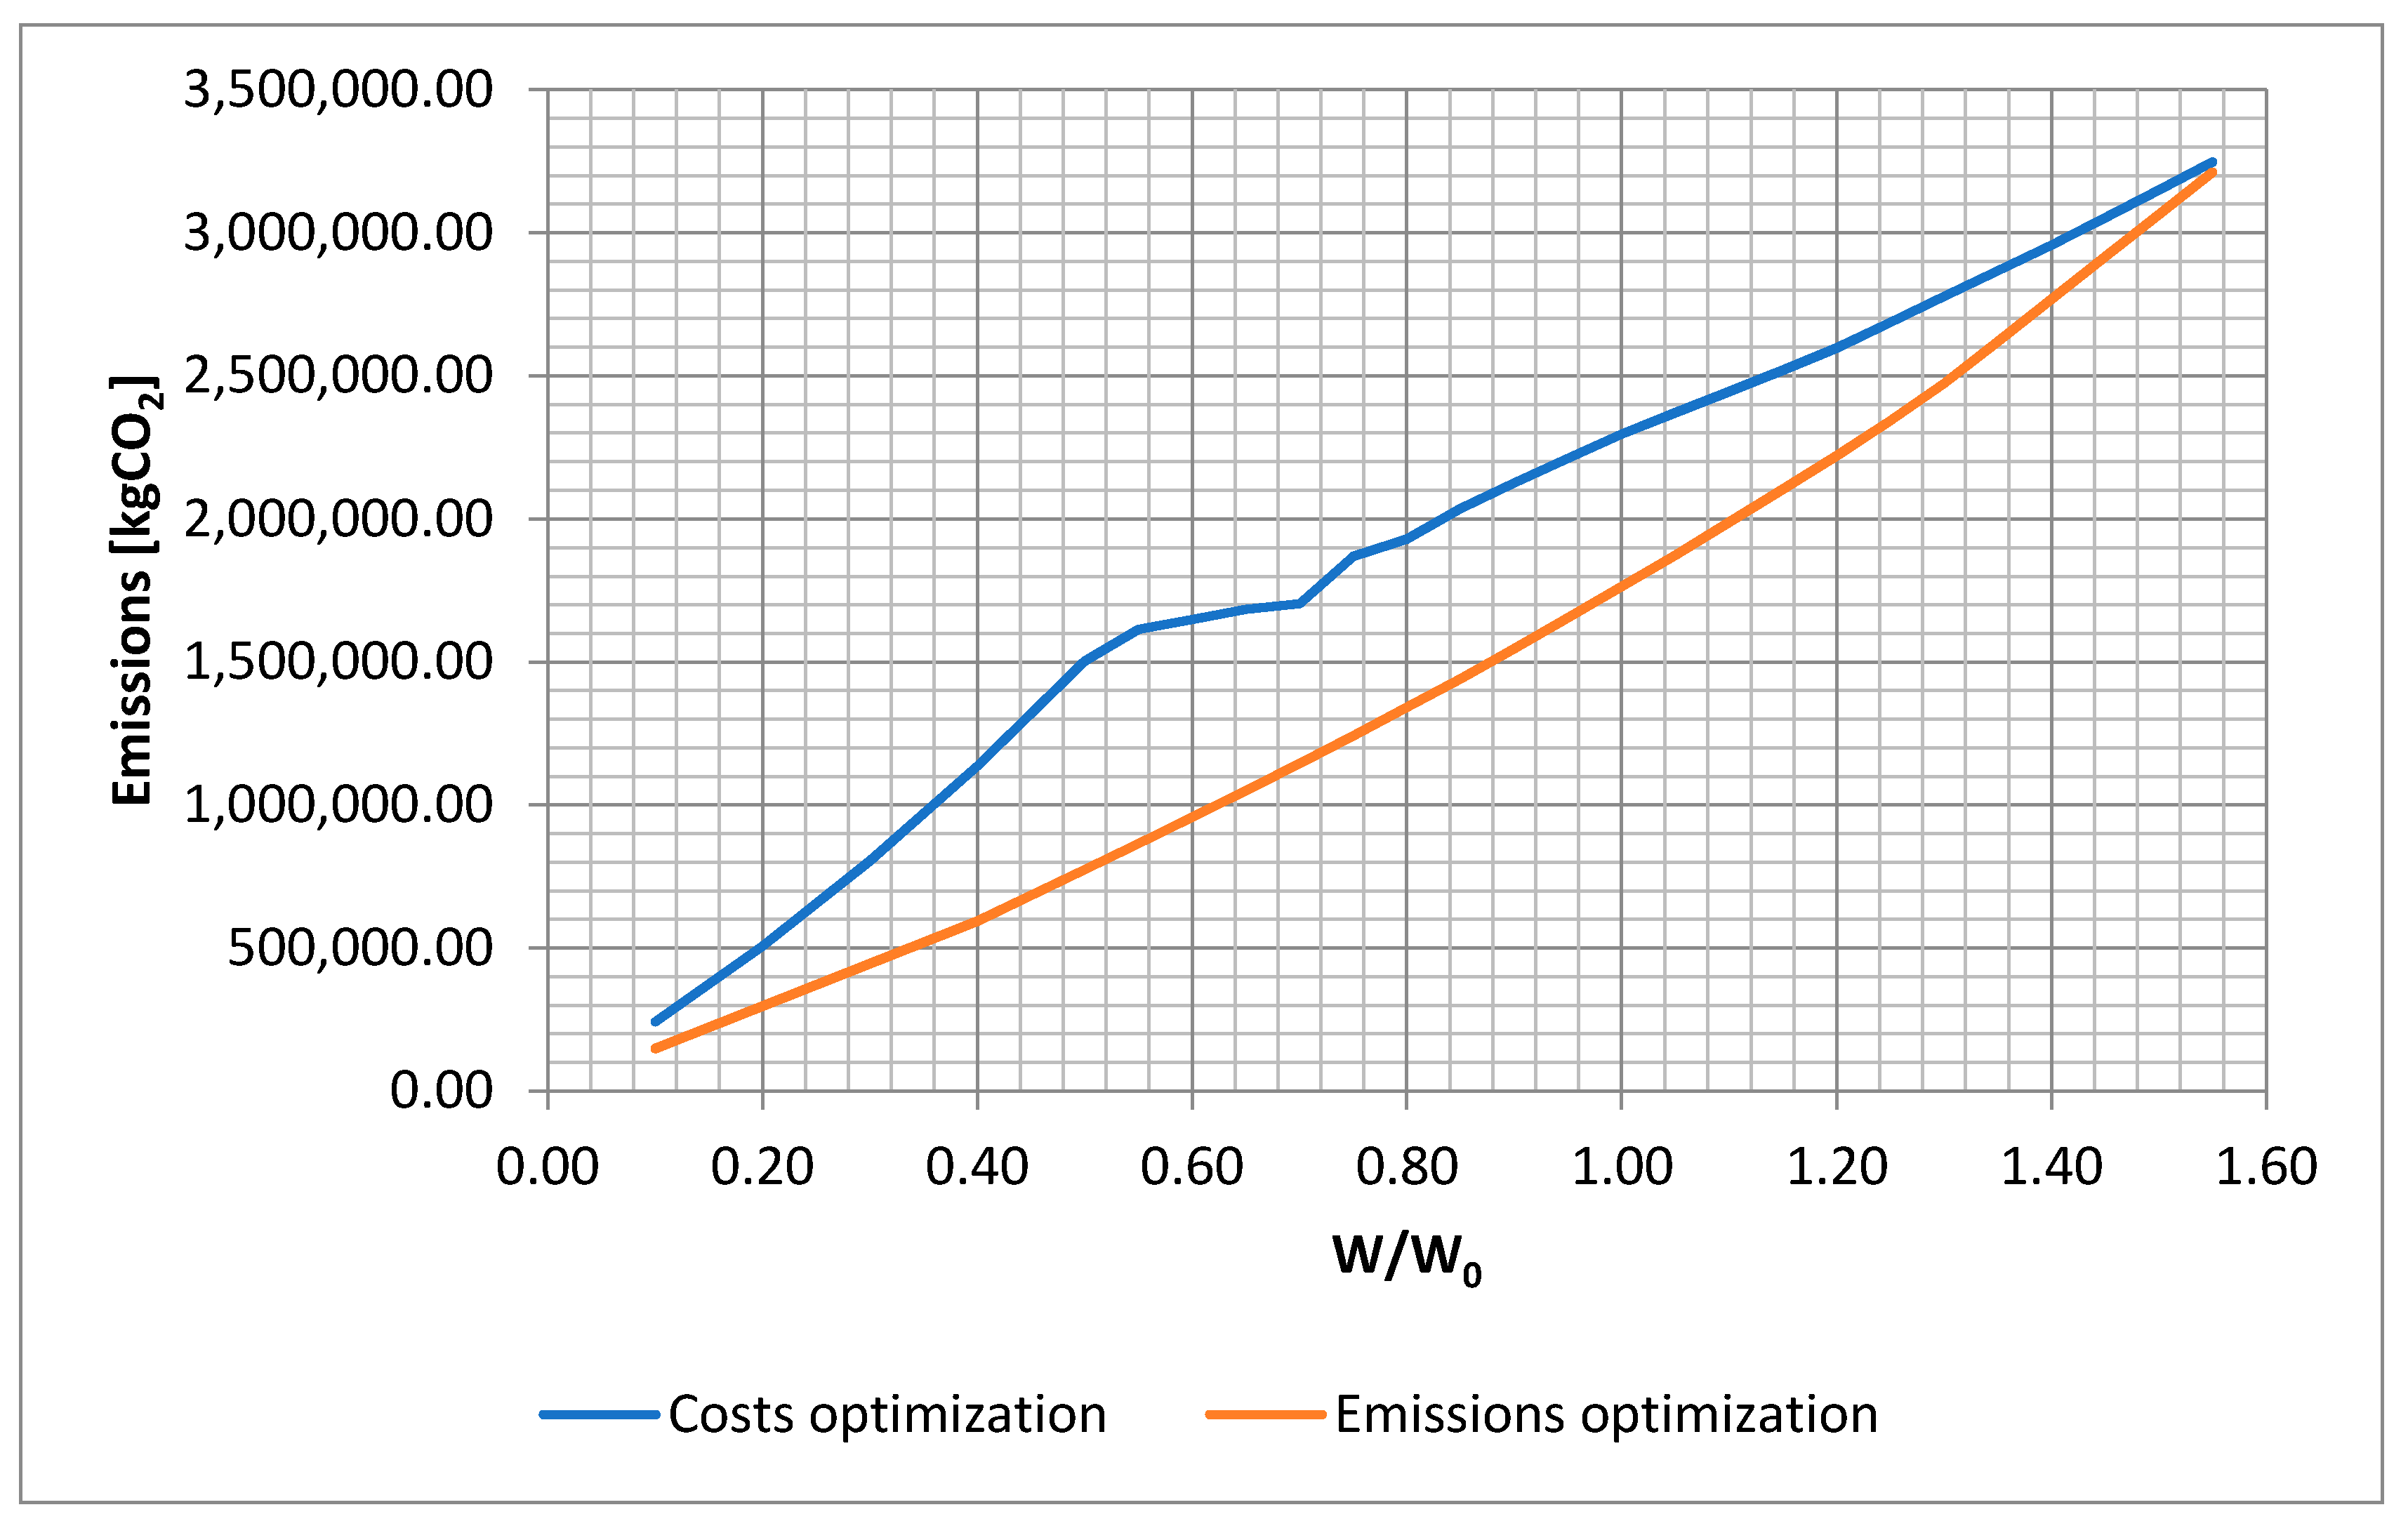
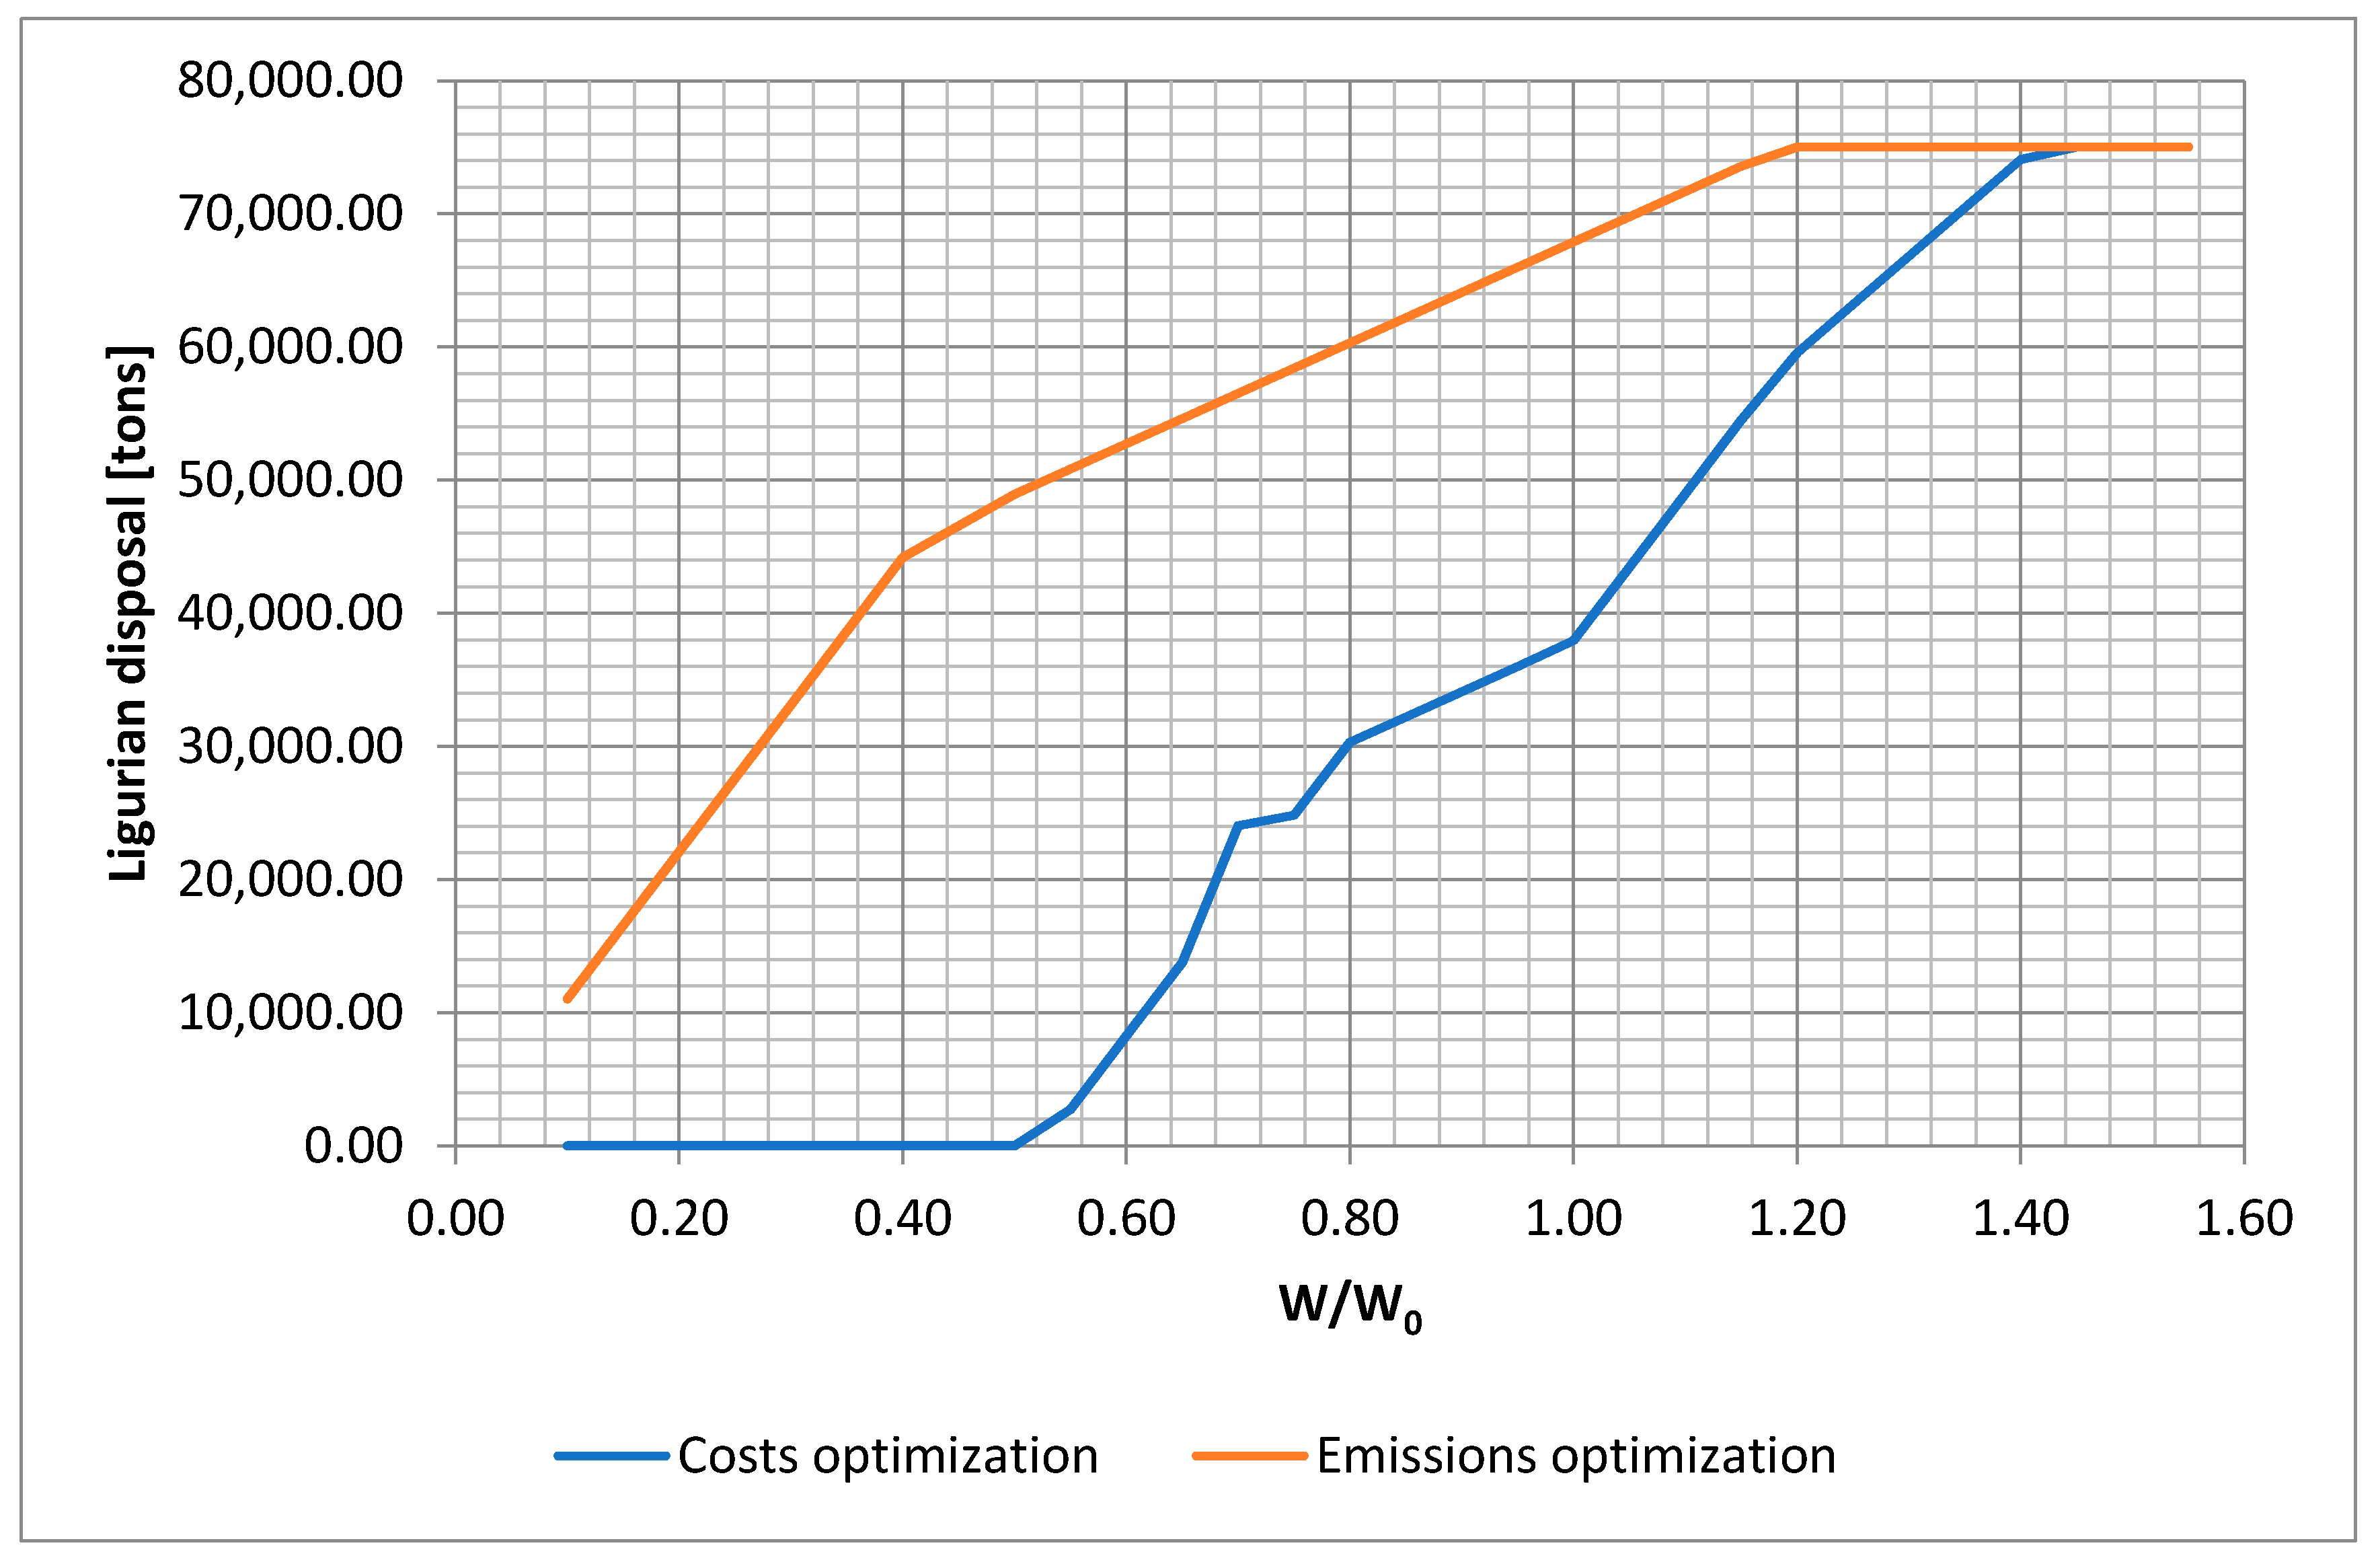
A sensitivity analysis was performed in order to understand how the uncertainties related to the input data can affect the output of the mathematical model. Thus, the aim was to analyse how the variation of the waste volumes—the main uncertainties affecting the problem—could affect the system, in order to yield useful conclusions and suggestions for a good waste management.
Waste volumes were varied between a minimum of 10% and a maximum of 155% compared to those of the first half of 2016, and the results are graphically reported in
Figure 2 and
Figure 3. This range of variation is exaggerated with respect to a real case, but it allowed us to stress the model to its extremes.
This analysis was carried out for both the costs minimization and emissions minimization cases:
W0, C0, E0, Ld0 are respectively the waste volumes, costs, emissions and tons of waste disposed in Ligurian plants obtained with standard optimization;
W, C, E, Ld are the varied values of the same data.
In the case of costs minimization, the limits for the plant P9 were maintained till possible and were adjusted to the lower bands when necessary for the feasibility of the problem.
In the case of emissions minimization, the same limits were freed and the disposal was changed according to the results obtained from time to time.
The trendlines of the three objective functions for both costs and emissions optimizations are shown in
Figure 2 and
Figure 3 respectively.
5. Conclusions
Normal planning processes mostly consist of companies relying on a single disposal plant so that the possible optimizations are related more to the improvement of the treatment process rather than to the management system. This study produced a decision support system (DSS) that allows a decision maker to perform different optimizations and system analyses for good waste management, starting from long-term planning to day-to-day scheduling in an emergency scenario, relying only on third parties’ plants for waste disposal.
The economical factor is usually the leading one—if not the only one—characterising and influencing the definition of a proper strategy, especially in the case of “emergency conditions”. However, multi-criteria analysis should apply, allowing the simultaneous application and pursuit of different objective functions. This result is obtained by defining the Pareto front of two conflicting objective functions, where the decision maker can select the Pareto efficiency identified as the best trade-off for the needs of the company and the environmental and legislative aspects.
Even if the actual case study is related to a single company, the defined model could also foresee the optimized system for different companies—intended as independent collection centres—accessing to the same, thus allowing a synergistic optimization of the different systems.
This tool has been applied and modified with respect to a real case of waste management in the municipality of Genoa. The study highlighted the key role of the disposal plants located in Liguria and in Lombardy for good management of the system, mostly in terms of emissions minimization and costs minimization respectively.
The sensitivity analysis showed how the definition of the contracts may be improved, guaranteeing an overall maximum capacity of the disposal plants coherent with the waste volumes collected in each collection centre, according to the feasible connections with the trucks.
In both optimizations, the cost functions present an almost linear correlation with volumes variations; the two graphs of costs are quite similar, especially if evaluated on percentage variation from the original results of each optimization case. The differences in costs and emissions variations are due to the fact that the unitary costs of the disposal plants (disposal and transport) are more similar than the distances to the plants; therefore, differences in the exploited plants affect the total costs less than the emissions.
Considering all of the objective functions, the emissions optimization showed better behaviours in general terms, besides still being competitive in terms of total costs. Owing to how emissions are defined, their lowering obviously implies a reduction in distance travelled and shipping time.
A possible future development may foresee the need to carry out a sensitivity analysis and a strategy definition in case of limitations to the number of vehicles usable for waste transport or to travel times.


