Article

The Connection between a Suspended Sediments and Reservoir Siltation: Empirical Analysis in the Maziarnia Reservoir, Poland

by
Maksymilian Cieśla
*,
Renata Gruca-Rokosz
and
Lilianna Bartoszek
Rzeszów University of Technology Department of Environmental and Chemistry Engineering, Faculty of Civil and Environmental Engineering and Architecture Al. Powstańców Warszawy 6, 35-959 Rzeszów, Poland
*
Author to whom correspondence should be addressed.
Resources 2020, 9(3), 30; https://doi.org/10.3390/resources9030030
Submission received: 7 February 2020 / Revised: 6 March 2020 / Accepted: 10 March 2020 / Published: 11 March 2020

Abstract

:
This paper presents research on the influence of suspended sediments on selected aspects of a reservoir’s functioning. As the amount of sediment suspended in water (SS) there was found to correlate significantly with sedimentation rate (Us), it was possible to develop a function allowing the rate of accumulation of sediments to be predicted by reference to known amounts of suspended sediment. The latter factor was also shown to correlate significantly with the content of organic matter in suspension (OMSS), in sediment captured in a sediment trap (OMS), and of bottom sediment (OMSB). Analysis of amounts of suspended sediment can provide for estimates of total loads of organic pollutants deposited in the sediments of a reservoir. A further significant correlation with SS was noted for the concentration of total phosphorus in water (TPW), confirming the importance of internal production where the circulation of this biogenic substance in a reservoir ecosystem is concerned. Analysis of stable carbon isotopes in turn showed that entrapped sediments were depleted of—or enriched in—13C, in line with whether concentrations of total P in those sediments (TPS) were at their highest or lowest levels. This dependent relationship may thus be of key importance in assessing sources of phosphorus, as well as in forecasting concentrations present in reservoir sediments. The results obtained make it clear that sediments suspended in the water of a reservoir unify phenomena and processes ongoing there, between elements of the water-sediment system.

1. Introduction

In recent years, along with the constantly growing world population, issues related to water scarcity have become a priority. Water is a limited resource, and its efficient and sustainable distribution has and will be of great importance worldwide [1]. One of the operations to reduce water shortage is their retention. Of the many functions of dam reservoirs, the most important is water supply, which largely depends on the reservoir capacity [2,3]. Therefore, the issues related to the loss of reservoir capacity will continue to pose a serious challenge in terms of effectively reducing this phenomenon [4,5]; according to statistics from 1901 to 2010, the capacity of large reservoirs in the world decreased by 5% [4]. In turn, this process has led to a reduction of the total storage capacity of dam reservoirs by around 0.5–1% worldwide. It is estimated that over the next 25–50 years, approximately 1/4 of the world’s retention reservoirs may lose their water storage capacity [1]. In order to eliminate negative effects, environmental and socio-economic associated with the risk of water shortage, it is recommended to develop integrated methods for forecasting degradation and silting processes of retention reservoirs [5,6].
Knowledge of the specifics and the rate of deposition of suspended matter in the dam reservoirs waters is therefore of great importance [7].
The relationship between the amount of suspended sediments in water and rate of their sedimentation is essential in terms of proper and effective use of retention reservoirs. In practice, knowledge of the relationship between these parameters can be a key element of analyses and forecasts regarding the reservoir susceptibility to sediment accumulation (silting) and in identifying the origins of pollutions [4,8,9,10,11,12].
Despite advancing knowledge and the development of research techniques, methodological challenges remain, e.g., regarding the best tools or devices to use in sampling matter suspended in reservoir water, as well as the ways of interpreting the data obtained. Monitoring of the sedimentation process in aquatic environments in fact makes use of a variety of tools and techniques, of which the sediment trap is the oldest and simplest, offering information on surface layers of sediment, and rates of deposition of matter [12,13]. An alternative to this method can be experiments relating the hydrodynamics and morphodynamics of lateral embayments in riverbanks equipped with turbidimeters also help determine the sediment deposition and siltation area [14,15].
Shallow-water reservoirs are specific ecosystems typically existing in either a “clean” state featuring immersed macrophytes, or else in a “cloudy” state reflecting phytoplankton dominance. Where loading with phosphorus compounds exceeds some critical value, eutrophication progresses, and a transit from the aforementioned clean to cloudy states takes place [16]. Biogenic substances, especially phosphorus, are thus considered key factors affecting water quality in reservoirs, through their stimulation of processes of eutrophication, and hence degradation. This reflects accumulation of the element in sediments, with the possibility of re-release, and hence a further influence exerted on primary production [17,18].
Suspended matter is also involved in the redistribution of other nutrients in aquatic ecosystems, and the effect is to stimulate phytoplankton growth wherever present [19]. Aquatic organisms then play their part in integrating physical, chemical and biological features of the ecosystem, their spatial and temporal distribution and abundance being influenced by variations in environmental conditions, including loading with nutrients from the catchment [20,21,22]. The latter process is in turn dependent on specific conditions, not least geological and climatic features, as well as land-use structure [23].
Effective analysis of reservoir loading with biogenic compounds first needs to consider sources and forms of organic compounds (especially organic matter, OM). Analysis of stable carbon-isotopes represents one of the most effective methods, given the possibility of distinguishing between OM photosynthesised by terrestrial vascular plants (trees and shrubs have δ13C≈ in the −25 to −28‰ range; common reed and mosses −27 to −29‰, respectively), or by the phytoplankton present, most often 13C-depleted (with δ 13C≈ ranging from −30 to −40‰) [24,25].
Three practical goals motivate this research: (i) to determine the role of suspended sediments in a reservoir in regard to sediment accumulation and distribution of selected biogenic compounds; (ii) to measure suspended sediment concentrations and sediment accumulation rates; (iii) determination the origin of organic matter contained in accumulated sediments.

2. Materials and Methods
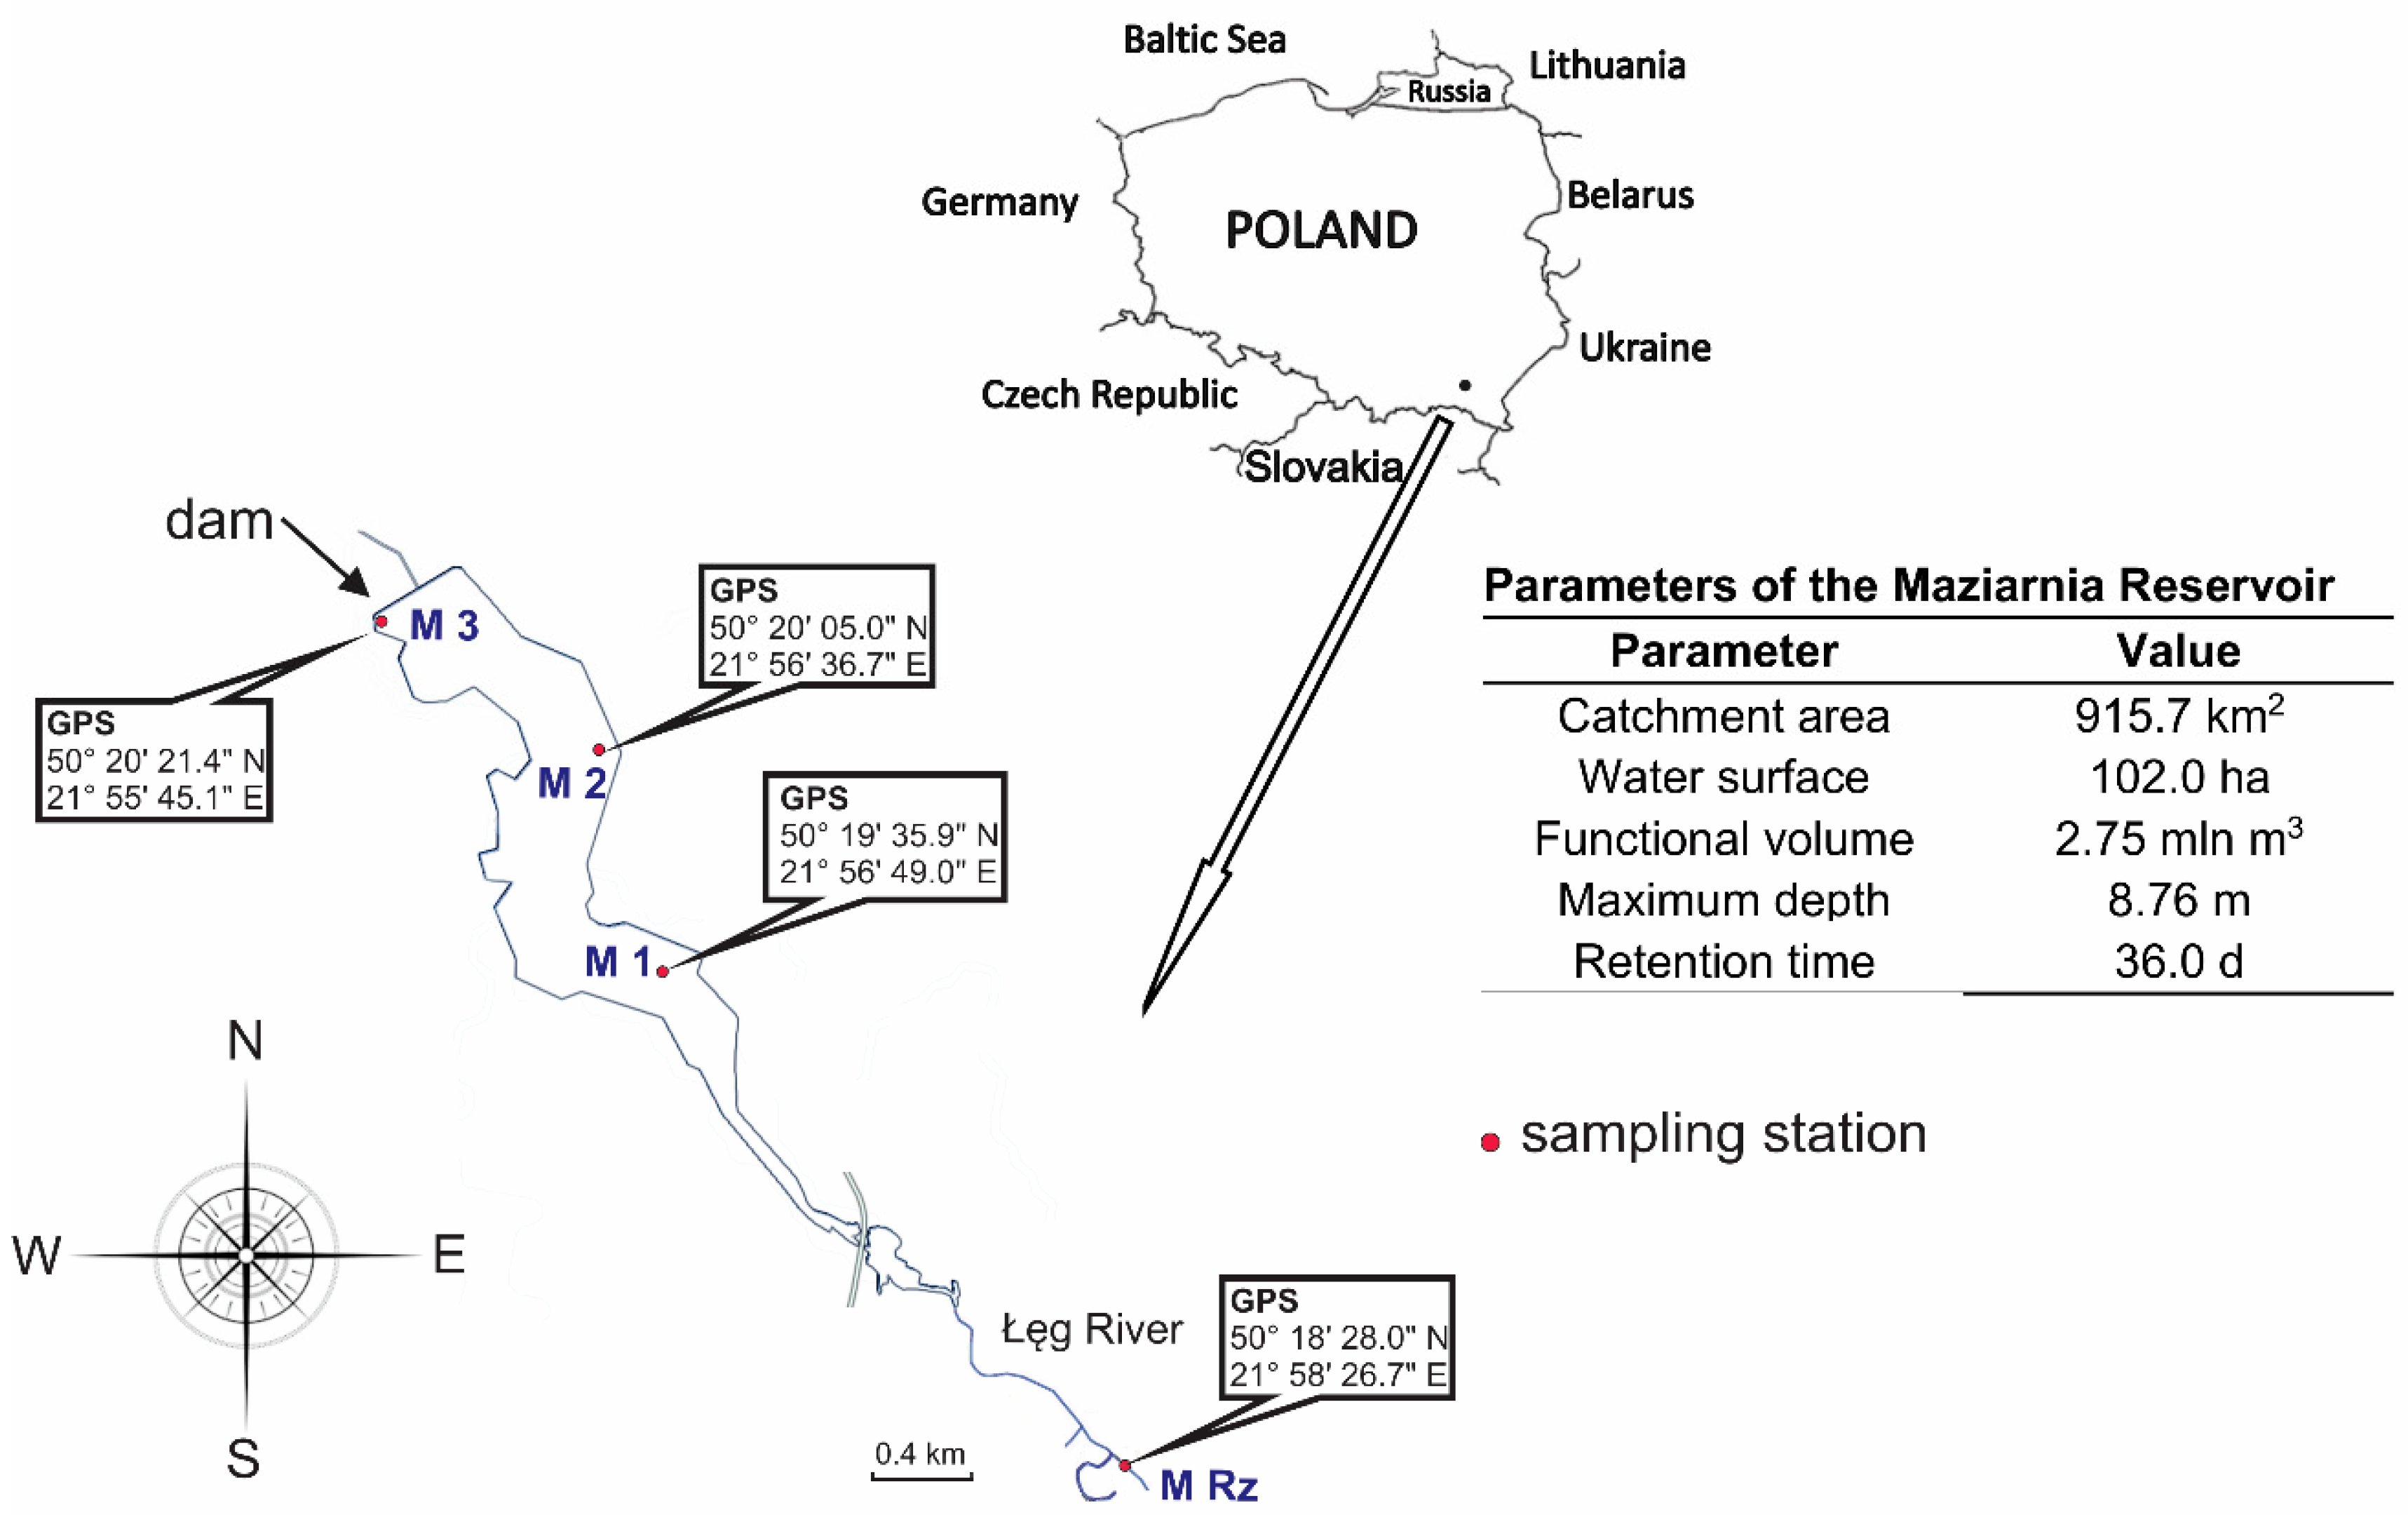
2.1. Study Area

Research was carried out on the Maziarnia Reservoir located at Wilcza Wola, in South-Eastern (SE) Poland’s Podkarpackie Voivodeship. The climate here is moderate, with a long-term (the 30-year Moving Annual Total (MAT)) mean annual temperature of +7.6 °C, while land use in the catchment is predominantly agricultural. Constructed in the years 1974–1989 along the River Łęg, the Reservoir has a primary function involving flood retention, with water also powering a hydroelectric plant located below the dam. The Reservoir has also gained use in fish farming and angling; bathing is permitted in places. The Reservoir’s frontal earth dam is 420 m long and of 6 m crown width. Other selected morphometric and hydrological parameters of the Reservoir are as shown in Figure 1 [26,27].

2.2. Research Methods

Three stations established at which sedimentation in the Reservoir were studied, i.e., M1 (near the inflow of the reservoir), M2 (near the centre of the reservoir) and M3 (near the dam of the reservoir). Monitoring station MRz was established on the Łęg River (Figure 1), with measurements made there involving the content of the suspended sediment (SS) and organic matter in suspended sediment (OMSS).
Key in situ research was carried out between 8 May and 11 September 2018, via six consecutive research series. Sediment was collected in plexiglass traps of innovative construction, given the presence of two chambers in a cylindrical vessel with sedimentation funnel featuring an apical deflector [28,29]. Traps of this design were set up approximately 3 m from the shore (at stations M2 and M3), and 100 m at station M1, at a depth of approximately 1.6 m. A steel frame kept traps in position at the bottom of the Reservoir.
In each series, traps were exposed in the Reservoir for approximately 3 weeks. At the beginning, in the middle and at the end of each research series, water was sampled to determine the content of suspended sediment and OM contribution. Water samples for analysis were taken from depths of about 50 cm at the same place in which the sedimentation trap was set. In addition, each research series ended with the collection of trapped (sediment-trap) sediment, sampling of bottom sediment and sampling of water for physico-chemical analysis. The collection of the bottom sediments involved a sampler designed especially for the purpose (Figure 2) [30].

2.2.1. Physico-Chemical Analysis of Water Samples

Basic physico-chemical parameters of surface water were measured in situ, using a multi-parameter meter (Hach Lange HQ30d, GmbH, Düsseldorf, Germany). Data thus related to temperature (TW), pH and oxygen saturation (O2), as augmented by information on the daily discharge of water from the Reservoir (Q) obtained from the host of the facility.
Suspended sediment (SS) concentration and OM content was analysed in the laboratory. SS was analysed by filtering a known volume of water sample through a GF/F glass-fibre filter (Whatman, Maidstone, UK). Prior to filtration, the filter had been subject to ignition (at 550 °C) for 4 h. After filtration, the filter was dried (at 105 °C) for 4 h. The content of SS was then the difference between filter masses without and with suspended matter and the volume of water used in filtration. OM determinations then involved the filter with residue being ignited (at 550 °C) for 4 h following filtration and drying. OMSS content was calculated in line with the dependent relationship relating to losses on ignition [31].
Determinations of total phosphorus (TPW) and chlorophyll a (Chl a) in samples of surface water were done on a Aquamate 2500E spectrophotometer (Thermo Electron Corporation, Rugby, England). Total phosphorus was determined after prior mineralisation. Reservoir water was assessed for trophic state by reference to the Carlson and Walker TSI (Trophic State Index). This makes reference to the aforementioned average concentrations of total phosphorus and chlorophyll a as determined.

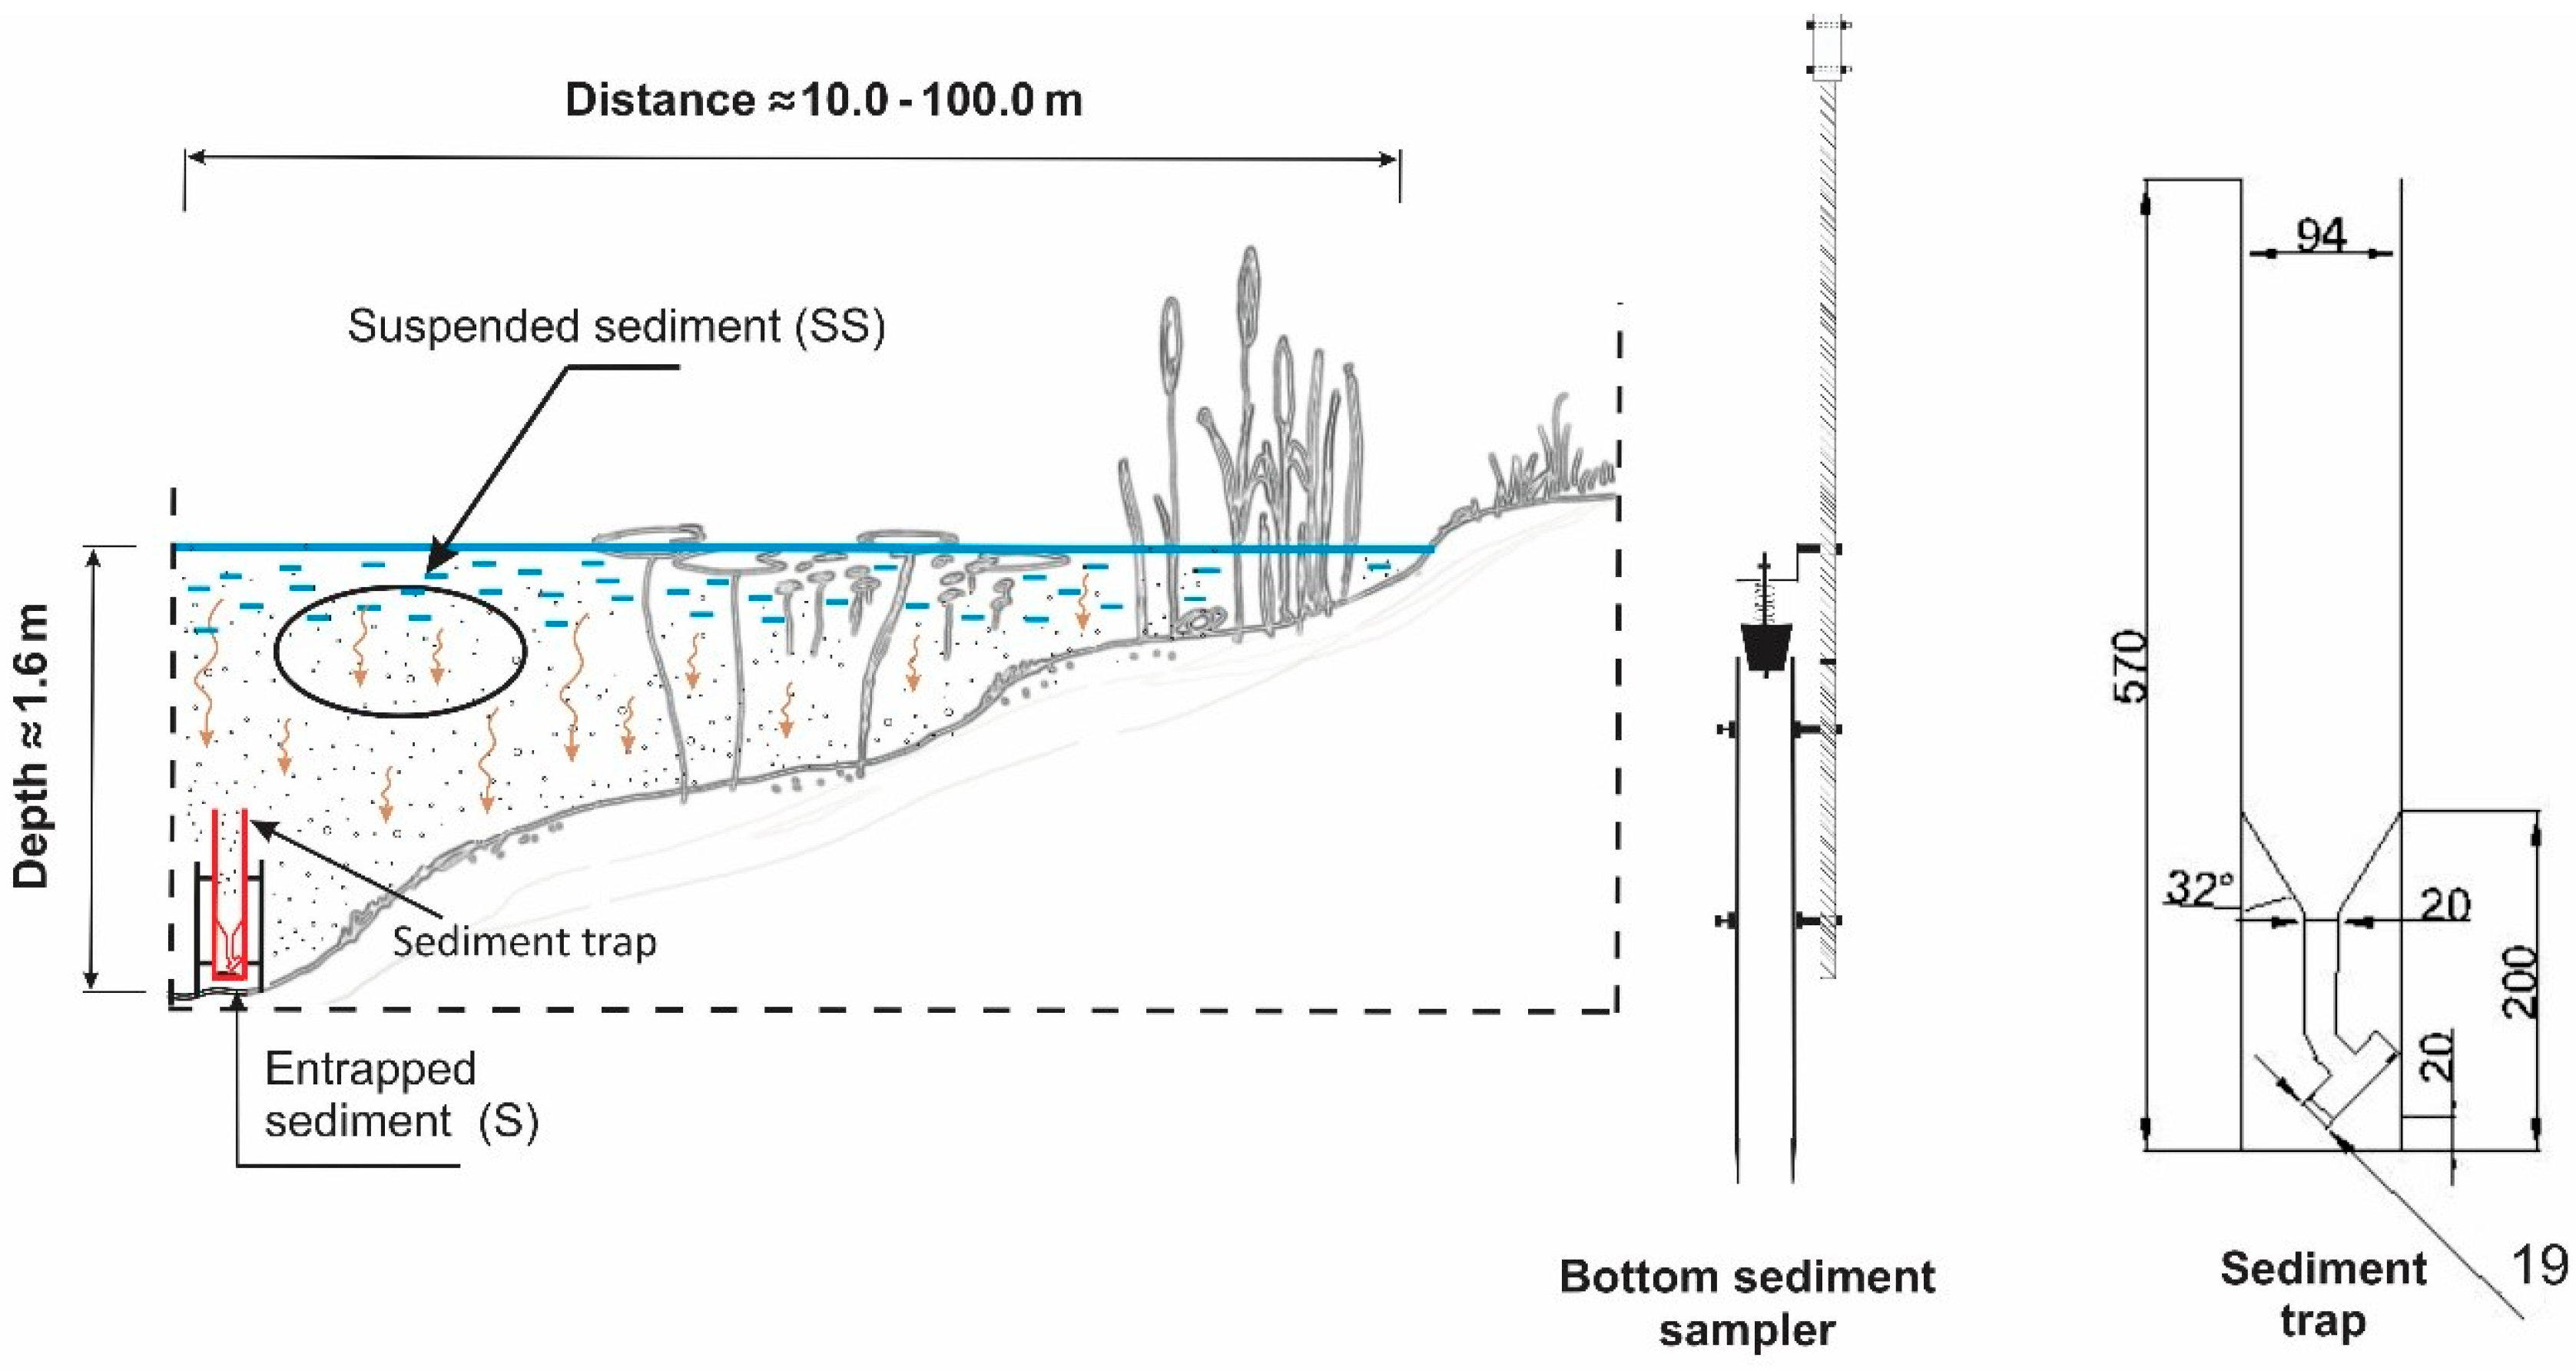
2.2.2. Analysis of Sediments

Entrapped sediment was analysed to determine air-dried weight (d.w.), rate of sedimentation (Us), the isotopic composition of total organic carbon (δ13C-TOC), concentrations of and loading with total P (TPS, L-TPS) and content of organic matter (OMS). Samples of bottom sediment were in turn analysed for their concentrations of total phosphorus (TPSB) and organic-matter content (OMSB). The content of organic matter in sediments (OMS and OMSB) was calculated on the basis of losses on ignition at 550 °C for 4 h.
The isotopic composition of organic carbon (δ13C-TOC) was determined using an IRMS—DELTAPlus Finnigan Mat isotope mass spectrometer (Thermo Electron Corporation, Waltham, MA, USA), while TPS and TPSB were again analysed using the Aquamate 2500E spectrophotometer (Thermo Electron Corporation, Rugby, England). For that purpose, samples of sediment were mineralised spectrally with pure concentrated HNO3 in a Mars 6 microwave mineraliser (CEM MATTHEWS, Matthews, NC, USA).
Total phosphorus loading of the reservoir bottom (L-TPS) was calculated by reference to the product of the determined rate of sedimentation (Us) and the concentration of total phosphorus (TPS).

2.2.3. The Origin of Organic Matter

The origin of the organic matter present in entrapped sediment was determined using the isotopic index δ13C-TOC, with the “mixed two-source” model [32,33,34]:
u a = Y p Y t Y a Y t
where:
Y p is the value for δ13C-TOC in the sediment being characterised,
Y a is the value for δ13C-TOC for matter of autochthonous origin,
Y t is the value for δ13C-TOC for matter of terrigenous origin,
u a is the contribution made for matter of autochthonous origin,
u t is the contribution made for matter of terrigenous origin.
Determination of values for Yt and Ya involved the analysis of suspended matter sampled in spring (on 11 April 2018) from station MRz located up on the river, as well as in summer (on 9 July 2018) from the Reservoir’s centrally-located site. Values of δ13C-TOC were determined for this material, and then deemed to be standards corresponding to material of a terrigenous nature (δ13C-TOC = −29.32‰) or an autochthonous nature (δ13C-TOC = −32.08‰).

2.3. Statistical Analysis

Results were interpreted by reference to minimum and maximum values, arithmetic means, standard errors and standard deviations. Relationships were assessed by quantile analysis of data, with non-parametric Spearman rank correlation coefficients (rs) and Kruskal-Wallis one-way analysis of variance by ranks (ANOVA KW) determined (for lack of homogeneity of variance in groups), as well as corresponding significance levels (α = 0.05). Relevant calculations were performed by the Statistica 12.5 PL program.

3. Results and Discussion

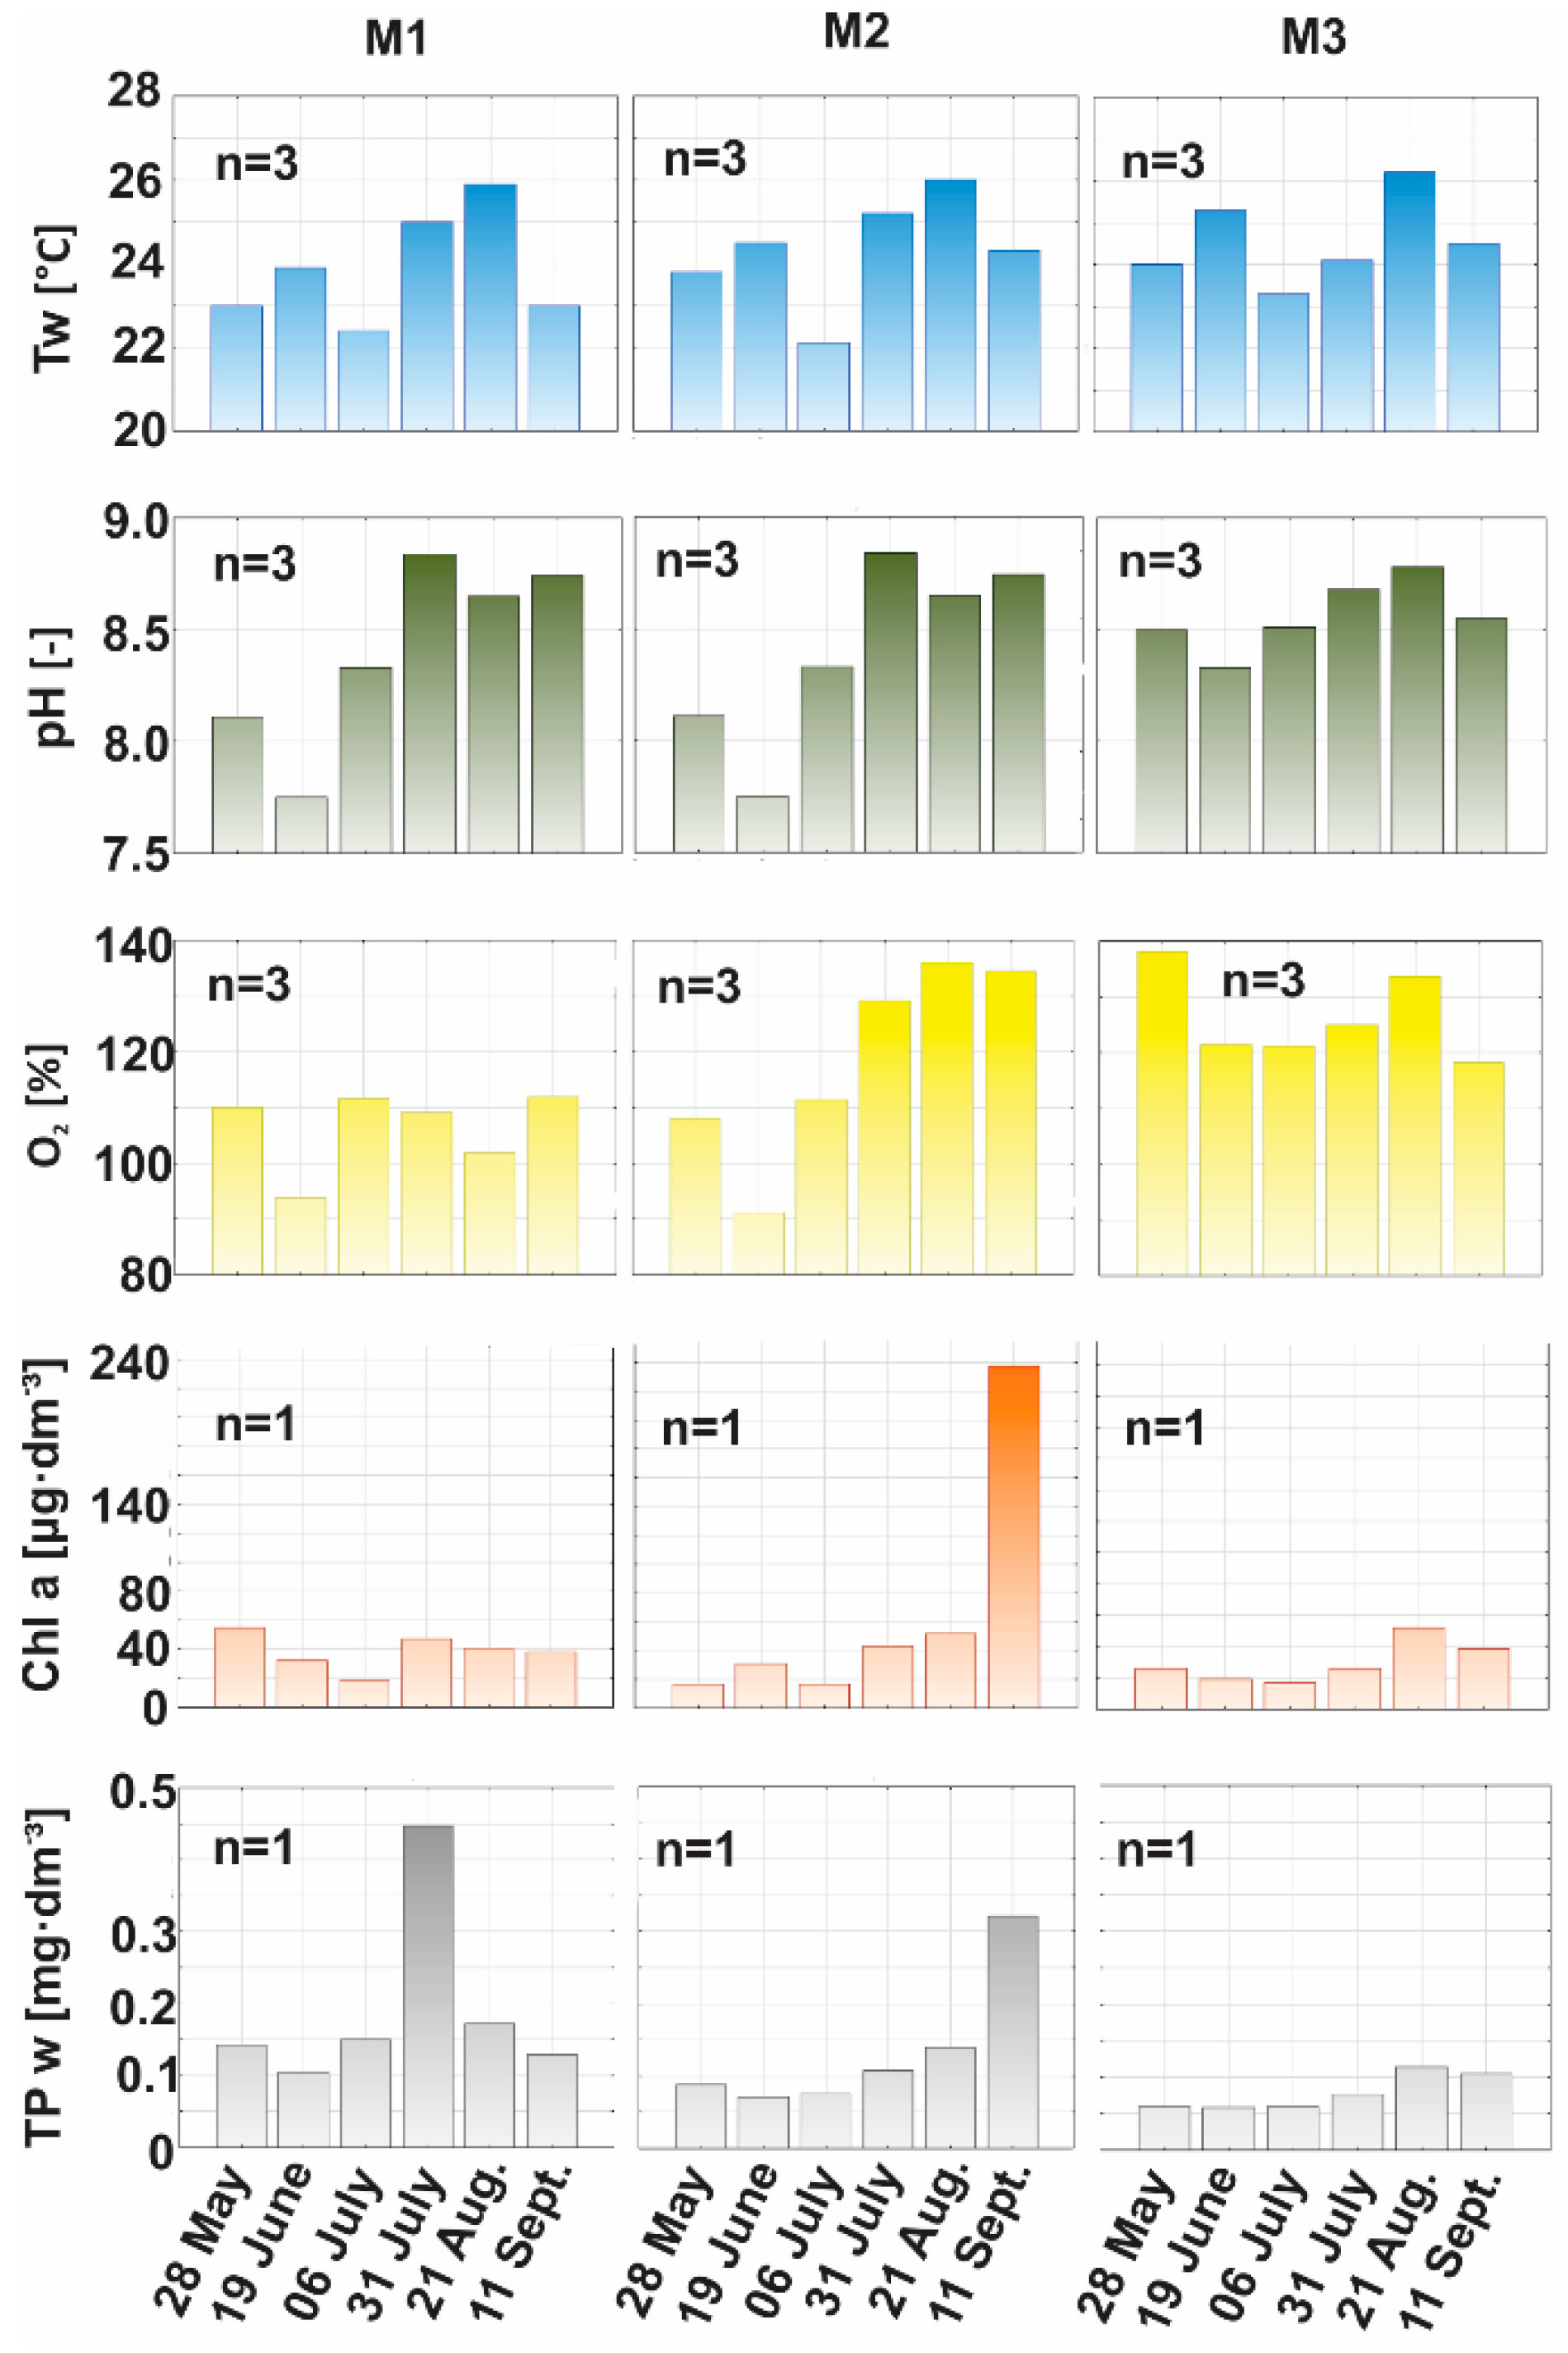
3.1. Physico-Chemical Parameters of Water

Water temperatures were shown to vary little (ANOVA KW, p = 0,46, p > α), as stations were only separated by short distances of around 500 m. Mean water temperature of the Reservoir during the study period was 24.2 °C, with the range being 22.1–26.2 °C (SD 1.21). The highest temperatures were noted during the peak summer season (31 July 2018–21 August 2018) (Figure 3).
Like values for temperature, pH readings proved uniform, with no significant differences between stations (ANOVA KW, p = 0.07, p > α). Values were in the 7.75–8.84 range (SD 0.30) (Figure 3), with both the highest and lowest characterising station M2. pH found to correlate significantly with oxygen (O2) saturation values (rs = 0.80, p < 0.01, n = 18).
While the average level of oxygen saturation in the study period was 117.0%, values varied significantly (ANOVA KW, p = 0.01, p < α) across the 91.1–138.1% range (SD 14.1) (Figure 3). The highest value was recorded at station M3 at a time of high water temperatures (133.6% associated with 26.2 °C). High water temperature favours photosynthesis, to the point where the surface layer of water may feature oxygenation levels well above 100%, though the relationship of this kind did not in fact achieve statistical significance in our study (rs = 0.29, n = 18).
Concentrations of Chl a proved relatively stable (ANOVA KW, p = 0.53, p > α), in the 16.6–54.6 μg·dm−3 range mostly, albeit with a mean value of 33.4 μg·dm−3 (SD 13.4). On 11 September 2018, a specific increase to 236.9 μg·dm−3 was observable at station M2 (Figure 3), and found to coincide with near-maximum values for water temperature, oxygen saturation and total phosphorus. Basically, where favourable environmental conditions persist for longer, an activation of life processes in photosynthetic aquatic organisms takes place, the key factors alongside trophic conditions being temperature, light intensity, and so on [31,35]. In a general sense, the Chl a concentration is indicative of phytoplankton biomass and the intense blooms of cyanobacteria observed at the time may be invoked directly to account for the observed episodic increase in Chl a. A significant correlation between concentrations of total phosphorus in water (TPW) and Chl a also was noted (rs = 0.71, p < 0.01, n = 18).
Water at the stations studied differed markedly in TPW (ANOVA KW, p = 0.02, p < α). Values were in the 0.06–0.45 mg·dm−3 range (mean 0.13, SD 0.1). Spatial influences were such that average TPW concentrations tended to be lower further from M1 (with its 0.19 mg·dm−3 at a site near the inflow), in the direction of the dam and station M3, which recorded a mean of 0.08 mg·dm−3 (Figure 3). In turn, mean TPW content at station M2 (near the centre of the reservoir) corresponded with the average value determined for the water as a whole (0.13 mg·dm−3).

3.2. The Assessed Trophic State of the Reservoir

Ultimately, the trophic indexes relating to TSITP and TSIChl a—both calculated in line with the Carlson and Walker guidelines—suggest a classification of the Reservoir as a whole as hypertrophic.
Based on data for phosphorus and chlorophyll, these corresponded to hypertrophy of water at both the inflow area (station M1) and the Reservoir’s centre (station M2). In contrast, near the dam, the status was eutrophic with hypertrophy. Putatively at least, this trophic state (especially at the station of inflow) reflects the introduction of excessive loads of biogenic compounds from the catchment area, which is predominantly agricultural.
Nutrient content in a body of water that is disproportionate to the demand may lead to a disturbed balance of production and decomposition of organic matter, with the consequence being excessive accumulation in both water and bottom sediments [36].

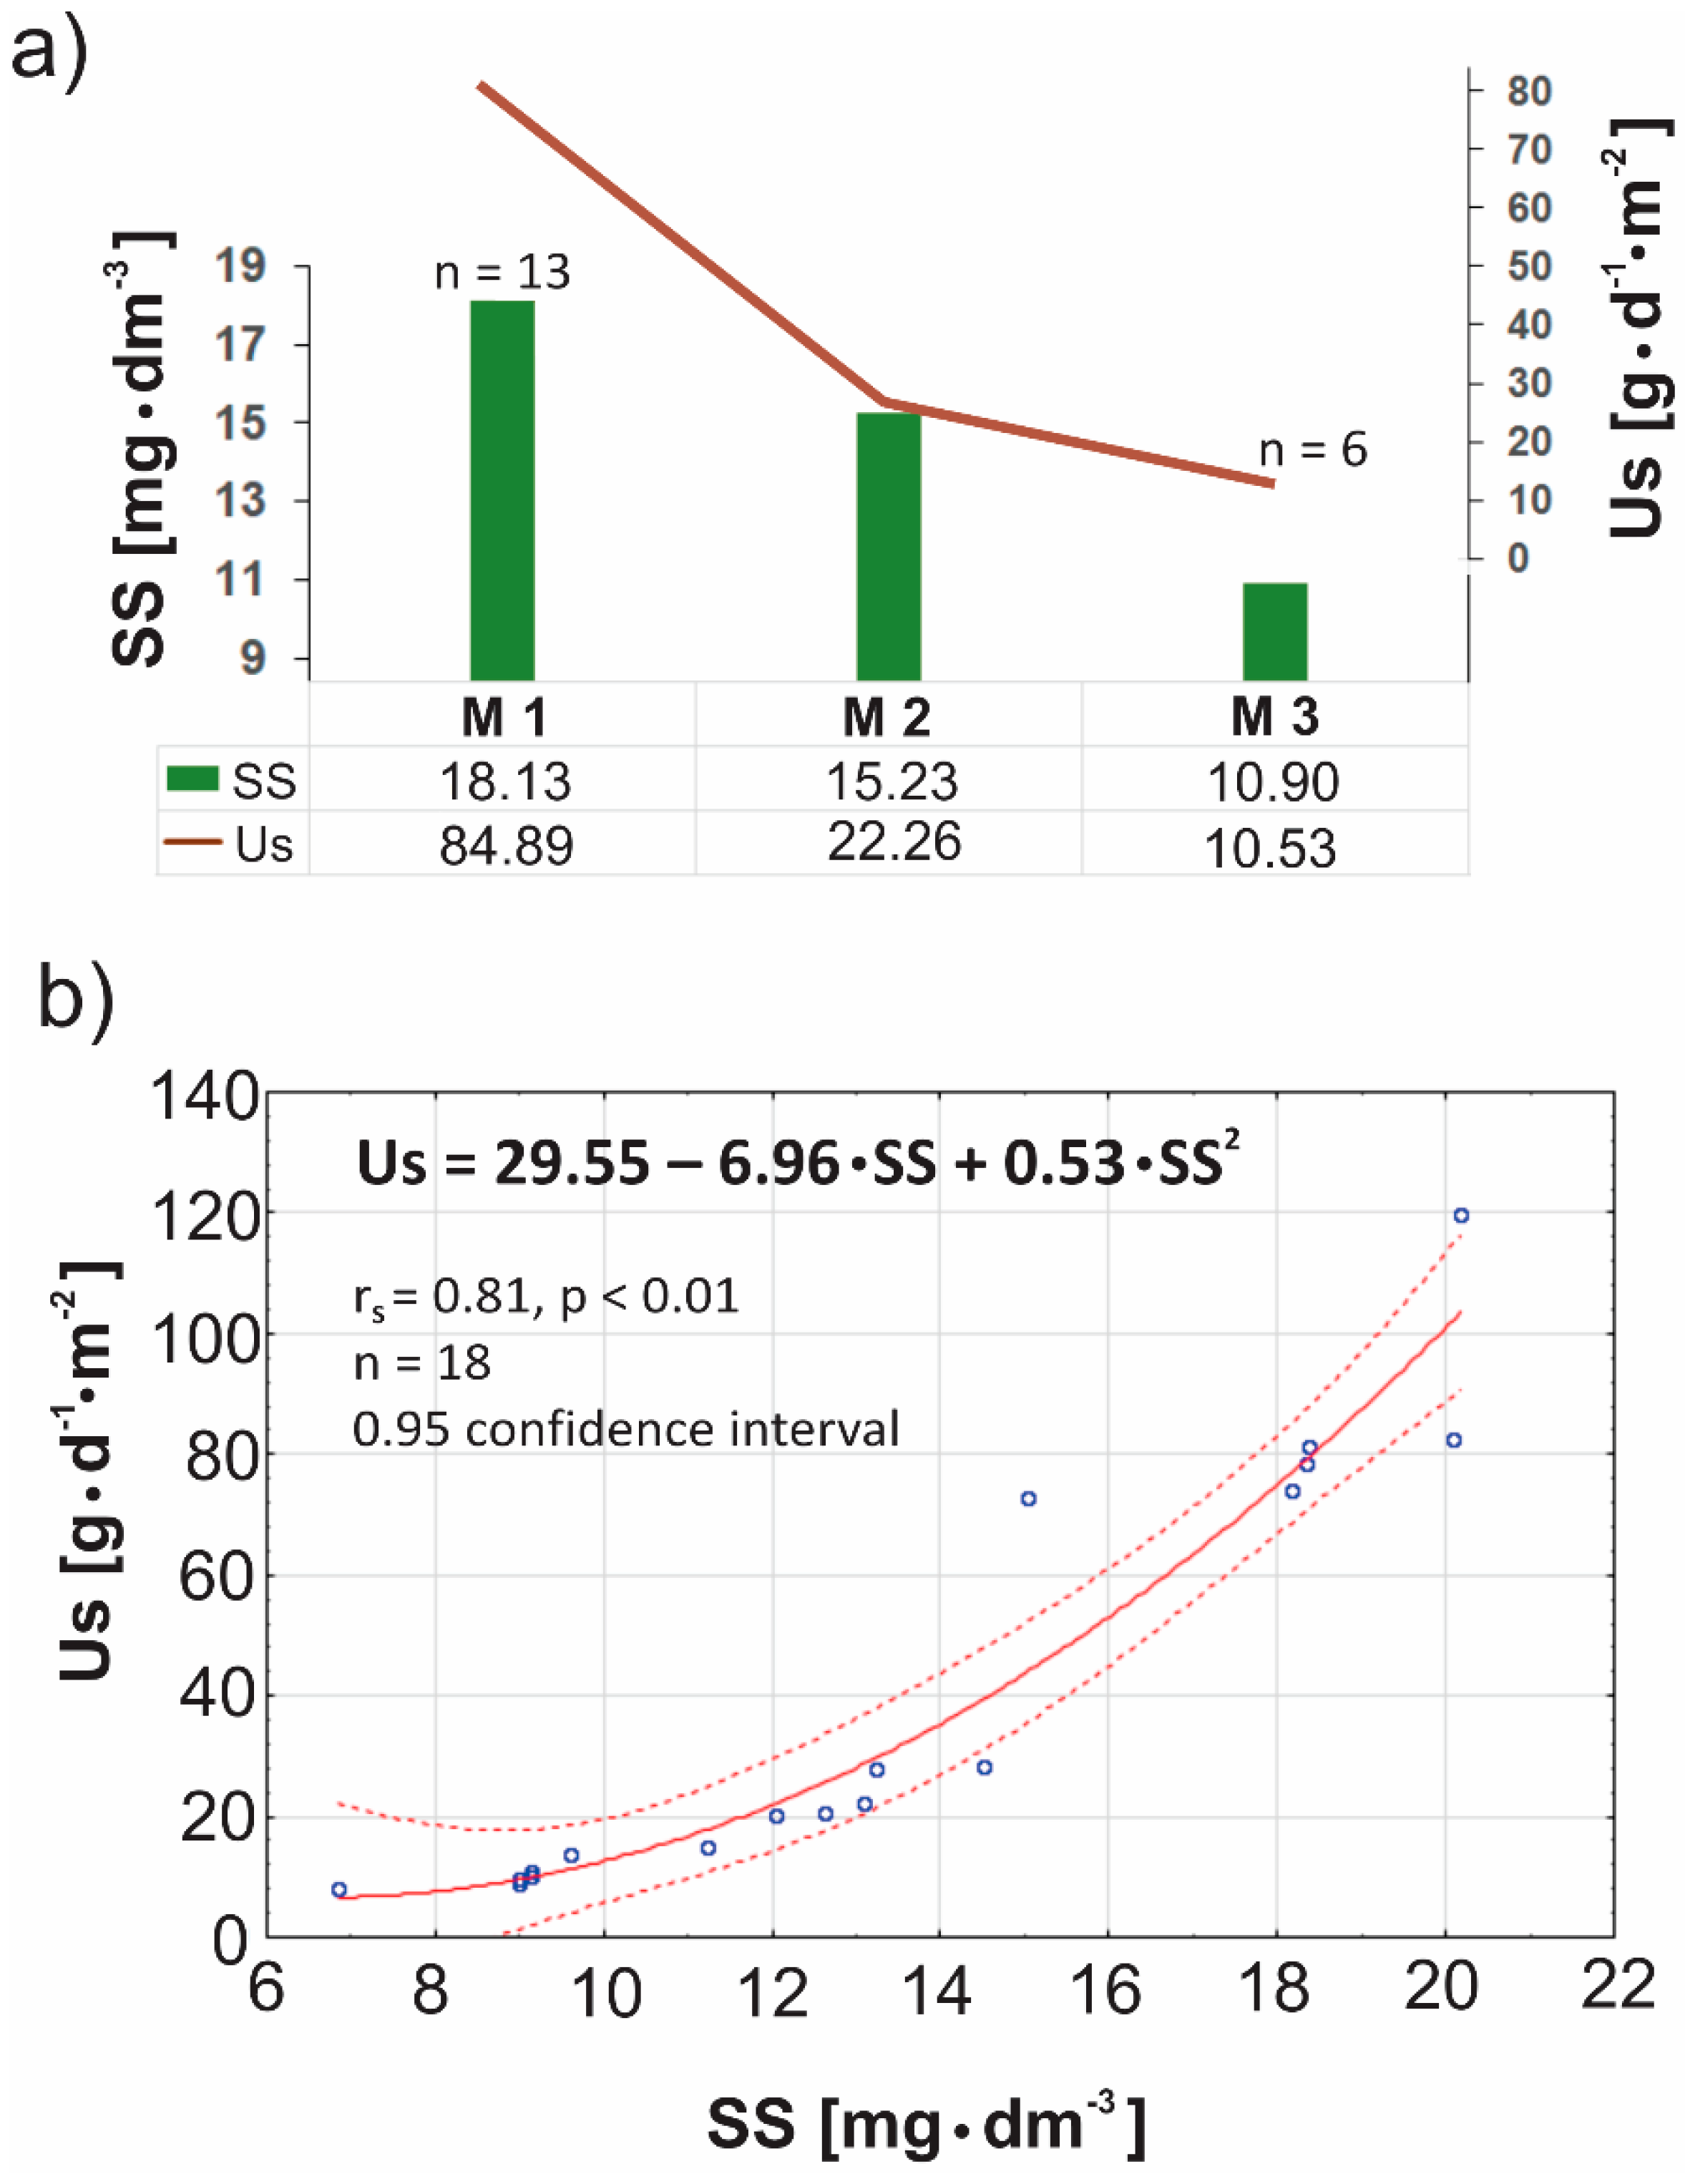
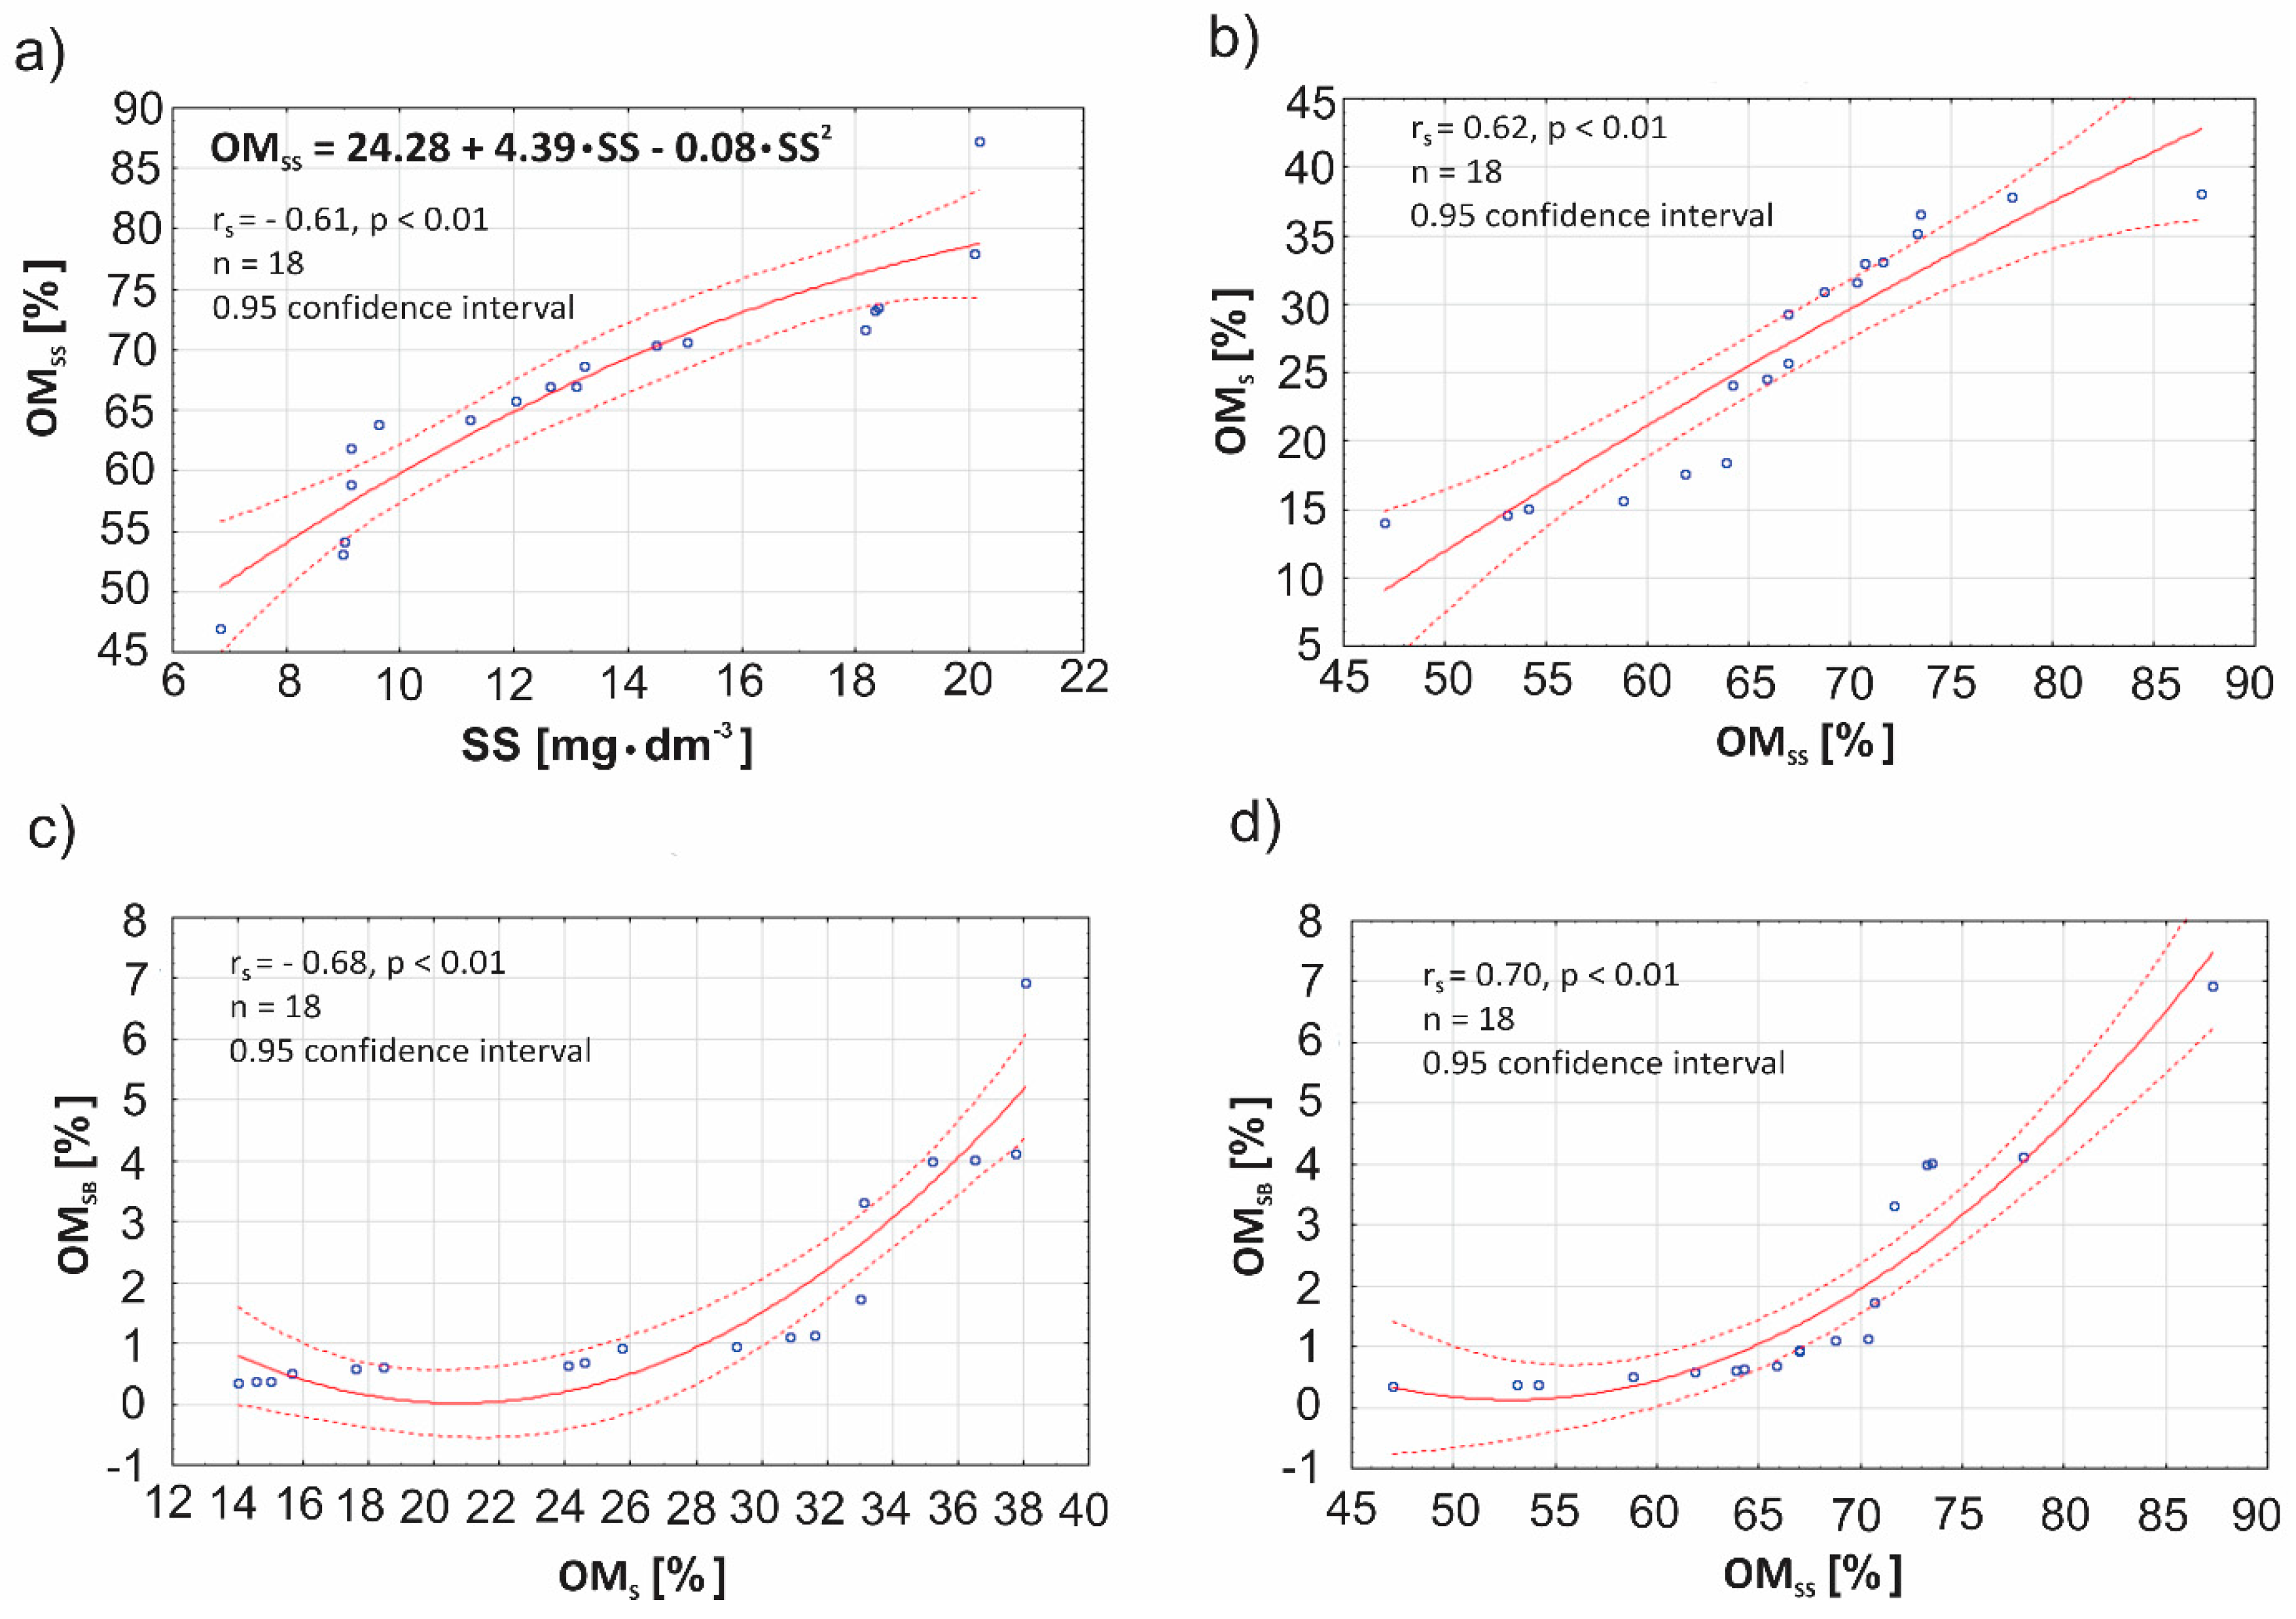
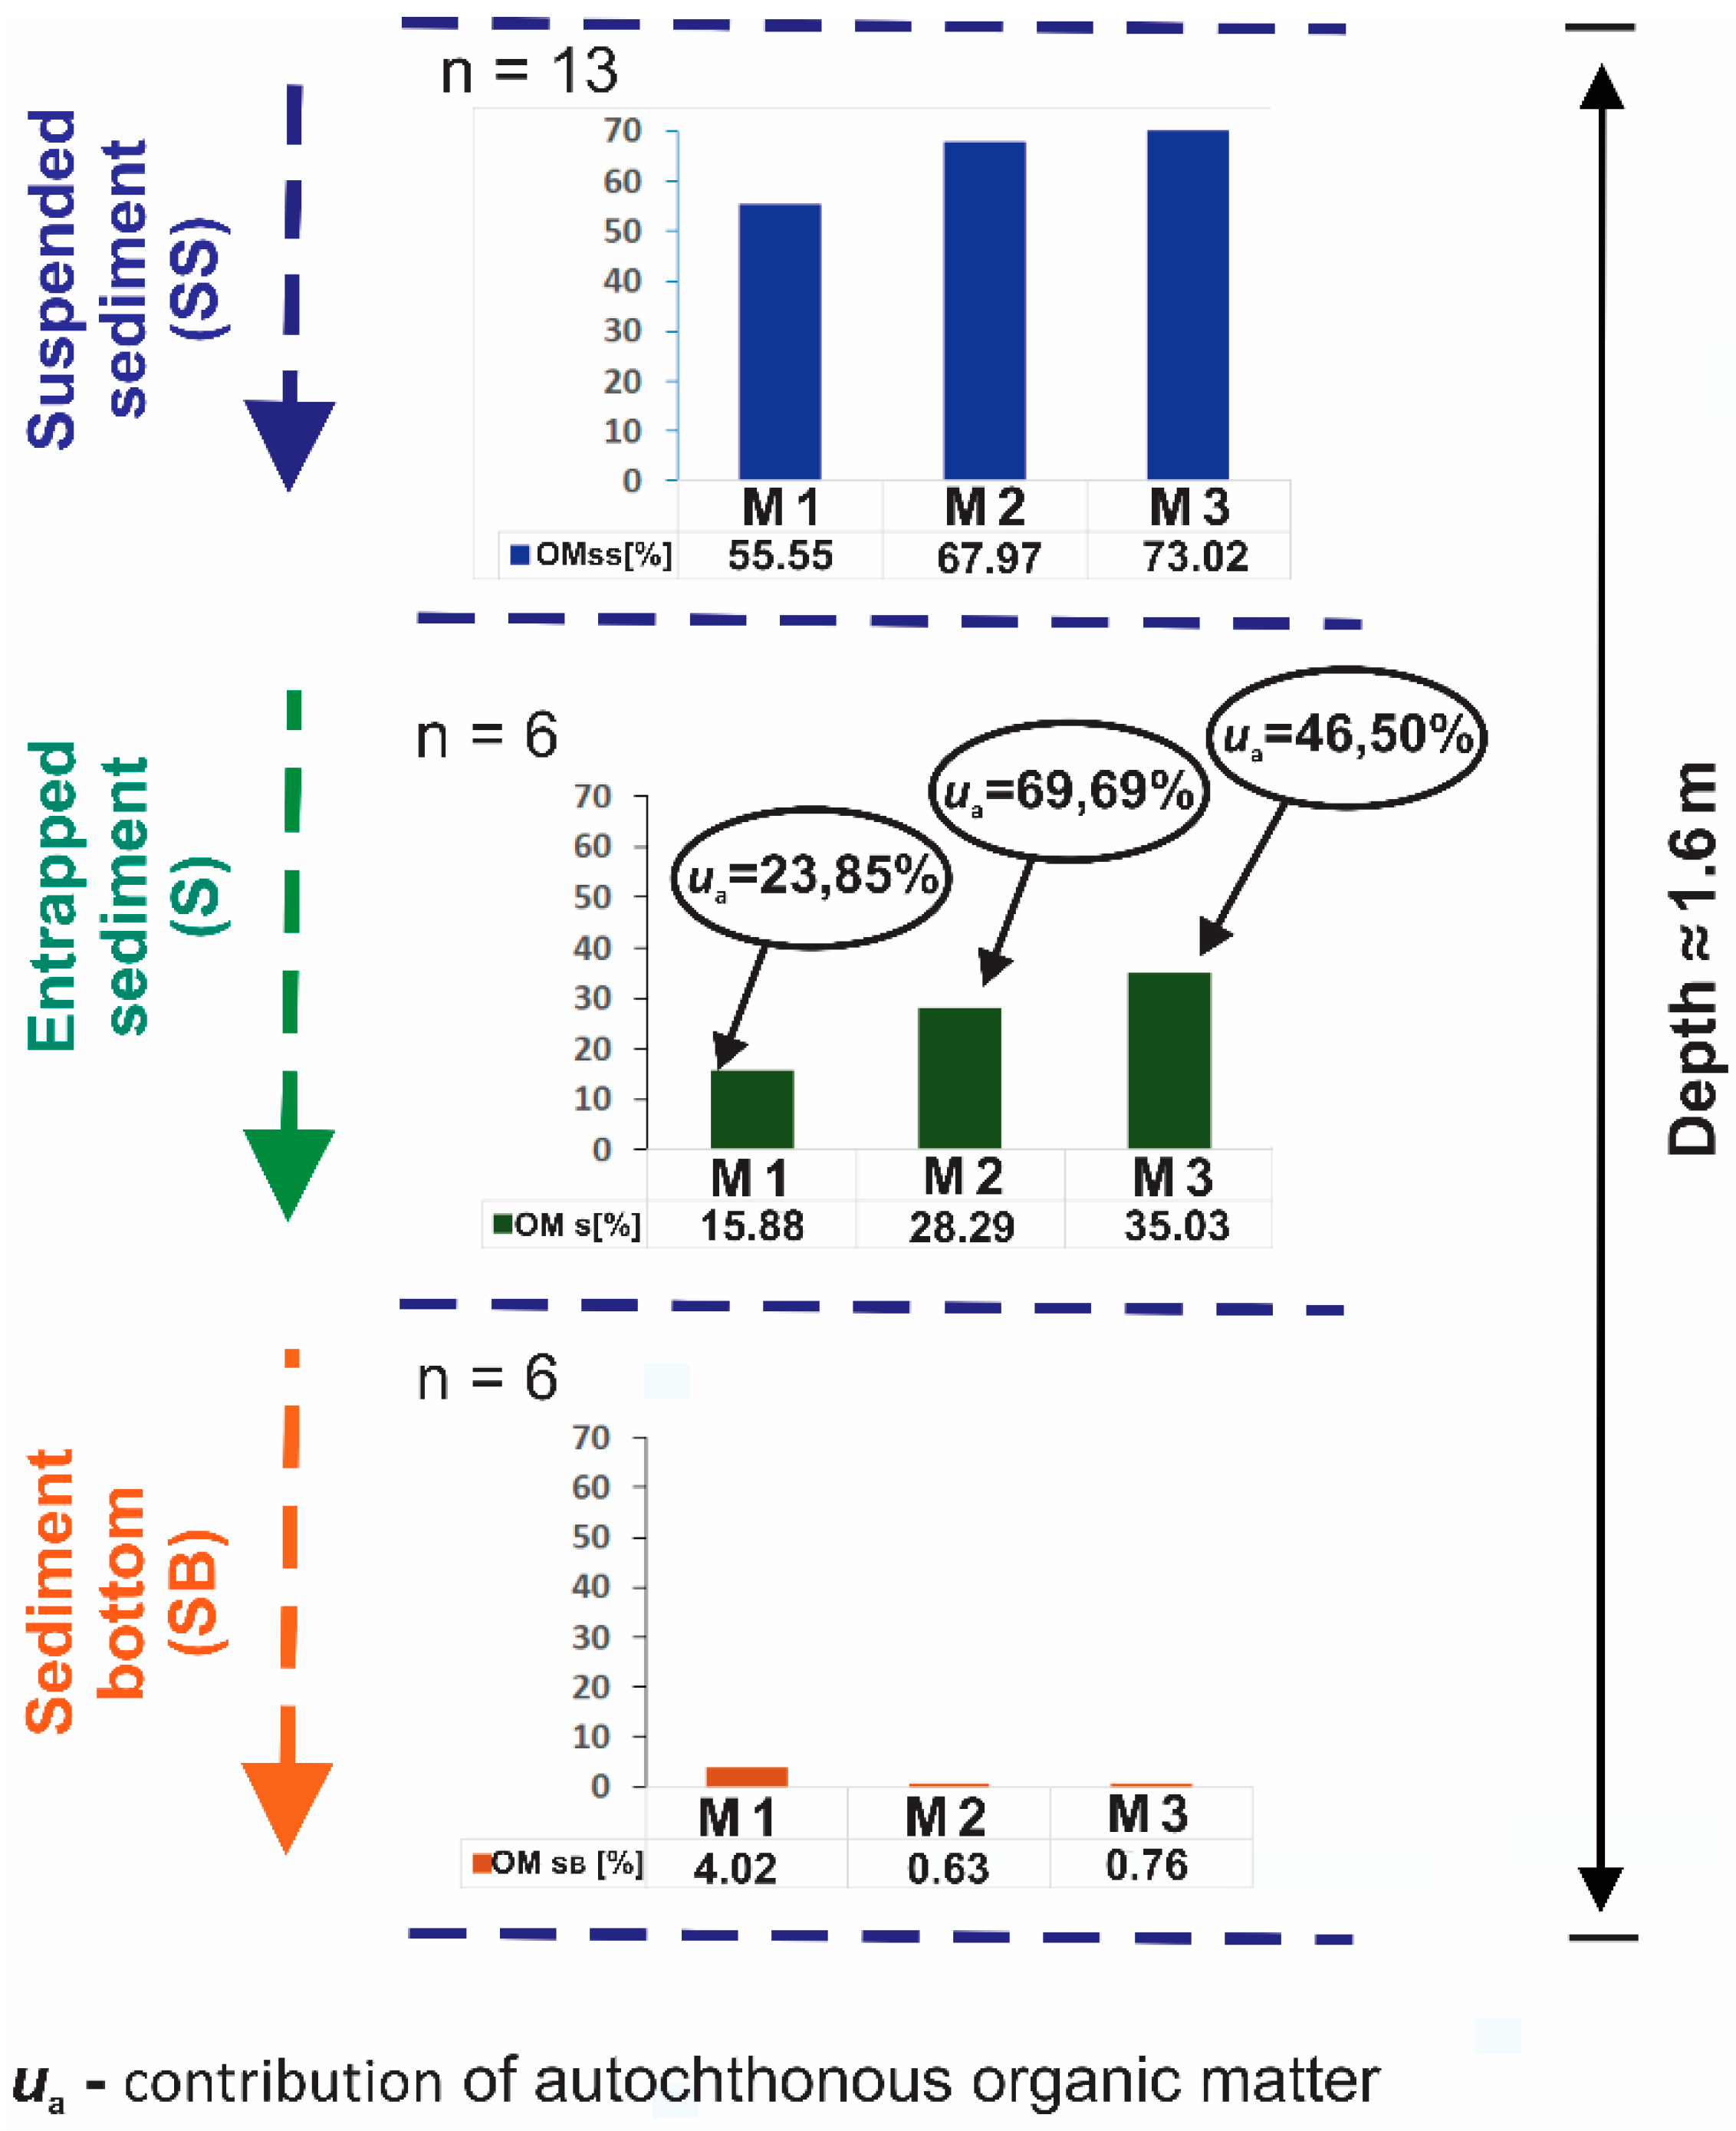
3.3. Analysis of Suspended Sediments

The average reservoir sedimentation rate (Us) during the 2018 study period was 39.19 g⋅day−1⋅m−2. Depending on the locations of given stations the sedimentation rate varied from 119.76 g⋅day−1⋅m−2 at M1 (near the inflow) to 8.16 g⋅day −1⋅m−2 at M3 (near the dam), and it was a significant differentiation (ANOVA KW, p = 0.02, p < α). Sediments accumulated most intensively in the inflow area (mean 84.89 g⋅day−1⋅m−2), while close on the dam, a relatively a small amount of sediments accumulated (mean 10.53 g⋅day−1⋅m−2) (Figure 4a). At this time the average concentration of sediments suspended in the water of the reservoir (SS) was 13.31 mg⋅dm−3. However, values for this parameter oscillated from 6.83 mg⋅dm−3 (at station M3) to 20.17 mg⋅dm−3 (M1) (Figure 4a). An increase in SS concentrations at M1 station was observed in relation to station on the Leg River—MRz (average 10.86 mg⋅dm−3, max 14.16 mg⋅dm−3, min 8.74 mg⋅dm−3).
Under appropriate conditions, larger sediment fractions tend to settle in the inflow area to the Reservoir, while smaller fractions reach the dam still in suspended form (such that the water there remains cloudy). The silting process is a product of the size of sediment particles in relation to hydraulic conditions, as well as cohesion or non-cohesive properties. Small-fraction sediment may become adsorbed on to the surfaces of plants, while root systems can create a natural barrier between elements of the sediment-water configuration, thus preventing the transport and resuspension of sediments in a reservoir [3,37]. In addition, small fractions formed under certain conditions, such as when coastal erosion takes place, may form larger aggregates that sink at a much faster rate [2,38].
There was a clear relationship between the content of sediments suspended in water (SS), and the rate of their sedimentation (Us). The tendency for the content of sediments suspended in water to vary overlapped with fluctuations in the rate of sedimentation (Figure 4a). The strong correlation between these parameters achieved statistical significance (rs = 0.81, p < 0.01, n = 18) (Figure 4b), and the existence of such a strong correlation allowed for the development of the function described in Figure 4b, which provides for the forecasting of the rate of accumulation of sediment through analysis of suspended matter.
Analysis of hydrological conditions showed that, not only sediment fractions, but also water discharge from the Reservoir (Q), plays an important role in the process whereby suspended sediments accumulate in water. The greatest impact of this kind was to be observed at stations M1 and M2 (i.e., near the inflow and at the centre of the Reservoir) (Figure 5).
The relationship between sedimentation rate and discharge of water from the Reservoir varied among the reservoir sampling sites (Figure 5). While no statistically significant relationship was observed between Us and Q readings, the increased discharge of water from the Reservoir was seen to slow the rate of sedimentation of suspended matter at station M1 (near the inflow) (Figure 5). The reverse trend was displayed by the rate of sedimentation at station M2 (near the centre), where greater water discharge was associated with a significant increase in the rate of suspension of matter (Figure 5). In turn, the accumulation of sediments at station M3 (near the dam) was in practice unrelated to variability in water discharge from the Reservoir (rs = 0.03, n = 6) (Figure 5).
The intensity of the sedimentation process is inter alia influenced by the fraction of particles suspended in water, hydrological conditions, climatic zone and season, as well as by a water’s morphometric parameters and trophic state and the nature of its catchment [39]. While studies of sedimentation in Lake Taihu (China) arrived at a mean annual rate of 377 g⋅day−1⋅m−2 [31], observations made in Lake Río Grande II (Colombia) revealed a mean rate of 4540 g⋅day−1⋅m−2 [40].
In marked contrast was the sedimentation rate in Lake Viitna Linajärv (Estonia)—found to range from 0.23 to 1.4 g⋅day −1⋅m−2 [37]. Quantitative analysis of sedimentation in a small reservoir located near Blizne (SE Poland) in turn showed yet another situation, with the mean rate being 16.1 g⋅day −1⋅m−2 (range 13.5–16.9 g⋅day −1⋅m−2) [41].
The trend for variability in the content of sediments suspended in water (SS) correlated with fluctuations in the content of organic matter present in sediments of different types (OMSS, OMS, OMSB) (Figure 6). A significant positive correlation between SS values and OMSS was obtained, with rs = 0.61 (p < 0.01, for n = 18). The correlation noted allowed for the development of a dependent relationship (described in Figure 6a) with which the general load of organic pollutants deposited in the Reservoir may be predicted. Content of organic matter is one of the most important indicators of environmental pollution, since it can represent the summary load of all organic pollutants present in an ecosystem [42].
Figure 7 offers a comparison of means for OM content at the Reservoir’s different stations. The ordering of data presented for individual layers is consistent with the direction of sedimentation of suspended sediments, i.e., from the water column towards the bottom of the Reservoir at a depth of about 1.6 m. Spatially, data are located at the inflow towards the station near the dam.
Mean OM content of suspended sediments in the Reservoir (OMSS) was in the 55%–70% range (depending on station), with a clear trend for the proportion to be higher closer to the dam (at station M3). A similar trend was to be noted for the OM content of trapped sediment (OMS). The range of the latter values was 16%–35%. As it emerged that these of the sediments only had half or a third as much organic matter than as suspended sediments (OMSS), the suggestion is that falling organic matter undergoes rapid decomposition.
Analysis of mean values for organic matter in the cases of bottom sediments (OMSB) and of trapped sediment (OMS) revealed that OMSB content had values many times lower than (only 2%–25% as high as) in OMS (depending on the station). Mean content of organic matter in bottom sediments (OMSB) was in the 0.8%–4.0% range (again depending of the station), with a tendency for values to be lower close to station M3 in the vicinity of the dam.
The entrapped sediment was analysed in relation to the perceived origin of organic matter. Obtained values of δ13C-TOC were used to assess the contribution made by matter of autochthonous origin (Equation (1)). The latter was found to predominate, the implication being internal production in the Reservoir. The contribution was greater along a notional transect from the inflow to the centre of the Reservoir (a figure of 23.85% compared with 69.69%). The share of autochthonous matter was again lower at M3 (near the dam), with ua = 46.50%. This phenomenon may relate to the specific nature of the catchment area by station M3, which is 10 m offshore, near a coastal area featuring a steep forest-covered slope with developed ground cover (mainly of mosses). It emerged that an important role in shaping the contribution of matter of autochthonous and terrigenic origin was played by coastal erosion, with the eluviation of matter of terrestrial origin. This was confirmed by the isotopic composition of total organic carbon determined for trapped sediments (mean δ13C-TOC = −30.6‰, min = 31.7‰, max = −29.5‰) (Figure 7).
Such values are similar to those for the isotopic composition of carbon in vascular plants of terrestrial origin, with δ13C-TOC for trees and shrubs for example ranging from −25‰ to −28‰, while the corresponding figure for moss was around −29‰ [24,25].
The nature of organic matter changes constantly during transport to the Reservoir, and then during fall through water column and later deposition on the bottom. On the other hand, rate of change and the specificity of what occurs is very much dependent on chemical attributes of the organic material involved, as well as prevalent conditions [22,43]. The importance of turbidity currents running over the reservoir bottom should also be emphasised. These environmental flows, common in reservoirs, have a potential for the transport of sediments and organic matter depending on the grain size and suspended concentration [44].
The mean content of organic matter characterising suspended sediments at station MRz on the Reservoir’s feeder-river was 37.27% (min = 27.48%, max = 44.59%). In contrast, as early as at station M1 (near the inflow), a higher mean content (of OMSS = 55.55%) was present. This trend was apparently maintained, given OMSS = 73.02% for station M3 located near the dam.
The mean value for the δ13C-TOC parameter characterising the organic carbon isotopic composition of trapped sediments was −30.61‰. The sediments most enriched in 13C were those near the inflow (δ13C-TOC = −29.35‰), while those found to be most depleted were close to the dam (δ13C-TOC = −31.92‰) (Figure 8a). The depletion or enrichment of sediment organic matter in the heavier 13C isotope was associated with either the highest or lowest contents of total P.
The phenomenon of sediments being depleted of the heavier 13C isotope occurred with phytoplankton growing intensively (in periods of cyanobacterial bloom). In suitable environmental conditions, where reservoir retention times are sufficiently long (of at least a few weeks), there is a phenomenon of increased assimilation of phosphorus by the flora (i.a., phytoplankton), by bacteria and by the fauna [35,45]. Observed relationships with the 13C depletion of the analysed sediments can be related to the process of phosphorus (mainly ATP) retention in the cells of aquatic organisms (Figure 8b).
Analysis of the dependent relationship between δ13C-TOC and total phosphorus content in trapped sediments (TPS) revealed a statistically significant inverse correlation (rs = −0.68, p < 0.01, n = 18) (Figure 8b). The relationship proves useful in ascertaining the source of phosphorus, and in forecasting its concentration in reservoir sediments.
The mean concentration of total phosphorus in water (TPW) was lower beyond station M1 (near the inflow), in the direction of station M3 (near the dam) (Figure 3). The concentration of TPW proved to correlate strongly with the suspended-sediment content (SS) (rs = 0.85, p < 0.01, n = 18). In contrast, mean content of total phosphorus in trapped sediments (TPS) displayed the opposite trend to that characterising the TP concentration in water.
The mean concentration of total P in trapped sediments (TPS) was greater in the direction of the near-dam station (M3) (Figure 9). In this case, a significant negative correlation was observed with the content of suspended sediments (SS) (rs = −0.60, p < 0.01, n = 18). The tendency for mean concentrations of total phosphorus in bottom sediments (TPSB) to be variable was further characterised by a course opposite to that applying to TPS, but analogous to that with TPW, in that average TPSB values tended to be lower towards the station near the dam (Figure 9). As in the case of TPW, there was a significant correlation between TPSB and SS (rs = 0.75, p < 0.01, n = 18).
Influxes of phosphorus compounds originating in bottom sediments may in fact account for up to 99% of the content of P in shallow reservoirs. This means that the intensity and duration of the internal process of alimentation with phosphorus is significant for water quality [18,46]. In the case of the Reservoir studied, the most intensive alimentation of this kind is likely to occur near the inflow (at station M1). At this station, the largest total phosphorus load (L-TPS) deposited was of 96.3 mg⋅g−1⋅m−2 on average, while the average concentration of total phosphorus in trapped sediments (TPS) was lower at this station than the others. In turn, the tendency for average concentrations of total phosphorus in bottom sediments (TPSB) to vary related closely to the total phosphorus load deposited on the reservoir bottom (Figure 9). This process was in turn related directly to the most intensive accumulation of suspended sediments in water taking place near the inflow (Figure 4).
Excessive concentration of nutrients (mainly phosphorus and coal) in the reservoir often leads to its ecological degradation, among others causing the development of algae and/or cyanobacteria, some of which may produce toxic compounds (dangerous to other organisms) [47].
In addition, the accumulation of sediments in reservoirs disturbs the carbon cycle in nature and can be a factor accelerating climate change. Generally, in aerobic conditions (rheolimic reservoirs) coal undergoes mineralisation to CO2, while carbon permanently deposited in bottom sediments (dominant anaerobic conditions) is more susceptible to transformation into methane form (CH4). In turn, methane has a 25-fold greater impact on global climate warming than CO2, therefore, it is estimated that methane release from aquatic ecosystems represents annual emissions of 0.8 × 10⁹ tonnes of CO2 equivalent globally generated by human activities. This is about 1.3% of global anthropogenic CO2 equivalent emissions [48].
To conclude, sediments suspended in water are a natural and indispensable element of properly functioning aquatic ecosystems [49]. The occurrence or lack of sediments suspended in water determines the erosive and deposit properties of rivers, and thus, shapes the landscape and controls groundwater levels [50], whereas mechanism enabling the transport of sediment runs according to complex and irregular patterns, and also depends on many factors (e.g., climate, meteorological conditions, coverage and slope of the terrain), but the most important are erosion processes occurring within the catchment (constituting the primary source of suspended sediment in water) [51].
It has been shown that the frequency of rainfall and their intensity significantly affect the load and size of soil particles implemented into rivers [52,53].
Therefore, monitoring the concentration of suspended sediments in water and the rate of accumulation their reservoirs can be a very important informational surrogate in assessing the occurring climate change.

4. Conclusions

Analysis of the trophic state of waters in the Reservoir showed a situation corresponding with hypertrophy in water near the inflow and in the Reservoir’s central part, while conditions near the dam were eutrophic, albeit with hypertrophy occurring. Overall, the Reservoir can be thought of as hypertrophic.
As a result of sedimentation and accumulation in bottom sediments, the content of suspended matter in the Reservoir (SS) fell with the flow of water towards the dam. A similar differentiation was observed in the sedimentation rate (Us), with this being most limited at station M3 and highest at M1. Variability characterising the content of suspended sediment in water correlated closely with differences in rates of sedimentation (rs = 0.81). The nature and strength of this dependent relationship may provide for forecasting of rates of sediment accumulation through analysis of contents of suspended sediment. Most sediment accumulated close to the reservoir inflow, while only a relatively small sediment load was still being transported near the dam.
The variability displayed by contents of organic matter in suspension (OMSS), in entrapped sediment (OMS) and in bottom sediment (OMSB) was related in a significant manner to fluctuations in suspended sediment content (SS). Thus, by analysing contents of suspended sediment in water (SS), it is possible to estimate total loads of organic pollutants deposited in the Reservoir. Furthermore, studying organic matter content introduced with inflow, and its spatial distribution through the Reservoir ecosystem, confirmed intense processes relating to internal production. There was a consistent increase in the OM content of suspended sediments along with the flow of water from the station located on the feeder-river (MRz) to the one by the dam (M3).
Entrapped sediments were found to be dominated by material of autochthonous origin. Its contribution was greater near the centre of the Reservoir than in the inflow (at 69.69% compared with 23.85%), while at station M3 (near the dam), the contribution of autochthonous matter was again lower (ua = 46.50%). Content of organic matter was several times lower in trapped sediments than in suspended matter (OMS vs. OMSS), perhaps suggesting rapid decomposition during the fall to the bottom. This is especially likely given mean values for this parameter (depending on the station) of only 25%, or even just 2%, as high in bottom sediments as in the entrapped sediment.
Analysis of stable carbon isotopes showed that the most-enriched entrapped sediment was located near the reservoir inflow, while the most-depleted was obtained near the dam. Depletion or enrichment of entrapped sediments in 13C was, respectively, associated with highest and lowest observed concentrations of total phosphorus (TPS), as confirmed by a statistically significant inverse correlation (rs = −0.68). This dependent relationship may prove important in assessing a reservoir’s sources of phosphorus, and in forecasting deposition of loads in reservoir sediments.
Concentration of total P in water (TPW) was associated in a significant manner with content of suspended sediment (SS) (rs = 0.85), thus confirming the importance of internal production of matter in the circulation of this biogenic substance in the reservoir ecosystem. However, total P in the trapped sediments (TPS) correlated inversely with the suspended matter content (SS) (rs = −0.60), while it was higher in the direction of the station near the dam (M3), co-occurring with an increase in OM content.
Concentration of total phosphorus in bottom sediments (TPSB) was in turn the subject of a statistically significant correlation with the content of sediment suspended in water (rs = 0.75). The trend for differences in average TPSB values was thus the reverse of that applying with TPS.
The water in the Reservoir’s inflow area is most exposed to the phenomenon of potential supply of mineral forms of phosphorus, given that the largest phosphorus load (L-TPS) was deposited there, even though suspended matter there proved most P-deficient (lowest TPS). In turn, variability in the concentration of total Phosphorus in bottom sediments (TPSB) correlated closely with the load deposited on the reservoir bottom.

Patents

National patent application No. P.428513 of 08 January 2019 entitled “Bottom sediment sampler”.

Author Contributions

Conceptualisation, M.C.; data curation, M.C.; formal analysis, M.C.; methodology, M.C.; writing—original draft, M.C.; writing—review and editing, M.C., R.G.-R. and L.B.; funding acquisition, R.G.-R. All authors have read and agreed to the published version of the manuscript.

Funding

The research was financed by Poland’s National Science Centre, under Research Project No. 2017/25/B/ST10/00981.

Acknowledgments

Data reported in this paper can be accessed in the 4TU. ResearchData repository (The DOI of dataset: http://doi.org/10.4121/uuid:82cb9085-2e1b-4b9f-807c-dd2b14a162be).

Conflicts of Interest

The authors declare no conflict of interest. The funders had no role in the design of the study; in the collection, analyses or interpretation of data; in the writing of the manuscript, or in the decision to publish the results.

References

  1. Reisenbüchler, M.; Bui, M.D.; Skublics, D.; Rutschmann, P. Sediment Management at Run-of-River Reservoirs Using Numerical Modelling. Water 2020, 12, 249. [Google Scholar] [CrossRef] [Green Version]
  2. Madeyski, M.; Michalec, B.; Tarnawski, M. Siltation of small water reservoirs and the quality of bottom sediments. Infrastruct. Ecol. Rural Areas 2008, 11, 76. [Google Scholar]
  3. Schleiss, A.J.; Franca, M.J.; Juez, C.; De Cesare, G. Reservoir sedimentation. J. Hydraul. Res. 2016, 54, 595–614. [Google Scholar] [CrossRef]
  4. Huang, C.; Lai, J.; Lee, F.; Tan, Y. Physical Model-Based Investigation of Reservoir Sedimentation Processes. Water 2018, 10, 352. [Google Scholar] [CrossRef] [Green Version]
  5. Maris, F.; Vasileiou, A.; Tsiamantas, P.; Angelidis, P. Estimating the Future Function of the Nipsa Reservoir due to Climate Change and Debris Sediment Factors. Climate 2019, 7, 76. [Google Scholar] [CrossRef] [Green Version]
  6. Ezz-Aldeen, M.; Hassan, R.; Ali, A.; Al-Ansari, N.; Knutsson, S. Watershed Sediment and Its Effect on Storage Capacity: Case Study of Dokan Dam Reservoir. Water 2018, 10, 858. [Google Scholar] [CrossRef] [Green Version]
  7. Imanshoar, F.; Jahangirzadeh, A.; Basser, H.; Akib, S.; Kamali, B.; Tabatabaei, M.R.; Kakouei, M. Reservoir Sedimentation Based on Uncertainty Analysis. Hindawi Publ. Corp. 2014, 6. [Google Scholar] [CrossRef]
  8. Bąk, Ł.; Dąbkowski, S.; Górski, J. Method of predicting siltation of a water reservoirbased on measurements of its capacity. Water Environ. Rural Areas 2011, 4, 19–29. [Google Scholar]
  9. Bartoszek, L.; Koszelnik, P. The qualitative and quantitative analysis of the coupled C, N, P and Si retention in complex of water reservoirs. Springerplus 2016, 5, 1157. [Google Scholar] [CrossRef] [PubMed] [Green Version]
  10. Zemelka, G.; Szalińska, E. Suspended matter as water contaminant. Int. Multidiscip. Sci. GeoConference SGEM 2016, 1, 697–702. [Google Scholar]
  11. Bartoszek, L.; Gruca-Rokosz, R.; Koszelnik, P. Analysis of the Desludging Effectiveness of the Cierpisz and Kamionka Reservoirs as an Effective Method of the Eutrophic Ecosystems Recultivation. Annu. Set Environ. Prot. 2017, 19, 600–617. [Google Scholar]
  12. Ehrbar, D.; Schmocker, L.; Doering, M.; Cortesi, M.; Bourban, G.; Boes, R.M.; Vetsch, D.F. Continuous Seasonal and Large-Scale Periglacial Reservoir Sedimentation. Sustainability 2018, 10, 3265. [Google Scholar] [CrossRef] [Green Version]
  13. Bilici, C.; Stark, N. Performance of a novel sediment sampler as an add-on unit for portable free-fall penetrometers: Combining in situ geotechnical testing with sediment sampling. Limnol. Oceanogr. Methods 2019, 17, 163–176. [Google Scholar] [CrossRef]
  14. Juez, C.; Bühlmann, I.; Maechler, G.; Schleiss, A.J.; Franca, M.J. Transport of suspended sediments under the influence of bank macro-roughness. Earth Surf. Process. Landf. 2018, 43, 271–284. [Google Scholar] [CrossRef]
  15. Juez, C.; Thalmann, M.; Schleiss, A.J.; Franca, M.J. Morphological resilience to flow fluctuations of fine sediment deposits in bank lateral cavities. Adv. Water Resour. 2018, 115, 44–59. [Google Scholar] [CrossRef]
  16. Janse, J.H.; Scheffer, M.; Lijklema, L.; Liere, L.; Sloot, J.S.; Mooij, W.M. Estimating the critical phosphorus loading of shallow lakes with the ecosystem model PCLake: Sensitivity, calibration and uncertainty. Ecol. Model. 2010, 221, 654–665. [Google Scholar] [CrossRef]
  17. Jin, X.; Wang, S.; Bu, Q.; Wu, F. Laboratory Experiments on Phosphorous Release from the Sediments of 9 Lakes in the Middle and Lower Reaches of Yangtze River Region, China. Water Air Soil Pollut. 2006, 176, 233. [Google Scholar] [CrossRef]
  18. Kowalczewska-Madura, K.; Dondajewska, R.; Gołdyn, R.; Kozak, A.; Messyasz, B. Internal Phosphorus Loading from the Bottom Sediments of a Dimictic Lake During Its Sustainable Restoration. Water Air Soil Pollut. 2018, 229, 280. [Google Scholar] [CrossRef] [Green Version]
  19. Lee, B.J.; Kim, J.; Hur, J.; Choi, I.H.; Toorman, E.A.; Fettweis, M.; Choi, J.W. Seasonal Dynamics of Organic Matter Composition and Its Effects on Suspended Sediment Flocculation in River Water. Water Resour. Res. 2019, 55. [Google Scholar] [CrossRef]
  20. Ciecierska, H.; Kolada, A. ESMI: A macrophyte index for assessing the ecological status of lakes. Environ. Monit. Assess. 2014, 186, 5501–5517. [Google Scholar] [CrossRef] [Green Version]
  21. López-Tarazón, J.A.; López, P.; Lobera, G.; Batalla, R.J. Suspended sediment, carbon and nitrogen transport in a regulated Pyrenean river. Sci. Total Environ. 2016, 540, 133–143. [Google Scholar] [CrossRef] [PubMed]
  22. Wojtkowska, M.; Bogacki, J.; Witeska, A. Assessment of the hazard posed by metal forms in water and sediments. Sci. Total Environ. 2016, 551, 387–392. [Google Scholar] [CrossRef] [PubMed]
  23. Wagner, I.; Zalewski, M. Temporal changes in the abiotic/biotic drivers of selfpurification in a temperate river. Ecol. Eng. 2016, 94, 275–285. [Google Scholar] [CrossRef]
  24. Onstad, G.D.; Canfield, D.E.; Quay, P.D.; Hedges, J.I. Sources of particulate organic matter in rivers from the continental usa: Lignin phenol and stable carbon isotope compositions. Geochim. Cosmochim. Acta 2000, 64, 3539–3546. [Google Scholar] [CrossRef]
  25. Lammers, J.M.; Reichart, G.J.; Middelburg, J.J. Seasonal variability in phytoplankton stable carbon isotope ratios and bacterial carbon sources in a shallow Dutch lake. Limnol. Oceanogr. 2017, 62, 2773–2787. [Google Scholar] [CrossRef] [Green Version]
  26. Gamracy, M.; (Geodetic and Project Services Office, Rzeszów, Poland). Water management instructions for the water Reservoir in Wilcza Wola. 2011. [Google Scholar]
  27. Gruca-Rokosz, R. Diffusive Fluxes of CH4 and CO2 at the Sediment-Overlying Water Interface in Reservoir Ecosystems. J. Ecol. Eng. 2018, 19, 158–164. [Google Scholar] [CrossRef]
  28. Cieśla, M.; Bartoszek, L. Sediment Trap. National Patent Application No. P.426442, 25 July 2018. [Google Scholar]
  29. Cieśla, M.; Bartoszek, L.; Gruca-Rokosz, R. Characteristics and origin of suspended matter in a small reservoir in Poland. Ecohydrol. Hydrobiol. 2020, 20, 73–82. [Google Scholar] [CrossRef]
  30. Cieśla, M.; Gruca-Rokosz, R. Bottom Sediment Sampler. National Patent Application No. P.428513, 8 January 2019. [Google Scholar]
  31. Zhu, M.; Zhu, G.; Nurminen, L.; Wu, T.; Deng, J.; Zhang, Y.; Qin, B.; Ventelä, A.M. The Influence of Macrophytes on Sediment Resuspension and the Effect of Associated Nutrients in a Shallow and Large Lake (Lake Taihu, China). PLoS ONE 2015, 10. [Google Scholar] [CrossRef] [Green Version]
  32. Thornton, S.F.; McManus, J. Application of organic carbon and nitrogen stable isotope ratios as source indicators of organic matter provenance in estuaries system. Evidence from the Tayestuary, Scotland. Estuar. Coast. Shelf Sci. 1994, 38, 219–233. [Google Scholar] [CrossRef]
  33. Murase, J.; Sakamoto, M. Horizontal distribution of the carbon and nitrogen and their isotopic composition in the surface sediment of Lake Biwa. Limnology 2000, 1, 177–184. [Google Scholar]
  34. Koszelnik, P.; Gruca-Rokosz, R.; Bartoszek, L. An isotopic model for the origin of autochthonous organic matter contained in the bottom sediments of a reservoir. Int. J. Sediment Res. 2018, 33, 285–293. [Google Scholar] [CrossRef]
  35. Kajak, Z. Hydrobiology-Limnology. In Inland Water Ecosystems, 1st ed.; Polish Scientific Publishing House: Warsaw, Poland, 1998; ISBN 83-01-12537-3. [Google Scholar]
  36. Miąsik, M.; Koszelnik, P.; Bartoszek, L. Trophic water assessment of the small retention reservoirs Blizne and Cierpisz in the Podkarpacie Region (Subcarpathian Province). Limnol. Rev. 2014, 14, 181–186. [Google Scholar] [CrossRef] [Green Version]
  37. Juez, C.; Hassan, M.A.; Franca, M.J. The origin of fine sediment determines the observations of suspended sediment fluxes under unsteady flow conditions. Water Resour. Res. 2018, 54, 1–16. [Google Scholar] [CrossRef]
  38. Terasmaa, J.; Punning, J.M. Sedimentation dynamics in a small dimictic lake in northern Estonia. Proc. Est. Acad. Sci. Biol. Ecol. 2006, 55, 228–242. [Google Scholar]
  39. Guidi, L.; Gorsky, G.; Claustre, H.; Miquel, J.C.; Picheral, M.; Stemmann, L. Distribution and fluxes of aggregates>100μm in the upperkilometer of the South-Eastern Pacific. Biogeosciences 2008, 5, 1361–1372. [Google Scholar] [CrossRef] [Green Version]
  40. Moreno, Y.M.; Ramirez, J.J. Seston fluxes in the dam of a Colombian tropical reservoir. Acta Limnol. Bras. 2010, 22, 325–334. [Google Scholar] [CrossRef]
  41. Cieśla, M.; Bartoszek, L.; Gruca-Rokosz, R. Effectiveness Assessment of a New System of Sediment Trap in the Investigation of Matter Sedimentation in a Reservoir—A Case Study. Hydrology 2019, 6, 48. [Google Scholar] [CrossRef] [Green Version]
  42. Pietrzyk, A.; Papciak, D. Materia organiczna w wodach naturalnych—Formy występowania i metody oznaczania [Organic matter in natural waters—Forms of occurrence and determination methods]. J. Civ. Eng. Environ. Archit. 2016, 63, 241–252. [Google Scholar]
  43. Koszelnik, P. Isotopic effects of suspended organic matter fluxes in the Solina reservoir (SE Poland). Environ. Prot. Eng. 2009, 35, 13–19. [Google Scholar]
  44. Zordan, J.; Juez, C.; Schleiss, A.J.; Franca, M.J. Entrainment, transport and deposition of sediment by saline gravity currents. Adv. Water Resour. 2018, 115, 17–32. [Google Scholar] [CrossRef]
  45. Wojtkowska, M.; Domachowski, D. Seasonal character of changes in nitrogen forms in waters of Korytów and Łąki Korytowskie retention reservoirs. Environ. Prot. Eng. 2009, 35, 54–66. [Google Scholar]
  46. Hullebusch, E.; Auvray, F.; Deluchat, V.; Chazal, P.; Baudu, M. Phosphorus fractionation and short-term mobility in the surface sediment of a polymictic shallow lake treated with a low dose of alum (Courtille Lake, France). Water Air Soil Pollut. 2003, 146, 75–91. [Google Scholar] [CrossRef]
  47. Seitzinger, S.P.; Mayorga, E.; Bouwman, A.F.; Kroeze, C.; Beusen, A.H.; Billen, G.; Harrison, J.A. Global river nutrient export: A scenario analysis of past and future trends. Glob. Biogeochem. Cycles 2010, 24. [Google Scholar] [CrossRef] [Green Version]
  48. Deemer, B.R.; Harrison, J.A.; Li, S.; Beaulieu, J.J.; DelSontro, T.; Barros, N.; Vonk, J.A. Greenhouse Gas Emissions from Reservoir Water Surfaces: A New Global Synthesis. BioScience 2016, 66, 949–964. [Google Scholar] [CrossRef]
  49. Brils, J. Sediment monitoring and the European Water Framework Directive. Ann. Dell Ist. Super. Sanita 2008, 44, 218–223. [Google Scholar]
  50. Wagner, A. Event-Based Measurement and Mean Annual Flux Assessment of Suspended Sediment in Meso Scale Catchments. Ph.D. Thesis, Institut für Wasser und Gewässerentwicklung (IWG), Karlsruhe, Germany, 2019. [Google Scholar] [CrossRef]
  51. Vercruysse, K.; Grabowski, R.C.; Rickson, R.J. Suspended sediment transport dynamics in rivers: Multi-scale drivers of temporal variation. Earth Sci. Rev. 2017, 166, 38–52. [Google Scholar] [CrossRef] [Green Version]
  52. Beniston, M. Climatic change in mountain regions: A review of possible impacts. Clim. Chang. 2003, 59, 5–31. [Google Scholar] [CrossRef]
  53. Plumb, B.D.; Juez, C.; Annable, W.K.; McKie, C.W.; Franca, M.J. The impact of hydrograph variability and frequency on sediment transport dynamics in a gravel-bed flume. Earth Surf. Process. Landf. 2019. [Google Scholar] [CrossRef]
Figure 1. Location of study stations and characteristic parameters of the Maziarnia Reservoir.
Resources 09 00030 g001
Figure 2. Monitoring scheme.
Resources 09 00030 g002
Figure 3. Variability of average values for selected physico-chemical parameters of water, 2018.
Resources 09 00030 g003
Figure 4. (a) The variability trend associated with the average content of suspended sediment in water (SS) and average sedimentation rate (Us), (b) the quantile correlation between SS and Us.
Resources 09 00030 g004
Figure 5. The trend for variability of sedimentation rate (Us) and mean discharge of water from the Reservoir (Q).
Resources 09 00030 g005
Figure 6. Quantile correlations: (a) between OMSS and SS, (b) between OMSS and OMSS, (c) between OMSB and OMS and (d) between OMSS and OMSS.
Resources 09 00030 g006
Figure 7. The spatial and vertical distribution of mean organic matter content and the contribution made to quantities of trapped sediment by autochthonous matter.
Resources 09 00030 g007
Figure 8. (a) Variability of total organic carbon isotopic composition (δ13C-TOC) for sediments in traps. (b) Quantile correlation between total phosphorus in trapped sediments (TPS) and δ13C-TOC values.
Resources 09 00030 g008
Figure 9. Distribution of TPS and TPSB concentrations in sediments, and L-TPS loads.
Resources 09 00030 g009

