Abstract
Agricultural practices that make use of variable-rate (VR) distribution, introduced by precision agriculture (PA), are based on many points of variability which obtain different and modular effects that can affect the efficacy and environmental impact of the treatment performed. The aim of the present research was to study the effect of different structural combinations of an agricultural sprayer on the required power, fuel consumption, and carbon emissions. The studied machine was equipped with a mechanical device that regulated the air outlet section in three openings. The fan was tested in five blade angles and in two gear ratios. The power requirement (kW) was calculated using a torque-meter. Moreover, fuel consumption (L h−1), energy demand (MJ L−1), and carbon emissions (kg CO2eq kg−1) were calculated by the power consumption of each test. The results showed that all components of the layout and their interaction influenced consumption and, consequently, emissions. In order to mitigate the environmental impact of treatments, the outcomes suggest the possibility of implementing this study into algorithms that make setup choices during distribution.
1. Introduction
The UNEP (United Nations Environment Programme) Emissions Gap Report 2019 [1] estimated that from 2020, the required cuts in global emissions needed to fight the increasing temperature are 2.7% per year for a 2 °C reduction goal and 7.6% per year on average for a 1.5 °C reduction goal. For the European Union (EU), the 1.5 °C goal would cause a 68% reduction in greenhouse gas (GHG) emissions by 2030 and exceed the current emission reduction objective by at least 40%. Therefore, the European Commission is committed to reducing emissions by 50–55% by 2030 and to make Europe the first climate-neutral continent by 2050.
The agricultural sector represented a significant rate of EU emissions in 2015, with ~460 MtCO2eq or 12% of total GHG emissions, when including CO2 emissions from energy consumption in this sector. GHG emissions from the agricultural sector declined by 20% between 1990 and 2015 but there may still be room for improvement [2,3].
Energy consumption is a key question and source of impact in agricultural systems [4,5]. Demand for biofuels is also expected to rise and agriculture will be increasingly compromised by the combined effects of climate change and soil degradation [2]. In this context, more sustainable farming practices could represent a challenge to reduce emissions, costs, and pressure on biodiversity, as well as the pollution of air, water, and soil [6].
The European scenarios clearly highlight the trade-off between changing the demand for agricultural products and growing agricultural efficiency by increasing yields when possible without harming biodiversity and improving energy efficiency. Such technical measures are in line with the new European Commission “From Farm to Fork” strategy [7], which has, among others, the year 2030 targeted for ensuring sustainable food production by reducing the use and risk of chemical pesticides (50% by 2030) and fertilizer (at least 20% at 2030), as well as to enhance integrated pest management [8].
According to the 17 sustainable development goals (SDG) of the 2030 Agenda for Sustainable Development adopted by all United Nations Member States in 2015, sustainability is also sought in relation to agriculture (SDG 2). Pesticide application to crops and soils represents a constant source of pollutants in the atmosphere, soil, and water. In order to enhance the sustainability of crop protection treatments, precision agriculture (PA) practices continue to positively grow in importance, thus contributing to GHG emission mitigation, farm productivity, and economics.
The application of PA practices in agricultural field operations could positively contribute to GHG emission reduction due to a reduction in fuel consumption through less in-field operations with self-propelled machines (direct GHG decrease) and a reduction of inputs for agricultural operations (indirect GHG decrease) [9].
In order to reduce power consumption and drift losses during plant protection treatments in orchards, machines capable of operating air-assisted sprayers must be equipped with appropriate designs and fan settings, as well as with an air discharge system based on variable rate technology (VRT) [10,11,12,13,14,15]. Variable rate application of pesticides, supported by real-time canopy valuation, in tree fruit orchards and vineyards, has also been widely investigated [16,17,18]. Air-blast sprayers air volume settings have a significant role for correct spray deposition in the tree canopy during crop protection treatments, avoiding the spray drift [19,20,21,22].
Commonly, that operating manuals that are provided with sprayers do not offer information on the characteristics of generated air flow [23]. By contrast, the fan setting directly affects treatment quality. If air velocities or volumes produced by fans are too low, inadequate pesticides will reach the tree canopy; but, if these parameters are too high, the pesticide will be lost through the canopy.
Manufacturers and researchers have aimed to introduce the VRT solutions to empower the remote control of air parameters in real time during orchard treatments. Most sprayers only allow manual and discontinuous adjustments of fan-produced air volume. Thus, the disconnection of the tractor power take-off (PTO) to adjust a fan’s transmission impeller blade angle or gear change of gear has been requested [13].
Some sprayers are based on reducing the air outlet (or inlet) of the sprayer’s fan, but this solution is not energy efficient, because confining airflow increases power consumption. An innovative VRT air-jet adjustment and energy saving system was proposed by Doruchowski et al. [24] and Holownicki et al. [13] by means of a continuous real-time adjustment of air volume system mounted on both sides of the sprayer. The system used variable speed impellers with fixed blades, and it showed greater suitability than a method with adjustable pitch blades working at a constant speed. This was because it provided a wider range of air volumes and the power consumption did not exceed 10 kW.
The main criteria for the suitability of VRT air-jet systems arises not only from remote air-flow control during orchard treatments but also from its adjustment range, which is suitable to lesser consumption [13].
From a PA perspective, the aim of the present paper was to evaluate energy consumption and emissions for different axial fan layouts commonly used in orchards via laboratory tests in repeatable conditions. The final objective was to find the best fan layout settings in order to reduce power consumption and harmful emissions. It is notable to highlight that a zero-carbon economy is more resilient due to a lower dependency on energy, raw material imports, and the volatility of fossil fuel prices, in addition to the improvement in public health, reduced energy bills, and the preservation of biodiversity.
Moreover, the results of this study could drive the operational choices of farmers during crop protection treatments even if the treatment efficacy, in terms of deposit on the canopy, will be evaluated in further studies. The present study, in fact, is part of a larger research project that concerns the evaluation of axial fan sprayer efficiency from a PA perspective.
2. Materials and Methods
2.1. The Laboratory for Measurements
The experimental research was carried out in June and July 2019 at the inspection center for sprayers and sprayer machine manufacturers “Officina Antonino Turrisi”, located in the Catania province in eastern Sicily (Italy).
The tests were carried out with an axial helical fan (700 mm diameter), with 8 polyethylene blades (130 mm long), usually mounted on conventional sprayer machines (hydraulic pulverization) that were used in vineyards and orchards (Figure 1a). The blades had an adjustable pitch that assumed five different angles: 20, 26, 33, 40, and 44 degrees, as reported in Failla et al. [25].
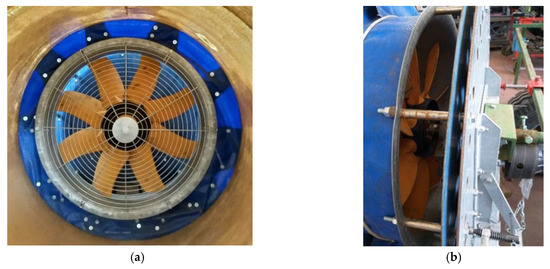
Figure 1.
(a) The axial helical fan used in our study; (b) The metal panel behind the fan.
The nominal air output was 38,000 m3 h−1 with a nominal tractor power of 29 kW. The fan was powered by a tractor PTO at 56 rad s−1 via a gearbox with two transmission ratios (τ1 = 3.8 and τ2 = 4.53). For the first multiplicator gear, the rotational speed of the fan was about 216 rad s−1, while it was 256 rad s−1 for the second multiplicator gear. The tractor used during the tests was a 4WD narrow tractor model 3050DT (Goldoni, Modena, Italy) with 35 kW nominal power.
The outlet section of the air volume was adjusted using a purpose designed metal panel from 40 to 110 mm positioned behind the fan (Figure 1b). A torque-meter (HBM mod. T30FN, Darmstadt, Germany) with 3 kNm nominal torque and 50 Hz (3000 rpm) nominal rotational speed was used to measure torque and rotational speed for the tractor PTO (Figure 2a). This was done to calculate the energy requirements during fan operation at different layouts [26]. The record array of the torque-meter was based on a multi-channel, in-vehicle data acquisition system DAS2-A8D (Datron Technology, Milton Keynes, UK) connected to a laptop personal computer (Figure 2b) [27].
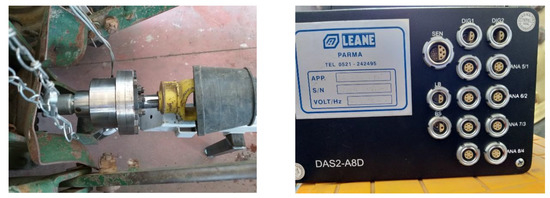
Figure 2.
(a) The torque-meter connected to the power take-off (PTO); (b) The acquisition system of the torque-meter.
2.2. Experimental Tests
The tests were carried out with the blade pitch angle set most used by farmers (40 degrees) compared with other possible blade pitch angles (20, 26, 33, and 44 degrees); two fan gear ratios (τ1 = 3.8 and τ2 = 4.53) were used. The width of fan outlet section was adjusted based on the maximum opening (110 mm), the average (60 mm) and the minimum (40 mm), allowed by the specially designed system (Figure 1b). Thirty tests were performed by combining these layouts, as shown in Table 1. Each test lasted about 12 min on average.

Table 1.
Layout of the 30 tests.
2.3. Data Analysis
The used torque-meter continuously monitored the signals from the tractor PTO and converted the analogue torque (Nm) and speed signal (rad s−1) to digital values displayed on the computer monitor. The displayed values were stored in files on an SD card, which was then extracted in the processing phase. After the experimental test, the data were processed for the evaluation of any off-scale values and any acquisition defects.
The power (kW) required during the compared tests were obtained from the torque and angular speed values recorded throughout the trials.
In order to calculate the tractor fuel consumption, the following equation, proposed by Grisso et al. [28], was used:
where Q = diesel fuel consumption at a partial load (L h−1); X = the ratio of equivalent PTO power (measured) to rated PTO power (90% of nominal tractor power); Nred = the percentage of reduced engine speed for a partial load from full throttle (20%); Ppto = the rated PTO power (kW).
Q = (0.22 X + 0.096) (1 − (−0.0045 X Nred + 0.00877 Nred)) × Ppto
For this purpose, the rated PTO power of the tractor was considered equivalent to the 90% of its engine nominal power [29].
The fuel consumption of each test was considered to obtain the value of the CO2eq emissions by multiplying 3.728 kg for every kg of diesel consumed; this value included emissions derived from combustion and extraction, as well as refining processes (Ecoinvent database ver. 3.5) [30].
Moreover, in order to identify the optimal configuration of the fan with regard to energy saving, energy consumptions were calculated from liters of diesel consumed, assuming that each liter of diesel corresponds to 56.31 MJ of energy [4,31].
All data were statistically analyzed with the open source software R [32]. The ANOVA was performed to test the main effect of the different fan configurations. The statistically significant difference between tests was estimated using the “laercio” package of R to develop a Tukey test with probability levels of p ≤ 0.05 and p ≤ 0.01.
3. Results
The results of the analysis of variance show that the effects of the gear ratio, the blade angle and the outlet section on the power and fuel consumption, energy use and emissions were statistically significant at p = 0.001 (Table 2). The interactions between the variables are also statistically significant at p = 0.001.
Table 2.
Power and fuel consumption, energy use, and emissions in the 30 tests.
The variables shown in Table 2 (i.e., power and fuel consumption; energy use and emissions) were statistically influenced by both the gear ratio and the blade angle, as expected, but also, to a lesser extent, by the outlet section. Often, there were no statistically significant differences between the different outlet sections at the same blade angles. When there were differences, they were small.
The relationship between the power consumption and interaction blade angles × outlet section was evident (Table 2). The greatest power consumption derived from the 40 mm outlet section (smaller) at 20°, from the 60 mm outlet section (intermediate) at 26°, from the 110 mm outlet section (larger) at 33°, from the 60 mm outlet section at 40°, and from the 110 outlet section at 44°. This occurred within both gear ratios.
At the first multiplicator gear, the minimum value 0.77 kW was recorded at 20°, the maximum value 10.25 kW was recorded at 44°, and both were recorded at the 110 mm outlet section. At the second multiplicator gear, the minimum value 1.94 kW was recorded at 20° and at the 110 mm outlet section while the maximum value was recorded at 44° at 60 mm (13.43 kW) and the 110 mm (12.70 kW).
As shown in Table 2, fuel consumption increased when blade angles increase in both transmission ratios. At τ1, fuel consumption remained around 3 L h−1 at 20° and 26° to reach about 4–5 L h−1 with the other blade angles. At τ2, fuel consumption was about 4 L h−1 at 20° and 26° blade angles to go beyond 5 L h−1 with other inclinations. This meant an increase in fuel consumption of about 65%, which passed from 20° to 44° at τ1 and more than 45% at τ2.
Similarly, energy demand and emissions followed the same trend (Table 2). At τ1, energy demand and emissions remained around 180–190 MJ L−1 and 10–11 kgCO2eq kg−1, respectively, with the 20° and 26° blade angles growing to 260–290 MJ L−1 and 14–16 kgCO2eq kg−1. At τ2, the same parameters had higher values, going from about 200 MJ L−1 and 11–12 kgCO2eq kg−1 to over 300 MJ L−1 and 16–18 kgCO2eq kg−1 with the other blade angles.
On average, when passing from 20° to 44° blade angles with τ1, there was a 65% increase in energy demand and emissions. There was a 69% increase in energy demand and emissions about, passing from 20° to 44° with τ2.
The effects of the gear ratio on power and fuel consumption, energy use, and emissions were statistically significant at p = 0.001, as shown in Figure 3.
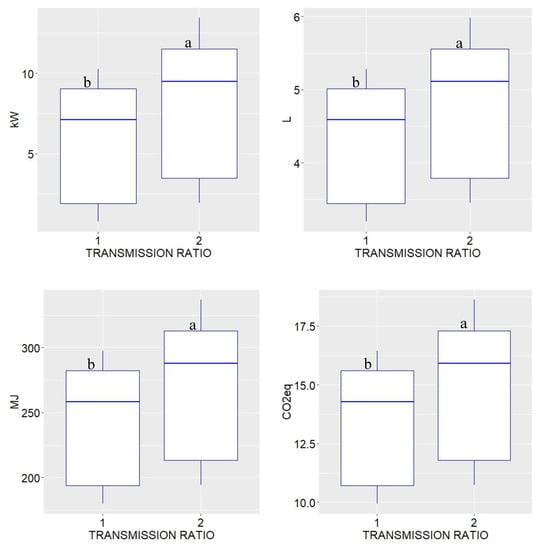
Figure 3.
Power required, fuel consumption, energy use, and emissions at the two transmission ratios. Letters (a,b) show between transmission ratio significant difference at p = 0.001 as determined by the Tukey test.
On average, statistically lower average values equal to 5.76 kW, 4.29 L h−1, 241.20 MJ L−1, and 13.36 kg CO2eq kg−1 were recorded using τ1 in comparison to 8.06 kW, 4.80 L h−1, 269.62 MJ L−1, and 14.93 kg CO2eq kg−1 recorded using τ2. In general, this meant that the use of the first multiplicator gear allowed us to save about 0.51 L h−1 of diesel fuel, 28.4 MJ L−1, and about 1.57 kg CO2eq kg−1 compared to the use of the second multiplicator gear (Figure 3).
The effects of the different blade angles on power and fuel consumption, energy use, and emissions were statistically significant at p = 0.001, as shown in Figure 4.
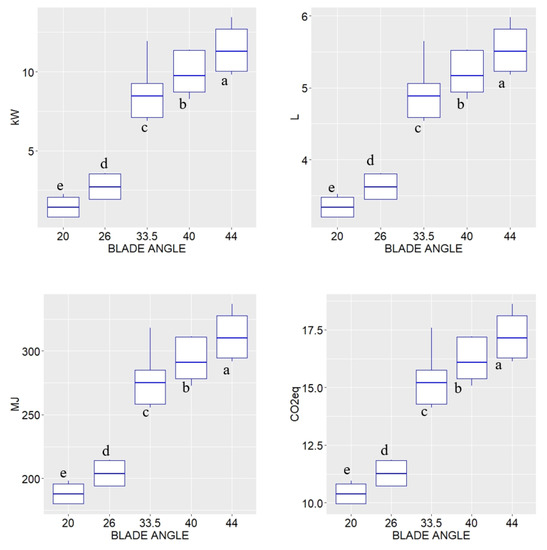
Figure 4.
Power required, fuel consumption, energy use, and carbon emissions at different blade angles. Letters (a–c) show between blade angles significant difference at p = 0.001 as determined by the Tukey test.
On average, the transition from the smaller angles of 20°and 26° to those bigger at 33°, 40°, and 44° statistically increased the power consumption, passing from 1.46 kW at 20° to 11.42 kW at 44°. Further, intermediate power consumption passed from 2.73 kW at 26° to 8.68 kW at 33° and to 9.96 kW at 40° (Figure 4).
Similarly, this transition was statistically significant and increased fuel consumption, passing from 3.34 L h−1 at 20° to 5.54 L h−1 at 44° and intermediate fuel consumption of 3.62 L h−1 at 26°, 4.93 L h−1 at 33°, and 5.21 L h−1 at 40°. In terms of energy demand and emissions, 187.83 MJ L−1 and 10.41 kg CO2eq kg−1 was resulted at 20°; 203.66 MJ L−1 and 11.28 kg CO2eq kg−1 at 26°; 277.50 MJ L−1 and 15.36 kg CO2eq kg−1 at 33°; 293.00 MJ L−1 and 16.23 kg CO2eq kg−1 at 40°; and 311.17 MJ L−1 and 17.24 kg CO2eq kg−1 at 44° (Figure 4).
On average, passing from 26° to 33°, there was an increase of more than 200% in terms of power consumption and about 37% in terms of fuel expenditure, energy demand, and emissions. It is important to highlight that the 40° blade angle was most used by farmers during orchard treatments, and it appeared to be among the most energy-intensive and emission-intensive layout.
The fan’s power consumption at the different blade angles was similar to the fan tested by Holownicki et al. [13]. They found a power consumption of 3.7 kW at 20°, 6.2 kW at 32°, and 12.6 kW at 45° with a fan of 600 mm diameter. This lower power consumption was attributed to the deflector of the prototype fan which had no internal plates and vanes, as it did in our study.
The different outlet section of the air volume produced statistically different power consumption, according to the Tukey test, returning an average value of 6.63 kW in the case of the smaller outlet section (40 mm), 6.86 kW with the medium one (60 mm), and 7.31 kW with the largest one (110 mm). Between the smaller section and the larger one, there was a difference of 0.68 kW; the smaller section led to about 10% less power consumption than the larger outlet section and about 3% less than the intermediate one (Figure 5).
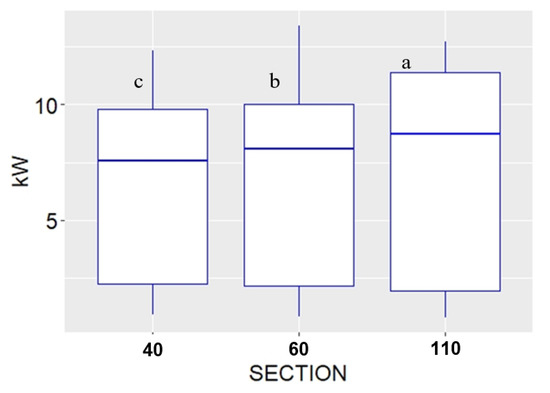
Figure 5.
Power required at the three outlet sections (mm). Letters (a–c) show between outlet sections significant difference at p = 0.001 as determined by the Tukey test.
Even in the case of fuel consumption (4.48, 4.53 and 4.63 L h−1), energy demand (251.90–254.80–260.45 MJ L−1), and emissions (13.96–14.11–14.42 kg CO2eq kg−1), there were only slight differences between the average data, even if they were statistically significant. Therefore, in the test conditions, the layout relating to the outlet section did not have a crucial influence on power and fuel consumption, nor did it have one on energy use or harmful emissions.
Figure 6 summarizes the trend of power consumption by varying the gear ratios, the blade angles, and the outlet section. As already discussed, all other parameters analyzed above derived from this power consumption trend.
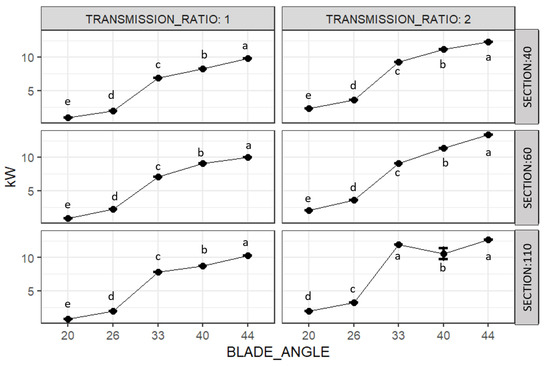
Figure 6.
Power required at all layouts. Letters (a–e) show between blade angles significant difference at p = 0.001 as determined by the Tukey test.
As shown in Figure 6, the general trend was characterized by the increase in power consumption as the blade angles increased. This was particularly evident in the transition between 26° and 33°, especially in the 110 mm outlet section and with τ2. It was also evident that, with the same blade angles, the average values were always higher with the use of the second multiplicator gear, which was used most by farmers for plant protection treatments.
From an environmental impact point of view, focusing on emissions (kgCO2 eq kg−1) at different blade angles and gear ratios (Figure 7) proves that emissions increase in a linear positive mode when blade angles increase. This consideration was even more pronounced with the τ2, where the straight line of the values increased its inclination with increasing blade angles.
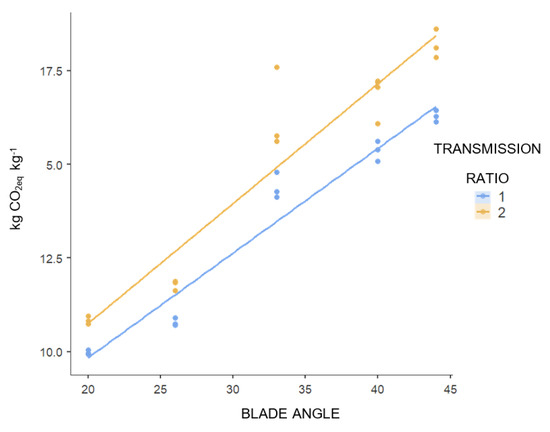
Figure 7.
Emissions (kgCO2eq kg−1) at different blade angles and gear ratios.
Lal [33] reported that the equivalent carbon emission (kg CE ha−1) in a field spraying operations was on average about 1.4 kg CE ha−1, indicating about 51.4 kgCO2eq ha−1 for the cultivation operation as a whole.
In our study, considering an average working capacity of 5 ha (hectares) per hour in the vineyard, the emissions amounted to about 20.45 kgCO2eq ha−1 for τ2 and 13.12 kgCO2eq ha−1 for τ1. These emissions were related only to the consumption of diesel fuel needed to use the fan with the first or with the second gear ratio. To these emissions, the consumptions and relative emissions linked to the advancement of the tractor-operator complex, as well as to the functioning of other components in the spraying machine.
In summary, the energy demand and related emissions grew when the inclination angle increased. If we consider the maximum output section (110 mm), the percentage of absorbed power with respect to the nominal one was equal to 2% for τ1 and 5% for τ2 at 20°; 6% for τ1 and 9% for τ2 at 26°; 22% for τ1 and 34% for τ2 at 33°; 25% for τ1 and 30% for τ2 at 40°; and to 29% for τ1 and to 36% for τ2 at 44°. With the greater inclination, the power required for functionality became excessive, especially with τ2.
In the future, these data will be discussed in comparison with the air flow rate for the same sprayer axial fan layout in order to identify the optimal angle that guarantees efficient power consumption and air volume for suitable plant protection treatments.
4. Conclusions
The aim of the present paper was to evaluate the energy consumption and emissions of different axial fan sprayer layouts that are common in orchards. We evaluated these layouts via laboratory tests. The tests made it possible to highlight concerns we had with the fan (i.e., diameter 700 mm and standard blade profile), as well as the relationships between the three parameters relating to the fan layout (e.g., blade angle, outlet section) and use (gear ratio) of power, energy, and CO2 emissions.
The results showed that all components of the fan’s layout and their interaction influenced consumption and, consequently, energy use and carbon emissions.
In general, lower power consumption was achieved with lesser blade angles (20° and 26°) when both gear ratios and consumption levels increased, especially when they passed from 26° to 33°. There was also a certain relationship between the inclination angle and the outlet section. Some combinations were more energy-intensive than others with the same inclination, even if the outlet section did not seem to determine notable differences at the same blade angles.
It is important to point out that, on average, when passing from 20° to 44° degrees at τ1, there was a 65% increase in energy demand and emissions, as well as a 69% increase in the energy demand and emissions at τ2. In common practice, the second gear ratio was used most in air-assisted sprayers with inclinations at 33° and 40°, probably because a greater volume of air was obtained without a real need linked to the canopy dimension. An excessive air volume led to higher operating costs without any benefit to distribution quality and by increasing drift issues.
Further studies should focus on air-flow profile measurements, which could be carried out in vineyards at different growing stages. The aim should be to find solutions that can combine reduced fossil energy use and variable air volumes in relation to the tree canopy.
From a PA perspective, this study could be implemented into algorithms that make setup choices during field treatments to reduce their environmental impact.
Author Contributions
Conceptualization, S.F., E.R., and G.S.; data curation, S.F. and E.R.; investigation, S.F., E.R., D.L., and G.S.; methodology, S.F., C.B., and E.R.; project administration, S.F.; supervision, C.B. and G.S.; writing—original draft, S.F., E.R., and C.B.; writing—review and editing, S.F. and E.R. All authors have read and agreed to the published version of the manuscript.
Funding
This research was funded by University of Catania (Italy).
Acknowledgments
The authors wish to acknowledge the “Officina Antonino Turrisi” in the Catania province (Sicily, Italy) for hosting the experimental tests. The activity presented in the paper was part of the research project titled “Innovazioni attraverso applicazioni ICT nel settore delle costruzioni rurali, della pianificazione del territorio agro-forestale e della meccanizzazione della difesa fitosanitaria. WP1—Sviluppo di tecniche e di applicazioni anche informatiche per l’innovazione nel settore della meccanizzazione della difesa fitosanitaria.” Piano della Ricerca 2016-2018 of the University of Catania (Italy).
Conflicts of Interest
The authors declare no conflict of interest.
References
- UNEP—United Nations Environment Programme. The Emissions Gap Report 2019. Available online: https://www.unenvironment.org/resources/emissions-gap-report-2019 (accessed on 14 September 2020).
- CLIMACT. Increasing the EU’s 2030 Emissions Reduction Target—June 2020. Available online: https://climact.com/wp-content/uploads/2020/06/Climact_Target_Emissions_report_FINAL.pdf (accessed on 14 September 2020).
- EEA—European Environment Agency. 2017. Available online: https://ec.europa.eu/eurostat/statistics-explained/pdfscache/16817.pdf (accessed on 29 September 2020).
- Failla, S.; Ingrao, C.; Arcidiacono, C. Energy consumption of rainfed durum wheat cultivation in a Mediterranean area using three different soil management systems. Energy 2020, 195, 116960. [Google Scholar] [CrossRef]
- Restuccia, A.; Failla, S.; Longo, D.; Caruso, L.; Mallia, I.; Schillaci, G. Assessment of energy return on energy investment (EROEI) of oil bearing crops for renewable fuel production. J. Agric. Eng. 2013, 44, 539–545. [Google Scholar] [CrossRef]
- Recchia, L.; Sarri, D.; Rimediotti, M.; Boncinelli, P.; Cini, E.; Vieri, M. Towards the environmental sustainability assessment for the viticulture. J. Agric. Eng. 2018, 49, 19–28. [Google Scholar] [CrossRef]
- European Commission. A Farm to Fork Strategy—For a fair, healthy and environmentally-friendly food system, Communication from the Commission to the European Parliament, the Council, the European Economic and Social, Committee and the Committee of the Regions, May 2020. Available online: https://ec.europa.eu/food/farm2fork_en (accessed on 29 September 2020).
- Papa, R.; Manetto, G.; Cerruto, E.; Failla, S. Mechanical distribution of beneficial arthropods in greenhouse and open field: A review. J. Agric. Eng. 2018, 49, 81–91. [Google Scholar] [CrossRef]
- Balafoutis, A.T.; Beck, B.; Fountas, S.; Vangeyte, J.; Van Der Wal, T.; Soto, I.; Gómez-Barbero, M.; Barnes, A.P.; Eory, V. Precision Agriculture Technologies Positively Contributing to GHG Emissions Mitigation, Farm Productivity and Economics. Sustainability 2017, 9, 1339. [Google Scholar] [CrossRef]
- Chen, Y.; Ozkan, H.E.; Zhu, H.; Derksen, R.C.; Krause, C.R. Spray deposition inside tree canopies from a newly developed variable-rate air-assisted sprayer. Trans. ASABE 2013, 56, 1263–1272. [Google Scholar]
- DeKeyser, D.; Duga, A.T.; Verboven, P.; Endalew, A.M.; Hendrickx, N.; Nuyttens, D. Assessment of orchard sprayers using laboratory experiments and computational fluid dynamics modelling. Biosyst. Eng. 2013, 114, 157–169. [Google Scholar] [CrossRef]
- Delele, M.; Jaeken, P.; Debaer, C.; Baetens, K.; Endalew, A.M.; Ramon, H.; Nicolaï, B.; Verboven, P. CFD prototyping of an air-assisted orchard sprayer aimed at drift reduction. Comput. Electron. Agric. 2007, 55, 16–27. [Google Scholar] [CrossRef]
- Hołownicki, R.; Doruchowski, G.; Świechowski, W.; Godyń, A.; Konopacki, P.J. Variable air assistance system for orchard sprayers; concept, design and preliminary testing. Biosyst. Eng. 2017, 163, 134–149. [Google Scholar] [CrossRef]
- Khot, R.; Ehsani, R.; Albrigo, G.; Landers, A.J.; Larbi, P.A. Spray pattern investigation of an axial-fan airblast precision sprayer using a modified vertical patternator. Appl. Eng. Agric. 2012, 28, 647–654. [Google Scholar] [CrossRef]
- Salcedo, R.; Garcera, C.; Granell, R.; Molto, E.; Chueca, P. Description of the airflow produced by an air-assisted sprayer during pesticide applications to citrus. Span. J. Agric. Res. 2015, 13, e0208. [Google Scholar] [CrossRef]
- Chen, Y.; Han, J.; Zhao, X. Three-dimensional path planning for unmanned aerial vehicle based on linear programming. Robotica 2011, 30, 773–781. [Google Scholar] [CrossRef]
- Gil, E.; Landers, A.; Gallart, M.; Llorens, J. Development of two portable patternators to improve drift control and operator training in the operation of vineyard sprayers. Span. J. Agric. Res. 2013, 11, 615. [Google Scholar] [CrossRef]
- Gil, E.; Arnó, J.; Llorens, J.; Sanz, R.; Llop, J.; Rosell-Polo, J.R.; Gallart, M.; Escolà, A. Advanced Technologies for the Improvement of Spray Application Techniques in Spanish Viticulture: An Overview. Sensors 2014, 14, 691–708. [Google Scholar] [CrossRef]
- Grella, M.; Marucco, P.; Balsari, P. Toward a new method to classify the airblast sprayers according to their potential drift reduction: Comparison of direct and new indirect measurement methods. Pest Manag. Sci. 2019, 75, 2219–2235. [Google Scholar] [CrossRef]
- Moltó, E.; Chueca, P.; Garcerá, C.; Balsari, P.; Gil, E.; Van De Zande, J.C. Engineering approaches for reducing spray drift. Biosyst. Eng. 2017, 154, 1–2. [Google Scholar] [CrossRef]
- Qiu, W.; Sun, C.; Lv, X.; Ding, W.; Feng, X. Effect of Air-assisted Spray Application Rate on Spray Droplet Deposition Distribution on Fruit Tree Canopies. Appl. Eng. Agric. 2016, 32, 739–749. [Google Scholar] [CrossRef]
- van de Zande, J.C.; Michielsen, J.M.G.P.; Stallinga, H.; van Dalfsen, P.; Wenneker, M. Effect on air deposition and spray liquid distribution of a cross flow fan orchard sprayer on spray deposition in fruit trees. In Proceedings of the 7th European Workshop on Standardized Procedure for the Inspection of Sprayers in Europe, Athens, Greece, 24–26 September 2018. [Google Scholar]
- García-Ramos, F.J.; Malón, H.; Aguirre, Á.J.; Boné, A.; Puyuelo, J.; Vidal, M. Validation of a CFD Model by Using 3D Sonic Anemometers to Analyse the Air Velocity Generated by an Air-Assisted Sprayer Equipped with Two Axial Fans. Sensors 2015, 15, 2399–2418. [Google Scholar] [CrossRef]
- Doruchowski, G.; Swiechowski, W.; Godyn, A.; Hołownicki, R. Automatically controlled sprayer to implement spray drift reducing application strategies in orchards. J. Fruit Ornam. Plant Res. 2011, 19, 175–182. [Google Scholar]
- Failla, S.; Romano, E.; Longo, D.; Bisaglia, C.; Schillaci, G. Effect of Different Axial Fans Configurations on Airflow Rate. Lect. Notes Civ. Eng. 2020, 67, 691–699. [Google Scholar]
- Andersson, I.; Thor, M.; McKelvey, T. The torque ratio concept for combustion monitoring of internal combustion engines. Control Eng. Pract. 2012, 20, 561–568. [Google Scholar] [CrossRef]
- Bisaglia, C.; Romano, E. Utilization of vineyard pruning: A new mechanization system from residues harvest to CHIPS production. Biomass Bioenergy 2018, 115, 136–142. [Google Scholar] [CrossRef]
- Grisso, R.D.; Kocher, M.F.; Vaughan, D.H. Predicting tractor fuel consumption. Appl. Eng. Agric. 2004, 20, 553–561. [Google Scholar] [CrossRef]
- Wilmer, H. All you need to know about diesel guzzling and engine power. Profi Int. 2001, 11, 40–42. [Google Scholar]
- IPCC. IPCC Fifth Assessment Report (AR5) e The Physical Science Basis. 2013. Available online: https://www.cambridge.org/core/books/climate-change-2013-the-physical-science-basis/summary-for-policymakers/356E277FD1FBC887845FB9E8CBC90CCD (accessed on 17 September 2020).
- Unakitan, G.; Aydin, B. A comparison of energy use efficiency and economic analysis of wheat and sunflower production in Turkey: A case study in Thrace region. Energy 2018, 149, 279–285. [Google Scholar] [CrossRef]
- R Development Core Team. R: A Language and Environment for Statistical Computing; R Foundation for Statistical Computing: Vienna, Austria, 2012; Available online: http://www.R-project.org (accessed on 26 April 2019).
- Lal, R. Carbon emission from farm operations. Environ. Int. 2004, 30, 981–990. [Google Scholar] [CrossRef] [PubMed]
Publisher’s Note: MDPI stays neutral with regard to jurisdictional claims in published maps and institutional affiliations. |
© 2020 by the authors. Licensee MDPI, Basel, Switzerland. This article is an open access article distributed under the terms and conditions of the Creative Commons Attribution (CC BY) license (http://creativecommons.org/licenses/by/4.0/).