1. Introduction
In the middle of last century, A.A. Vorobiev introduced the concept of the Earth’s natural pulsed electromagnetic field (ENPEMF) [
1]. However, concepts related to the Earth’s electromagnetic field had already been mentioned in previous works of A.P. Kraev [
2]. In the 1970s, the main geoelectric processes occurring in the interior of the Earth were described by A.P. Kraev [
2]. The studies that were carried out during this period contributed to revealing the relationship between the change in the ENPEMF parameters and earthquakes [
3,
4,
5]. The hypothesis of parameters correlation of the Earth’s electromagnetic field and earthquakes was also developed by various scientific schools’ representatives. For example, a group of Japanese scientists obtained the significant outcome that, during earthquakes, the Earth’s electric field is an order of magnitude stronger in the vertical direction than in the horizontal direction and that this field increases rapidly as it approaches the surface of the Earth [
6].
In parallel with applied research in this field, since then, fundamental research has been carried out. The research papers by M.E. Dolgiy and S.G. Kataev present the results of studies of the ENPEMF characteristics, inter alia; the structure of the field was studied, and the concept of the energy characteristics of the field was introduced [
7,
8]. G. Hao and his group made a great contribution to the development of the theory of ENPEMF. Thanks to the research of earthquakes, they were able to obtain the frequency-time characteristics of the ENPEMF [
9].
At this time, the concept of the electromagnetic emission of rocks, electromagnetic pulses (EMPs), which result from the formation of cracks in the massif, was introduced by Belyaev L.M. [
10]. An EMP is generally understood as a stepwise change in the potential of the electric field near the area being deformed, which results in the occurrence of an electromagnetic wave, which can be recorded by a receiving device.
However, active studies of the relationship between dynamic processes in rocks and EMPs just began in the twenty-first century [
11,
12,
13,
14], wherein the physical and methodological basics for predicting rock bumps were developed [
15,
16]. Even the equipment that allows the performance of local assessment of the massif strength by the minimum and maximum values of the amplitudes of the recorded electrical pulses within a given time interval and by the magnitude of the relative distribution of the amplitudes of the recorded electromagnetic pulses without their frequency accounted for was recently produced.
The assessment of the rock-bump hazard for the studied area is presented with the results obtained but without determining the signal source and its characteristics. Research in this field is also being performed by Russia’s and the world’s top scientists [
17,
18,
19,
20,
21,
22]. A group of scientists from China University of Mining and Technology proposed a method for predicting rock bursts based on the intensity and number of EMPs based on a statistical analysis [
23].
In addition to the EMP method, aimed at identifying active tectonic disturbances and their parameters, to ensure the safety of mining, various methods that cover all stages of mining, from the exploration of mineral deposits to the recultivation of territories after the development of deposits, are applied [
24,
25,
26,
27,
28]. The EMP method has recently been more commonly used in complex programs for predicting rock bumps on deposits, including for localizing potentially dangerous zones due to the high mobility of the method and the ability to conduct aerial surveys under a variety of conditions. Currently, the method still requires calibration by other instrumental methods, including core disking or dust coal yield, acoustic emission, ring unloading, using deformation sensors, etc. [
21,
29]. These works are performed to determine the critical (threshold) values of the recorded amplitudes. With the assumption that the method is generally promising, further detailed study of its fundamental basics, both in terms of geomechanics and geophysics, as well as sections of electrical engineering, will make it possible to more accurately interpret the data obtained and, in the future, also to monitor the strain-stress state of the massif using a non-contact, mobile method without performing additional work (drilling, installation of stationary sensors).
This is the purpose of this study, the results of which are presented in this paper; searching for a new approach to interpreting the data of anomalous values of the field in the presence of active tectonic disturbances in the rock.
2. Materials and Methods
The Khibiny massif was chosen as the object of the research. This massif is a central type massif of alkaline rocks, as well as a raw material base of phosphorus, titanium, high-alumina minerals and rare elements [
30]. The massif is located in the northeastern part of the Baltic shield, in the center of the Kola Peninsula, in the junction zone of the Kola and Belomorsk blocks of the Earth’s crust. These blocks are composed of ancient Archean crystalline metamorphic and igneous rocks. The Imandra-Varzugskaya rifting structure of a posterior Proterozoic age is observed at the boundary of the blocks. The southwestern part of the Khibiny massif, the age of which is determined as Upper Devonian, is located in the Imandra-Varzuga structure and the northeastern part of the Kola block [
31]. The southern part of the Khibiny massif is characterized by the development of fault-block tectonics [
32].
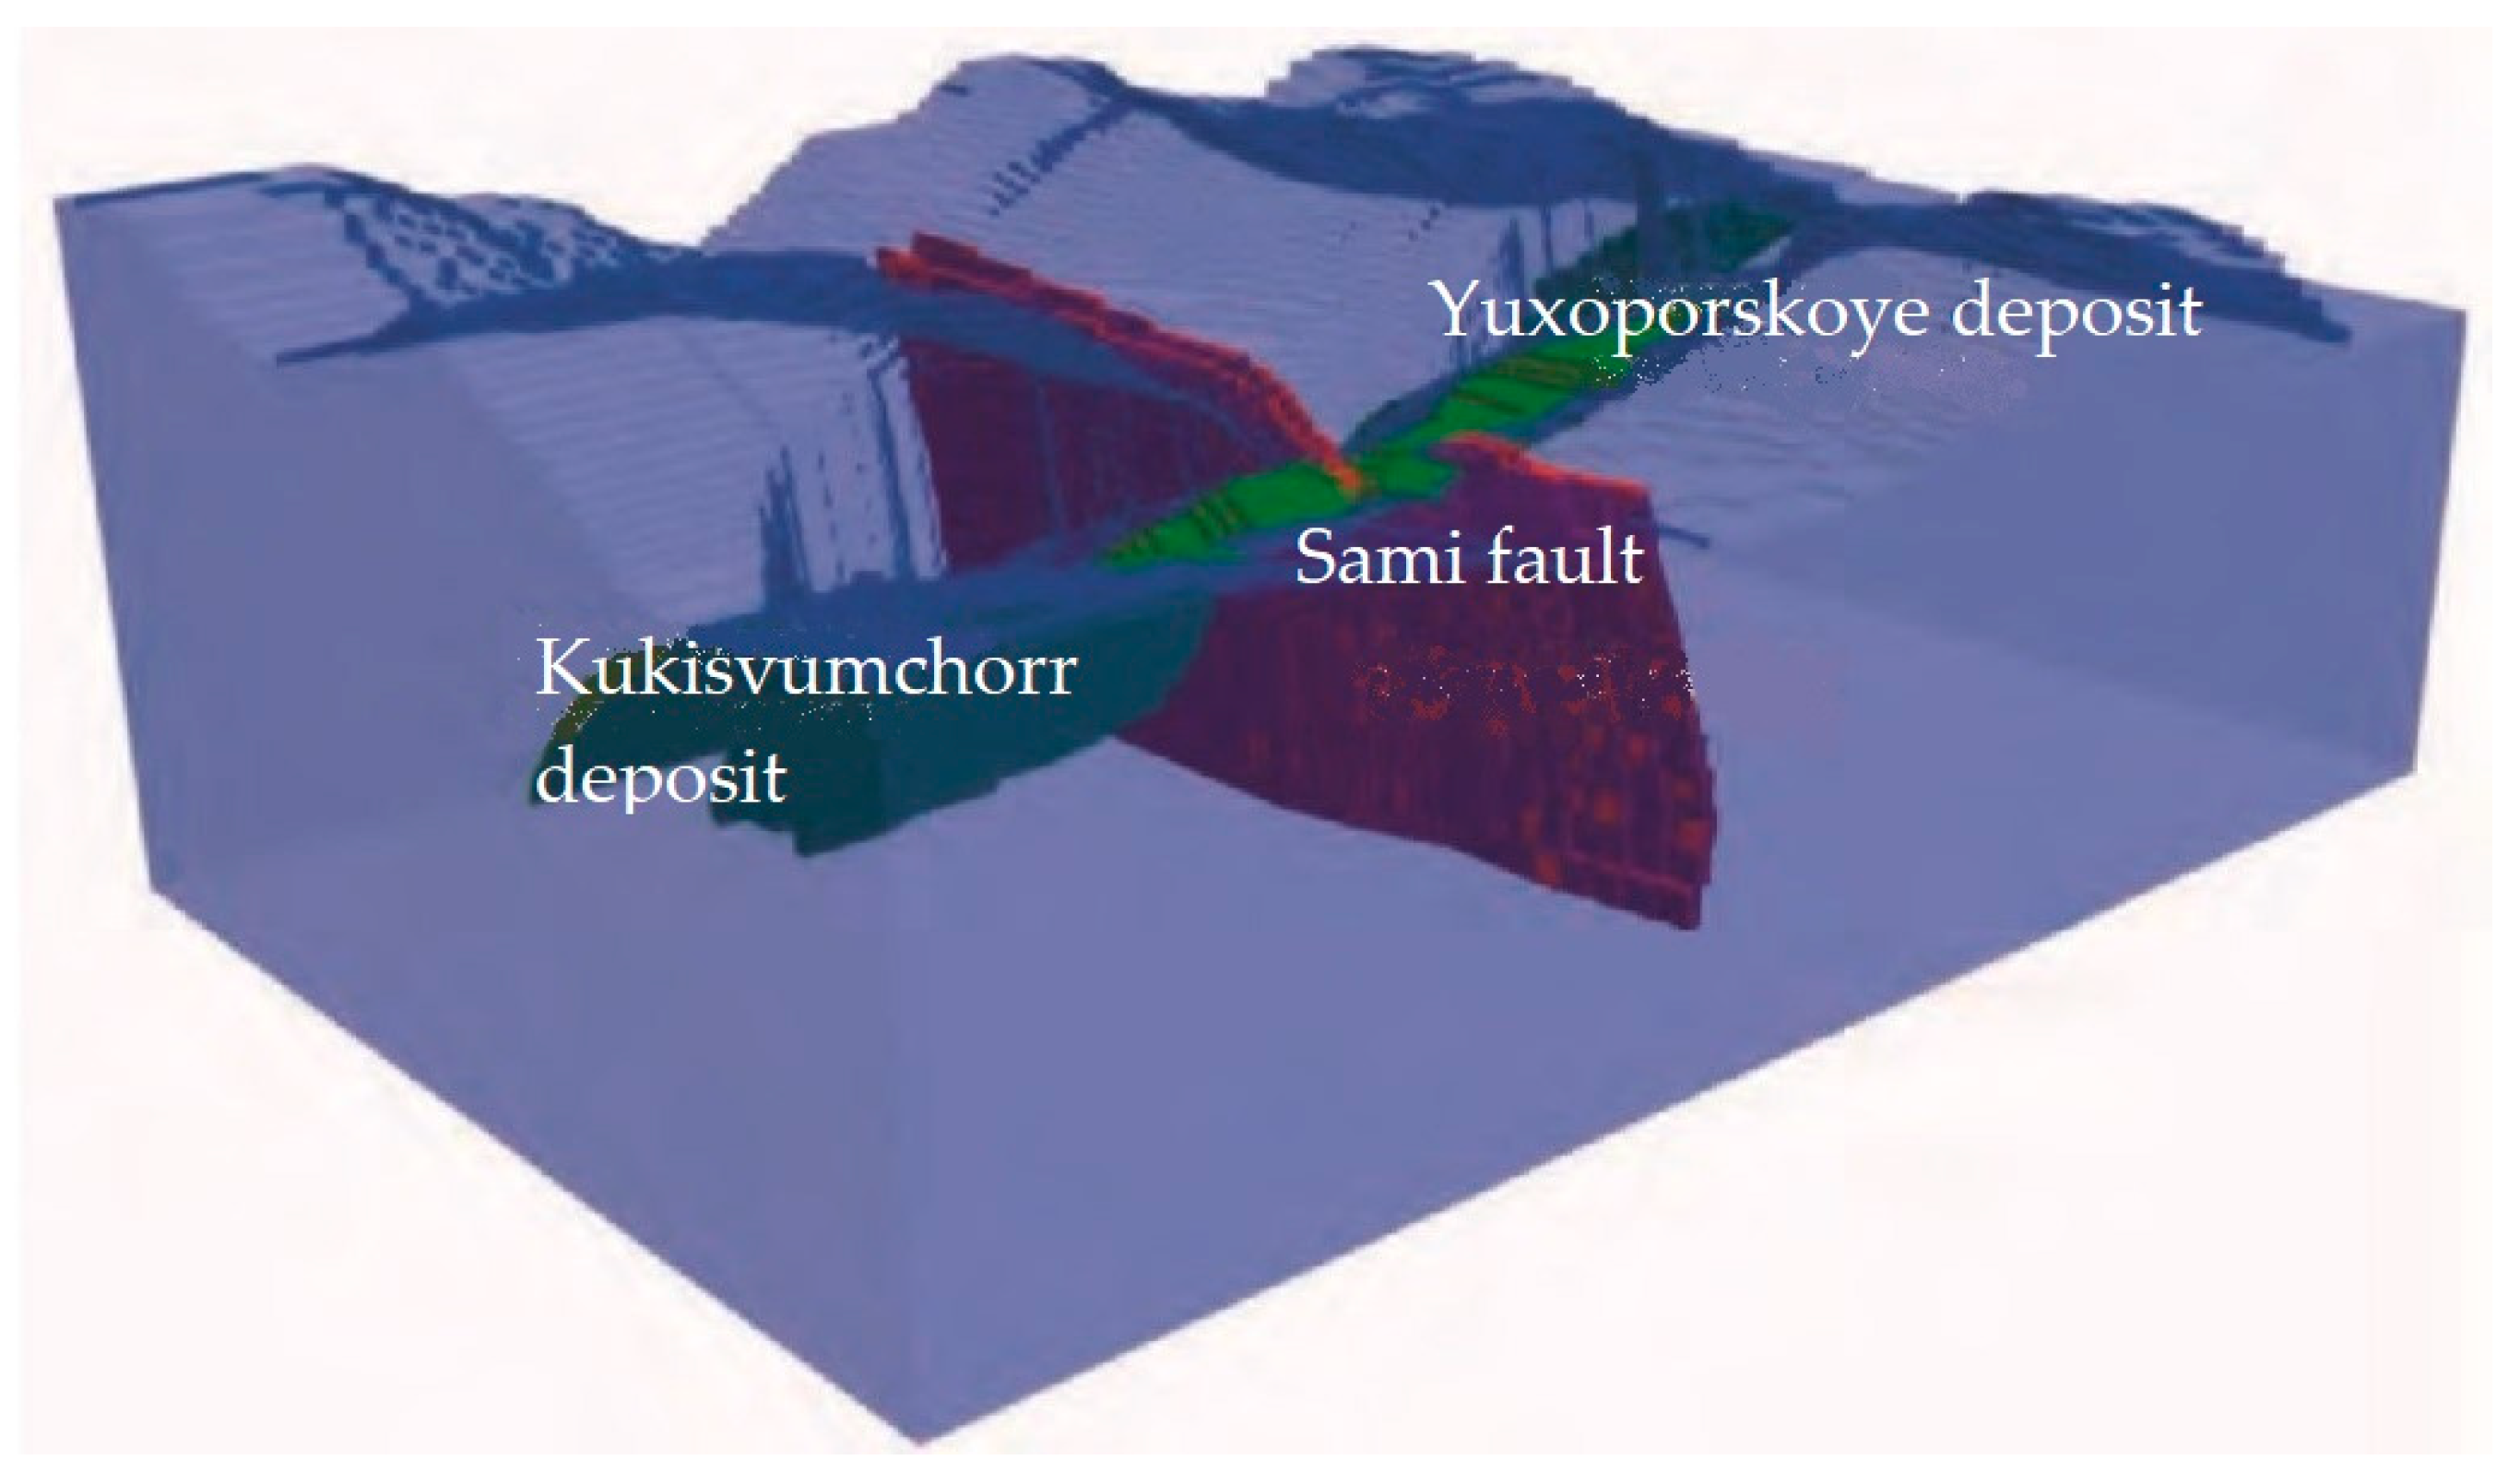
The Khibiny massif contains several deposits of apatite-nepheline ores, such as Kukisvumchorr, Yuksporskoe, Apatite Circus, Rasvumchorr Plateau, Koashvinskoe and Nyorkpakhkskoe. The main types of ores that are mined here are apatite urtites and ijolites, sphene-apatite and apatite-nepheline. Ore deposits form tabular and lenticular bodies with an average thickness of 80 m.
The Kukisvumchorrskoye and Yuksporskoye deposits are developed by the Kirovsky mine, which was founded in 1929 and is still operating. In addition, it is one of the world’s largest mineral resources developments.
The Sami fault crosses the underground Kirovsky mine at all levels and comes to the surface in the Sami quarry on which work is currently stopped. Today, mining at the mineral deposits is carried out only by underground methods.
The Sami fault is a strike-slip fault, radial relative to the massif, and extends across the ore body (
Figure 1). Its dip angle is close to vertical.
The fault activity is precisely determined based on the fact that, in 2016, several seismic events of energy greater than 106 J were recorded in its area [
34].
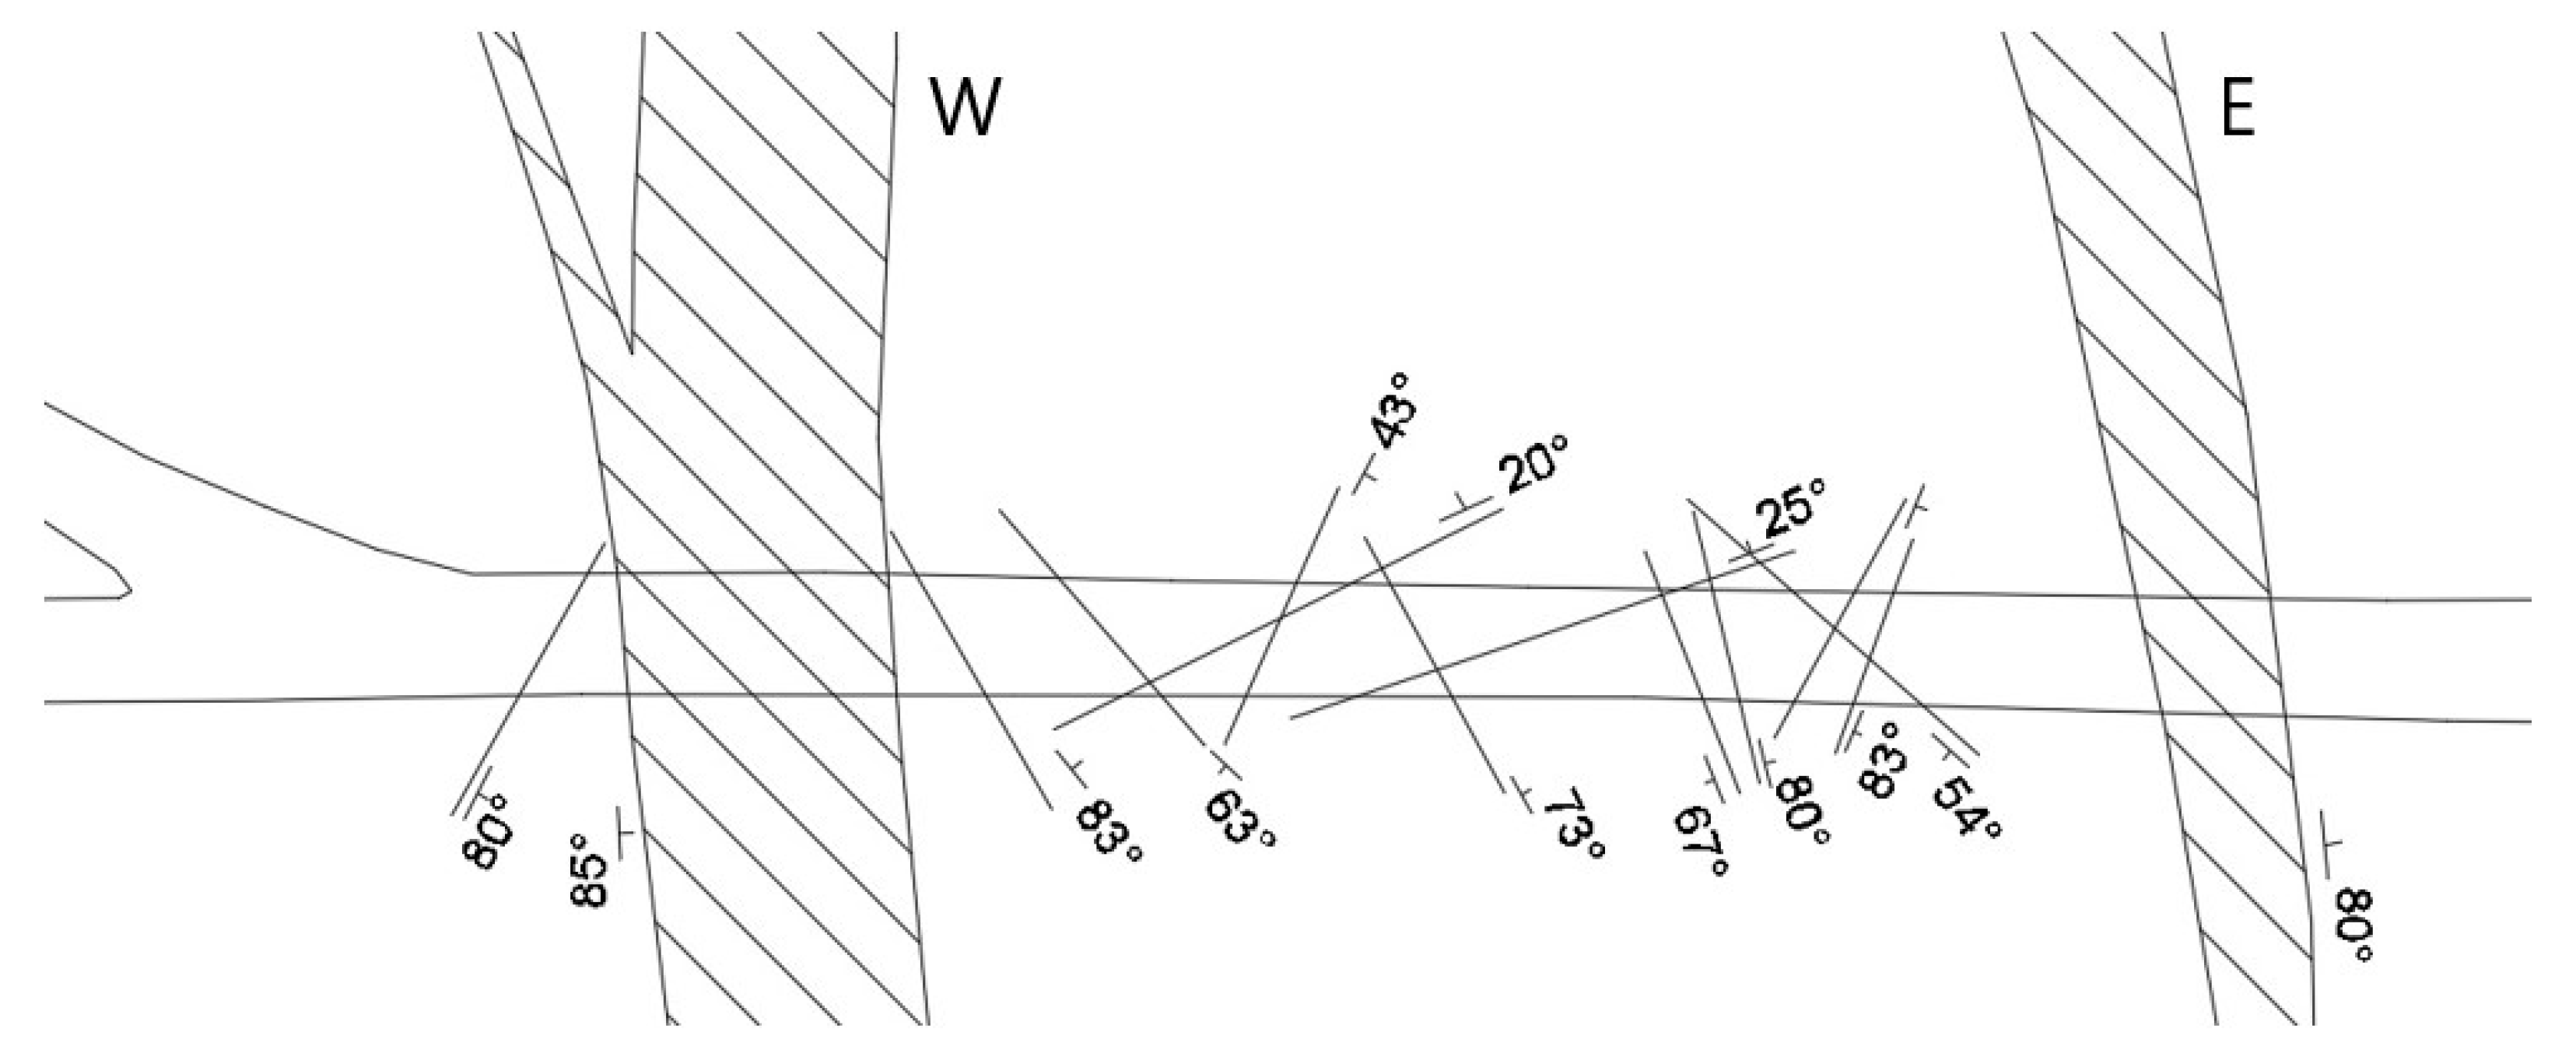
The fault has a complex branching structure. On the considered horizon in the studied mine working, the fault is represented by two branches, including the western, wider branch and the eastern, narrower one. For this area, the following dimensions have been established: the width of the eastern branch is 9 m; the width of the western branch is 15 m; and the distance between the branches is 70 m. The studied area is located in the enclosing rocks of the recumbent wing, represented mainly by urtites.
Urtites are a full-crystalline plutonic rock of the alkaline series of the ultrabasic foidolite family, consisting of nepheline (70–90%), clinopyroxene (10–20%) and minor minerals, including titanite, titanomagnetite, apatite, etc. The average chemical composition (wt.%) is: SiO2 43.71; TiO2 0.58; Al2O3 26.63; FeO (gen.) 3.53; MgO 1.69; CaO 5.02; Na2O 13.22, K2O 4.08.
The Sami fault is characterized by a depth of up to 30 km and a length of about 10 km [
34]. Between the fault branches, the development of disjunctive breaks of low thickness and length is observed (
Figure 2).
The Sami fault has been the object of research in several projects. Earlier, in the area of the Sami fault, the experts from the Kola Scientific Center of the Russian Academy of Sciences (KSC RAS) and joint-stock company (JSC) “Apatit” conducted studies aimed at determining the nature of motion within the area of this fault. To this end, a leveling test site was created in 1990, which later, in 1995, was supplemented with a light and range-finding test site, since leveling measurements render it possible to observe displacements in the vertical plane only. Based on the results of these observations, a stable uplift of the inner fault zone relative to the enclosing rocks was revealed with insignificant sign-variable fluctuations [
35]. The rates of filler uplift relative to the enclosing rocks at a horizon of +252 m were 0.04 and 0.06 mm/month for the eastern and western branches of the test site, or, 0.48 and 0.72 mm/year, respectively. For a horizon of +172 m, this value was 0.02 mm/month or 0.24 mm/year. However, currently, the quantitative characteristics are no longer relevant due to the development of mining operations and deeper horizons within this area. During the study, no significant horizontal displacements along the profile were revealed, nor were vertical displacements of the fault edges relative to each other. In view of the general abnormality of motion along the Sami fault, the effect of sub-horizontal stresses with the simultaneous influence of man-made factors was accepted as the main hypothesis.
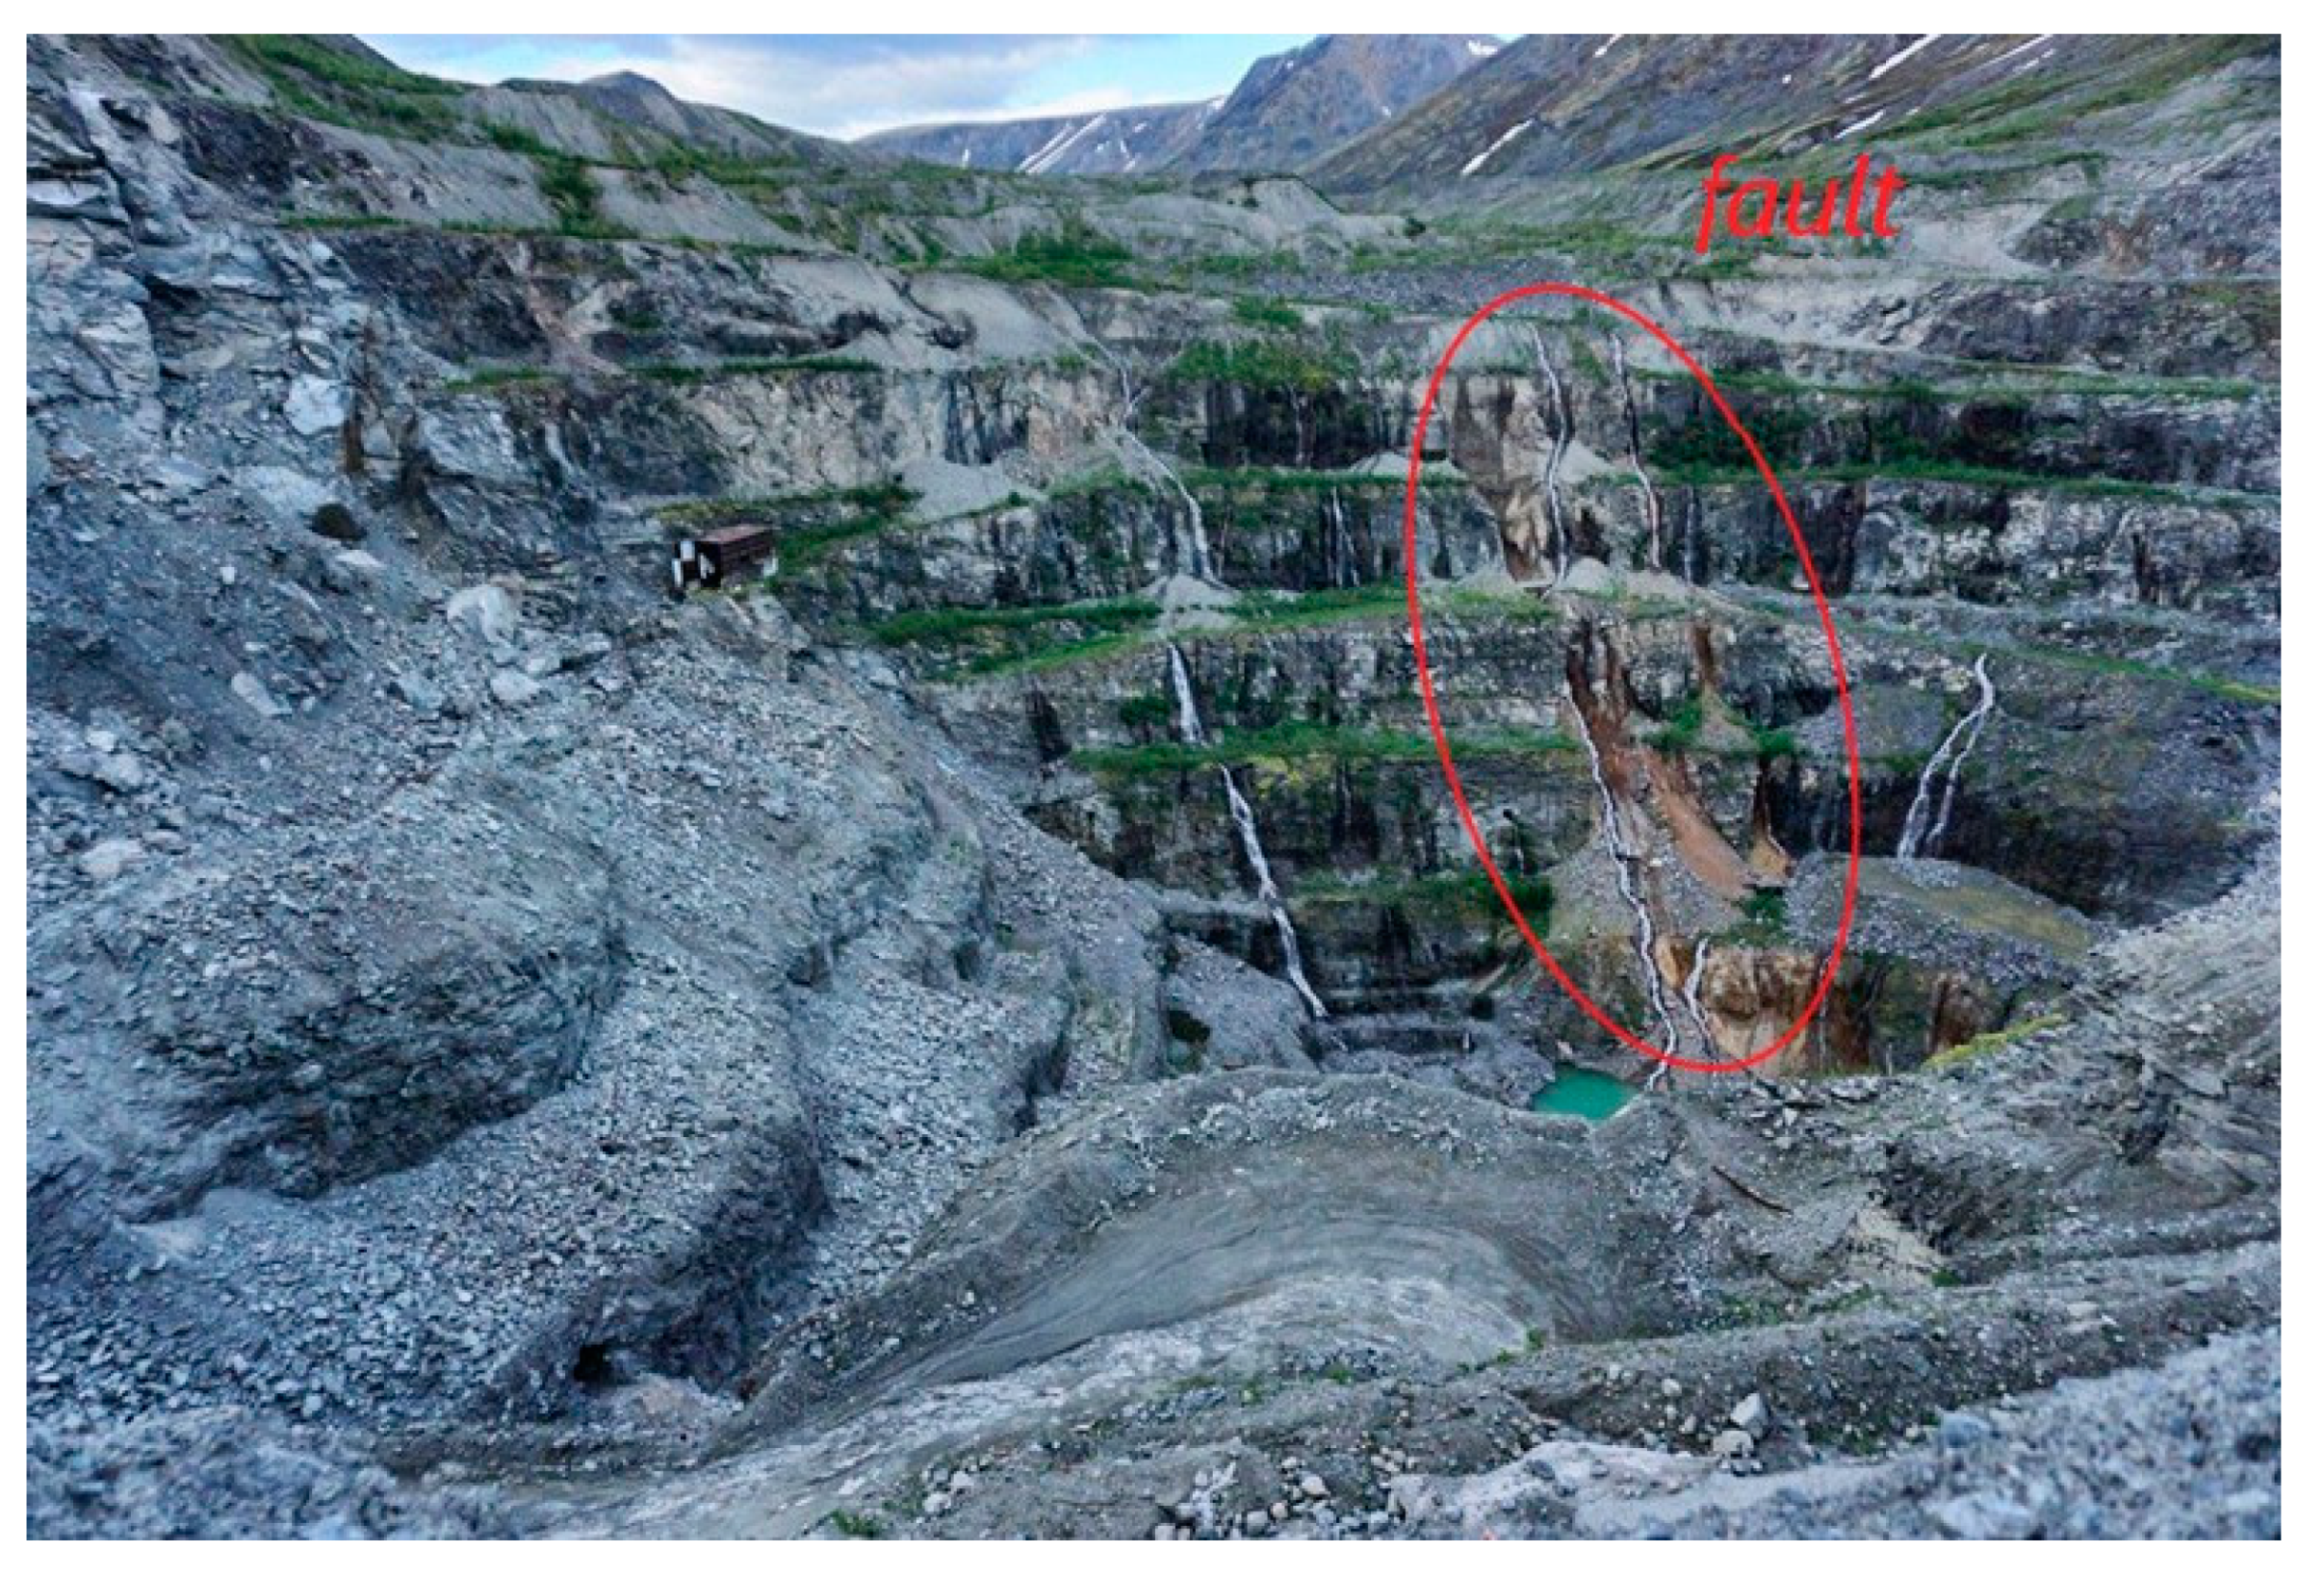
Figure 3 shows an image of the Sami fault at the place of its exposure to the land surface. The fault is a heterogeneous zone of crushing, cataclasis and mylonitization, within which there are numerous blocks, lenses and coarse fragments of oxidized (spreushteinized) enclosing rocks [
35].
Based on the scope of accumulated data on the Sami fault and its features, as well as in view of the general importance of the development of systems for monitoring geodynamic processes in underground mine workings, it can be concluded that the study of the Earth’s variable electromagnetic field within the area of the Sami fault will contribute to determining the relationship between the magnitude of the recorded signal, which is the potential difference at the terminals of the receiving antenna, and the presence of tectonic disturbances in the massif; the impact of the signal frequency on the magnitude of the electromagnetic energy generated in the active fault zone; and the dependence of the geometric parameters of the fault, the mineralogical composition of the rock, on the electromagnetic field EMF value.
Receiving and recording equipment was used For ENPEMF registration. It was selected in such a way that it was allowed to receive and record the electromagnetic signals in digital form in the frequency range from 300 Hz to 18 kHz. The receiving channel includes a magnetic antenna (ferrite). A rod of the antenna has the following characteristics: core material—M400HH, according to the Russian material classification; initial magnetic permeability—400 H/m; rod diameter—10 mm; rod length—200 mm; winding length—180 mm; the diameter of the copper wire is 0.1 mm; and the number of turns is about 3000. The determination of the antenna constant from the harmonic alternating magnetic field was carried out according to the standard technique in Helmholtz rings. The APPA-109N device was used as a recorder.
Based on the results of the pulsed EMF sensitivity test, it was found that the maximum amplitude of the response at the output of the magnetic antenna to the pulse-discharge (in the form of a damped sinusoid) is proportional to the pulse power. The laboratory instrumentation and portable device APPA-109N complied with Russian standards and Russian government technical requirements. Based on the results of the recorder calibration, constant sensitivity was confirmed in the frequency range from 1 to 18 kHz, with a linear dependence of the recording level on the input signal level. The digitization frequency of the signals was 44.1 kHz.
The rock accumulates electromagnetic energy, and, when the strain-stress state changes under the influence of natural or man-made factors, electromagnetic pulses will be generated therein, releasing the accumulated electromagnetic energy. Electromagnetic energy will be expressed by electric-field vectors E ⃗ and magnetic-field vectors H ⃗. The flow of energy will change depending on the state of the massif. In the absence of deformations at the point of observation, the parameters of the electromagnetic field will be constant or they will fluctuate within a certain range of Δ up to 20% of the background. Based on the multi-year research, the sampling mode is taken as a conditional background. With the activation of tectonic processes, the resulting electromagnetic field will change and may be several times higher than the so-called background value. Herein, it is worth noting that the presence of water inflow/water cut of rocks causes an increase in the recorded signal, which, within the framework of this study, has an advantageous effect by virtue of the increased contrast range of the resulting diagrams.
Consequently, a change in the EMF parameters witnesses in favor of the probability of the existence of dangerous geodynamic processes in the area, where the field parameters differ from the background value. The resulting electromagnetic field of lithospheric origin will be observed at the point of observation [
36]. The parameters of this field will correlate not only with physical processes in the lithosphere but also with the electromagnetic characteristics of the rock.
The parameters characterizing the electromagnetic field of the rock include:
- (1)
The resulting energy flux of the electromagnetic field, which is determined by the Umov-Poynting vector . Since the resulting electromagnetic field is a superposition of fields of different natures, the resulting Umov-Poynting vector will be equal to the algebraic sum of the vectors of individual electromagnetic fields. When the state of the massif changes, the resulting energy flux will differ from the background value by SV.
- (2)
Electromagnetic energy density u, depending on the values of the electric and magnetic vectors and the electric-field and magnetic-field vectors.
- (3)
The power of the electromagnetic field generated by a crack
, depending on the values of the total dipole moment, the frequency of emission of an electromagnetic signal and the relative dielectric constant [
37].
It is worth noting that the flux of energy emitted by a moving charge depends on the direction of electromagnetic wave. In an anisotropic medium, to which the rock belongs, electromagnetic waves propagate at a speed lower than the speed of light. This is due to the presence of dispersion and losses.
The aforesaid renders it possible to make two conclusions. Firstly, the background value of the electromagnetic field, which is generally recorded as its magnetic component, is highly likely to change when dynamic motion occurs in the massif. Secondly, deviations from the background field value may witness in favor of the presence of cracks and faults in the massif. If we consider a set of micro-cracks of a definite volume, namely, faults, and a section of the massif between two large faults in terms of electromagnetism, it is possible to implement a transition from mining and geological concepts to electro-technical ones.
Rock-forming minerals, which constitute one or another rock, are ionic structures. Therefore they are also characterized by the regularities of electrification typical for alkali-halide compounds.
The values of the electrical parameters of rocks vary within a very wide range and depend on many other parameters including temperature, humidity, pressure [
2]. It is known that the amount of charge will depend on the electrical conductivity of the rocks σ. The higher the electrical conductivity, the more free charges are formed on the fault surface.
Specific conductivity depends on temperature and pressure. Due to the fact that changes in electrical conductivity are observed with an increase in temperature of more than 700 degrees Celsius and, therefore, are typical already for the mantle, the rocks composing the lithosphere are not prone to sufficiently strong fluctuations of temperature, and this influence was not considered in this study [
38].
As is known, there are 4 types of rock conductivity including: ionic, ion-electron, electron and hole-electron. The main place at low temperatures and low pressures is given to the impurity component of the rock—ionic and semiconducting. Since the main mineral in the composition of urtite is nepheline, the conductivity will be mainly ionic due to the fact that nepheline is a one-dimensional ionic conductor. The conductivity of nepheline is related to diffusion and is mainly determined by the presence of extended channels along the axis of the structure, where ions can be freer [
39].
As is known, at the boundaries of different rocks, a surface charge formed has a density.
The authors propose a transition from mining and geological concepts to electro-technical ones and a representation of a tectonic disturbance in the form of a capacitor with a certain capacity C. Since, according to the simplest concepts of electrical engineering, in simplified form, a crack or a fault can be represented in the form of a capacitor, the edges of the crack represent the plates of a conditionally plane capacitor on which there is a charge that forms a potential difference. Since there is a directly proportional relationship between the area of the capacitor plates and the charge, it is obvious to conclude that, the larger the crack surface, the more charges will be distributed along its edges. Therefore a greater change in the electromagnetic field will be observed around it. However, the dependence of the capacity on the distance between the edges will be inversed. The capacity of such a capacitor, namely, the amount of charge a crack can accumulate, will depend on its geometrical parameters, namely, height and width, as well as on the dielectric constant of the rock filling the fault and the degree of water cut. Urtite, as an alkaline rock, has an increased dielectric constant due to the presence of nepheline and other minerals. The variations for the capacity values for the considered section of the fault at a penetration depth within the frequency range up to 107 Hz are presented below in the results section.
The presence of cracked pores has a strong influence on the value of the dielectric constant. This is due to the fact that, under the conditions of their natural occurrence, the pores are filled with a saline solution of NaCl, which causes a significant increase in the dielectric constant. In addition, it should be noted that the fault is filled with fragmented rock, which is filled with tightly bound, loosely bound or free water, which further increases the dielectric constant [
39].
During the experimental studies, only the magnitude of voltage at the terminals of the receiving antenna was measured, which arises according to the law of electromagnetic induction resulting from the ingress of the inductance choke into an alternating electromagnetic field.
The following parameters were selected for the experiment:
- -
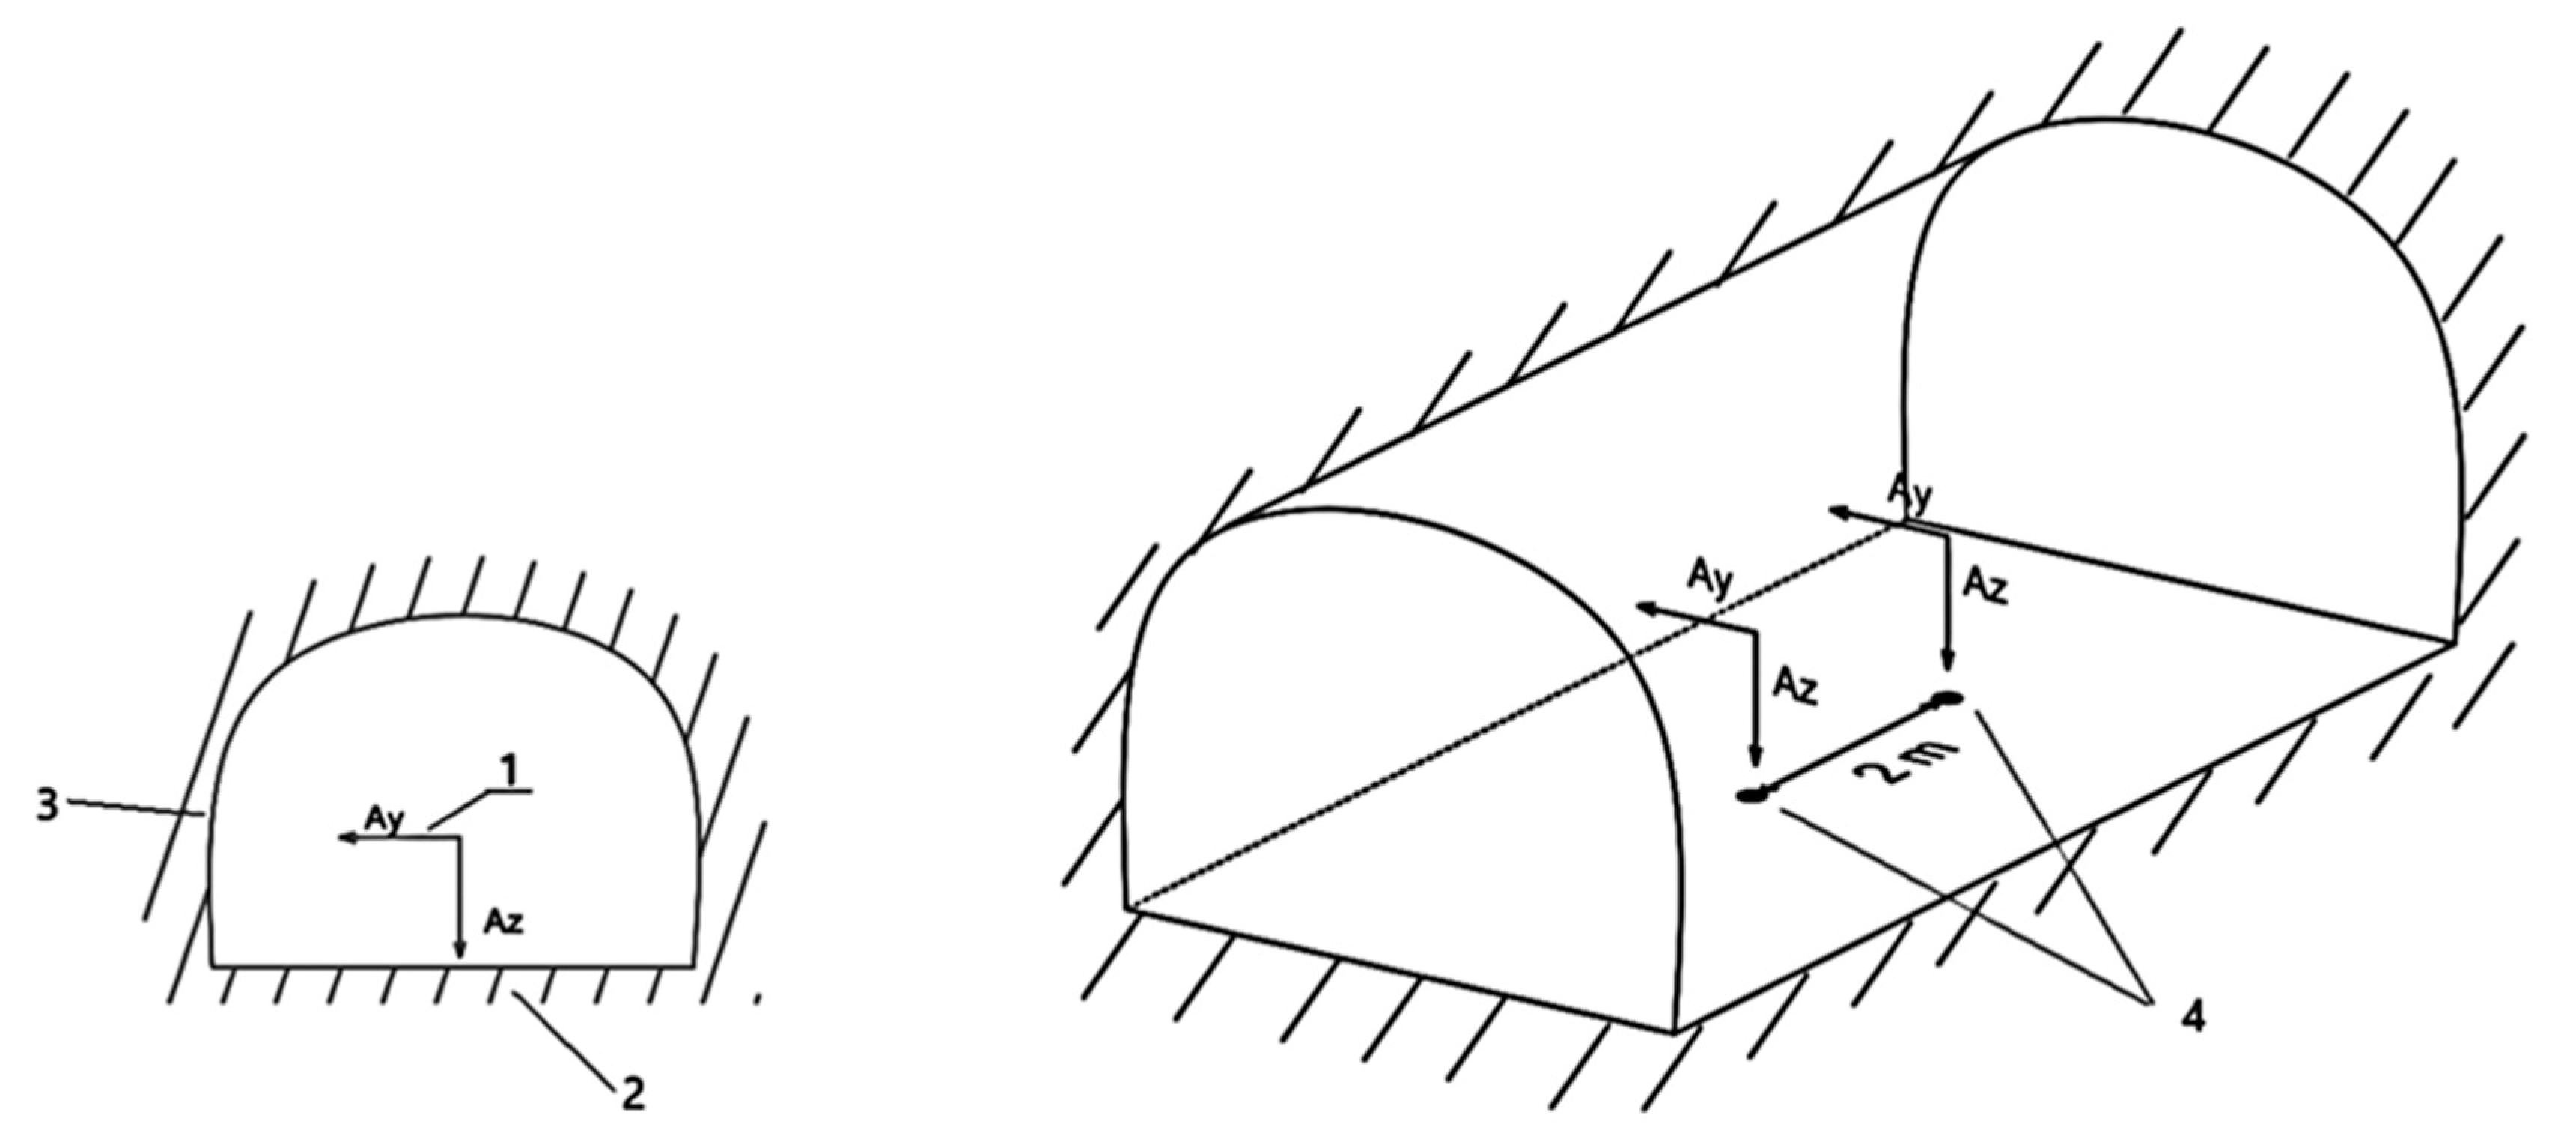
The measurements were performed for two directions of the antenna magnetic moment: down towards the lying wall (Az) and to the left towards the edge (Ay). Measurements in different planes are needed to improve the efficiency of recording anomalies. This is due to the fact that the electromagnetic field created by the fault can be oriented differently relative to the edges of a mine working.
- -
3 measurements were recorded for each profile point at each position of the antenna.
- -
The measurement pitch was 2 m.
The pitch of 2 m was chosen in accordance with the width of the smallest (Western) branch of the fault, which is 7 m. If a step of 3 m was chosen, the smallest number of points falling into the fault would be 2, which does not allow us to fully consider the signal recorded in the fault. A more accurate perspective calculation of the position of measurement points in underground conditions is not possible for objective reasons, including the uneven ground of the mine, possible obstacles during profiling, etc. In addition, it was planned to pass the profile further than the Western branch of the fault, tracing the signal change beyond it. In this case, the number of measurements would be 75 and the length of the profile would be 150 m. However, while undergoing the research, further movement through the underground mine working was not possible.
As a result of the experiment, which includes measurements at 61 points, the variations of the values of Az and Ay were obtained. These are presented below.
3. Results
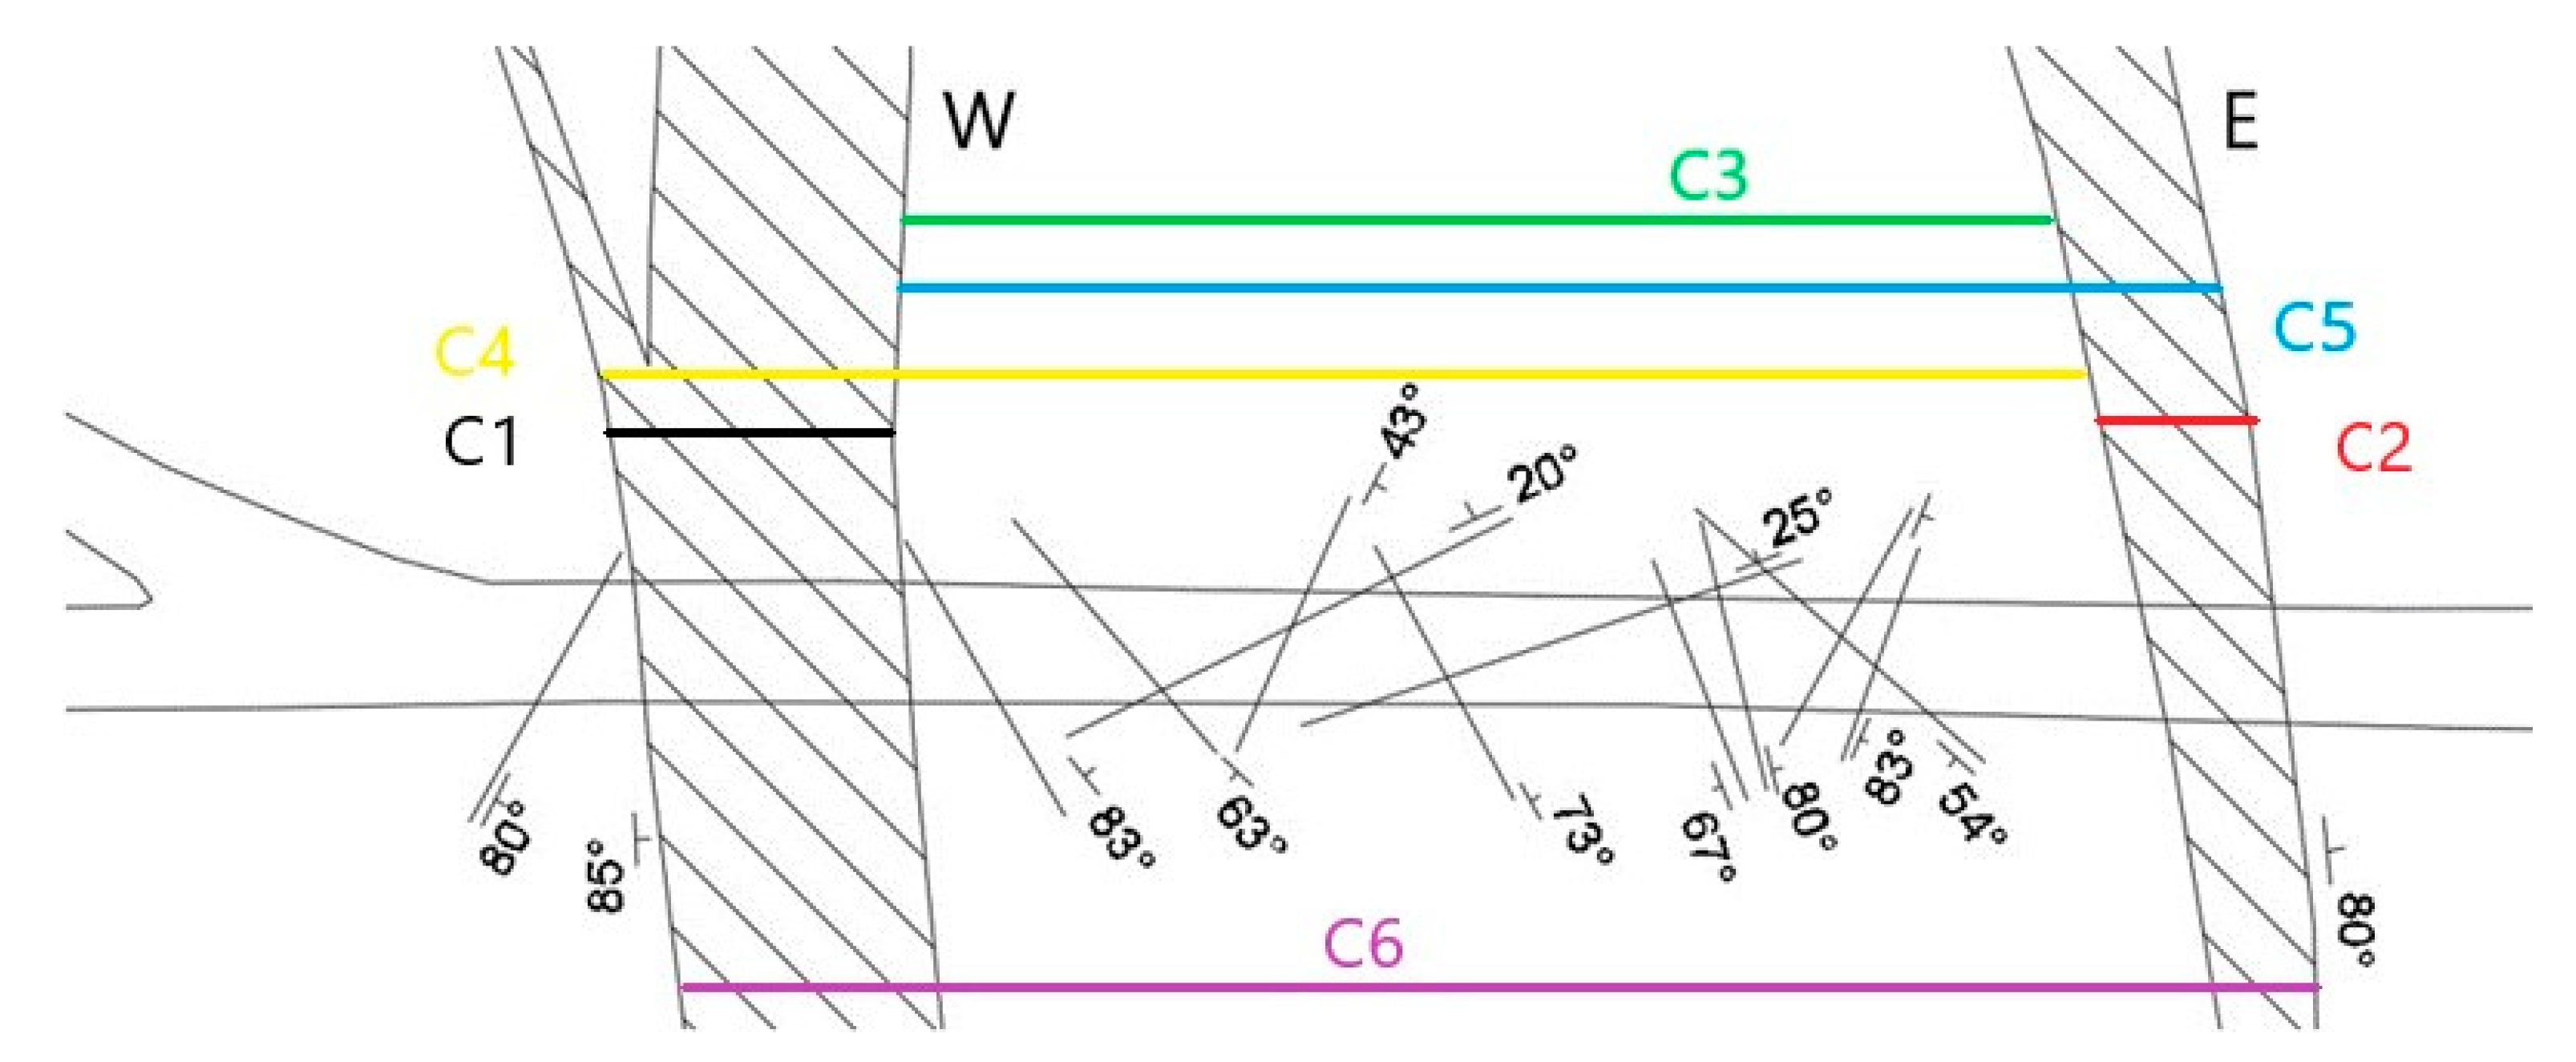
Six sections in the massif, the values of the capacities of which were calculated at a penetration depth of 10 m, were selected for the analysis (
Figure 5):
C1—for the western branch;
C2—for the eastern branch;
C3—for a section of the massif between the inner edges of the faults;
C4 and C5—between the inner and outer edges of the faults, taking into account the rock mass between the branches;
C6—between the outer edges of the two branches of the fault.
A visual representation of these sections is presented in
Figure 5.
The dielectric constant was calculated according to the Lichtenecker formula for two (1) and three-component mixtures (2):
where
ε is the relative dielectric constant and
ϕ is the volumetric concentration.
During visual inspection of the fault, approximate ratios of the three components in the studied rock mass were established, including urtite, water in the liquid phase and fault clay. According to these data, the volumetric concentrations of the components were calculated. At this stage of the study, calculation was performed for the high frequency range from 10
3 to 10
7 Hz. However, it must be said that significant changes in dielectric constant (decrease) begin in the high frequency range from 10
5 Hz [
40]. As a result, at frequencies from 10
3 to 10
5 Hz, the change in conductivities was not taken into account since, within the framework of this study, the error in averaging the dielectric constant is sufficient and will not affect the results.
Table 1 presents the results of calculating the dielectric constant for four multicomponent sections. According to reference data, the dielectric constant of urtite, depending on the frequency, varies from 8.5 to 7.3 F/m; the dielectric constant of water is 81 F/m; and the dielectric constant of the clay is 15 F/m.
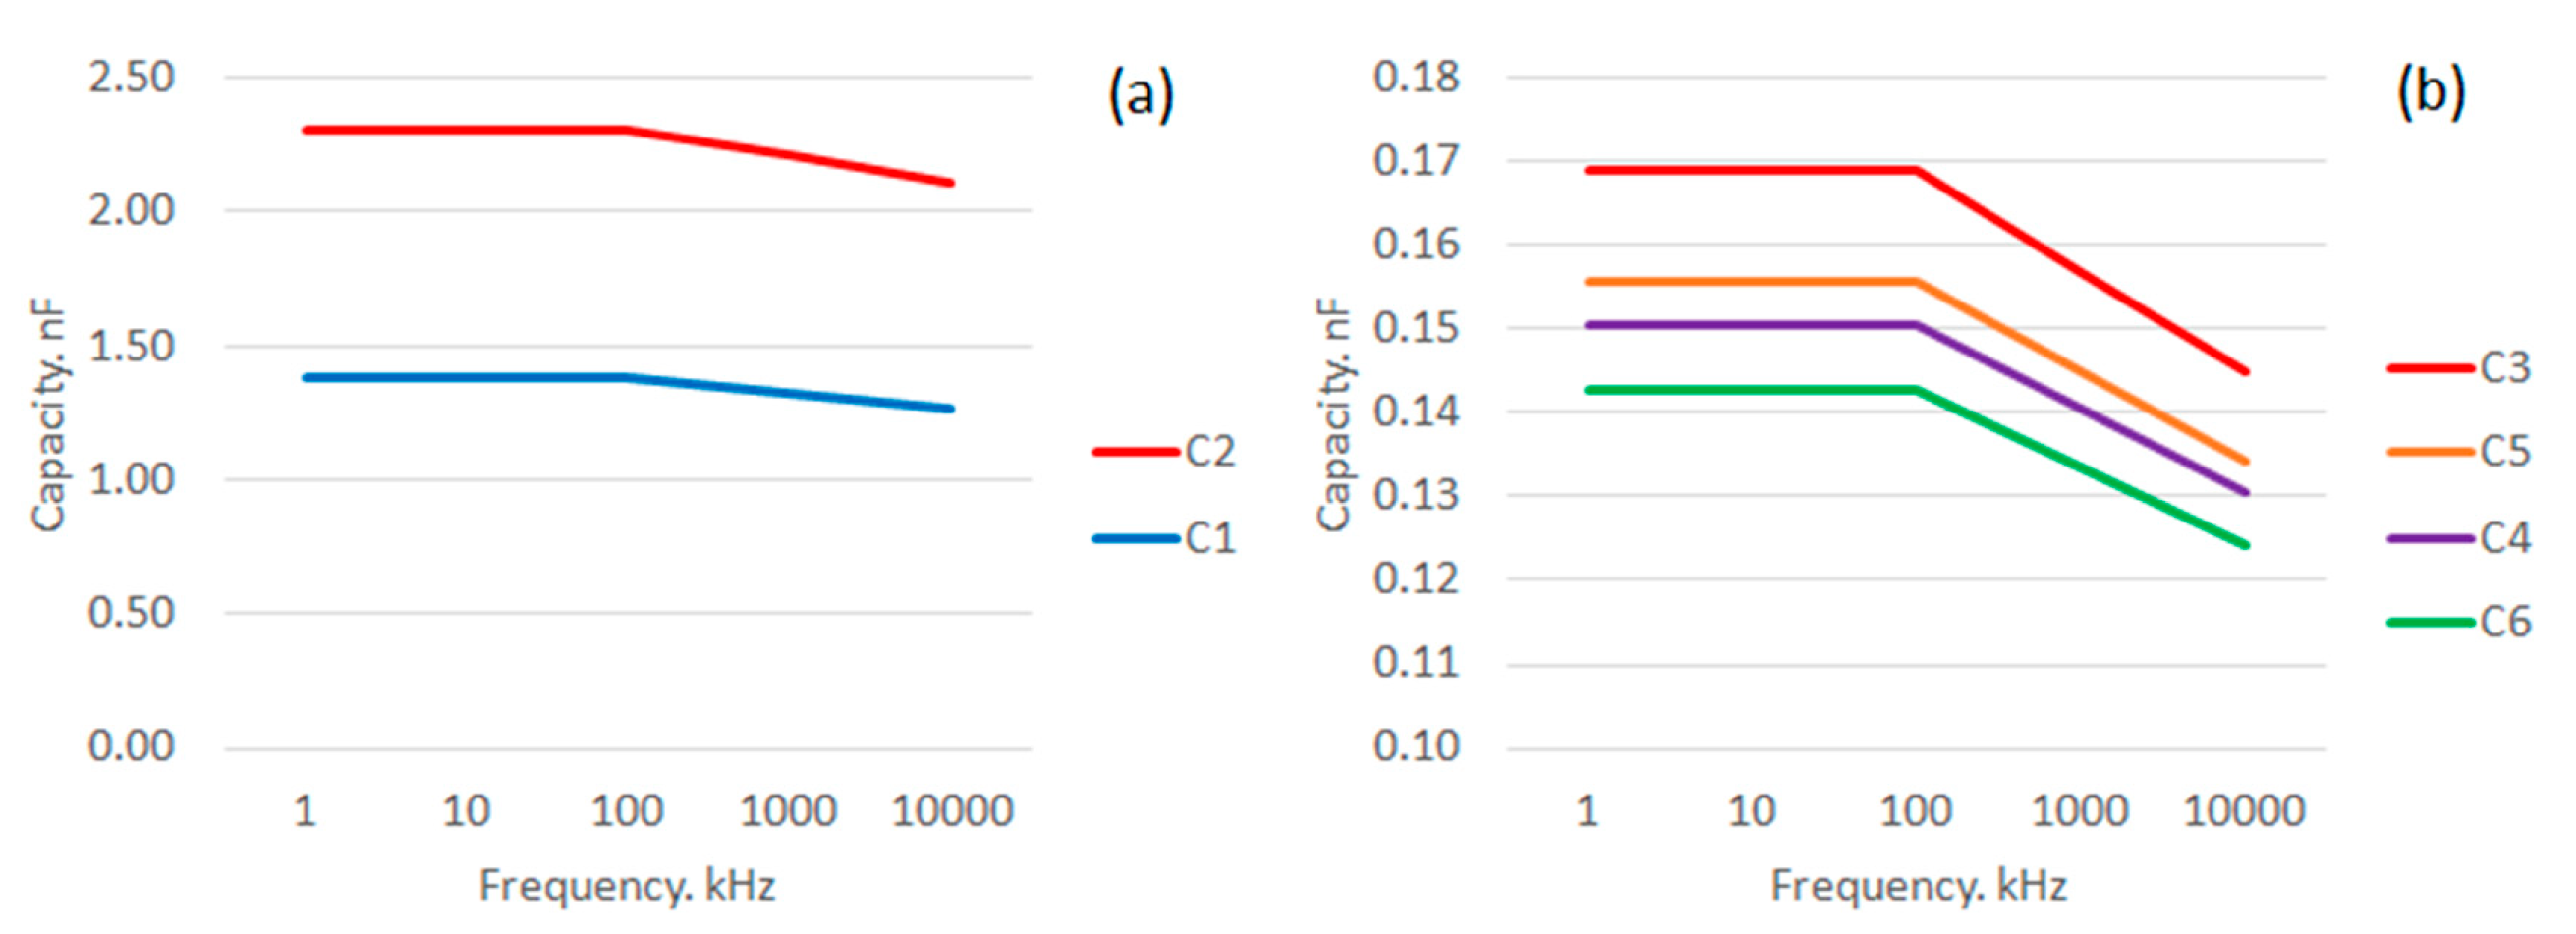
Further,
Figure 6a,b presents the variations of the capacities for the studied sections. According to the results obtained, the eastern branch of the fault, C
2, has the highest capacity. The values of the capacities of the fault branches by an order of magnitude exceed the values of the aggregate capacities of the fault branch itself and the adjacent rock mass. This is due to the presence of water in the liquid phase in the fault, as well as water-cut clay. In addition, the inverse relationship between permeability and frequency was confirmed.
Then the energy accumulated in the crack, presented in the form of a capacitor, will be equal to:
where the volume of a crack of length L and area
is calculated as follows:
According to the data obtained as a result of the study, it can be concluded that the eastern branch is potentially capable of accumulating the highest energy value in the electric field, which was confirmed by further experiments.
According to field tests carried out at a depth of 300 m from the land surface across the strike of the tectonic disturbance, the following results for deviations of the magnetic component of the ENPEMF were obtained.
As a result of the experiment, which includes measurements at 61 survey points, the variations in the values of Az and Ay, presented below, were obtained. Meanwhile, out of the three values recorded at each profile point for Az and Ay, the minimum and average values were used for further analysis. Initially, it was also planned to account for the maximum values, but their diagram coincides by visual representation with the diagram for average values.
For Az, the average value over the entire sampling was 766 μV; the lowest value was 8 μV; and the highest value was 16,000 μV. The average minimum and average maximum values were 56 and 1915 μV, respectively.
For Ay, the average value was 589 μV; the lowest value was 6 μV; and the highest value was 19,000 μV. The average minimum value, which was the same for Az, was 56 μV, and the average maximum value was slightly lower than the same parameter for Az and was 1581 μV.
It is worth noting that the maximum and minimum measurement values of Az and Ay fail to correspond to the same picket, while the range of values coincides and varies from a few μV to several thousand μV.
To visualize the measurement results and assess the experiment as a whole, the authors simulated anomalous field values via the AutoCAD software product. Further presented are the obtained dependencies, superimposed on the mining plan.
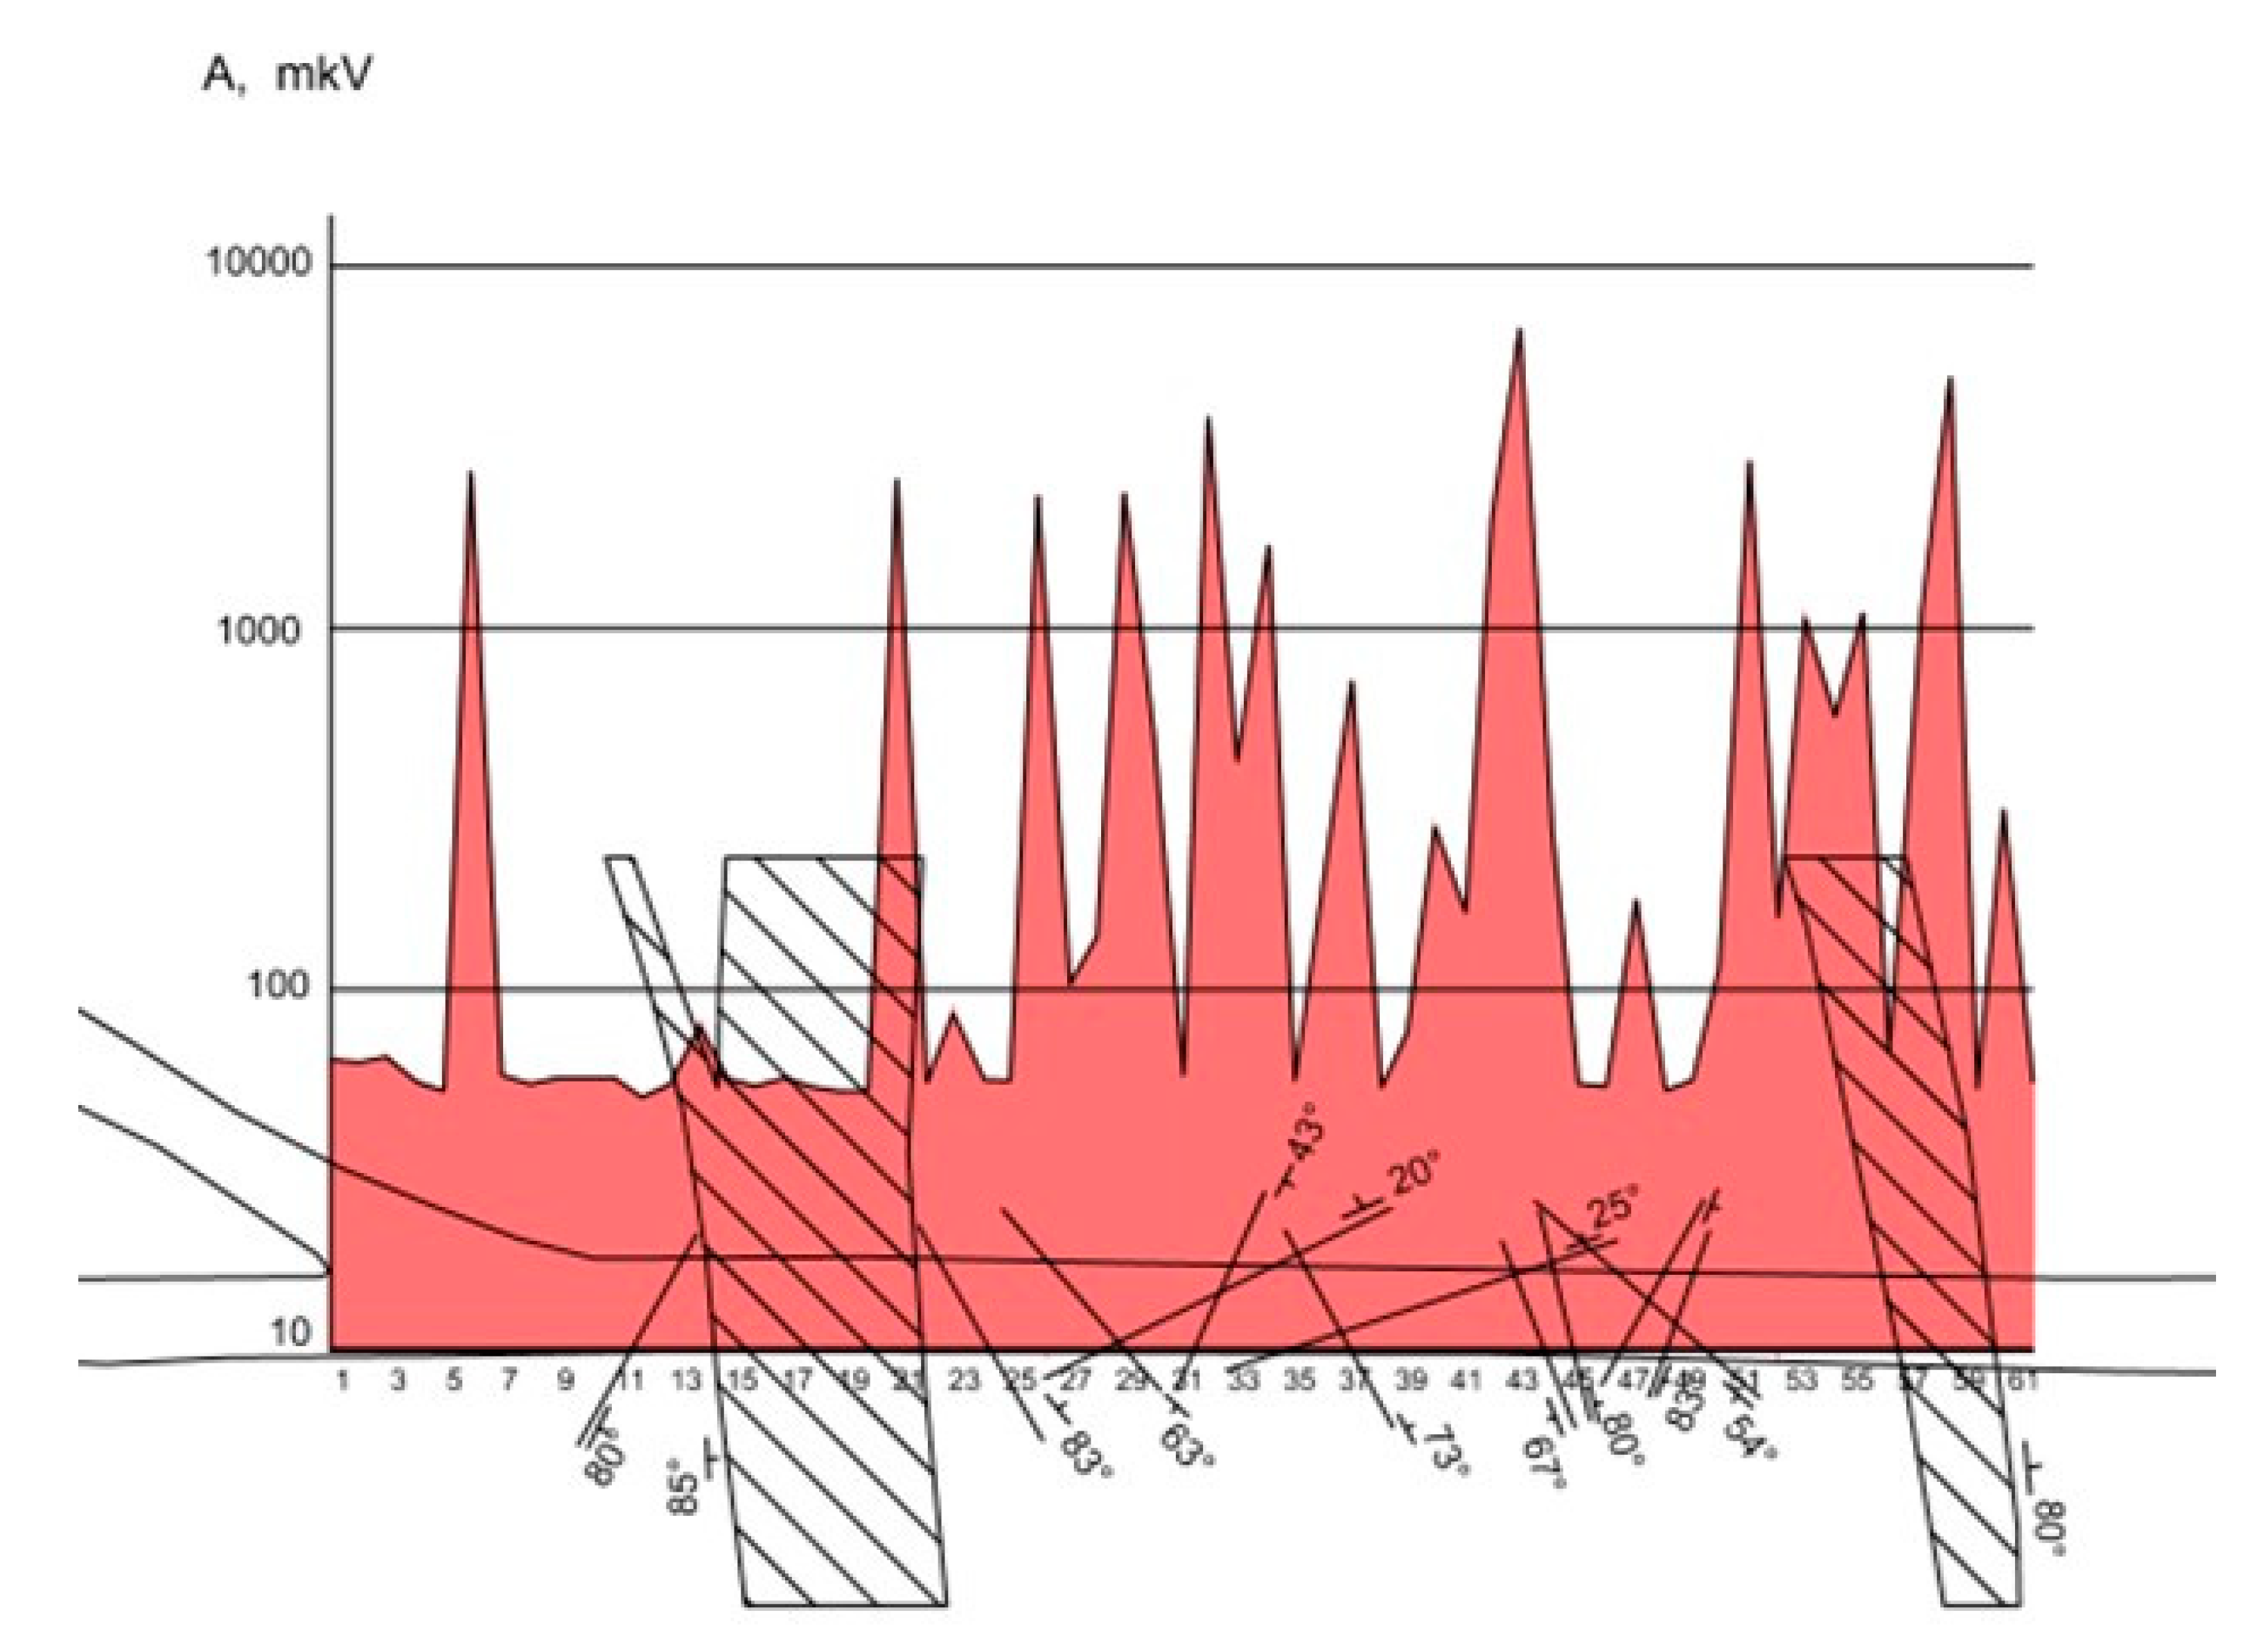
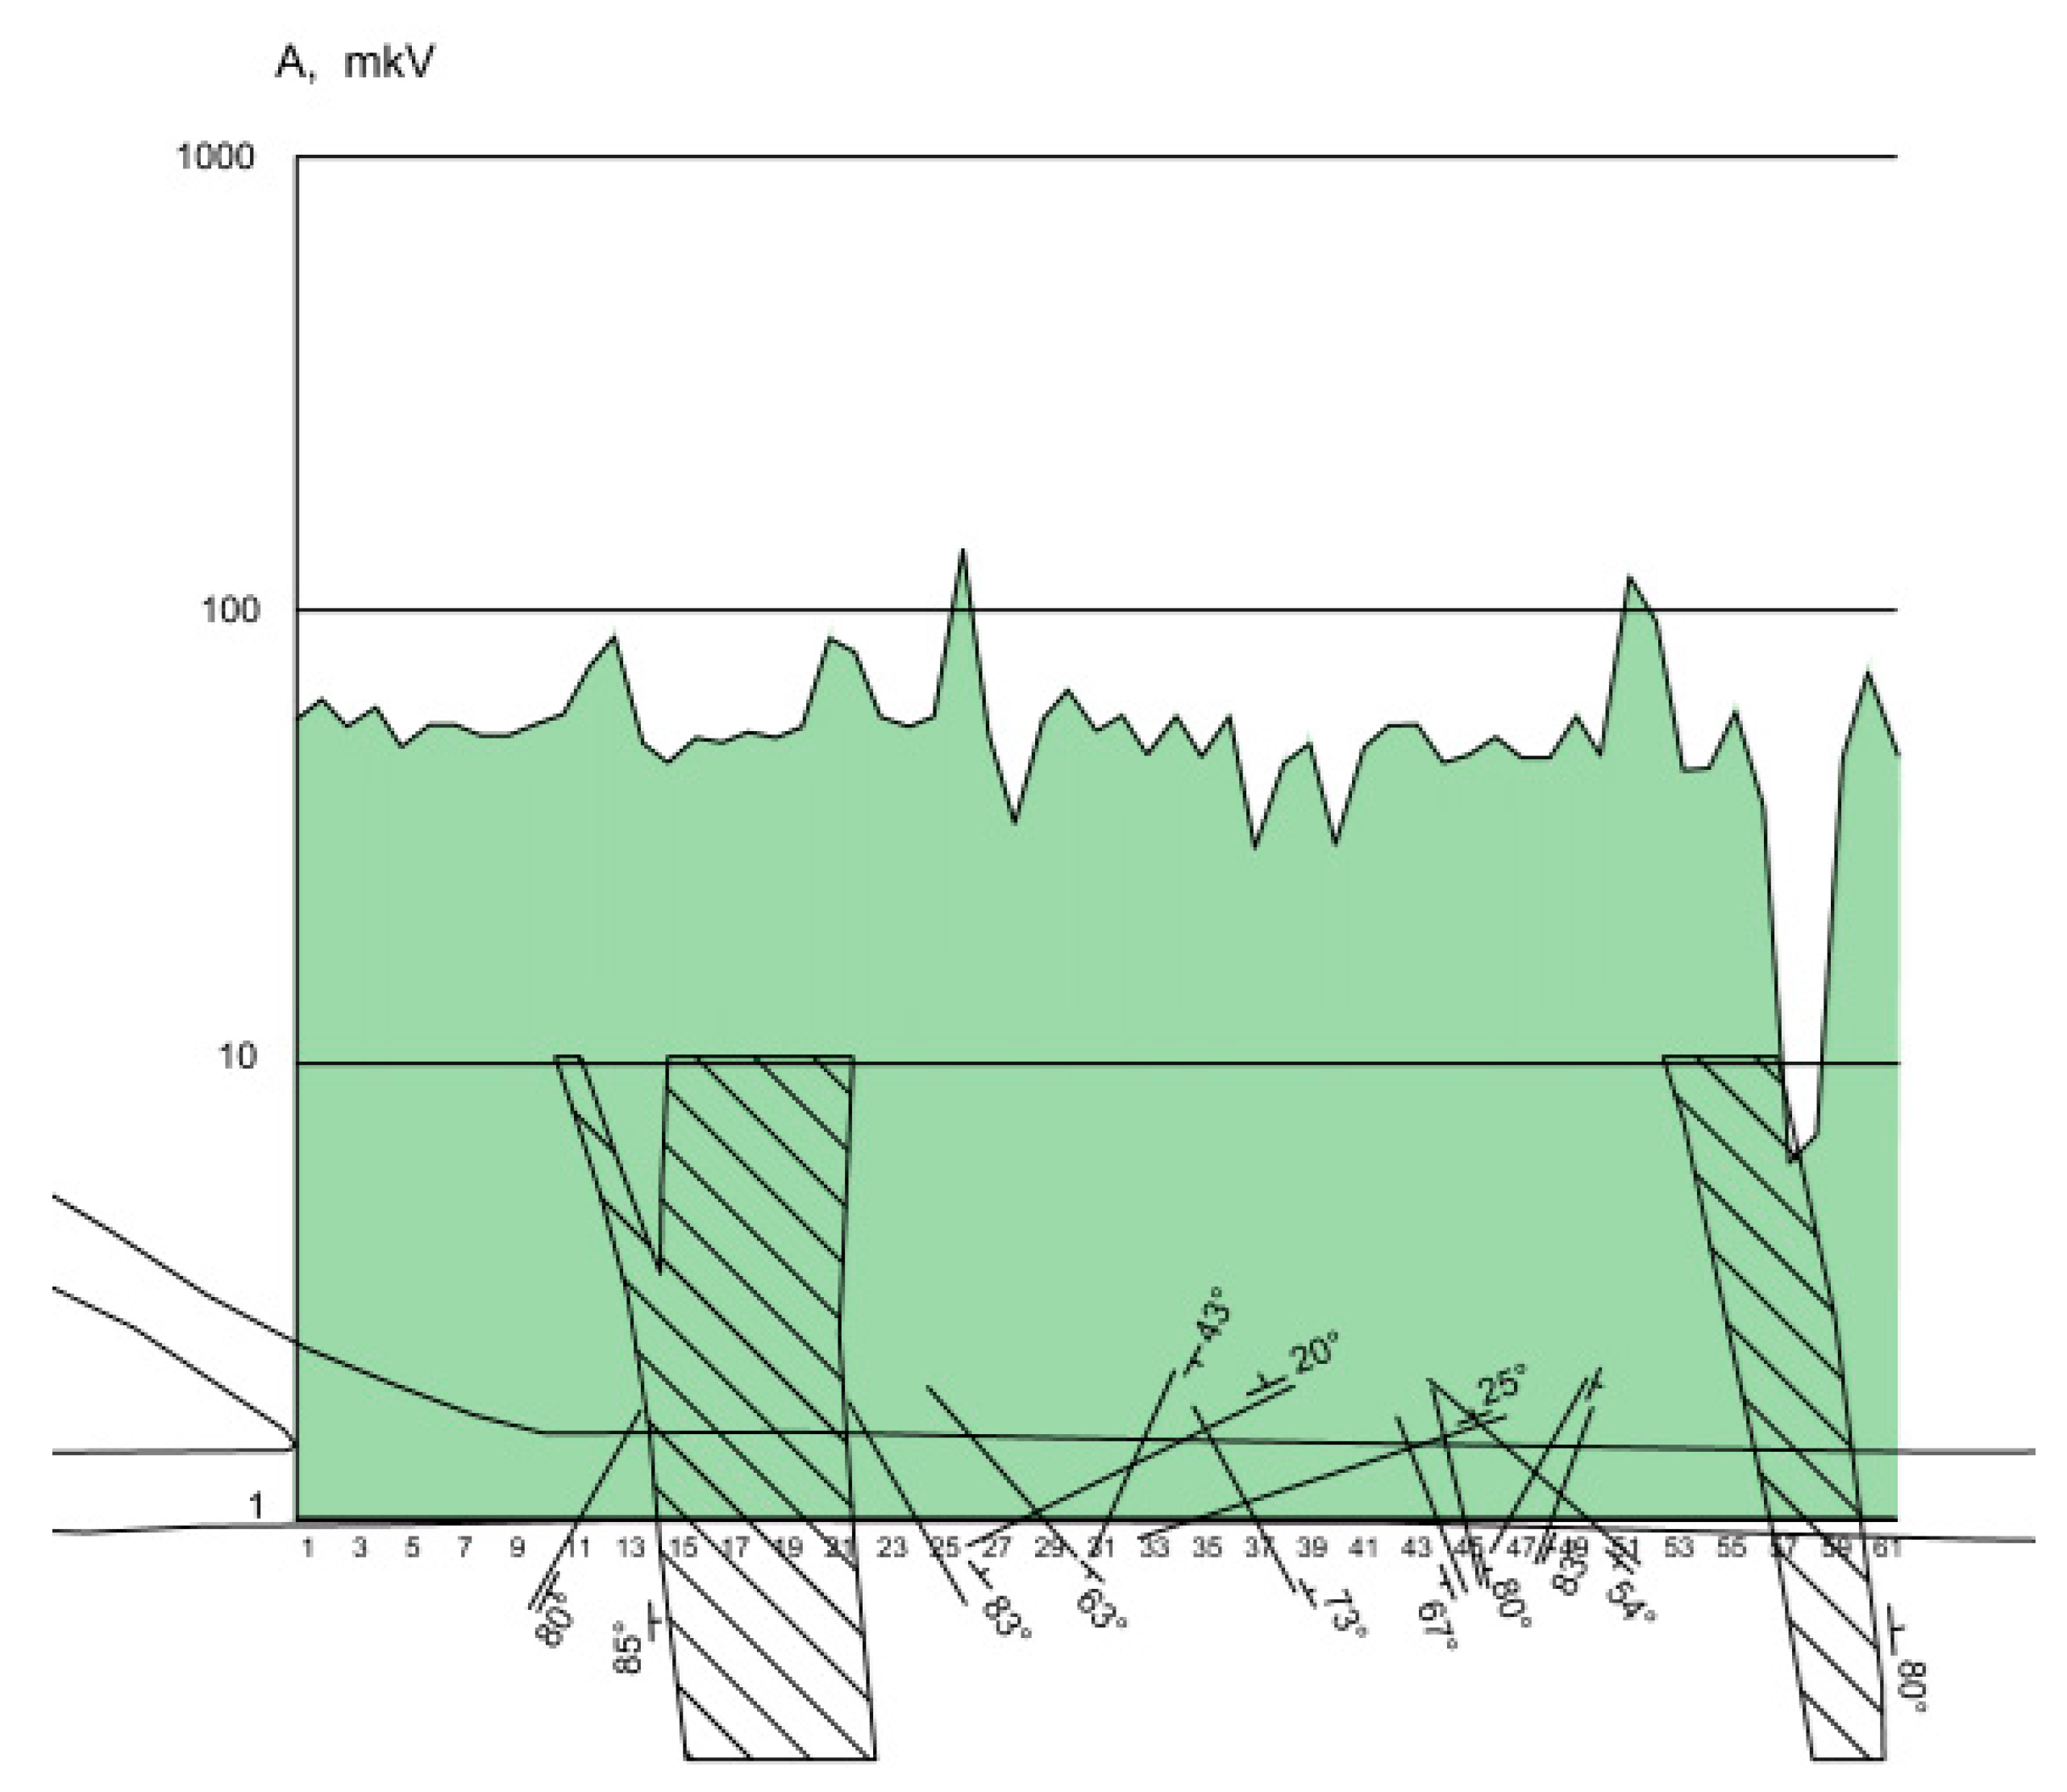
Figure 7 shows a diagram for the distribution of the averaged values of three measurements, obtained at each profile point with the antenna magnetic moment oriented downwards (Az), combined with the mining plan.
Only one boundary of the western branch of the fault (in the figure to the left) correlates with a high-contrast anomaly, while the second one is characterized by only a relatively small burst of EMP (the average value of Az at this point is 79 μV, while the mode for the entire sampling is 56—thus, this signal level is also abnormal and witnesses in favor of the activity within this zone).
The eastern branch (in the figure to the right) is clearly demonstrates EMP anomalies. The recorded signal is not uniform between the two branches. This can be due to the fact that the pulsed electromagnetic waves, generated by each fault branch, have a large reserve of energy. Since the electromagnetic wave is variable by nature, then at the peak values of the anomalies, the measurements fall within the amplitude value of the electromagnetic wave.
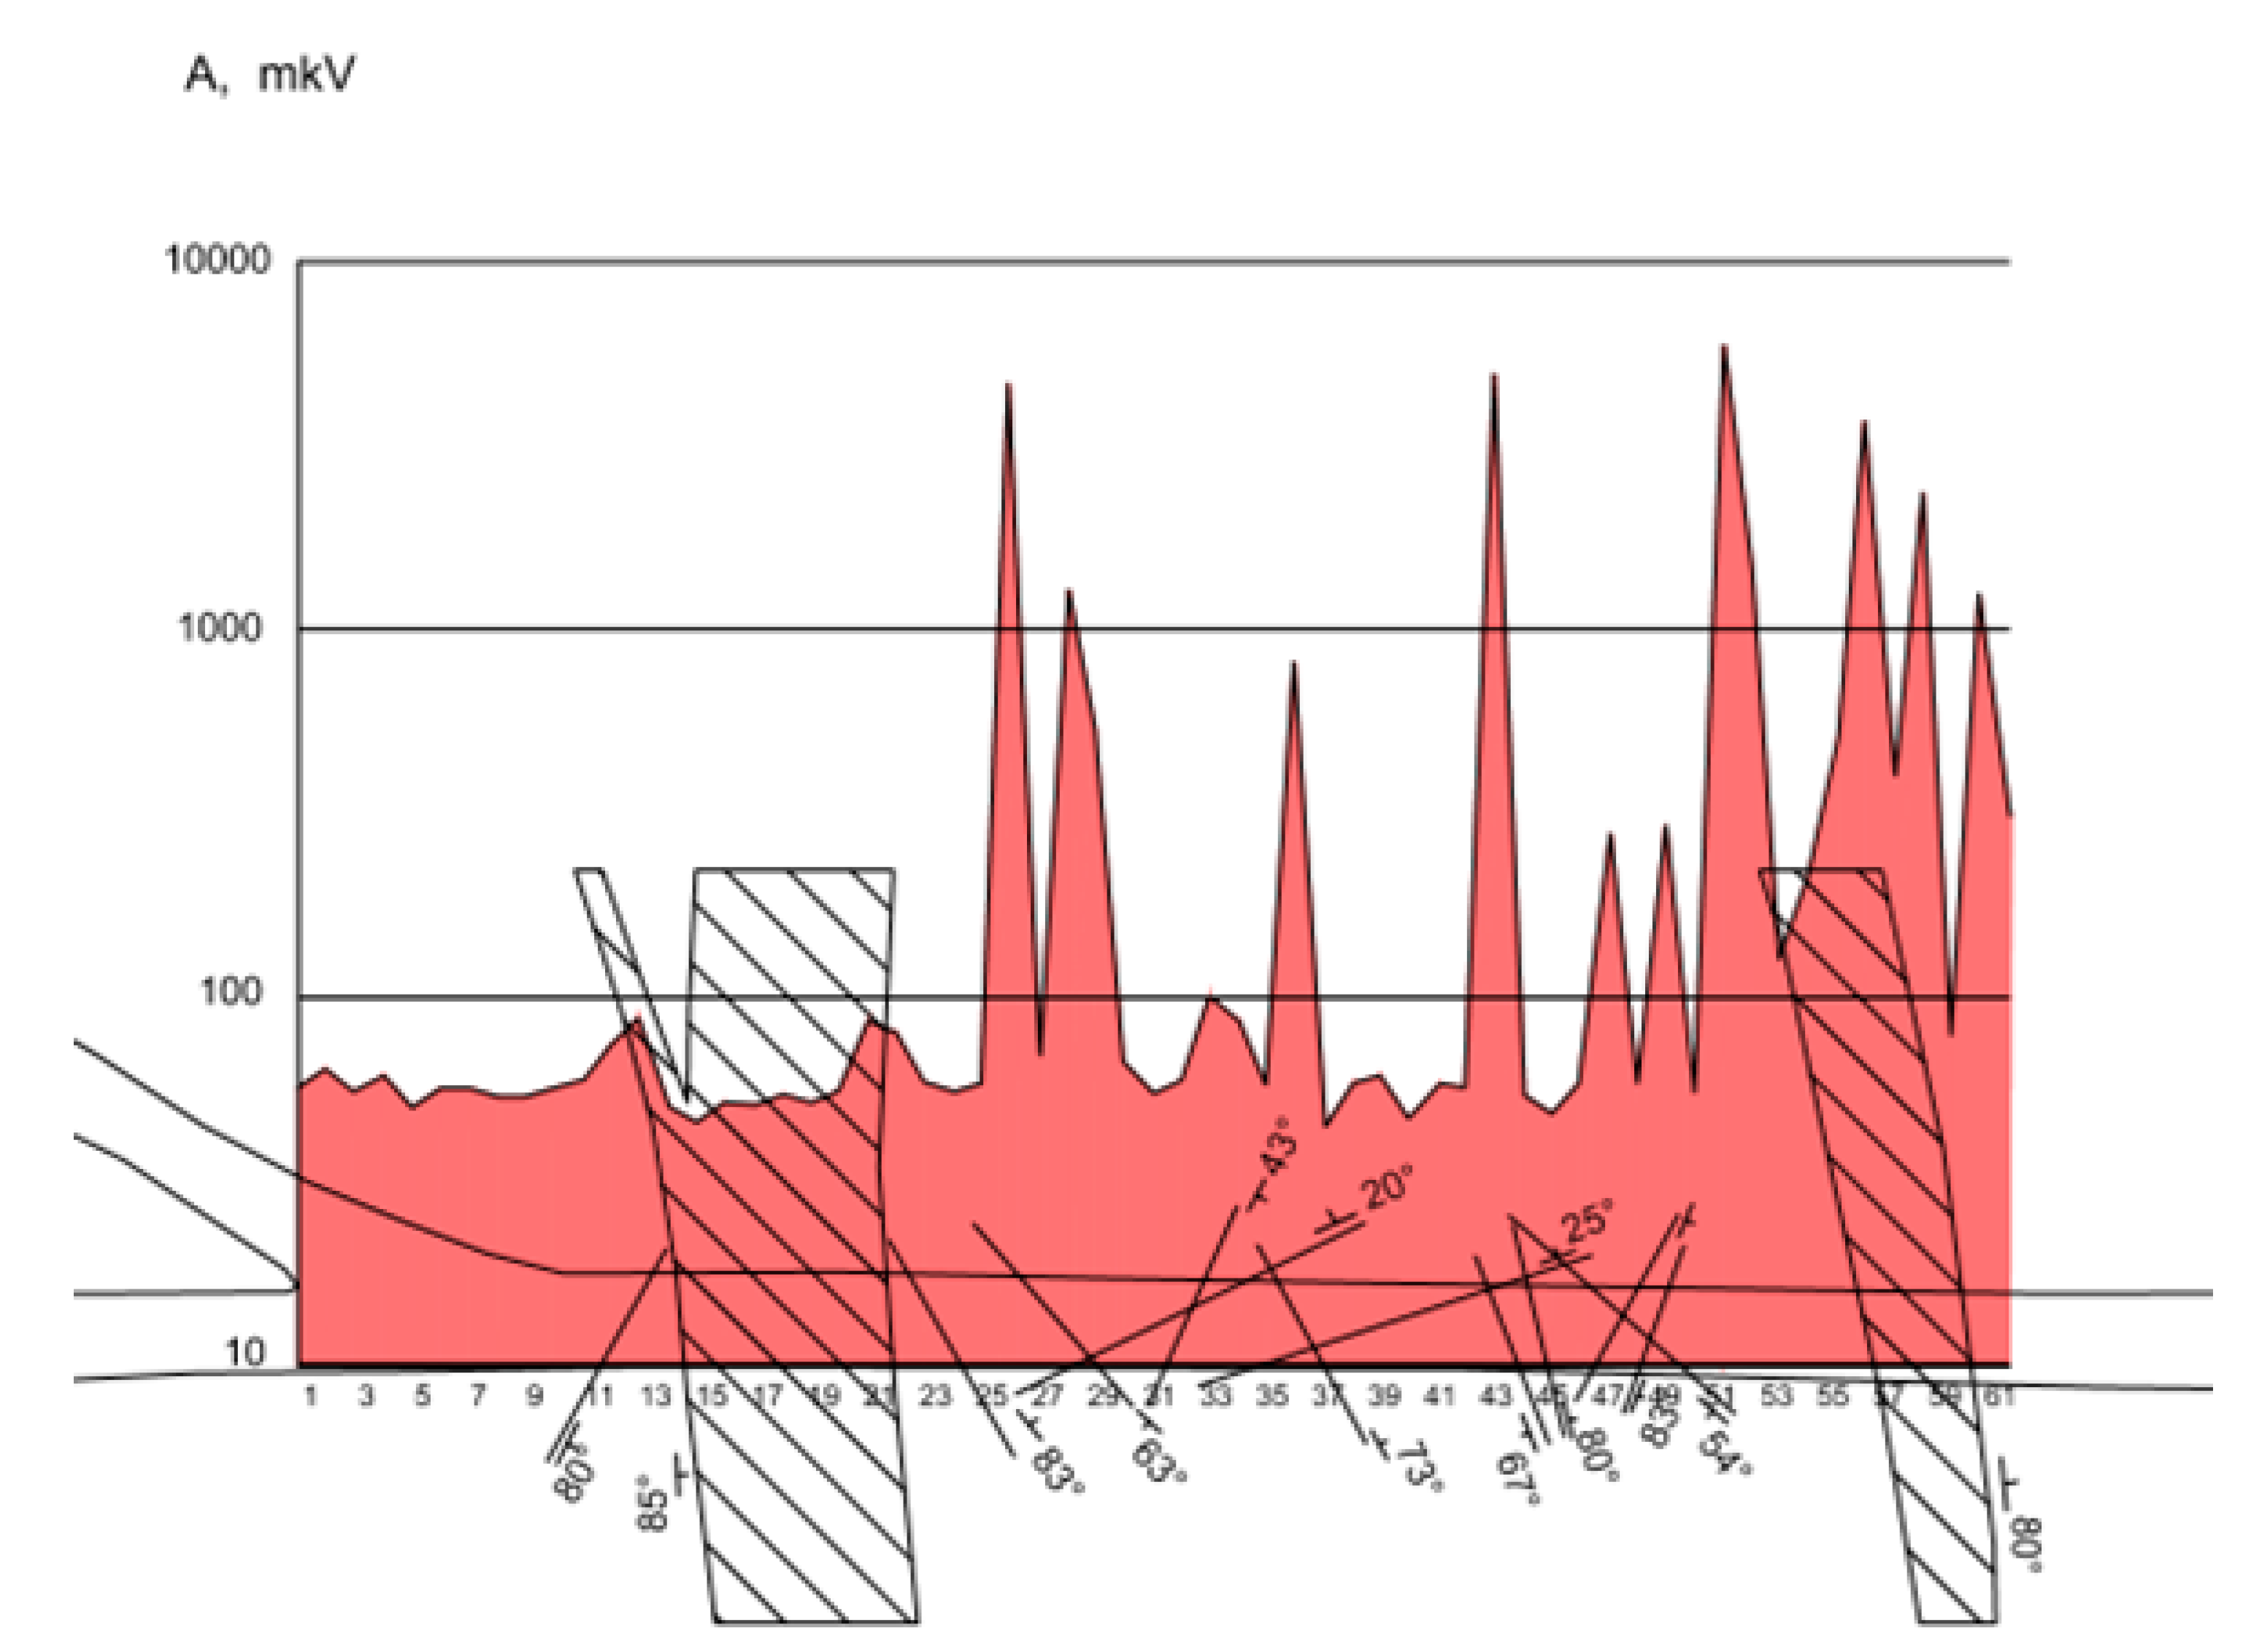
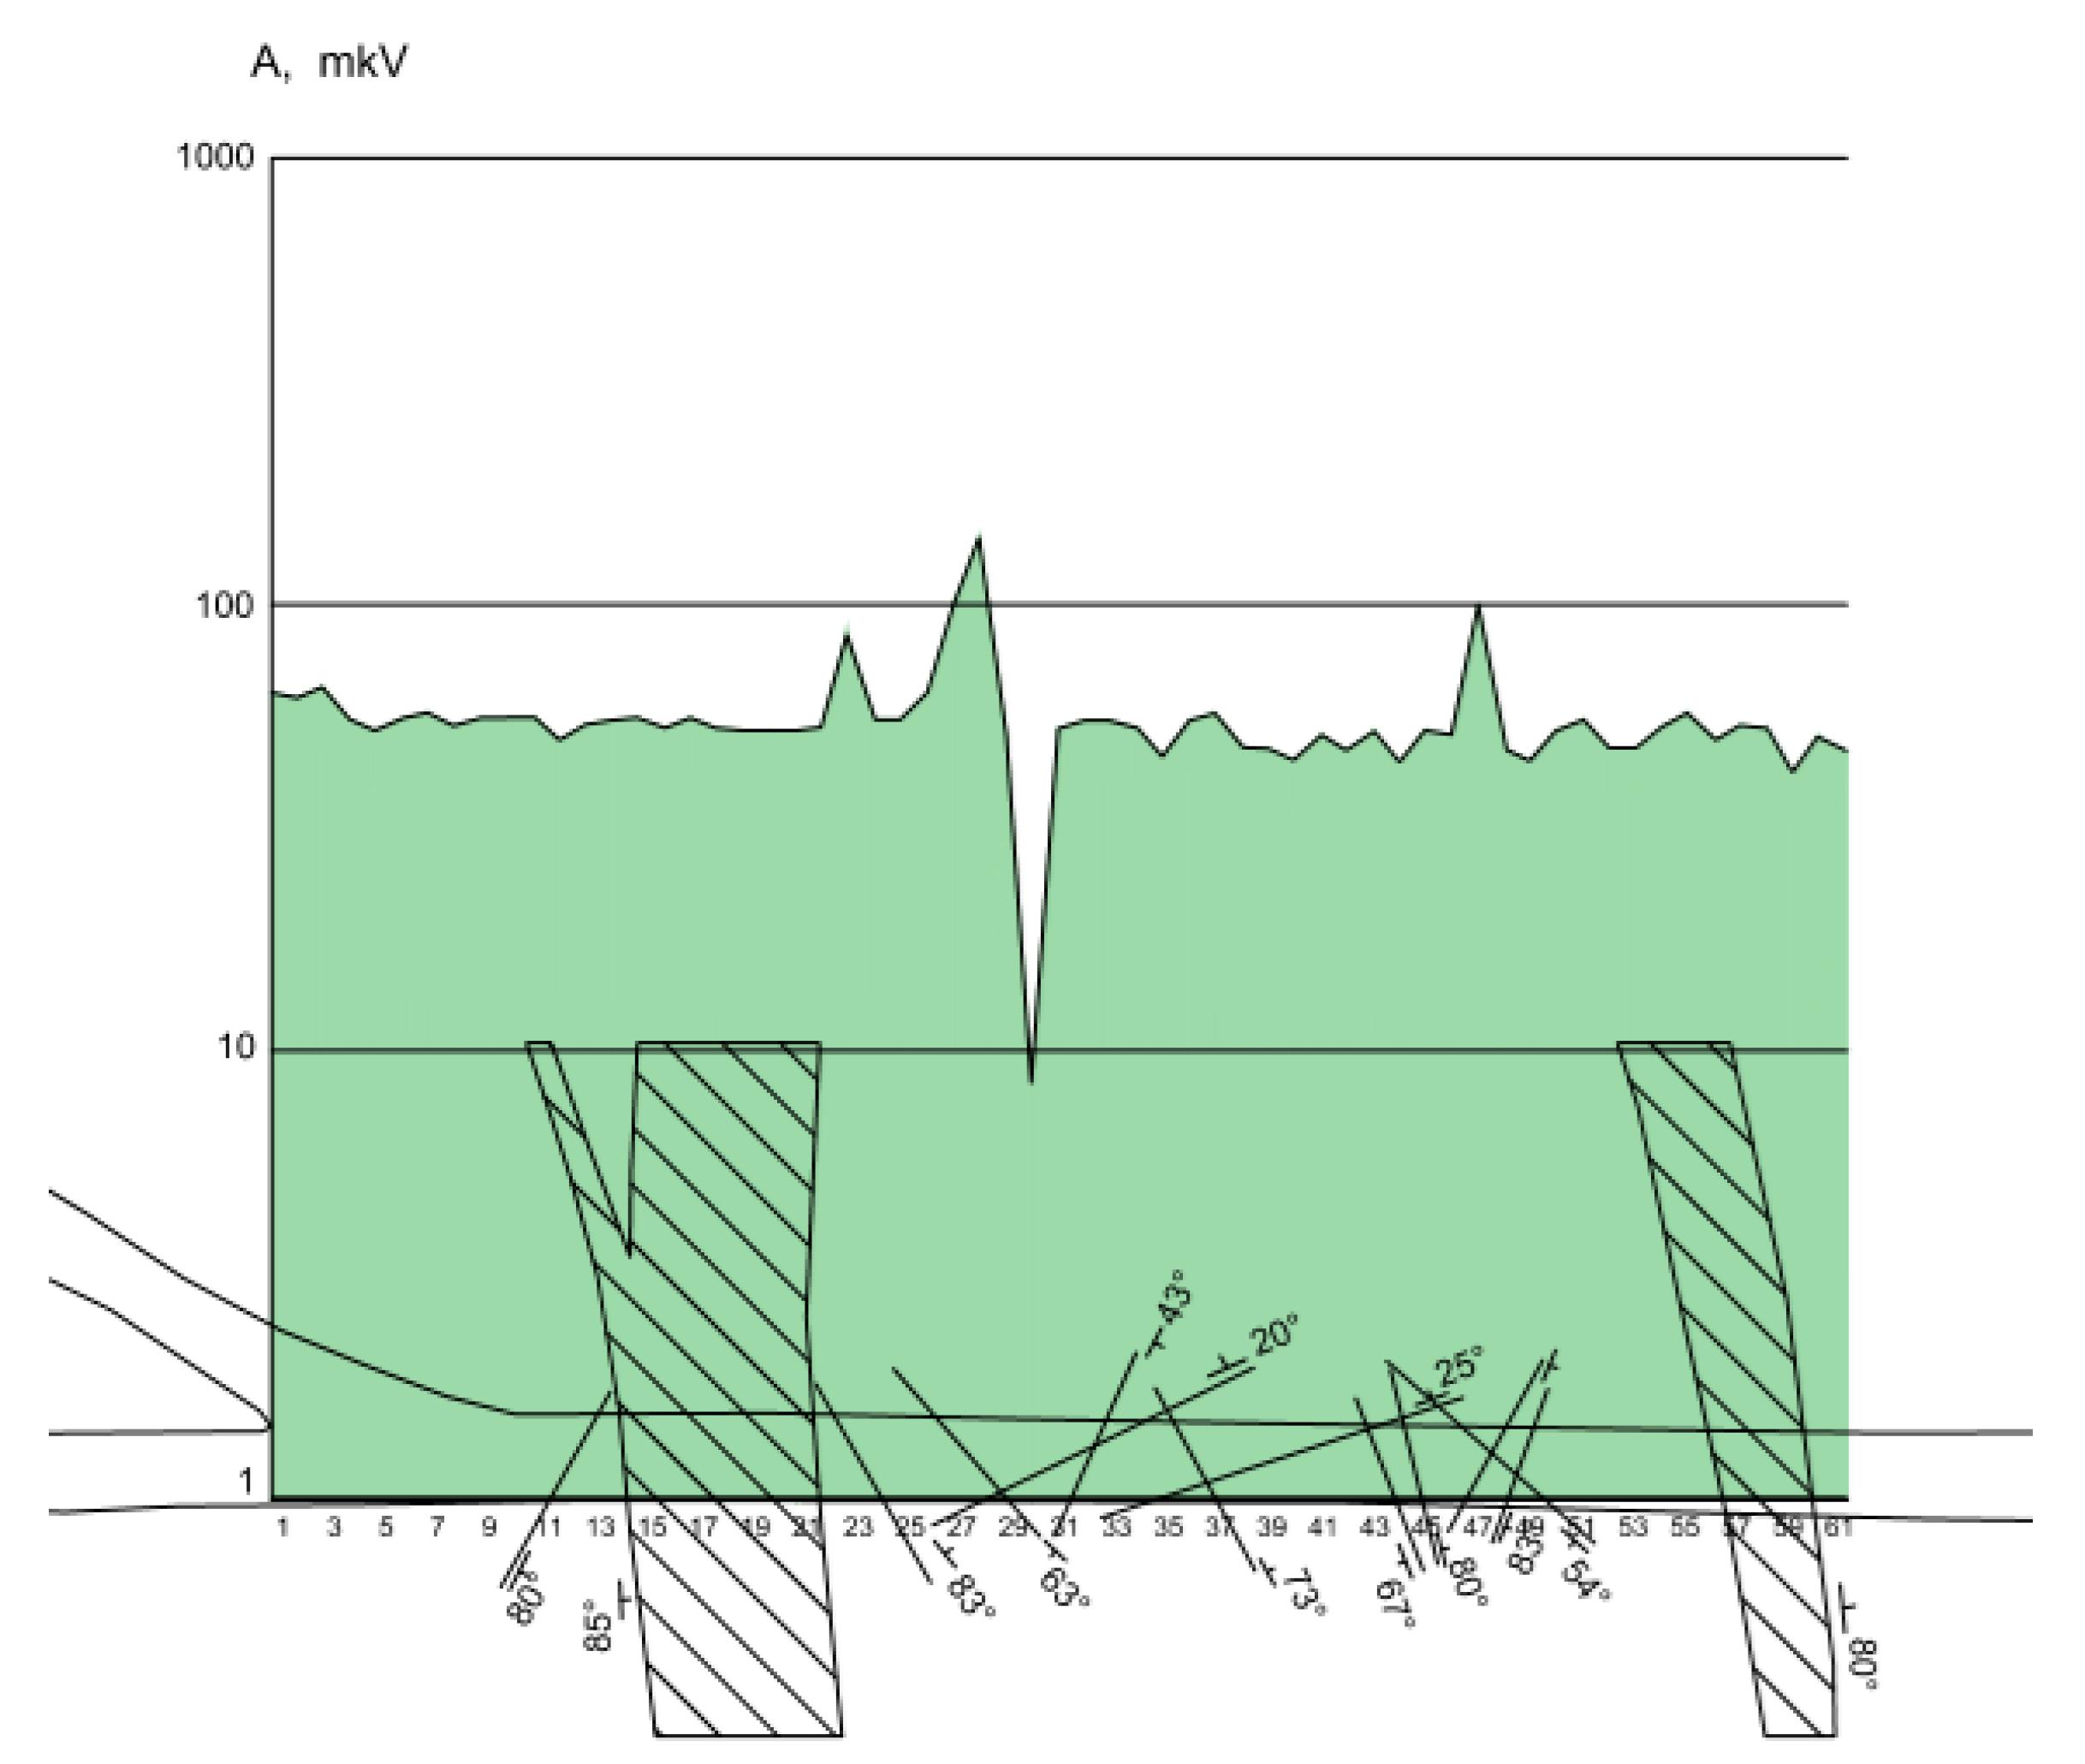
The number of anomalies recorded when the antenna magnetic moment is positioned to the left (
Figure 8) is noticeably lower than in case of the one discussed above. The eastern branch of the fault is also clearly pronounced in the diagram for the average values of Ay, as well as of Az.
For better clarity, the y-axis logarithmic format is chosen.
4. Discussion
The western branch in this diagram is also presented only comparatively in low-amplitude bursts, but these bursts were traced by measurements at two pickets on each side, wherein their level was also high enough to refer this area as tectonically active (74 and 88 μV in measurements 12 and 13, respectively; 87 and 80 μV for measurements 22 and 23, respectively).
In the diagram for the minimum values of Az (
Figure 9), there is an anomaly of the opposite sign, located at a distance of about 20 m from the western branch. Meanwhile, several values preceding this anomaly failed to reach the background.
The diagram for the minimum values of Ay (
Figure 10) also presents an anomaly of the opposite sign, pronounced to the right of the eastern branch. It seems possible to refer this phenomenon to the fact that, at this point, the background value is absorbed by the field with the opposite sign. This field is probably generated by a powerful source of man-made origin since no other geological reasons have been identified.
The values at the edges of the western branch do not reach the background level in three measurements.
The diagrams for the minimum values, presented in
Figure 9 and
Figure 10, indicate a slight, but still noticeable, difference in the level of the recorded signals around the two branches of the Sami fault; the average minimum values around the western branch (57 for the Az graph and 59 for the Ay graph) are higher than the average minimum values around the eastern branch (52 and 48, respectively). In the diagrams for the average values, it is impossible to trace this tendency due to the large number of high-contrast fluctuations.
During the measurements, the mine working soil was subjected to a high degree water-cut; intensive water inflow was observed in the edges and roof. These conditions apply to the entire profile, and it is impossible to reliably relate the nature of the signal to them. In connection therewith, the assumption of the physical origin of these variations seems to be reasonable. In particular, this difference may be caused by the higher motion speed along the western branch of the fault, recorded by experts from the KSC RAS during their studies [
41].
In addition, all the diagrams show the anomalous nature of the field at distances of approximately 20 m and 10 m from the western and eastern branches, respectively, which could be due to the overlapping of fields generated by the two faults. However, further research is needed to arrive at a final conclusion.
A more active disturbance, at the western branch of the fault in this case, also probably will not always be clearly pronounced in the diagrams of the average values, compared to the less active ones, if its capacity is greater. Obviously, it is possible to compare the activity of two disturbances, referring to the diagrams for EMP, only if they have similar parameters, including, first of all, thickness, lithology and water cut.
It seems promising to divide the studied massif into conditional areas, conduct a preliminary calculation of the capacities of these areas, and subsequently interpret the data based on a comparison between the calculated parameters and the data obtained directly from measurements in the massif.
