Assessment of Household Solid Waste Generation and Composition by Building Type in Da Nang, Vietnam
Abstract
1. Introduction
2. Materials and Methods
2.1. Study Area
2.2. Spatial Analysis of Housing and Building Structures
2.2.1. Survey on Data for Generating a Building Typology
2.2.2. Data Sources for Generating a Building Typology
2.2.3. Identification of Building Types and Numbers on City Level
2.3. Determination of Household Solid Waste Generation Patterns
3. Results
3.1. Building Stock
3.2. Waste Generation Patterns
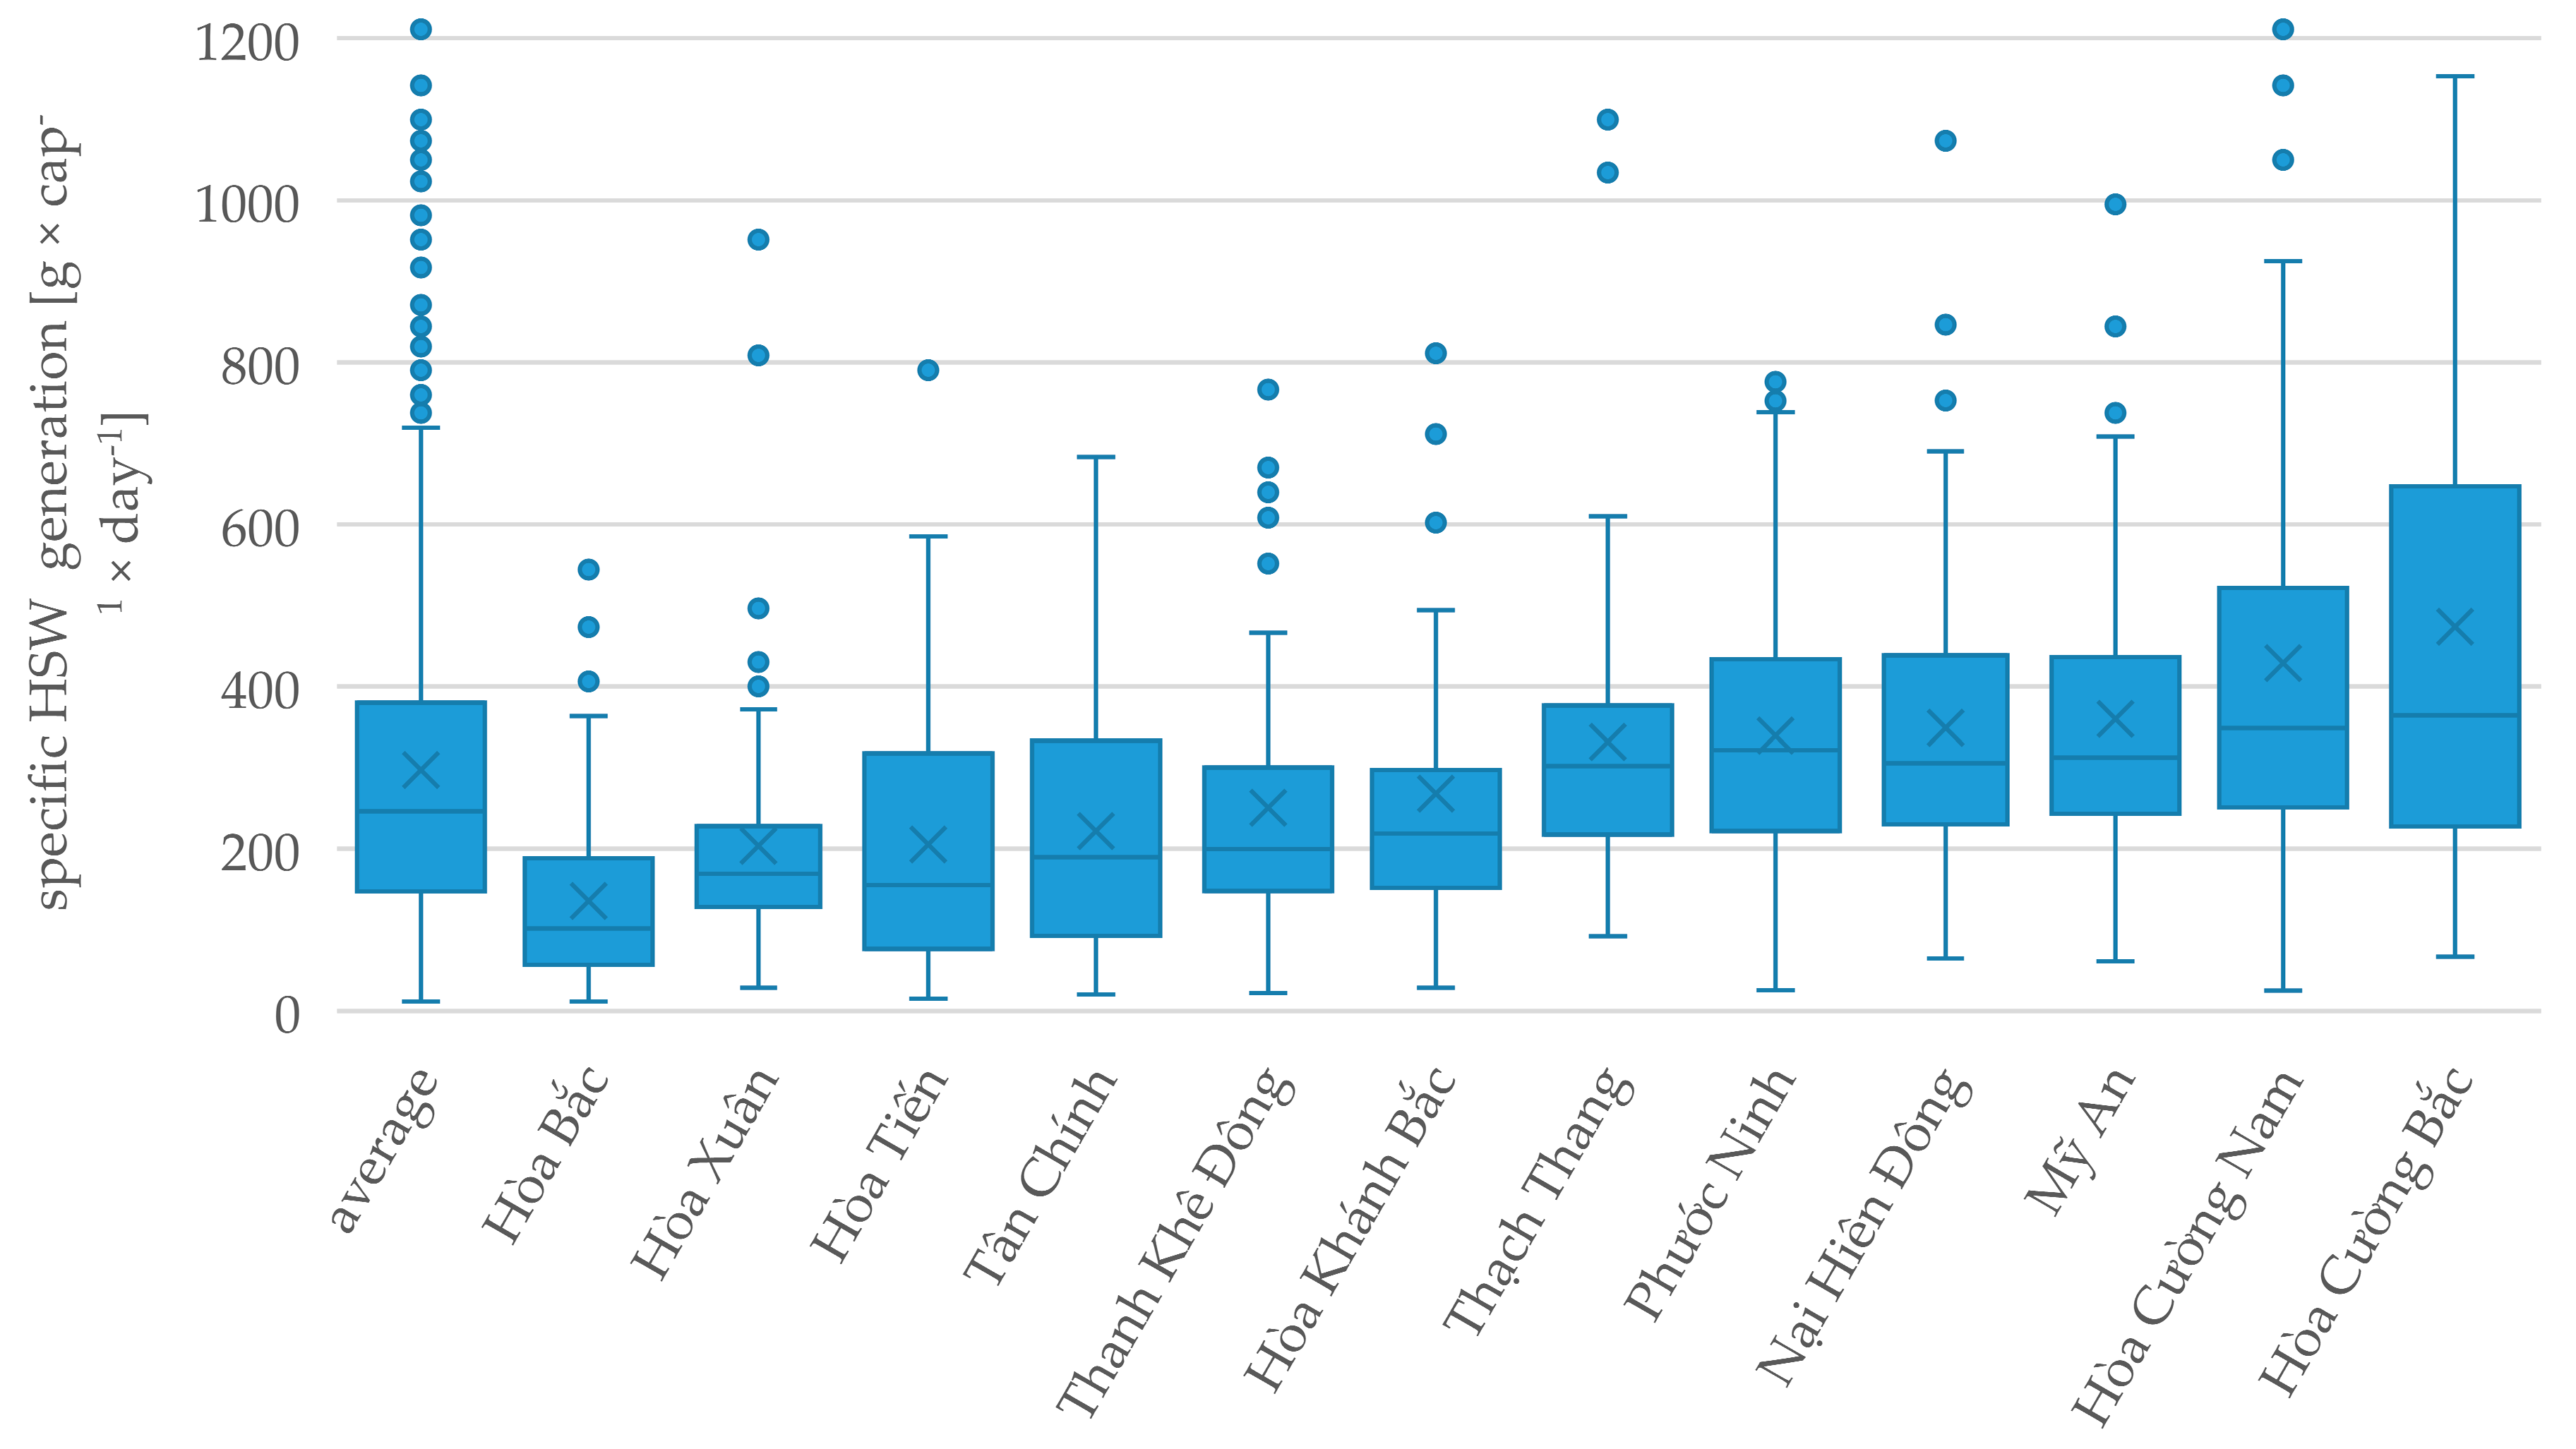
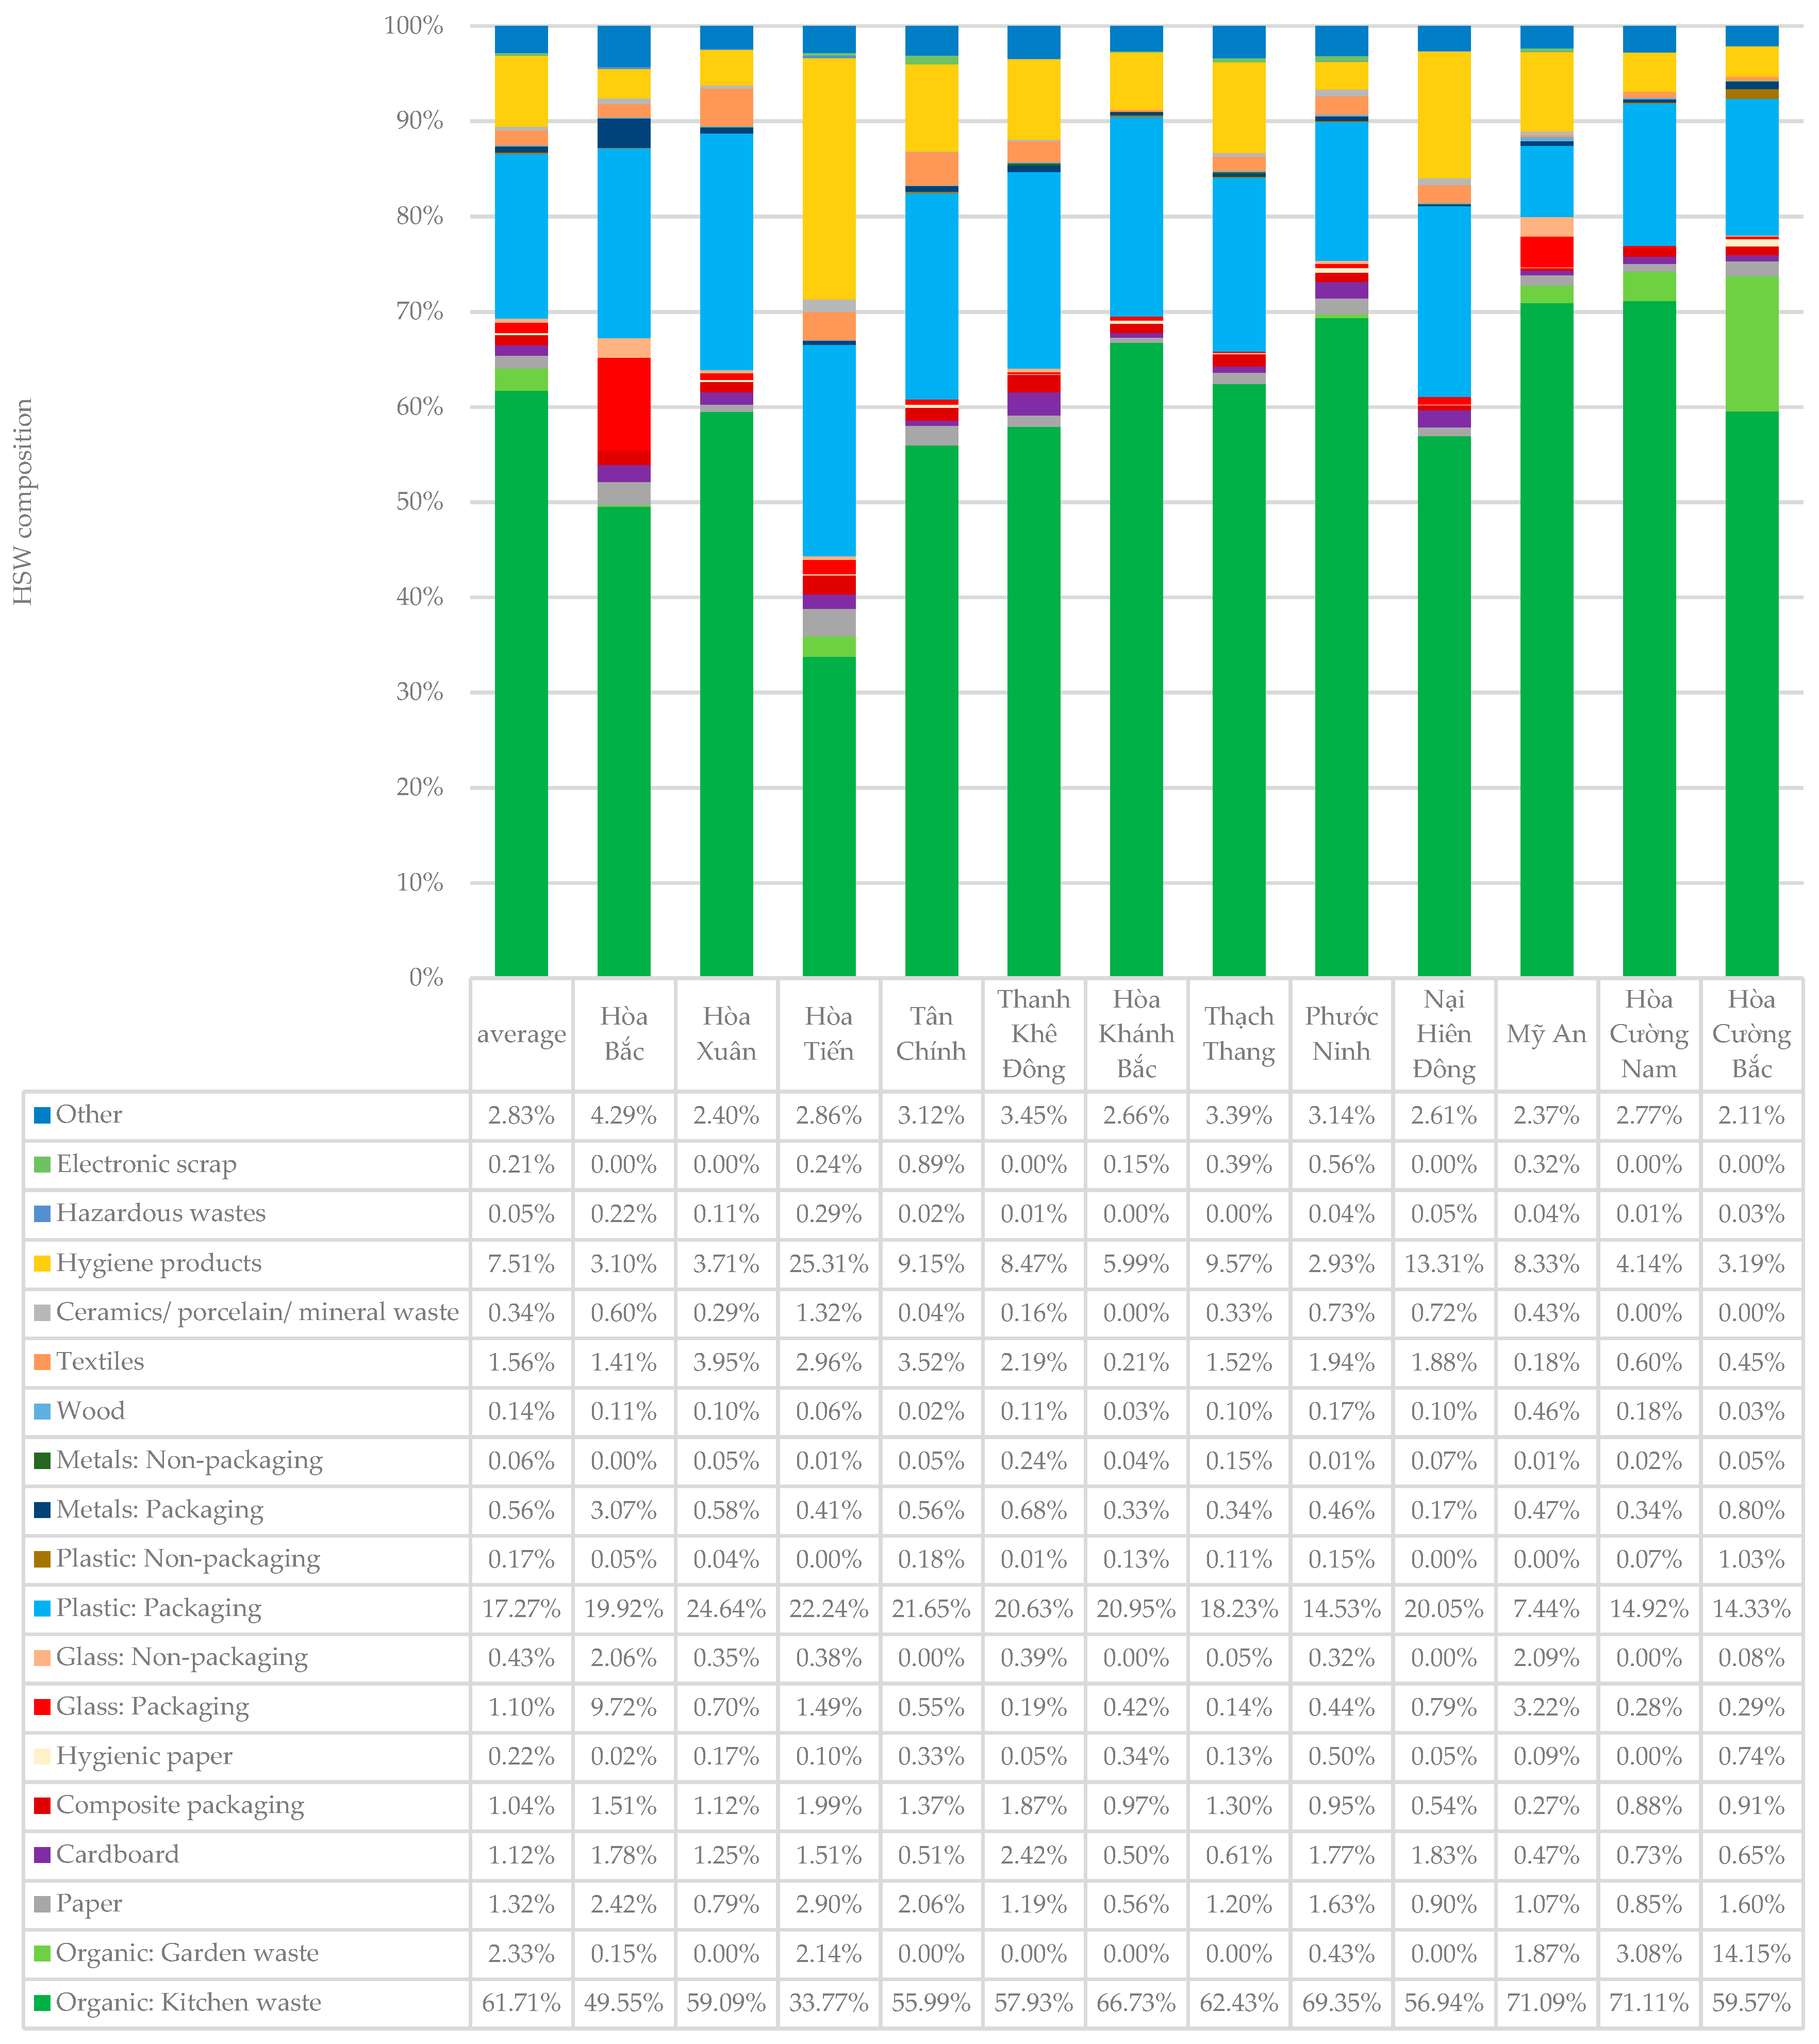
3.2.1. Generation Rate and Composition of Household Solid Waste in Wards of Da Nang
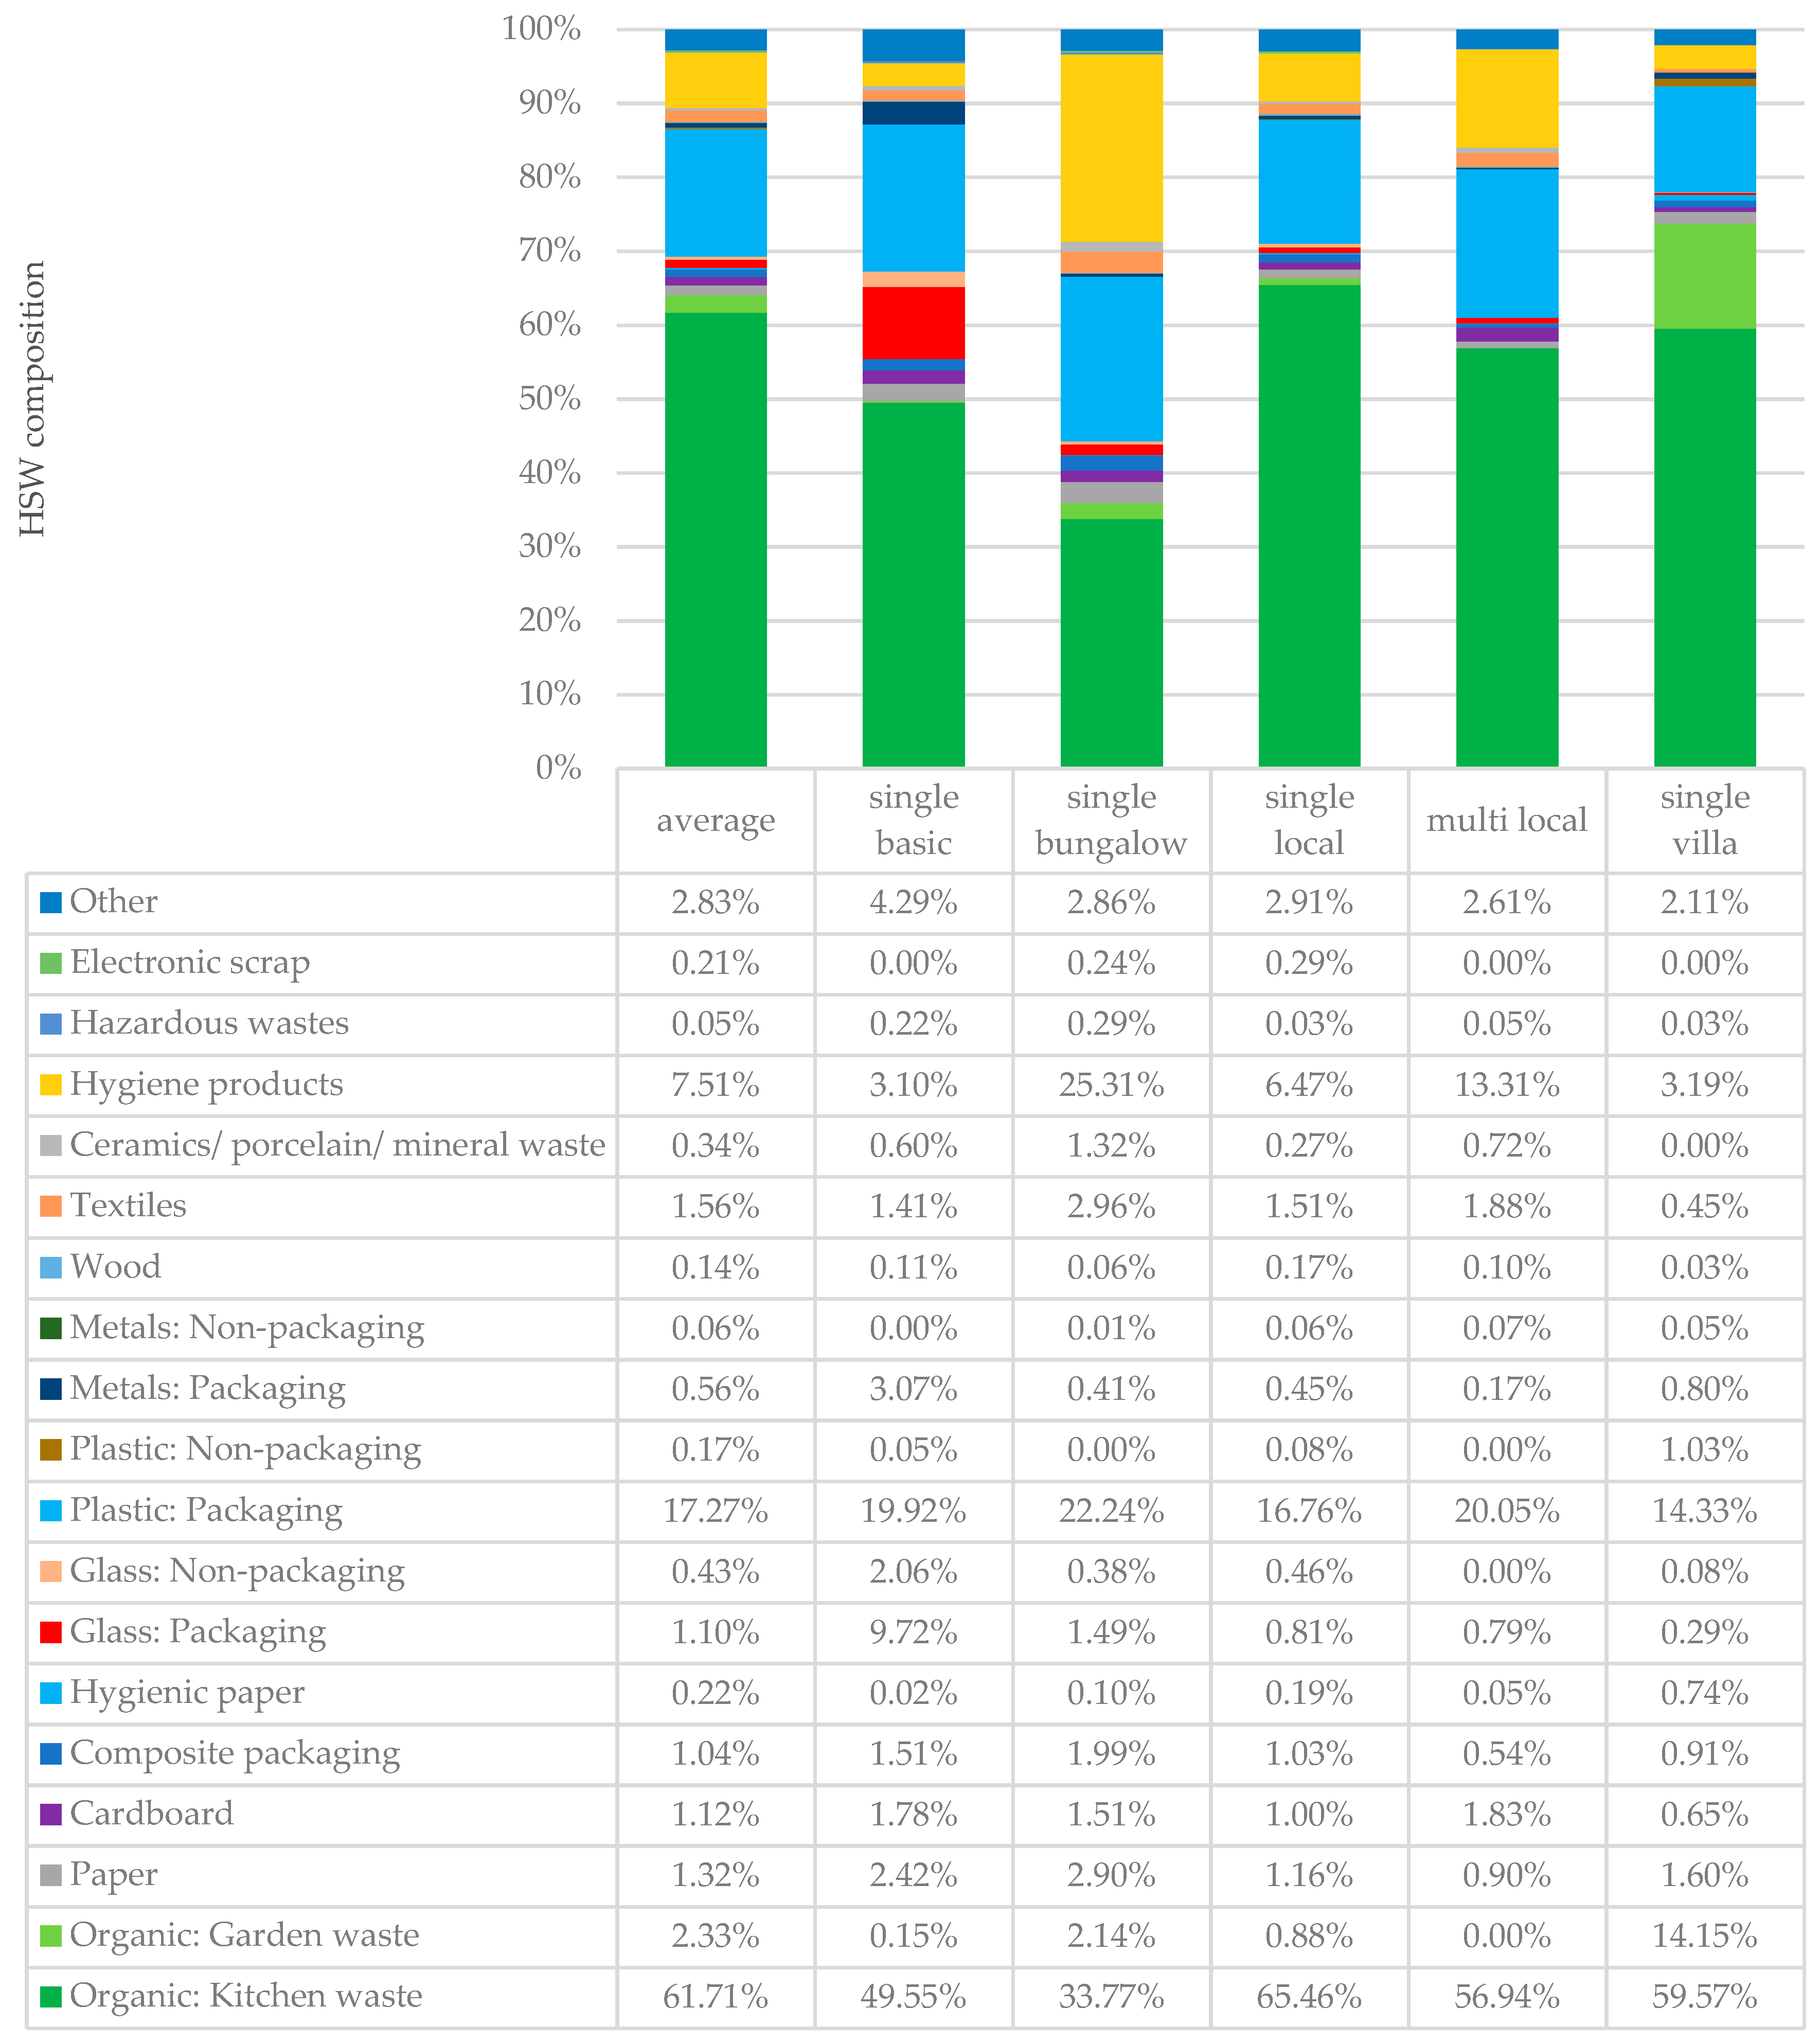
3.2.2. Solid Waste Generation and Composition Per Building Type
3.3. Extrapolation of HSW Generation for the Entire City of Da Nang
4. Discussion
5. Conclusions
Author Contributions
Funding
Acknowledgments
Conflicts of Interest
References
- United Nations. World Population Prospects: The 2017 Revision, Key Findings and Advance Tables; United Nations: New York, NY, USA, 2017. [Google Scholar]
- Gutberlet, J. Waste in the City: Challenges and Opportunities for Urban Agglomerations. In Urban Agglomeration; InTech: Rijeka, Croatia, 2018; ISBN 978-953-51-3897-6 or 978-953-51-3898-3. [Google Scholar]
- Climate Watch. Historical GHG Emissions. Global Historical Emissions; World Resources Institute: Washington, DC, USA, 2018; Available online: https://www.climatewatchdata.org (accessed on 6 September 2019).
- IPCC. Climate Change 2013—The Physical Science Basis Working Group I Contribution to the Fifth Assessment Report of the Intergovernmental Panel on Climate Change; Cambridge University Press: New York, NY, USA, 2013. [Google Scholar]
- UN-HABITAT. State of the Art of the World’s Cities 2012/2013—Prosperity of Cities; UN-Habitat: Nairobi, Kenya; Routledge: New York, NY, USA, 2012. [Google Scholar]
- Beigl, P.; Lebersorger, S.; Salhofer, S. Modelling municipal solid waste generation: A review. Waste Manag. 2008, 28, 200–214. [Google Scholar] [CrossRef] [PubMed]
- Kolekar, K.A.; Hazra, T.; Chakrabarty, S.N. A Review on Prediction of Municipal Solid Waste Generation Models. Procedia Environ. Sci. 2016, 35, 238–244. [Google Scholar] [CrossRef]
- General Statistics office of Vietnam. Preliminary Result of Vietnam Population and Housing Census 2019; General Statistics office of Vietnam: Ha Noi, Vietnam, 2019. [Google Scholar]
- CIESIN; IFPRI; World Bank; CIAT. Global Rural-Urban Mapping Project, Version 1 (GRUMPv1). Population Density Grid, 1st ed.; NASA Socioeconomic Data and Applications Center (SEDAC): Palisades, NY, USA, 2011. [Google Scholar]
- Doxsey-Whitfield, E.; MacManus, K.; Adamo, S.B.; Pistolesi, L.; Squires, J.; Borkovska, O.; Baptista, S.R. Taking Advantage of the Improved Availability of Census Data: A First Look at the Gridded Population of the World, Version 4. Pap. Appl. Geogr. 2015, 1, 226–234. [Google Scholar] [CrossRef]
- Dobson, J.E.; Bright, E.A.; Coleman, P.R.; Durfee, R.C.; Worley, B.A. LandScan: A Global Population Database for Estimating Populations at Risk. Photogramm. Eng. Remote Sens. 2000, 66, 849–857. [Google Scholar]
- Pesaresi, M.; Melchiorri, M.; Siragusa, A.; Kemper, T. Atlas of the Human Planet 2016. Mapping Human Presence on Earth with the Global Human Settlement Layer; EUR 28116 EN; Publications Office of the European Union: Luxembourg, 2016. [Google Scholar] [CrossRef]
- Freire, S.; Kemper, T.; Pesaresi, M.; Florczyk, A.; Syrris, V. Combining ghsl and gpw to improve global population mapping. In Proceedings of the 2015 IEEE International Geoscience and Remote Sensing Symposium (IGARSS), Milan, Italy, 26–31 July 2015; pp. 2541–2543. [Google Scholar]
- Lloyd, C.T.; Sorichetta, A.; Tatem, A.J. High resolution global gridded data for use in population studies. Sci. Data 2017, 4, 170001. [Google Scholar] [CrossRef]
- Tatem, A.J. WorldPop, open data for spatial demography. Sci. Data 2017, 4, 170004. [Google Scholar] [CrossRef]
- Palacios-Lopez, D.; Bachofer, F.; Esch, T.; Heldens, W.; Hirner, A.; Marconcini, M.; Sorichetta, A.; Zeidler, J.; Kuenzer, C.; Dech, S.; et al. New Perspectives for Improved Global Population Mapping arising from the World Settlement Footprint. Sustainability 2019. submitted. [Google Scholar]
- Amoah, B.; Giorgi, E.; Heyes, D.J.; van Burren, S.; Diggle, P.J. Geostatistical modelling of the association between malaria and child growth in Africa. Int. J. Health Geogr. 2018, 17, 7. [Google Scholar] [CrossRef]
- Dhewantara, P.W.; Mamun, A.A.; Zhang, W.Y.; Yin, W.W.; Ding, F.; Guo, D.; Hu, W.; Magalhaes, R.J.S. Geographical and temporal distribution of the residual clusters of human leptospirosis in China, 2005–2016. Sci. Rep. 2018, 8, 16650. [Google Scholar] [CrossRef]
- Weber, E.M.; Seaman, V.Y.; Stewart, R.N.; Bird, T.J.; Tatem, A.J.; McKee, J.J.; Bhaduri, B.L.; Moehl, J.J.; Reith, A.E. Census-independent population mapping in northern Nigeria. Remote Sens. Environ. 2018, 204, 786–798. [Google Scholar] [CrossRef]
- Barbier, E.B.; Hochard, J.P. Land degradation and poverty. Nat. Sustain. 2018, 1, 623–631. [Google Scholar] [CrossRef]
- Brown, S.; Nicholls, R.J.; Goodwin, P.; Haigh, I.D.; Lincke, D.; Vafeidis, A.T.; Hinkel, J. Quantifying Land and People Exposed to Sea-Level Rise with No Mitigation and 1.5 °C and 2.0 °C Rise in Global Temperatures to Year 2300. Earth’s Future 2018, 6, 583–600. [Google Scholar] [CrossRef]
- Aubrecht, C.; Özceylan, D.; Steinnocher, K.; Freire, S. Multi-level geospatial modeling of human exposure patterns and vulnerability indicators. Nat. Hazards 2012, 68, 147–163. [Google Scholar] [CrossRef]
- Tiecke, T.G.; Liu, X.; Zhang, A.; Gros, A.; Li, N.; Yetman, G.; Kilic, T.; Murray, S.; Blankespoor, B.; Prydz, E.B.; et al. Mapping the world population one building at a time. arXiv 2017, arXiv:1712.05839, 1–15. [Google Scholar]
- Grippa, T.; Linard, C.; Lennert, M.; Georganos, S.; Mboga, N.; Vanhuysse, S.; Gadiaga, A.; Wolff, E. Improving Urban Population Distribution Models with Very-High Resolution Satellite Information. Data 2019, 4, 13. [Google Scholar] [CrossRef]
- Mossoux, S.; Kervyn, M.; Soulé, H.; Canters, F. Mapping Population Distribution from High Resolution Remotely Sensed Imagery in a Data Poor Setting. Remote Sens. 2018, 10, 1409. [Google Scholar] [CrossRef]
- Mahabir, R.; Croitoru, A.; Crooks, A.; Agouris, P.; Stefanidis, A. A Critical Review of High and Very High-Resolution Remote Sensing Approaches for Detecting and Mapping Slums: Trends, Challenges and Emerging Opportunities. Urban Sci. 2018, 2, 8. [Google Scholar] [CrossRef]
- Lung, T.; Lübker, T.; Ngochoch, J.K.; Schaab, G. Human population distribution modelling at regional level using very high resolution satellite imagery. Appl. Geogr. 2013, 41, 36–45. [Google Scholar] [CrossRef]
- Wang, S.; Tian, Y.; Zhou, Y.; Liu, W.; Lin, C. Fine-Scale Population Estimation by 3D Reconstruction of Urban Residential Buildings. Sensors 2016, 16, 1755. [Google Scholar] [CrossRef]
- Steinnocher, K.; de Bono, A.; Chatenoux, B.; Tiede, D.; Wendt, L. Estimating urban population patterns from stereo-satellite imagery. Eur. J. Remote Sens. 2019, 52, 12–25. [Google Scholar] [CrossRef]
- Tomás, L.; Fonseca, L.; Almeida, C.; Leonardi, F.; Pereira, M. Urban population estimation based on residential buildings volume using IKONOS-2 images and lidar data. Int. J. Remote Sens. 2015, 37, 1–28. [Google Scholar] [CrossRef]
- Xie, J.; Zhou, J. Classification of Urban Building Type from High Spatial Resolution Remote Sensing Imagery Using Extended MRS and Soft BP Network. IEEE J. Sel. Top. Appl. Earth Obs. Remote Sens. 2017, 10, 3515–3528. [Google Scholar] [CrossRef]
- Bachofer, F.; Braun, A.; Adamietz, F.; Murray, S.; d’Angelo, P.; Kyazze, E.; Mumuhire, A.P.; Bower, J. Building Stock and Building Typology of Kigali, Rwanda. Data 2019, 4, 105. [Google Scholar] [CrossRef]
- Talent, M. Improving estimates of occupancy rate and population density in different dwelling types. Environ. Plan. B Urban Anal. City Sci. 2017, 44, 802–818. [Google Scholar] [CrossRef]
- Geiß, C.; Aravena Pelizari, P.; Marconcini, M.; Sengara, W.; Edwards, M.; Lakes, T.; Taubenböck, H. Estimation of seismic building structural types using multi-sensor remote sensing and machine learning techniques. ISPRS J. Photogramm. Remote Sens. 2015, 104, 175–188. [Google Scholar] [CrossRef]
- Tusting, L.S.; Bisanzio, D.; Alabaster, G.; Cameron, E.; Cibulskis, R.; Davies, M.; Flaxman, S.; Gibson, H.S.; Knudsen, J.; Mbogo, C.; et al. Mapping changes in housing in sub-Saharan Africa from 2000 to 2015. Nature 2019, 568, 391–394. [Google Scholar] [CrossRef]
- Jones, R.V.; Lomas, K.J. Determinants of high electrical energy demand in UK homes: Socio-economic and dwelling characteristics. Energy Build. 2015, 101, 24–34. [Google Scholar] [CrossRef]
- Singh, A. Remote sensing and GIS applications for municipal waste management. J. Environ. Manag. 2019, 243, 22–29. [Google Scholar] [CrossRef]
- Anilkumar, P.P.; Chithra, K. Land Use Based Modelling of Solid Waste Generation for Sustainable Residential Development in Small/Medium Scale Urban Areas. Procedia Environ. Sci. 2016, 35, 229–237. [Google Scholar] [CrossRef]
- Xiao, L.; Lin, T.; Chen, S.; Zhang, G.; Ye, Z.; Yu, Z. Characterizing Urban Household Waste Generation and Metabolism Considering Community Stratification in a Rapid Urbanizing Area of China. PLoS ONE 2015, 10, e0145405. [Google Scholar] [CrossRef]
- Vieira, V.; Matheus, D.R. The impact of socioeconomic factors on municipal solid waste generation in Sao Paulo, Brazil. Waste Manag. Res. 2018, 36, 79–85. [Google Scholar] [CrossRef] [PubMed]
- Zia, A.; Batool, S.; Chauhdry, M.; Munir, S. Influence of Income Level and Seasons on Quantity and Composition of Municipal Solid Waste: A Case Study of the Capital City of Pakistan. Sustainability 2017, 9, 1568. [Google Scholar] [CrossRef]
- Jadoon, A.; Batool, S.A.; Chaudhry, M.N. Assessment of factors affecting household solid waste generation and its composition in Gulberg Town, Lahore, Pakistan. J. Mater. Cycles Waste Manag. 2014, 16, 73–81. [Google Scholar] [CrossRef]
- Trang, P.T.T.; Dong, H.Q.; Toan, D.Q.; Hanh, N.T.X.; Thu, N.T. The Effects of Socio-economic Factors on Household Solid Waste Generation and Composition: A Case Study in Thu Dau Mot, Vietnam. Energy Procedia 2017, 107, 253–258. [Google Scholar] [CrossRef]
- General Statistics office of Vietnam. Statistical Yearbook of Vietnam 2018; General Statistics office of Viet Nam: Ha Noi, Vietnam, 2018. [Google Scholar]
- World Bank. Vietnam Urbanization Review; Technical Assistance Report; The World Bank in Vietnam: Hanoi, Vietnam, 2011. [Google Scholar]
- Dong, N.; Da Nang Residents Block Garbage Dump to Demand Its Relocation. VNExpress International 8 July 2019. Available online: https://e.vnexpress.net/news/news/da-nang-residents-block-garbage-dump-to-demand-its-relocation-3949341.html (accessed on 9 September 2019).
- Department of Natural Resources and Environment. Report on 10 Years Implementation of “Developing Da Nang—An Environmental City”; Department of Natural Resources and Environment: Da Nang, Vietnam, 2019. [Google Scholar]
- Da Nang People’s Committee. Solid Wastes Treatment Planning for Da Nang to 2030, Vision to 2050; Da Nang People’s Committee: Da Nang, Vietnam, 2016. [Google Scholar]
- Brunette, W.; Sundt, M.; Dell, N.; Chaudhri, R.; Breit, N.; Borriello, G. Open Data Kit 2.0: Expanding and refining information services for developing region. In Proceedings of the 14th Workshop on Mobile Computing Systems and Applications, Jekyll Island, GA, USA, 26–27 February 2013; p. 10. [Google Scholar]
- Weichelt, H.; Rosso, P.; Marx, A.; Reigber, S.; Douglass, K.; Heynen, M. White Paper: The RapidEye Red Edge Band 2014; Blackbridge: Berlin, Germany, 2014. [Google Scholar]
- Da Nang People’s Committee. Adjustment of Master Plan for Development of Da Nang City to 2030, Vision to 2050; Da Nang People’s Committee: Da Nang, Vietnam, 2012. [Google Scholar]
- Warth, G.; Braun, A.; Bödinger, C.; Hochschild, V.; Bachofer, F. DSM-based identification of changes in highly dynamic urban agglomerations. Eur. J. Remote Sens. 2019, 52, 322–334. [Google Scholar] [CrossRef]
- Brassel, K.E.; Reif, D. A procedure to generate Thiessen polygons. Geogr. Anal. 1979, 11, 289–303. [Google Scholar] [CrossRef]
- Israel, G.D. Determing Sample Size: Fact Sheet PEOD-6; University of Florida: Gainesville, FL, USA, 1992. [Google Scholar]
- Thai, N.T.K. Municipal Solid Waste Management in Vietnam Challenges and Solutions. In Municipal Solid Waste Management in Asia and the Pacific Islands: Challenges and Strategic Solutions; Pariatamby, A., Tanaka, M., Eds.; Springer: Singapore, 2014; ISBN 978-981-4451-72-7. [Google Scholar]
- Otoma, S.; Hoang, H.; Hong, H.; Miyazaki, I.; Diaz, R. A survey on municipal solid waste and residents’ awareness in Da Nang city, Vietnam. J. Mater. Cycles Waste Manag. 2013, 15, 187–194. [Google Scholar] [CrossRef]
- Thanh, N.P.; Matsui, Y.; Fujiwara, T. Household solid waste generation and characteristic in a Mekong Delta city, Vietnam. J. Environ. Manag. 2010, 91, 2307–2321. [Google Scholar] [CrossRef]
- Ferraro, A.; Massini, G.; Mazzurco Miritana, V.; Signorini, A.; Race, M.; Fabbricino, M. A simplified model to simulate bioaugmented anaerobic digestion of lignocellulosic biomass: Biogas production efficiency related to microbiological data. Sci. Total Environ. 2019, 691, 885–895. [Google Scholar] [CrossRef]
- Kuo, J.; Dow, J. Biogas production from anaerobic digestion of food waste and relevant air quality implications. J. Air Waste Manag. Assoc. 2017, 67, 1000–1011. [Google Scholar] [CrossRef]
- Uçkun Kiran, E.; Trzcinski, A.P.; Ng, W.J.; Liu, Y. Bioconversion of food waste to energy: A review. Fuel 2014, 134, 389–399. [Google Scholar] [CrossRef]
- Downes, N.K.; Storch, H.; Schmidt, M.; Van Nguyen, T.C.; Tran, T.N. Understanding Ho Chi Minh City’s urban structures for urban land-use monitoring and risk-adapted land-use planning. In Sustainable Ho Chi Minh City: Climate Policies for Emerging Mega Cities; Springer International Publishing AG: Cham, Switzerland, 2016; pp. 89–116. [Google Scholar]
- Schneider, P.; Anh, L.; Wagner, J.; Reichenbach, J.; Hebner, A. Solid Waste Management in Ho Chi Minh City, Vietnam: Moving towards a Circular Economy? Sustainability 2017, 9, 286. [Google Scholar] [CrossRef]
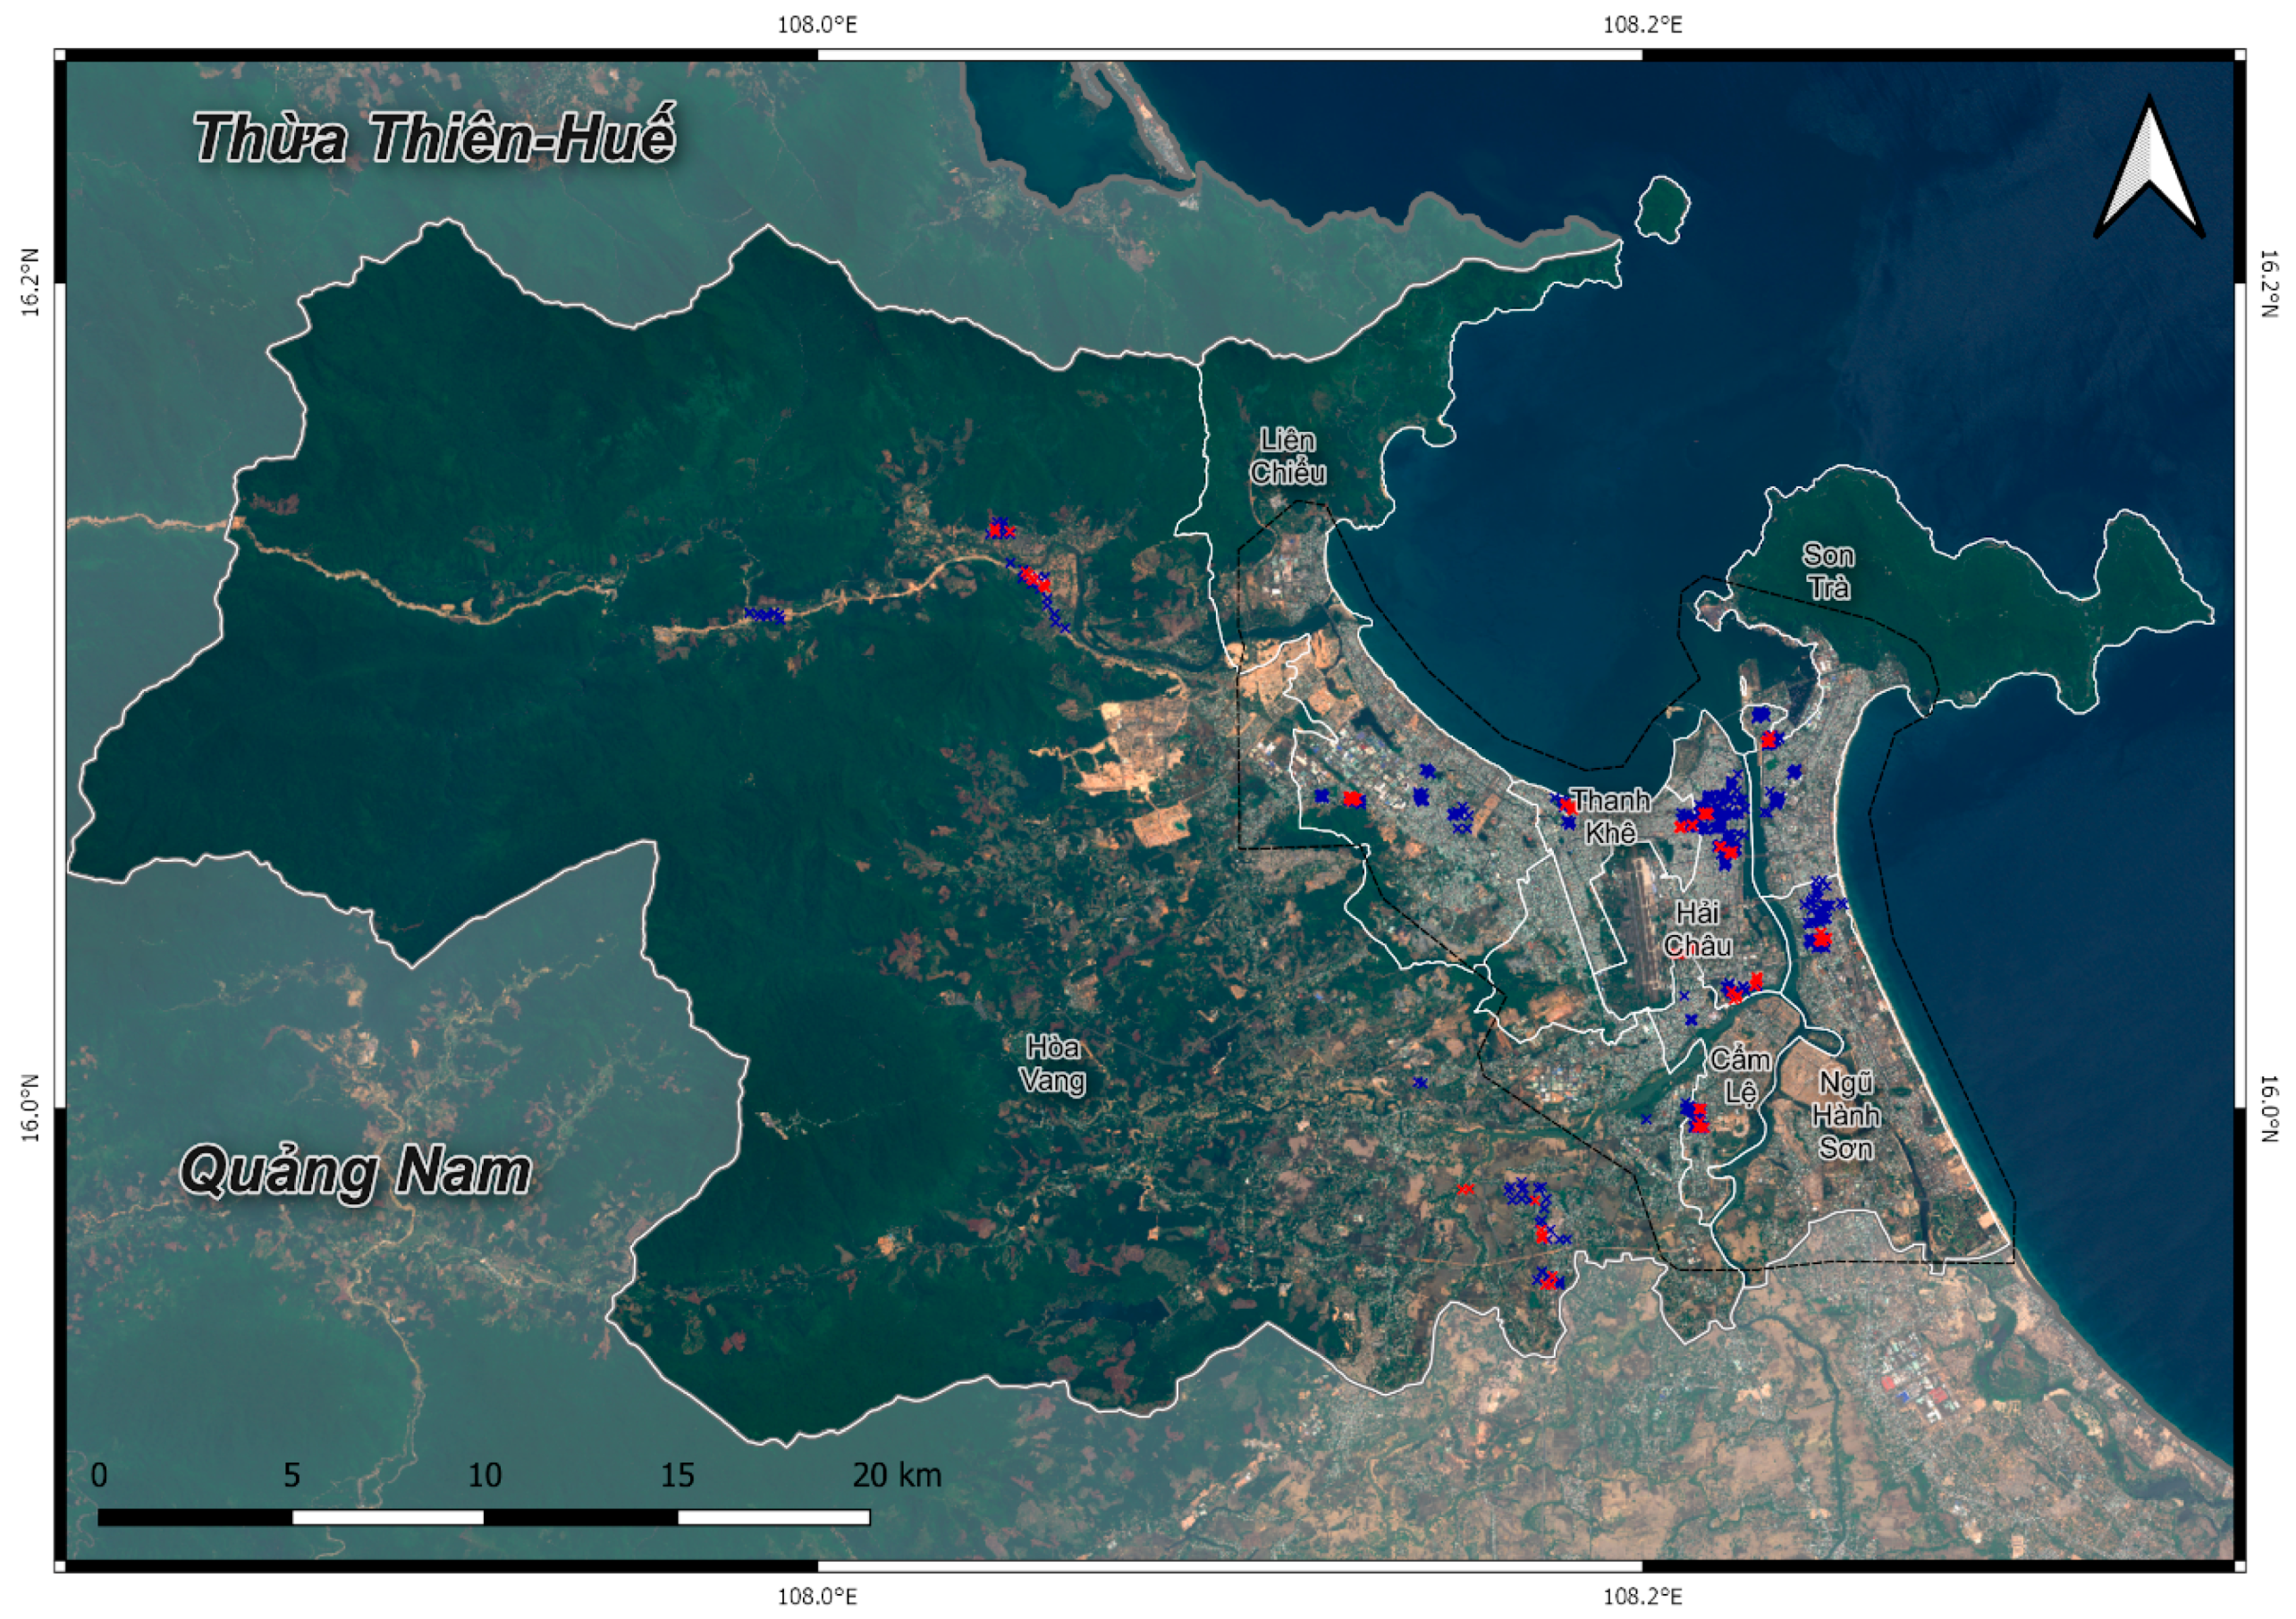
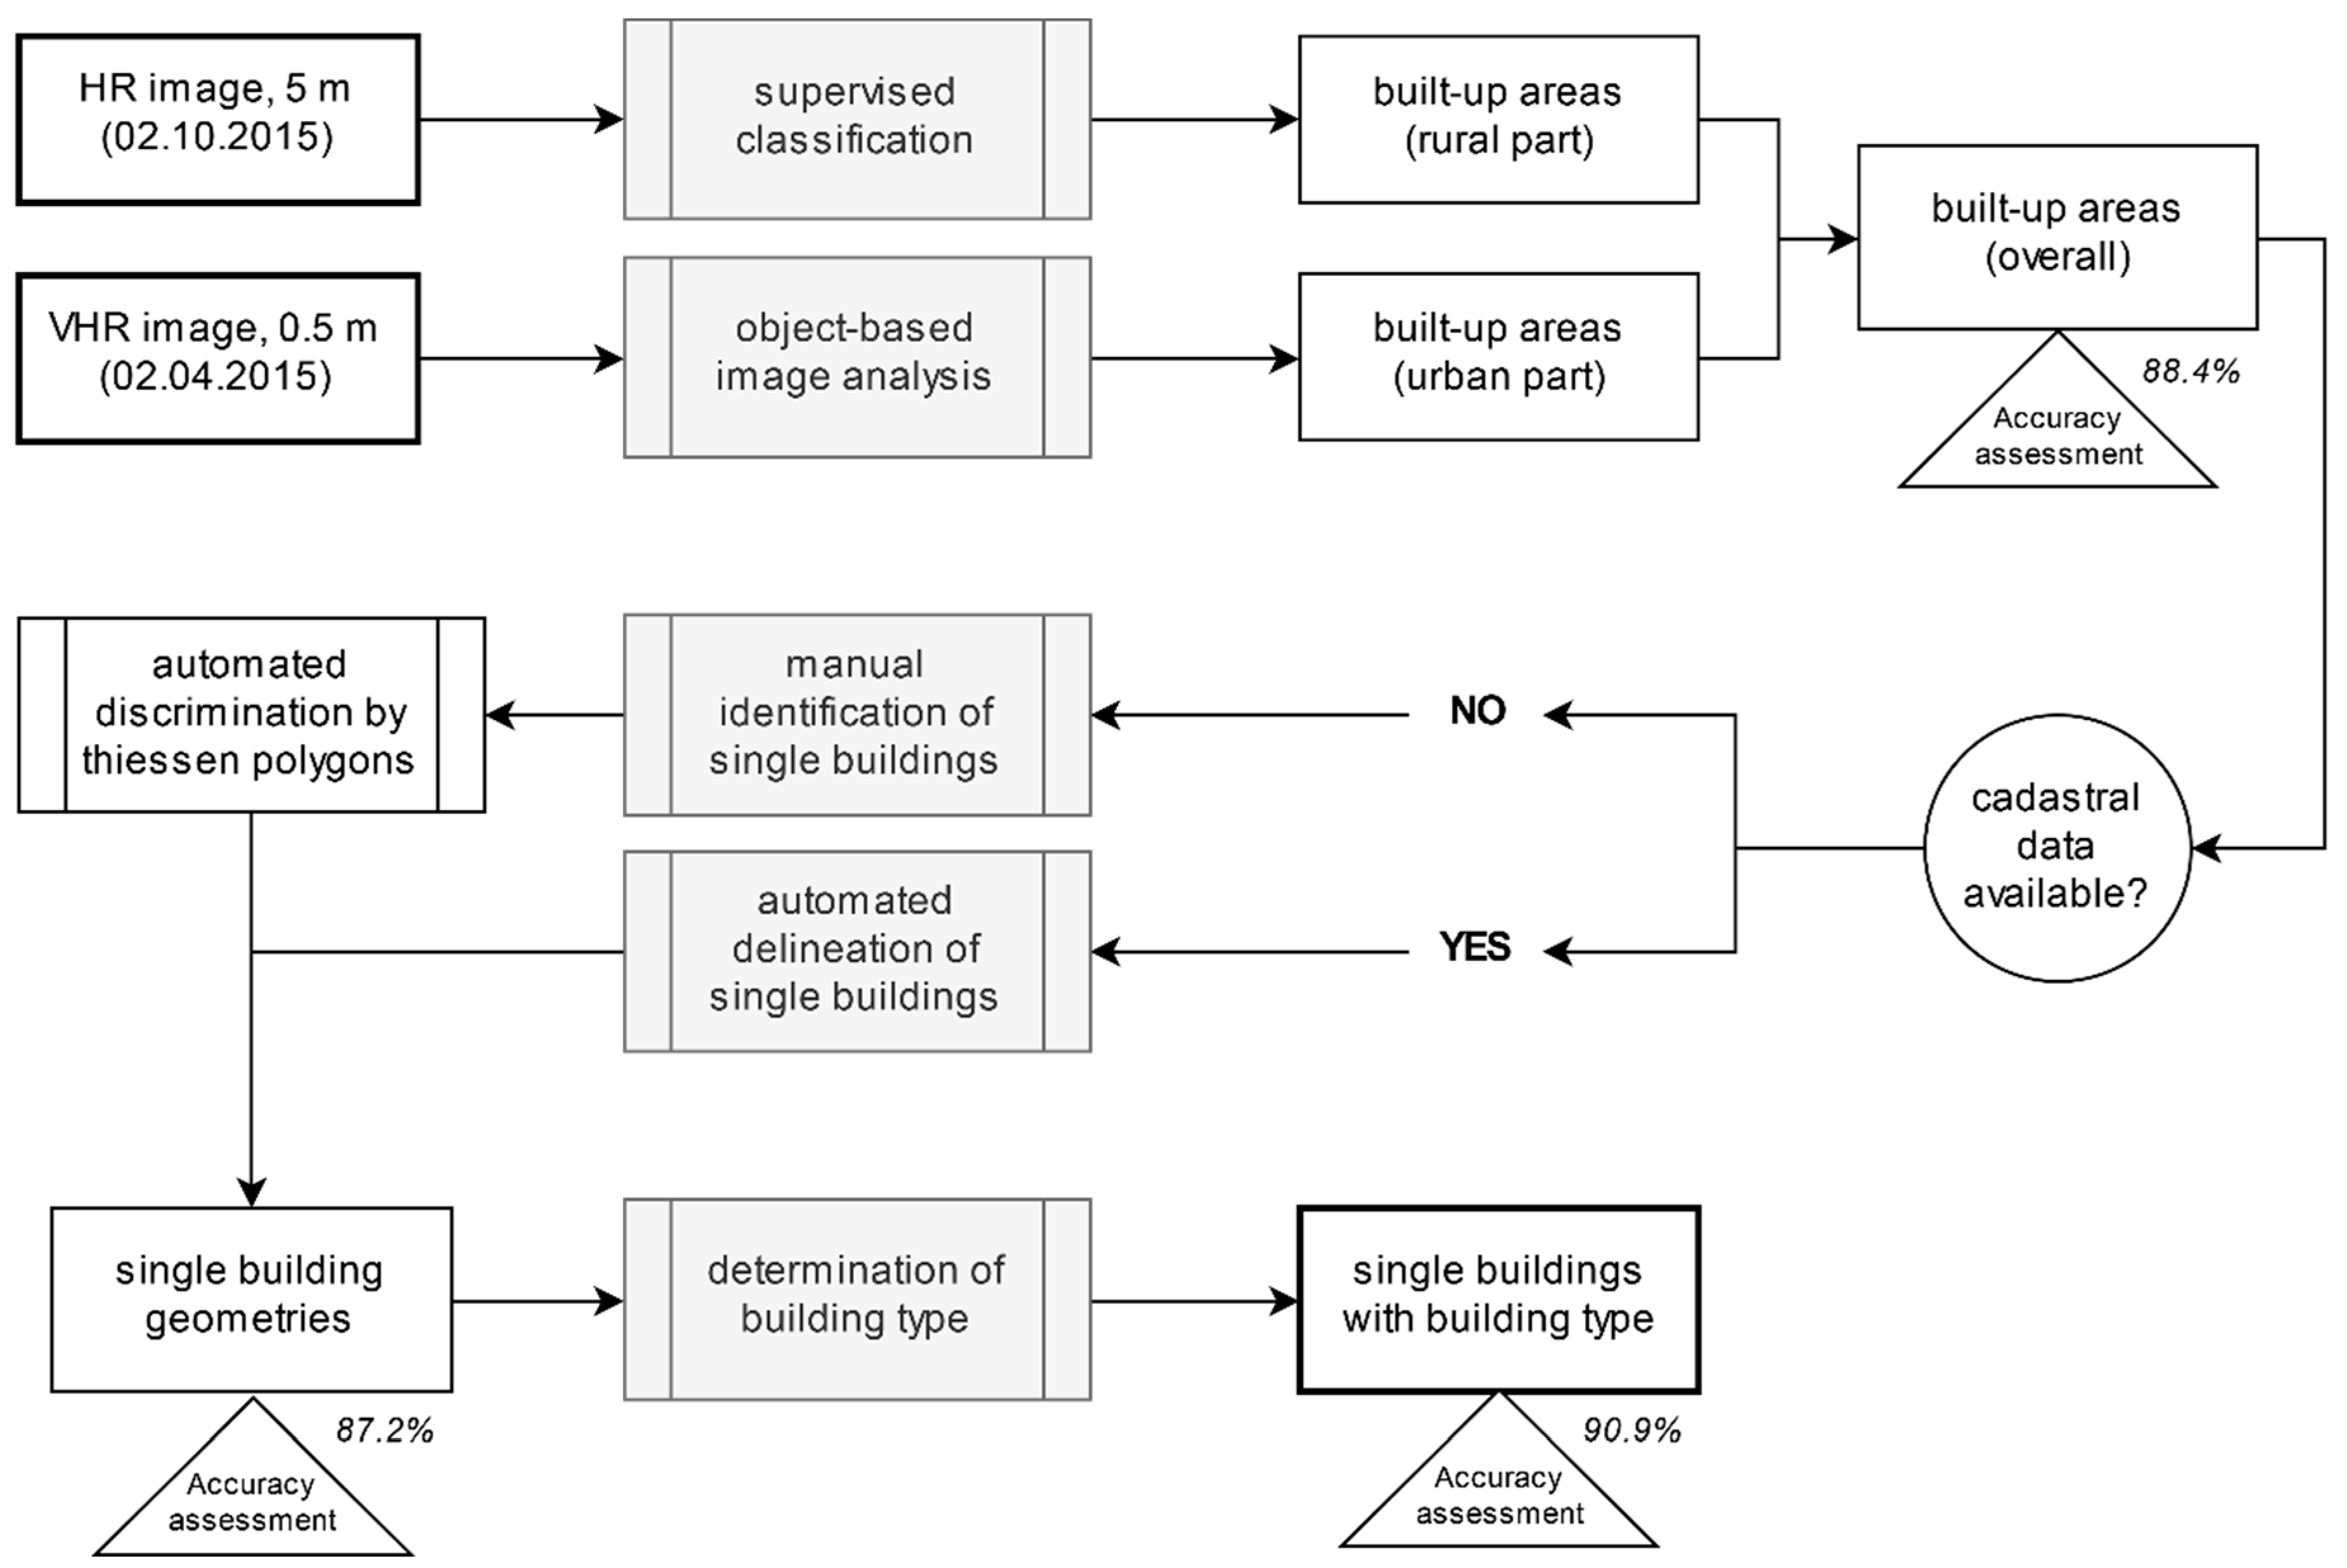
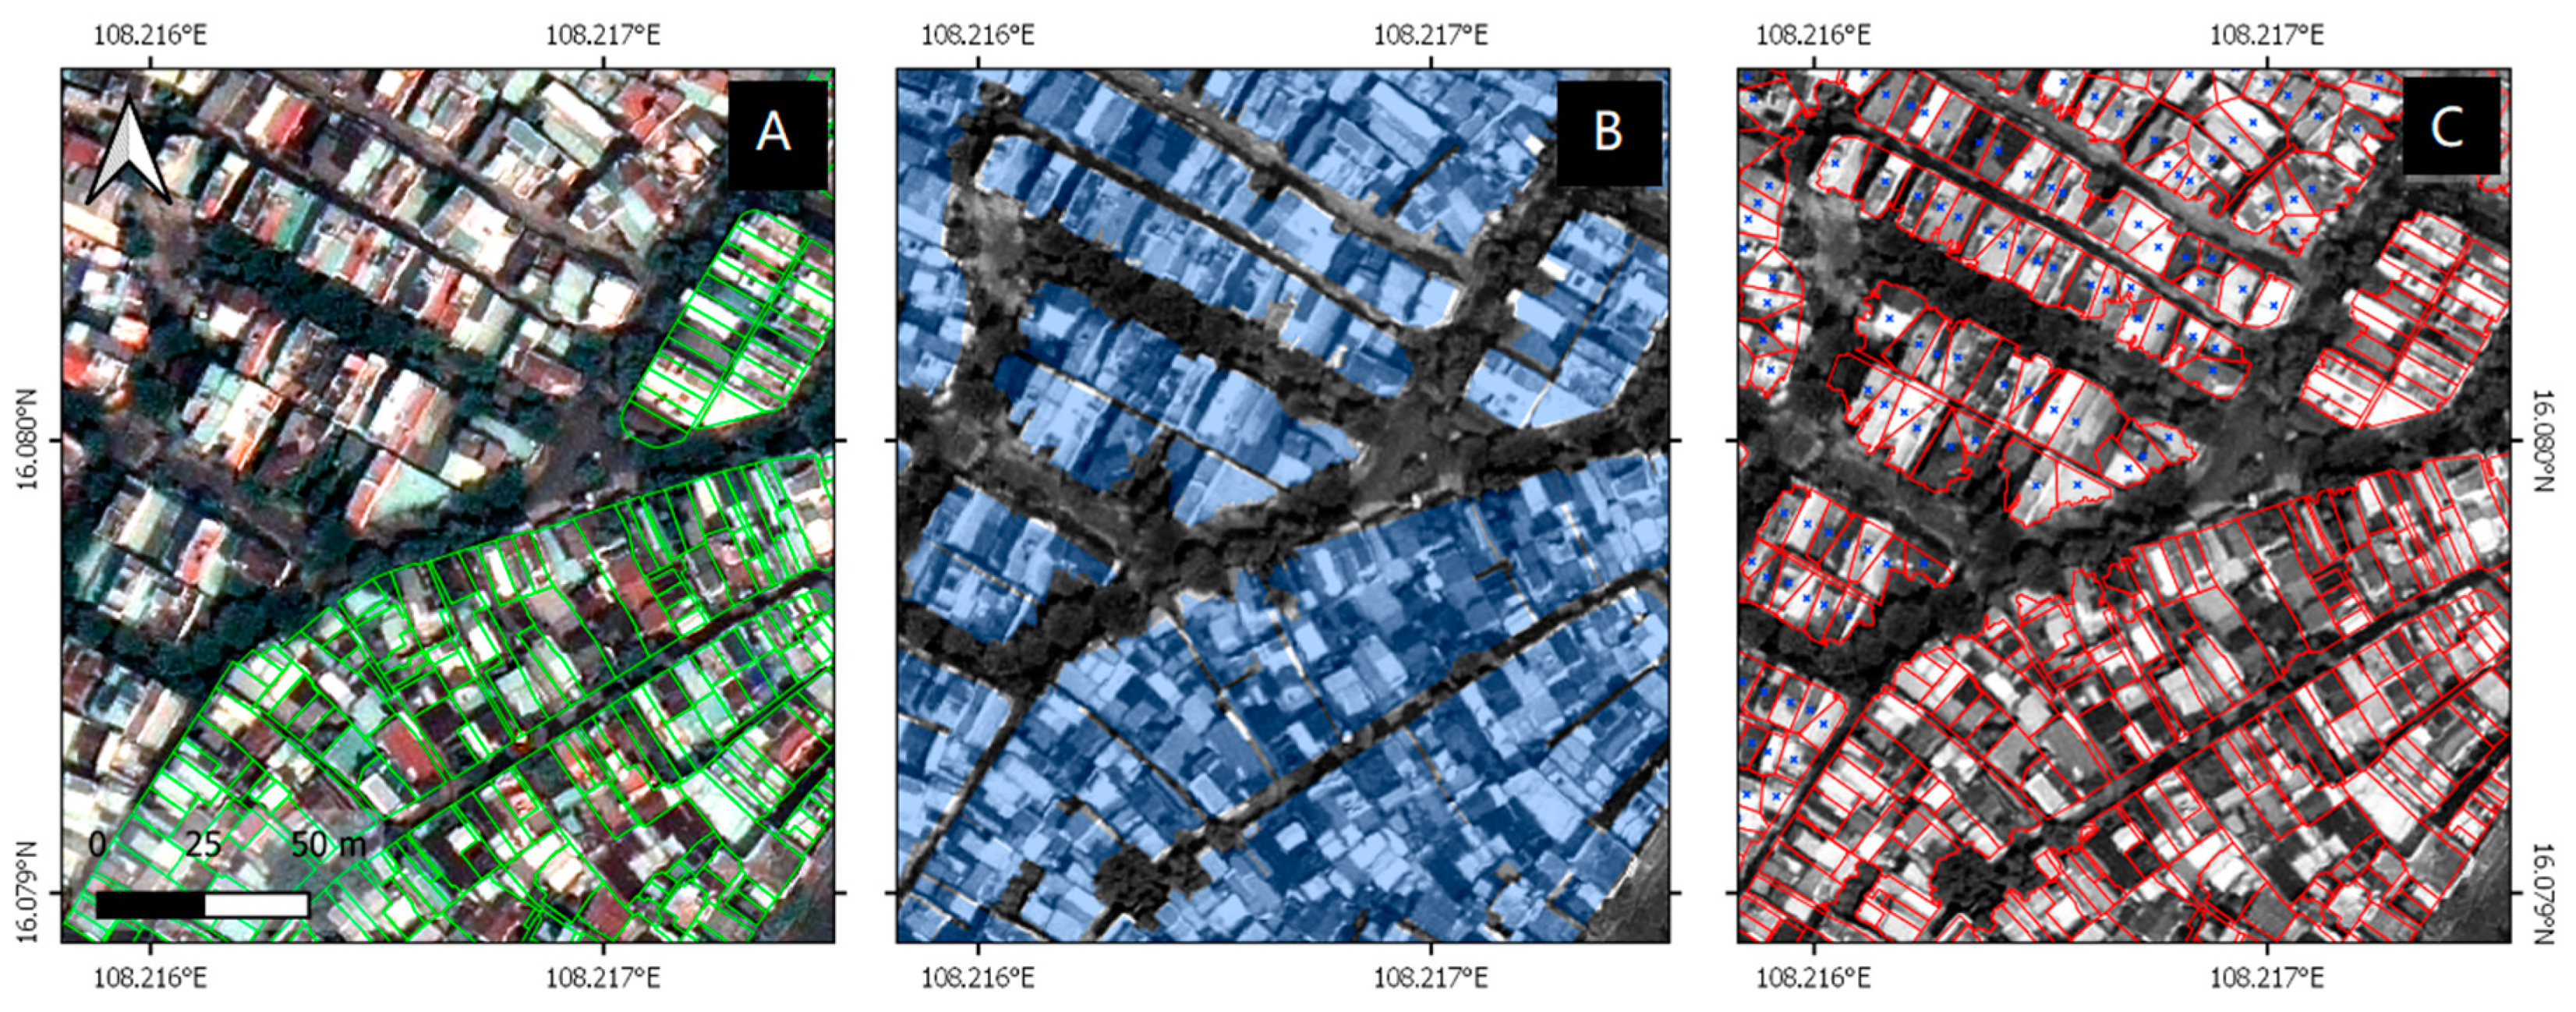
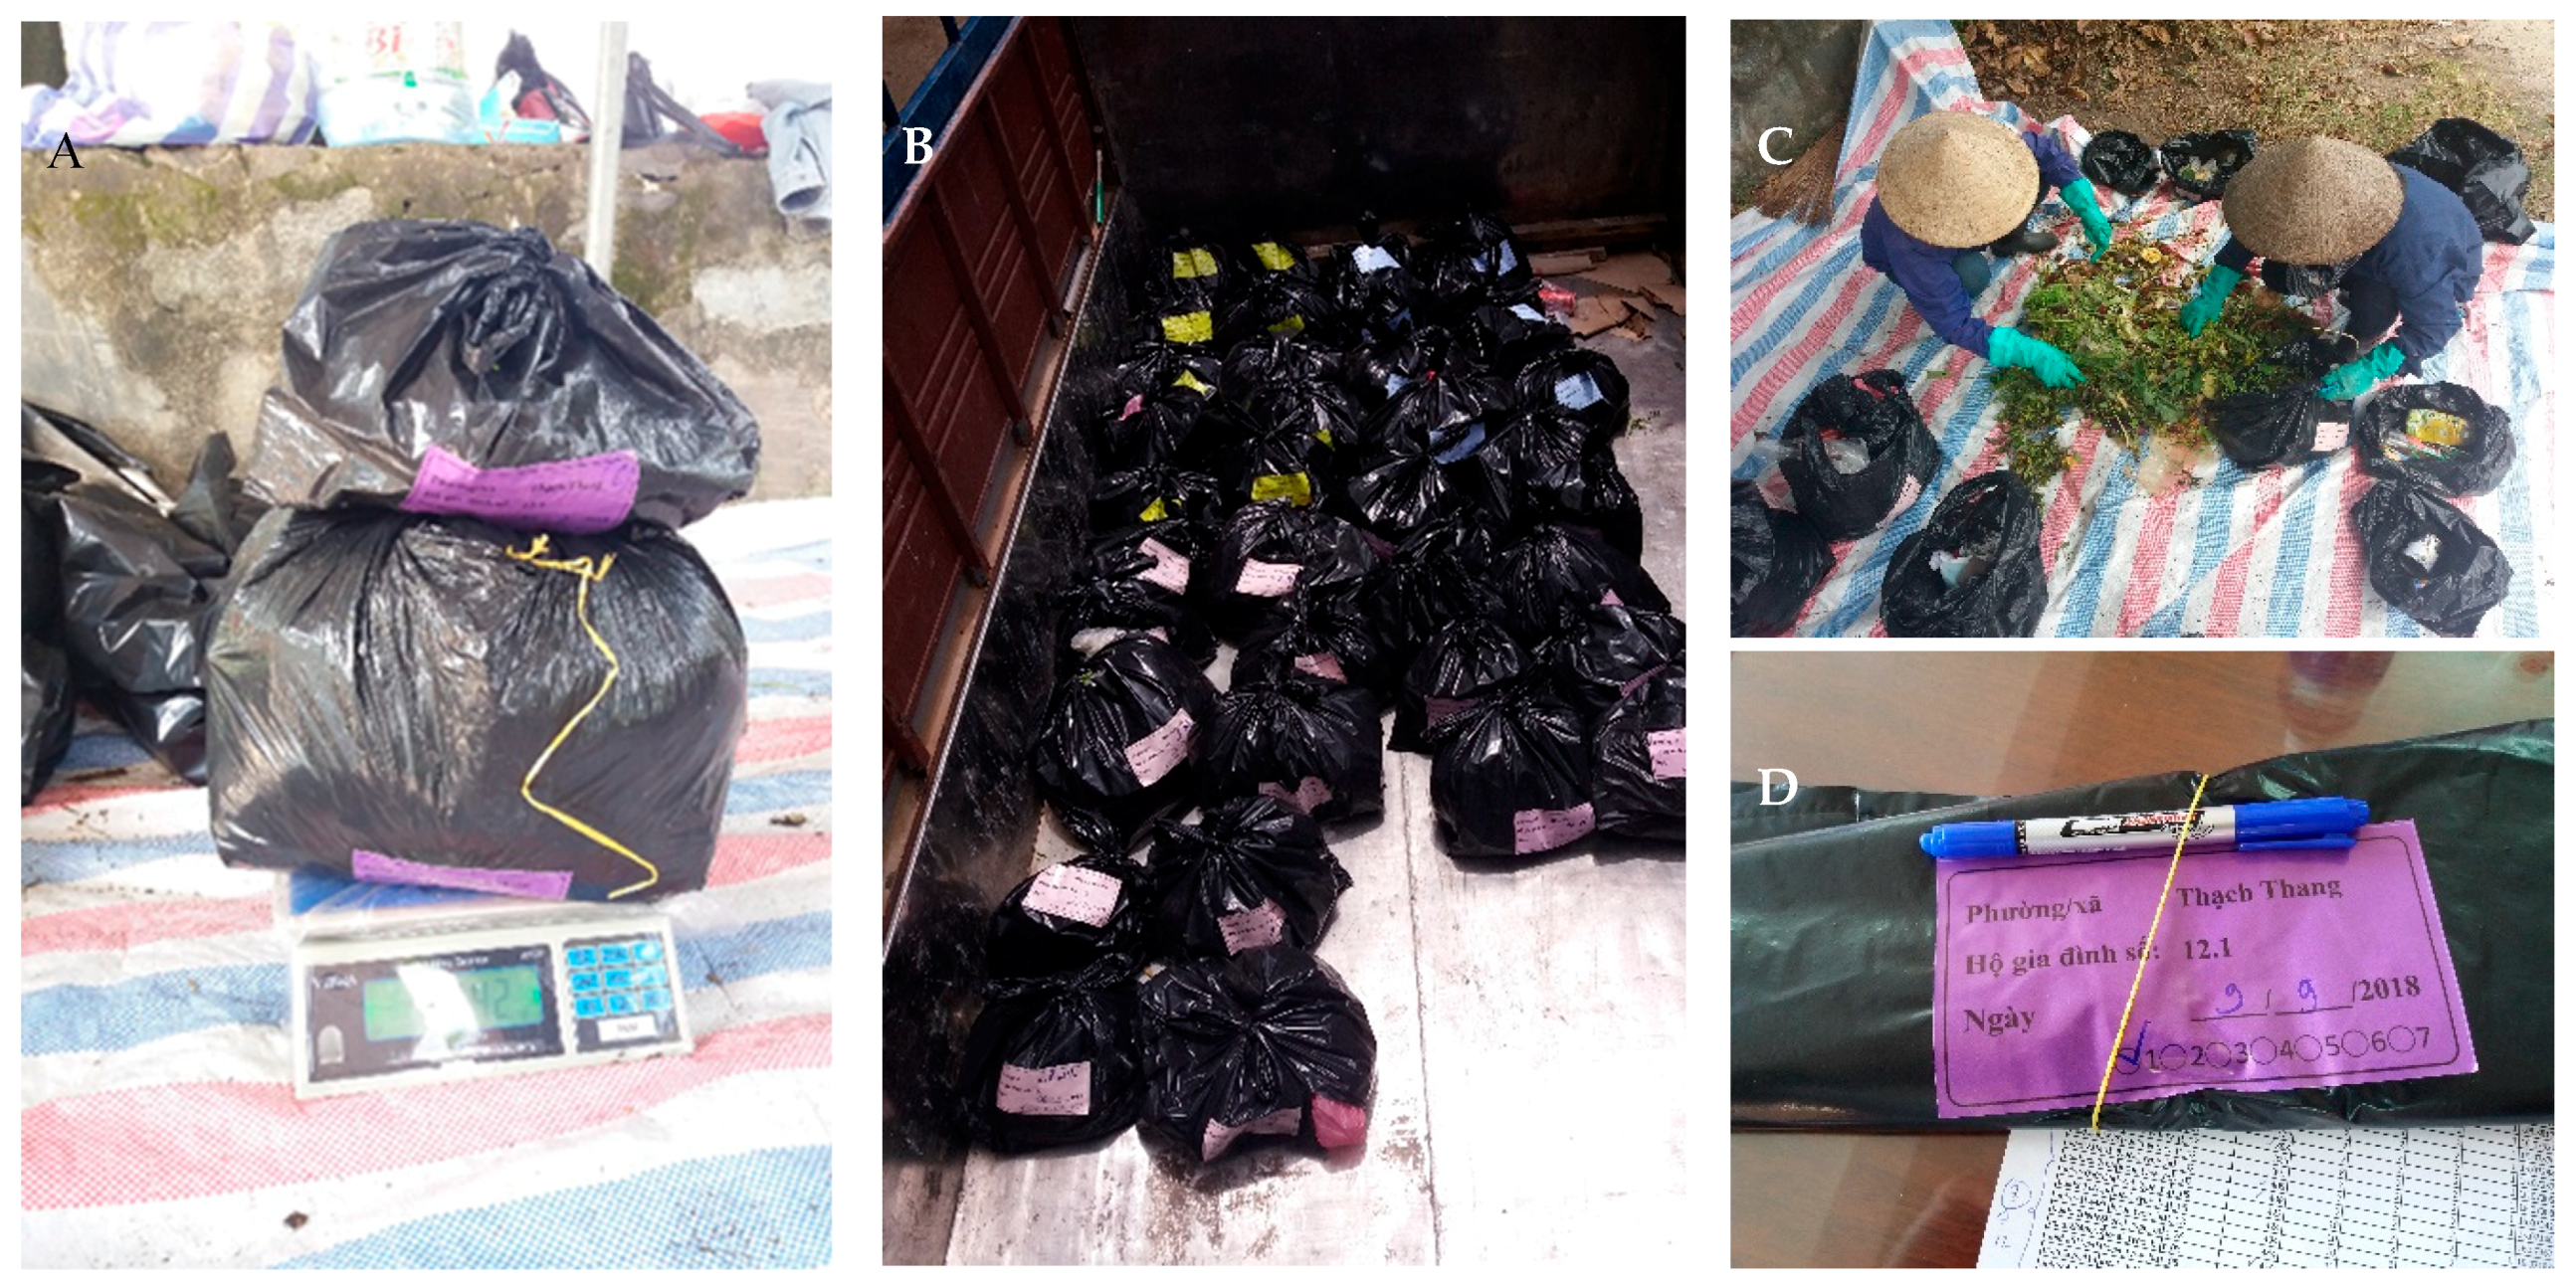

| Average Population | Area | Population Density | |||||
|---|---|---|---|---|---|---|---|
| District | 2014 | 2015 | 2016 | 2017 | 2018 1 | km2 | 2018 (ppl/km2) |
| Liên Chiểu | 154,893 | 158,239 | 162,297 | 166,833 | 180,293 | 74.52 | 2419 |
| Thanh Khê | 188,110 | 190,493 | 191,359 | 191,245 | 186,676 | 9.47 | 19,712 |
| Hải Châu | 206,536 | 209,221 | 211,829 | 213,568 | 203,691 | 23.29 | 8746 |
| Sơn Trà | 148,712 | 153,631 | 159,536 | 166,262 | 157,184 | 63.39 | 2480 |
| Ngũ Hành Sơn | 74,868 | 76,120 | 77,747 | 80,255 | 87,260 | 40.19 | 2171 |
| Cẩm Lệ | 106,383 | 108,485 | 111,361 | 114,266 | 133,813 | 35.85 | 3733 |
| Hòa Vang | 128,151 | 130,582 | 131,125 | 131,641 | 131,827 | 733.17 | 180 |
| Hoàng Sa | - | - | - | - | - | 305.00 | - |
| Total | 1,007,653 | 1,026,771 | 1,045,254 | 1,064,070 | 1,080,744 | 1284.88 | 841 |
| No. | Areas | 2011 | 2013 | 2015 | |||
|---|---|---|---|---|---|---|---|
| I | Urban | 272,459 | (85%) | 276,866 | (87%) | 314,027 | (76%) |
| 1 | Hải Châu | 82,443 | (90%) | 78,619 | (92%) | 96,104 | (93%) |
| 2 | Thanh Khê | 6258 | (89%) | 59,022 | (91%) | 72,439 | (91%) |
| 3 | Cẩm Lệ | 2858 | (72%) | 30,731 | (74%) | 35,901 | (75%) |
| 4 | Liên Chiểu | 3134 | (88%) | 35,059 | (93%) | 40,035 | (94%) |
| 5 | Sơn Trà | 43,715 | (80%) | 4804 | (82%) | 59,534 | (82%) |
| 6 | Ngũ Hành Sơn | 23,801 | (70%) | 25,396 | (74%) | 31,613 | (74%) |
| II | Suburban | 15,716 | (53%) | 16,267 | (63%) | 21,599 | (66%) |
| Total | 288,175 | (83%) | 293,134 | (85%) | 335,626 | (75%) | |
| ID | Building Type Name and Statistics | Description | Representative Reference Picture |
|---|---|---|---|
| 1 | Single family basic type (n = 101) average (standard deviation) of: height: 2.3 m (2.6 m) size 1: 57.7 m2 (39.1 m2) length 1: 16.5 m (13.2 m) width 1: 8.0 m (7.2 m) persons/household 2: 4.3 (0.9) | Detached housing, with a mix of residential and commercial use. Low-rise with 1–2 floors. Comprised of wood, brickwork, and reinforced concrete, tin roof. Often located along small alleyways or in peri-urban locations. | 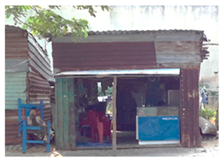 |
| 2 | Single/two-family local-type shophouse (n = 609) average (standard deviation) of: height: 3.9 m (3.1 m) size 1: 85.1 m2 (60.3 m2) length 1: 16.4 m (7.0 m) width 1: 7.2 m (4.2 m) persons/household 2: 5.8 (2.4) | Typical building type in Da Nang. Detached/semidetached/terraced shophouse. It is a 2–5 storey urban building, which allows a shop or other public activity at the street level, with residential accommodation on the upper floors. | 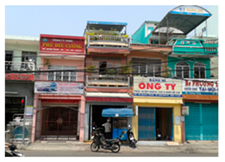 |
| 3 | Single/two-family bungalow type (n = 91) average (standard deviation) of: height: 4.0 m (1.5 m) size 1: 101.6 m2 (55.4 m2) length 1: 25.1 m (16.8 m) width 1: 14.5 m (9.1 m) persons/household 2: 4.7 (2.4) | Single family detached dwelling, low-rise 2–3 floors, built from brickworks and concrete, located in new urban districts. |  |
| 4 | Single/two-family villa-type (n = 49) average (standard deviation) of: height: 5.1 m (3.7 m) size 1: 211.8 m2 (174.1 m2) length 1: 21.8 m (8.5 m) width 1: 13.1 m (5.3 m) persons/household 2: 4.3 (1.6) | Mostly single-family detached dwelling, sometimes 2–3 attached multifamily buildings, low rise, 2–4 floors, built from brickwork or concrete, located in newly developed urban areas. | 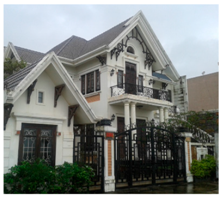 |
| 5 | Multifamily apartments, local-type (n = 58) average (standard deviation) of: height: 5.5 m (4.8 m) size 1: 346.2 m2 (249.1 m2) length 1: 30.3 m (14.1 m) width 1: 14.6 m (7.3 m) persons/household 2: 5.0 (1.8) | Multistorey/multi-unit apartments with more than three units. A commercial and/or public usage is possible. Traditional style of construction and local inhabitants. | 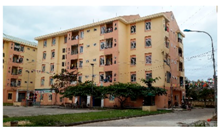 |
| 6 | Multi-family apartments, modern type (n = 33) average (standard deviation) of: height: 8.3 m (10.0 m) size 1: 854 m2 (1517.9 m2) length 1: 43.4 m (28.3 m) width 1: 23.8 m (19.4 m) persons/household 3: - | Multistorey/multi-unit apartments with more than three units. Modern style of construction. This class only contains hotels and other mixed-use commercial buildings with non-local residents. | 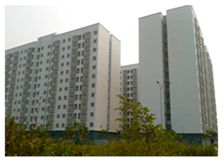 |
| 7 | Hall (n = 16) average (standard deviation) of: height: 5.1 m (3.8 m) size 1: 917.6 m2 (1654.0 m2) length 1: 44.3 m (31.4 m) width 1: 22.8 m (15.8 m) persons/household 3: - | Large buildings with one to multiple storeys, non-residential use. Mostly markets, warehouses, or industrial buildings. |  |
| 8 | Outbuilding/shack (n = 5) average (standard deviation) of: height: 2.3 m (2.7 m) size 1: 94.0 m2 (144.8 m2) length 1: 16.8 m (17.0 m) width 1: 7.9 m (4.6 m) persons/household 3: - | A small, often rundown, non-residential building or an outbuilding with non-residential usage (e.g., storage, bicycle racks). | 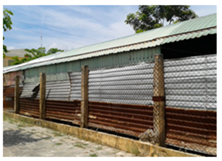 |
| 9 | Special structure/other (n = 13) average (standard deviation) of: height: 5.4 m (5.0 m) size 1: 552.1 m2 (928 m2) length 1:39.3 m (24.0 m) width 1: 22.1 m (14.8 m) persons/household 3: - | Wide range of built-up structures with a predominant non-residential use. |  |
| Waste Fraction | Sub-Fraction | Waste Fraction | Sub-Fraction | Waste Fraction |
|---|---|---|---|---|
| Organic: | Kitchen waste | Glass: | Packaging | Wood |
| Garden waste | Non-packaging | Textiles | ||
| Paper | Plastic: | Packaging | Ceramics/porcelain/mineral waste | |
| Cardboard | Non-packaging | Hygiene products | ||
| Composite packaging | Metals: | Packaging | Hazardous wastes | |
| Hygienic paper | Non-packaging | Electronic scrap | ||
| other | ||||
| ID | Building Type Short Name | Number and Share of Buildings | Error of Omission | Error of Commission |
|---|---|---|---|---|
| 1 | single basic | 1440 (0.5%) | 23.1% | 7.4% |
| 2 | single local | 273,314 (87.2%) | 0.7% | 6.5% |
| 3 | single bungalow | 19,759 (7.3%) | 27.6% | 25.0% |
| 4 | single villa | 2135 (0.8%) | 33.3% | 3.8% |
| 5 | multi local | 1107 (0.4%) | 22.6% | 8.9% |
| 6 | multi modern | 160 (0.1%) | 18.2% | 0.1% |
| 7 | hall | 4820 (1.8%) | 31.3% | 35.5% |
| 8 | outbuilding | 2432 (0.9%) | 20.0% | 33.3% |
| 9 | special | 3066 (1.1%) | 36.4% | 56.3% |
| Variable Name | Symbol | Unit of Measure | Definition |
|---|---|---|---|
| Building type | - | Definition of the building types according to Table 3 | |
| Buildings | Amount | Number of buildings within the city boundaries | |
| Generation rate | g × cap−1 × day−1 | Arithmetic mean of HSW generation per capita per day of each fraction (kitchen waste, garden waste, paper, etc.) | |
| Household size | Persons/household | Arithmetic mean of number of residents per household depending on the building type |
| # | Building Type | Cẩm Lệ | Hải Châu | Hòa Vang | Liên Chiểu | Ngũ Hành Sơn | Sơn Trà | Thanh Khê | Total |
|---|---|---|---|---|---|---|---|---|---|
| 1 | single basic | 199 | 28 | 472 | 212 | 356 | 35 | 138 | 1440 |
| 2 | single local | 25,252 | 43,206 | 28,286 | 42,751 | 23,180 | 31,491 | 43,148 | 237,314 |
| 3 | single bungalow | 200 | 171 | 17,065 | 1145 | 828 | 307 | 43 | 19,759 |
| 4 | single villa | 170 | 225 | 135 | 471 | 643 | 367 | 124 | 2135 |
| 5 | multi local | 85 | 184 | 181 | 262 | 120 | 203 | 72 | 1107 |
| 6 | multi modern | 12 | 29 | 16 | 13 | 41 | 47 | 2 | 160 |
| 7 | hall | 345 | 567 | 1073 | 1554 | 446 | 668 | 167 | 4820 |
| 8 | outbuilding | 155 | 222 | 284 | 732 | 494 | 356 | 189 | 2432 |
| 9 | special | 126 | 571 | 1017 | 469 | 289 | 394 | 200 | 3066 |
| sum of buildings | 26,544 | 45,203 | 48,529 | 47,609 | 26,397 | 33,868 | 44,083 | 272,233 | |
| HSW generation (t/day) | 31 | 52 | 46 | 53 | 29 | 38 | 52 | 301 | |
| HSW generation (t/year) | 11,171 | 18,996 | 16,819 | 19,243 | 10,727 | 14,033 | 18,856 | 109,844 | |
| Waste Fraction | Subfraction | Cẩm Lệ | Hải Châu | Hòa Vang | Liên Chiểu | Ngũ Hành Sơn | Sơn Trà | Thanh Khê | City Average | HSW Generation (t/year) |
|---|---|---|---|---|---|---|---|---|---|---|
| Organic: | Kitchen waste | 65.03% | 65.26% | 53.53% | 64.46% | 64.00% | 65.02% | 65.35% | 62.90% | 69,088.51 |
| Garden waste | 0.97% | 0.95% | 1.38% | 1.04% | 1.25% | 1.04% | 0.92% | 1.08% | 1182.95 | |
| Paper | 1.18% | 1.17% | 1.82% | 1.21% | 1.24% | 1.18% | 1.17% | 1.30% | 1428.26 | |
| Cardboard | 1.01% | 1.00% | 1.20% | 1.02% | 1.02% | 1.01% | 1.00% | 1.04% | 1145.35 | |
| Composite packaging | 1.04% | 1.03% | 1.39% | 1.05% | 1.06% | 1.04% | 1.03% | 1.10% | 1211.40 | |
| Hygienic paper | 0.19% | 0.19% | 0.16% | 0.19% | 0.20% | 0.20% | 0.19% | 0.19% | 206.83 | |
| Glass: | Packaging | 0.88% | 0.82% | 1.15% | 0.87% | 0.95% | 0.82% | 0.84% | 0.91% | 999.25 |
| Non-packaging | 0.46% | 0.45% | 0.44% | 0.45% | 0.46% | 0.45% | 0.46% | 0.45% | 498.40 | |
| Plastic: | Packaging | 16.83% | 16.79% | 18.83% | 16.91% | 16.94% | 16.81% | 16.78% | 17.19% | 18,880.93 |
| Non-packaging | 0.09% | 0.09% | 0.05% | 0.09% | 0.10% | 0.09% | 0.09% | 0.08% | 92.79 | |
| Metals: | Packaging | 0.47% | 0.45% | 0.46% | 0.47% | 0.50% | 0.46% | 0.46% | 0.46% | 510.75 |
| Non-packaging | 0.06% | 0.06% | 0.04% | 0.06% | 0.06% | 0.06% | 0.06% | 0.06% | 66.20 | |
| Wood | 0.16% | 0.16% | 0.13% | 0.16% | 0.16% | 0.16% | 0.16% | 0.16% | 171.16 | |
| Textiles | 1.51% | 1.51% | 2.04% | 1.54% | 1.53% | 1.51% | 1.51% | 1.61% | 1768.00 | |
| Ceramics/porcelain/mineral waste | 0.28% | 0.27% | 0.66% | 0.29% | 0.30% | 0.28% | 0.27% | 0.35% | 381.27 | |
| Hygiene products | 6.59% | 6.55% | 13.42% | 6.94% | 6.99% | 6.65% | 6.48% | 7.87% | 8648.19 | |
| Hazardous wastes | 0.03% | 0.03% | 0.12% | 0.03% | 0.04% | 0.03% | 0.03% | 0.05% | 51.04 | |
| Electronic scrap | 0.28% | 0.28% | 0.26% | 0.28% | 0.27% | 0.28% | 0.28% | 0.28% | 304.50 | |
| Other | 2.92% | 2.91% | 2.90% | 2.91% | 2.91% | 2.90% | 2.91% | 2.91% | 3194.72 | |
| Total | 100% | 100% | 100% | 100% | 100% | 100% | 100% | 100% | 109,843.81 | |
© 2019 by the authors. Licensee MDPI, Basel, Switzerland. This article is an open access article distributed under the terms and conditions of the Creative Commons Attribution (CC BY) license (http://creativecommons.org/licenses/by/4.0/).
Share and Cite
Vetter-Gindele, J.; Braun, A.; Warth, G.; Bui, T.T.Q.; Bachofer, F.; Eltrop, L. Assessment of Household Solid Waste Generation and Composition by Building Type in Da Nang, Vietnam. Resources 2019, 8, 171. https://doi.org/10.3390/resources8040171
Vetter-Gindele J, Braun A, Warth G, Bui TTQ, Bachofer F, Eltrop L. Assessment of Household Solid Waste Generation and Composition by Building Type in Da Nang, Vietnam. Resources. 2019; 8(4):171. https://doi.org/10.3390/resources8040171
Chicago/Turabian StyleVetter-Gindele, Jannik, Andreas Braun, Gebhard Warth, Tram Thi Quynh Bui, Felix Bachofer, and Ludger Eltrop. 2019. "Assessment of Household Solid Waste Generation and Composition by Building Type in Da Nang, Vietnam" Resources 8, no. 4: 171. https://doi.org/10.3390/resources8040171
APA StyleVetter-Gindele, J., Braun, A., Warth, G., Bui, T. T. Q., Bachofer, F., & Eltrop, L. (2019). Assessment of Household Solid Waste Generation and Composition by Building Type in Da Nang, Vietnam. Resources, 8(4), 171. https://doi.org/10.3390/resources8040171


