Article

Characterizing the Urban Mine—Challenges of Simplified Chemical Analysis of Anthropogenic Mineral Residues

1
Chair of Circular Economy and Recycling Technology, Technische Universität Berlin, Straße des 17. Juni 135, 10623 Berlin, Germany
2
Technology and Society Laboratory, Swiss Federal Laboratories for Materials Science and Technology, Empa, CH-9014 St. Gallen, Switzerland
3
Advanced Analytical Technologies, Swiss Federal Laboratories for Materials Science and Technology, Empa, CH-8600 Dübendorf, Switzerland
4
Particles-Biology Interactions Laboratory, Swiss Federal Laboratories for Materials Science and Technology, Empa, CH-9014 St. Gallen, Switzerland
*
Authors to whom correspondence should be addressed.
Resources 2019, 8(3), 132; https://doi.org/10.3390/resources8030132
Submission received: 25 June 2019 / Revised: 19 July 2019 / Accepted: 24 July 2019 / Published: 26 July 2019

Abstract

:
Anthropogenic mineral residues are characterized by their material complexity and heterogeneity, which pose challenges to the chemical analysis of multiple elements. However, creating an urban mine knowledge database requires data using affordable and simple chemical analysis methods, providing accurate and valid results. In this study, we assess the applicability of simplified multi-element chemical analysis methods for two anthropogenic mineral waste matrices: (1) lithium-ion battery ash that was obtained from thermal pre-treatment and (2) rare earth elements (REE)-bearing iron-apatite ore from a Swedish tailing dam. For both samples, simplified methods comprising ‘in-house’ wet-chemical analysis and energy-dispersive X-ray fluorescence (ED-XRF) spectrometry were compared to the results of the developed matrix-specific validated methods. Simplified wet-chemical analyses showed significant differences when compared to the validated method, despite proven internal quality assurance, such as verification of sample homogeneity, precision, and accuracy. Matrix-specific problems, such as incomplete digestion and overlapping spectra due to similar spectral lines (ICP-OES) or element masses (ICP-MS), can result in quadruple overestimations or underestimation by half when compared to the reference value. ED-XRF analysis proved to be applicable as semi-quantitative analysis for elements with mass fractions higher than 1000 ppm and an atomic number between Z 12 and Z 50. For elements with low mass fractions, ED-XRF analysis performed poorly and showed deviations of up to 90 times the validated value. Concerning all the results, we conclude that the characterization of anthropogenic mineral residues is prone to matrix-specific interferences, which have to be addressed with additional quality assurance measures.

Graphical Abstract

1. Introduction

Anthropogenic mineral residues are low-grade inorganic resources that arise as by-products or wastes from the extraction of primary raw materials or recycling processes (synthetic minerals) with high annual mass flows [1]. Recently, these residues came into focus, as they play a significant role in the European Union (EU) Raw Materials Initiative ‘RMIS’ [2] to recover secondary raw materials from the urban mine and ensure raw material supply. In addition to increasing resource efficiency, the strategies of the EU RMIS for securing the supply of raw materials include the characterization of mineral residues from the urban mine and the creation of an improved knowledge database for mineral deposits [2]. Extraction from anthropogenic ores is to be considered, particularly if elements (a) occur in high mass fractions, (b) are of environmental concern, or (c) economically interesting to be recovered, e.g., due to the classification as a critical element defined by the EU [3].
For an improved urban mine knowledge database, as well as for the evaluation of recoverability and compliance with environmental limits, valid information on the composition or presence of individual elements is essential. Prerequisites for this information are suitable and quality-assured analytical methods with proven applicability (specific to element and sample), high accuracy, and repeatability of the measurement for the respective sample matrix.
However, chemical analysis of the anthropogenic mineral samples is often challenging, due to element variety, matrix complexity, and material heterogeneity. These characteristics lead to the fact that analytical quality assurance using, e.g., standardized operation procedures or matrix-specific certified reference materials are intricate and elaborate. The chemical analysis of anthropogenic mineral residues lacks applicable reference methods, so that the methods that are used for similar sample matrices often vary. An indicative literature review showed that the methods that are applied for multi-element chemical analysis of anthropogenic ores are based on various references, comprising general national and international standards for waste, soil, and water [4,5,6,7] or individual methods that were developed and validated for a specific application. The procedures include sample preparation by means of fusions [8] or acid digestion with various acid blends comprising sulfuric acids [9,10,11,12,13,14], nitric acids [15], aqua regia [16,17], hydrochloric, hydrofluoric, nitric, and perchloric acids [18], or other blends [11,19,20]. Measurement methods comprise non-destructive X-Ray Fluorescence (XRF) [19,21,22], Inductive Coupled Plasma (ICP) with Optical Emissions Spectrometer (ICP-OES) [9,10,11,14,15,16,19,20,23,24,25,26,27], and Mass Spectrometry (ICP-MS) [19,28] or Atomic Absorption Spectrometry (AAS) [9,10,11,12,13,14,15,17,26,29].
Validated methods aim to generate reliable results under consideration of the material complexity, and thus the high variability of the influencing effects caused by, e.g., complexing, precipitation, volatilization, interferences, and measurement inaccuracies [8]. Consequently, the analytical effort increases, since multiple method variations must be tested, such as measurement devices, mode settings, reagents, and the additional measurement of potentially disturbing elements. This complexity leads to the consideration of method simplifications, which reduces the expenditure of the analytics or allows for examining a higher number of primary samples in order to evaluate the sampling uncertainty better. However, procedural modifications and simplifications carry the risk that systematic errors lead to significant deviations from the true analytical value, as demonstrated for multi-element chemical analysis of other organic-rich waste matrices, such as Paper/Cardboard and Composites [30] or printed circuit boards [31].
In this article, we assess the applicability of simplified multi-element chemical analysis methods for complex mineral waste matrices that show highly different mass contents of many elements. This study is part of an extensive effort to investigate multi-element chemical analysis of different anthropogenic ore matrices, addressing printed circuit boards [31], automobile shredder residues (submitted to recycling), and mineral residues (this article). The overall objective of this research effort is to examine the sample- and element-specific effects of multi-element chemical analysis on the resulting compositional data.
This study was conducted on two mineral waste samples that were obtained from the thermal pre-treatment of lithium-ion batteries and an iron-apatite tailing dam. Firstly, the matrix-specific validated methods were developed to determine the elemental composition of the samples. Secondly, the results were compared to more simplified methods comprising non-destructive energy-dispersive X-ray fluorescence (ED-XRF) spectrometry and routine ‘in-house’ wet-chemical methods. Method validation was performed by spiking experiments of liquid standards, blank samples, as well as in the sample matrix. The applicability of the simplified methods was checked by the relative difference from the validated values and a significance test (Welch’s t-test).

2. Materials and Methods

2.1. Sample Origin and Physical Sample Preparation

Two anthropogenic mineral samples were used to assess the applicability of simplified multi-element chemical analysis methods. The samples have a similar matrix, i.e., they are inorganic, completely oxidized, and have a high element diversity. The origin, sampling, and physical sample preparation are explained in the following.

2.1.1. Battery Ash Sample (BATT)

The battery ash sample (BATT) originates from the thermal pre-treatment of approximately 10 t of cobalt-poor lithium batteries and accumulators. The lithium batteries that were investigated comprise a large number of different chemical subsystems consisting of the following components: metal sleeve, positive electrode (e.g., LiFePO4, LiCoO2, LiNiO2, LiMn2O4, Li/SOCl2 [32]), negative electrode (metal oxide that also intercalates Li-ions, such as LixCoO2, LixNiO2, or LixMn2O4), electrolyte (organic solvents with salts, such as LiPF6 or LiAsF6), and separator foils (Al, Cu) [33].
The batteries were continuously placed over 24 h in a brick-lined rotary kiln and thermally treated at approximately 850 °C, after the removal of all residual incinerated material. The battery cases immediately exploded due to the chemically bound residual energy, so that the contained components were almost completely liberated. As a result, the volatile components, such as the electrolyte, were transferred to the gas phase and separated by built-in filter systems. The remaining mineral masses oxidized almost entirely at a residence time of approx. 30 min. Before being sieved at a mesh size of 30 mm, the process output went through an installed water quench, which was used to cool down the sample material and impede further incineration reactions. The main constituents of the coarse material were metal sleeves and construction aids, such as screws or metal grids. The mineral fine fraction that accounted for approximately 40% of the total process input was sampled according to ‘Guideline for the procedure for physical, chemical and biological investigations in connection with the recycling/disposal of waste to the guideline for sampling (LAGA PN98)’ [34]. Subsamples were taken, mixed, and reduced to a lab sample of 40 L final volume.
The lab sample was dried at 105 °C, according to DIN EN 14346 ‘Characterization of waste–Calculation of dry matter by the determination of dry residue or water content’ [35]. Subsequently, a sieve analysis machine (Haver EML digital plus) was used to sieve the dry material to a particle size < 1 mm. This material was further ground to a final particle size < 0.2 mm while using a planetary mill (Retsch PM400) in combination with tungsten carbide grinding bowls (see Figure 1a) and it constitutes the sample that was investigated in this study. The powdery sample mainly consists of the inorganic electrode material and it still contains metallic and other valuable constituents.

2.1.2. Mining Waste Sample (MIN)

The mining waste sample (MIN) originates from the Hötjärn tailing dam of the concentrator that was located at the Grängesberg deposit in Sweden. Tailings from the Grängesberg deposit are estimated at 5.6 million tons (Mt), of which most were deposited in the Hötjärn tailing dam. The dominant mineral in Grängesberg was apatite (Ca5(PO4)3F) with magnetite (Fe3O4) [36], containing on average Fe 42.0%, Mn 0.14%, P2O5 1.97% [37]. The primary purpose of the ore processing was to enhance the iron metal grade, rather than remove apatite or other constituents from the concentrate [38]. Hence, the apatite minerals are often rich in rare earth elements (REE) [39] or they may contain, depending on their location and extraction technology, other elements that are classified as critical [40], such as Mg, Ga, Si, W, Co, Nb, and V (mass fractions around 1%).
The MIN sample was taken from the upper layer on top of the Hötjärn tailing dam. Approximately 10 kg of the dark gray and powdery sample material was mixed and then reduced to a 2 kg laboratory sample. A planetary ball mill (Retsch PM400) with tungsten carbide grinding bowls was used to grind the material to a particle size of <0.2 mm. Subsequently, a rotary sample divider (Retsch PTZ) was used to create 64 aliquots for the chemical analysis. Figure 1b shows the mechanical processing of the mining waste sample.

2.2. Chemical Analysis

2.2.1. General Approach

For each of the two samples, chemical analyses were performed comprising of a sophisticated validated method, a simplified wet-chemical in-house method, and non-destructive energy-dispersive X-ray fluorescence (ED-XRF) analysis.
Firstly, validated methods were developed by Empa, Advanced Analytical Technologies (L1) by undertaking an element-specific and extensive investigation according to DIN EN ISO/IEC 17025 ‘General requirements for the competence of testing and calibration laboratories’ [41]. Wavelength-dispersive X-ray fluorescence (WD-XRF) spectrometry and wet-chemical analysis using Inductively Coupled Plasma (ICP), in combination with Optical Emissions Spectrometry (ICP-OES) and Mass Spectrometry (ICP-MS) for element detection were employed. The wet-chemical analysis was validated while using sophisticated testing of, among other things, varying acid mixtures, measurement settings, as well as gas reaction and collision modes for ICP-MS. Method validation was realized with (1) analysis of potentially interfering elements, such as oxygen, carbon, and halogens, (2) element spikes added before digestion, (3) dilution experiments, and (4) the use of certified standard reference material for MIN (CCRMP REE-1 from National Resources Canada [42]).
Secondly, routine in-house wet-chemical methods were carried out at Technische Universität Berlin, Chair of Circular Economy and Recycling Technology (L2), while applying general quality assurance measures, also based on DIN EN ISO/IEC 17025. The term ‘in-house methods’ refers to procedures that are assessed in-house according to national and international guidelines and standards, such as DIN EN 13657 ‘Characterization of waste-Digestion for subsequent determination of aqua regia soluble portion of elements’ [4]. The in-house methods are based on the validated methods, but apply simplification, which represents common procedures for routine analysis with usual resource constraints. Simplifications comprise standard measurement settings for general sample matrices, the avoidance of hydrofluoric acid (HF) for digestion, and the limitation of helium as the reaction gas for ICP-MS. Nevertheless, for a better comparison, the element detection was done while using the same element masses (ICP-MS) and spectral lines (ICP-OES), if applicable. Element recovery rates in liquid standards, blinds, and samples served for method validation.
Thirdly, ED-XRF spectrometry was employed by L2 to analyze both of the samples.
Finally, the results of in-house and ED-XRF measurements were compared to the reference values that were determined with the validated methods to assess the applicability of simplified methods and to identify particularly difficult cases.

2.2.2. Element Selection

Factors, such as sample origin, the criticality of elements [40], ED-XRF pre-scan results, and potential chemical interferences that affect the analysis result were considered for the selection of elements. The elements were grouped in ferrous metals (Cr, Fe, Mn, Nb, Ni, V), non-ferrous metals (Al, Co, Cu, Mg, Pb, Sn, Ti, Zn), precious metals (Au, Pd), specialty metals (As, Ba, Cd, Ga, Li, Sb, Sr, W, Zr), rare earth elements (Ce, Dy, Gd, La, Nd, Pr, Sm, Y, Yb), and other elements (Ca, Cl, K, P, Rb, Si). Among these elements, Co, Ga, Mg, Nb, P, Pd, Sb, W, and all REE were classified as critical raw materials for the European Union in 2017 [40]. As, Cd, Cr, and Pb, are particularly relevant for compliance with environmental limit values. In addition to Cl, F was determined with the validated method, since halogens can lead to interferences that are caused by precipitation as a result of salt formation with metals [8]. The determination of C and O was used to characterize the sample matrix and to select the digestion acids. A total of 19 elements for BATT and 32 elements for MIN were selected, analyzed, and used for comparison with the simplified methods (see Table 1).

2.2.3. Wet-Chemical Analysis

Table 2 summarizes the wet-chemical analysis of the validated and in-house method for BATT and MIN. The validated wet-chemical analysis of BATT comprised two different reagent mixtures: Acid (1) HNO3-HCl (aqua regia, AR) and Acid (2) HNO3-H2O2. For wet-chemical analysis of MIN, two reagent mixtures were performed: Acid (1) HNO3-HCl (aqua regia) and Acid (2) HCl-HNO3-HF. Additionally, Acid (3) H2SO4-HNO3 was used as the reference digestion for As in both samples to take into account its high volatility as a hydride builder in wet-chemical digestion processes that occur even with closed digestion systems like microwave-assisted digestion (MWD) or high-pressure asher (HPA-S, Anton Paar) [43]. MWD was carried out while using a microwave MLS START, followed by element detection with ICP-OES Varian Vista Pro Radial and ICP-MS Agilent 8800 QQQ. Measurements with ICP-MS were done with an Octopole Reaction System (ORS), varying the reaction gases helium and oxygen.
For in-house wet-chemical analysis of BATT and MIN samples, six replicates were weighed in on 0.2 g (n = 6) and then dissolved with microwave-assisted digestion. For BATT, two reagent mixtures were performed for the selected elements based on L1 comprising Acid (1) HNO3-HCl (aqua regia) and Acid (2) HNO3-H2O2. The MIN sample was dissolved in one reagent mixture that consisted of 10 mL aqua regia. MWD for BATT and MIN were performed with CEM MarsXpress and CEM Mars 5, respectively. After cooling to approx. 30 °C, all of the solutions were filtered through a Munktel 131 filter (rinsed with 0.5 M HNO3) in a 50 mL flask and filled up with 0.5 M HNO3. The elemental mass fractions were determined with ICP–OES Thermo Scientific iCap 6000 Series and ICP–MS Thermo Scientific iCap Q using kinetic energy discrimination mode (KED) with the reaction gas mode helium as shown in Table 2.
Halogens are of analytical importance due to their high electronegativity and reactivity, which can lead to interferences, for example, which are caused by precipitation due to the salt formation with metals. The total halogen content (F, Cl) in BATT was analyzed with a PARR® Oxygen digestion bomb (IKA) with 30 bar of pressure and ion-chromatography (IC) detection following DIN EN 14582 [44] (see Supplementary Materials Table S1). Oxygen and carbon contents were determined with the melting combustion method. Both of the samples were combusted at 3000 °C for O and 2000 °C for C and detected by infrared while using LECO CS844 and LECO TC-500, respectively.

2.2.4. Wavelength Dispersive X-ray Fluorescence Spectrometry (WD-XRF)

In addition to the validated wet-chemical method, the MIN sample was analyzed with WD-XRF. After testing other sample preparations, such as the direct measurement on the powder sample and the production of a wax pellet, the fusion method with the following specifications was selected. A fusion of 8 g Lithium tetraborate and Lithium metaborate was added to 1 g mining waste and then melted at 1200 °C in a muffle furnace Fluxana Vitriox. The melted material was subsequently transferred into a platinum dish. After cooling down, the main elements were directly measured in the standardless measurement mode (10 min) with WD-XRF Primus IV (Rigaku, Japan), following the Empa-SOP No. 6000 (see Table 3). WD-XRF measurement was performed for Al, Ca, Fe, K, Mg, Mn, Na, P, Rb, Si, V, Y, and Zn with replicates of five. Elements with an atomic number < Z 12 cannot be detected with the applied method, since the elements do not provide sufficiently meaningful energy spectra to enable quantification. For quality assurance, the certified reference sample CCRMP REE-1 [42] was included in the measurement series. The detection limit for the elements in the fusion tablet corresponds to approximately 0.01% due to dilution with the fluxing agent.

2.2.5. Energy Dispersive X-ray Fluorescence Spectrometry (ED-XRF)

Chemical analysis using ED-XRF is gaining importance for fast and non-destructive testing. This technology is used for the analysis of scrap metals or soil samples and, more recently, for the analysis of additives in plastics [45,46,47,48,49]. ED-XRF analysis was conducted by L2 with a handheld 50 keV ED-XRF ‘NITON XL3t-Air’ (Analyticon). Without further sample preparation, the powdery material was transferred to the sample cups (SC-4331 by FluXana) while using a polypropylene foil. The subsamples (seven for BATT, eight for MIN) were measured in ‘MINING’ mode with a total measuring time of 120 s, 30 s per filter: main, low, high, and light. The limits of detection (LODs) vary element-wise from a few ppm to a few hundred ppm for light elements, such as Mg [50]. Elements with an atomic number less than Z 12 cannot be detected. Limit of quantification (LOQ) is approximately 0.05%. This instrument is calibrated for the following elements in a mineral SiO2 matrix (MINING mode): Mg, Al, Si, P, S, Cl, K, Ca, Ti, V, Cr, Mn, Fe, Co, Ni, Cu, Zn, Ga, Ge, As, Br, Rb, Sr, Y, Zr, Nb, Mo, Pd, Ag, Cd, In, Sn, Sb, Ba, Hf, Ta, W, Re, Pt, Au, Pb, La, Ce, Pr, Nd, Th, and U. The number of individual measurements per subsample was 36 for BATT and 24 for MIN. If the double standard deviation of one measurement is more than 0.5 times the measured value, the ED-XRF returns ‘<LOD’ and the number of measurements per sample decreases.

2.3. Data Analysis

Firstly, material homogeneity was checked while using the ED-XRF pre-scanning results and ANOVA F test. Secondly, method accuracy was assessed based on element recovery rates using spiking tests with and without the sample matrix. Thirdly, consistency between the results that were obtained with simplified and validated methods was tested regarding significance while using a t-test and relative difference.

2.3.1. Test of Sample Homogeneity

Material homogeneity for the tested materials is a prerequisite to allow for the comparison of the different chemical analysis methods and to exclude deviations due to the heterogeneous distribution of elements. Sample homogeneity was tested element-wise with ANOVA F test [51] while using the ED-XRF results, by comparing the variance between the n subsamples to the variance of repeated measurements within each subsample. The number of detectable elements in both samples decreased due to the element concentration being below LOD and the measuring range of the ED-XRF. Consequently, the number of used elements decreased from 13 to 19 for BATT and from 22 to 32 for MIN. The parameters for the ANOVA F test are:
  • Null hypothesis H0: all subsample mean values are equal
  • Level of significance α = 0.01
  • BATT: n = 5, υ1 = 6 and υ2 = 28 (degrees of freedom for the F distribution)
  • MIN: n = 3, υ1 = 7 and υ2 = 16
The null hypothesis H0 is rejected if F (α = 0.01) ≥ f, i.e., the mean values are not equal, and the sample cannot be assumed to be homogeneous. The values for f are 3.53 and 4.03 for BATT and MIN, respectively.

2.3.2. Method Validation: Accuracy and Precision

Method precision, i.e., the repeatability of the analytical procedures, was assessed based on the coefficient of variation (relative standard deviation, RSD) [52]. The method accuracy was validated by means of spiking tests and the calculation of element recovery rates (RR) at three points of the analytical procedure: with liquid standards (RRL), in blind samples (RRB), in the respective sample matrices (RRS) BATT and MIN added before digestion (see Table 4). This procedure, which is known as ‘standard addition’ or ‘spiking’, is used to test the accuracy of an analytical procedure and expresses the congruence between the results of the spiked and the theoretical concentration. The spiking of blinds examines the accuracy of analytical procedures, excluding interferences of other elements and matrix effects. Nevertheless, the spiking of the samples assesses the accuracy under present interdependencies that are caused by the sample matrix. RRS was determined for all the elements measured wet-chemically with the validated as well as the in-house method. Additionally, RRL and RRB were conducted for the in-house method to evaluate the method suitability, excluding the potential matrix effects.
Therefore, elements were added (spiked) at defined concentrations as determined with the ED-XRF analysis. Both spiked and non-spiked samples were digested and analyzed with the same method and settings. The Equations (1) and (2) to calculate the recovery rates are given in the following:
RR ( B , S ) i = [ 1 n i = 1 n ( c B , i m S , B V S ) ] [ 1 n i = 1 n ( c A , i + c S P , i m S , A V S ) ] × 100 %
where c A , i is the concentration of the unspiked sample of element i in mg/L, c B , i is the concentration of the spiked sample of element i in mg/L, c S P is the spike concentration in mg/L, m S , A is the sample mass for digestion of unspiked sample in g, m S , B is the sample mass for digestion of spiked sample in g, RR ( B , S ) i is the recovery rate of the blind (B) or in the sample (S) of element i in %, and V S is the volume of the digestion solution (L).
RRL i = c i c L S , i × 100 %
In Equation (2), c i is the measured concentration of liquid standard of element i in mg/L, c L S , i is the concentration of element i in the liquid standard in mg/L, and RRL i is the recovery rate of liquid standards of element i in percent.
Based on [52,53], we consider a recovery rate of 100 ± 20% to be acceptable and thus regard the analysis method as accurate for the element in the respective sample.

2.3.3. Relative and Significant Differences Between Chemical Analysis Methods

The applicability of simplified analysis methods was evaluated based on the relative difference of mass fraction, as well as a significance test while using a Welch’s t-test. For the relative difference, we accept a deviation of 100 ± 20% (see Section 2.3.2) and consider the analysis method as accurate for the element in the respective sample. The calculation is carried out with the following equation:
r e l a t i v e   d i f f e r e n c e   ( % ) = x ¯ v a l i d a t e d x ¯ s i m p l i f i e d x ¯ v a l i d a t e d × 100 %
in this equation, x ¯ s i m p l i f i e d is the average mass fraction of an element in ppm measured with the simplified method, whereas x ¯ v a l i d a t e d is the average mass fraction of an element in ppm measured with the validated method.
In contrast to relative differences, the t-test considers the deviation of single values around the mean value. A two-sided Welch’s t-test of independent (unpaired) samples was performed [51], with the following specifications:
  • Null hypothesis H0: mean values of both samples are equal
  • Level of significance α = 0.01
  • heterogeneity of variances

3. Results and Discussion

This chapter presents the results of the chemical analysis and discusses the applicability of the simplified methods. Firstly, the results of the homogeneity assessment are addressed, followed by a description of the chemical composition of the two samples that were measured with the validated methods. Subsequently, the applicability of the investigated simplified methods is discussed while using the significance test, the relative difference to the validated analysis results, and the element recovery rates.

3.1. Sample Homogeneity

The homogeneity was tested with ED-XRF results and ANOVA F test for 13 elements for BATT and 22 elements for MIN (see Supplementary Materials Table S3). In the case of BATT, the ANOVA F test shows homogeneous distributions between the subsamples for all elements: Al, As, Cd, Cl, Cu, Fe, Mn, Ni, P, Pb, Sb, Ti, Zn, Zr. The MIN sample can be assumed homogeneous for the following 15 elements: Ba, Ca, Ce, Cl, Co, Ga, La, Nb, Nd, P, Pr, Sn, W, Y, Zn, and Zr. No homogeneous distribution between the subsamples could be achieved in the sample, despite the same sample preparation, i.e., comminution by planetary ball mill, sieving, and sample division by rotary sample divider. Al, K, Si, and Sr exhibit clear heterogeneity (values for F between 6 and 17), whereas Fe, Mg, and Rb only show minor heterogeneity with F close to the critical value (f = 4.03). One possible explanation could be that sample preparation to a particle size < 0.2 mm is insufficient for producing a homogeneous sample for these elements. With regard to Al, Si, and Mg, it is crucial to mention that ED-XRF analysis for light elements is prone to errors (see Section 3.4). Therefore, the results of these elements must be considered with caution in the subsequent evaluation, since significant differences in the measurement results cannot be exclusively attributed to the analytical method.

3.2. Elemental Composition Determined with the Validated Method

Figure 2 displays the elemental mass fraction of both samples, determined with the validated method. All of the results show high precision and accuracy within the given range of 100% ± 20%, expressed as relative standard deviation (RSD) and the recovery rate in sample matrices (RRS), respectively. The results of the validated method are used as reference for the comparison of the simplified methods because of the in-depth analysis and the quality assurance measures applied. The determined mass fractions of the elements in both samples range from double-digit mass percentages to a few milligrams per kilogram (ppm).
The BATT sample is an oxidized mineral matrix with an oxygen mass fraction of 31% and several metals above one percent by mass, as shown in Figure 2a: Mn (17%), Fe (8%), Al (7%), Cu (4%), and Zn (1.5%). In addition to oxygen, the analyzed elements comprise 48% of the sample material (Figure 2b). The halogens fluorine and chlorine, which originate from battery cathode and electrolyte, show mass fractions of 2% and 0.6%, respectively. The metals Co and Ti, as well as P and carbon (0.9%), have mass fractions of less than one mass percent. Furthermore, the BATT sample contains the following elements in mass fractions below 0.1%: As, Sb, Pb. Precious metals (Au, Pd), REE (Ce, La), as well as Cd and V, occur in mass fractions below 100 ppm (<0.01%). We assume that heavy metals (Pb, Cd) originate from other battery systems in the sample, such as nickel-cadmium (NiCd) or lead-acid (PbA) batteries.
The MIN sample is an oxidized iron-silicon-matrix (O: 37%, Fe: 36%, Si: 14%) with portions of Mg (3%), Al (3%), Ca (2%), and K (1.4%). Together with oxygen, the proportion of detected elements is 99% (see Figure 2c,d). Phosphorus occurs in the apatite, tailing with a mass fraction of 0.3%. Other metals (Mn, V, Sn,) and non-metals (Rb) can be found in mass fractions of 100 to 1000 ppm. Moreover, the REE Ce (650 ppm), La (350 ppm), Nd (220 ppm), and Y (100 ppm) are present in mass fractions above 100 ppm (0.01%). In contrast, the other analyzed REE (Dy, Gd, Pr, Sm, Yb) and all specialty metals (As, Ba, Ga, Li, Sr, W, Zr) show a mass fraction below 100 ppm.
All elements, except As in HNO3-H2O2 (Acid (2)), showed good recovery rates. The low carbon content in the samples (<20%) reduces the risk of absolute loss of arsenic in the form of arsenic hydride compounds in digestions with aqua regia or nitric acid processes [43]. However, when comparing the acid mixtures tested, the use of HNO3-H2O2 resulted in an underestimation of approximately 40% and low recovery of 11%. In contrast, the use of aqua regia and H2SO4-HNO3 provided good results and showed RRS close to 100% (see Supplementary Materials Figure S1).

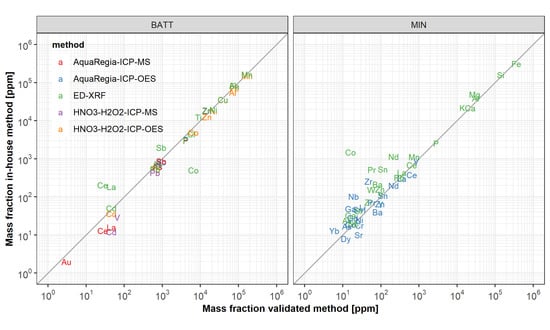
3.3. Applicability of Wet-Chemical In-House Methods

The results of the validated method are used as the reference value for assessing the applicability of simplified methods. Overall, the simplified methods include analysis with AR and ICP-OES for both of the samples. In addition, a second digestion acid (HNO3-H2O2) and the change of the detection device (OES, MS) were tested for the BATT sample. The method accuracy of the simplified analysis setup (digestion acid and detector) was checked by means of (a) element recovery in the blind sample (RRB), (b) spiking of the sample matrices (RRS), and (c) method precision expressed as RSD. The applicability of the simplified methods was verified while using the relative difference from the validated value and the Welch’s t-test results. All of the detailed results can be found in Supplementary Materials Tables S5–S8.
Good measurement accuracy was proven for RRL (without the influence of digestion and sample matrix), RRB (with the influence of the digestion acid), as well as RRS (with matrix influence) for all method variations and most of the elements in both samples showing element recoveries of 100% ± 20%. Moreover, high precision can be observed for most elements having an average RSD of approx. 6%. Nonetheless, underestimations were detected for Zn that was analyzed with HNO3-H2O2 and ICP-MS (RRB 77%, RRS 71%). In contrast, high overestimations in RRS are observed for ICP-MS measurements of Cd (HNO3-H2O2, 245%), Ce (AR, 142%), and La (AR, 160%).
Figure 3 shows the mass fractions of the analyzed elements of both samples as a comparison of the in-house (y-axis) and validated method (x-axis), being differentiated by digestion acid and the detection method. If an element is precisely on the 1:1 slope, the deviation between both methods is close to or exactly 0. Furthermore, the upper figures show the elements without significant difference (‘No’) whereas the lower figures show elements with a significant difference to the validated methods (‘Yes’), according to the t-test.

3.3.1. Acid Digestion

Both acid mixtures for the BATT sample led almost exclusively to underestimations, whereas the relative difference generally decreased with increasing element concentration. On the other hand, both under- (down to −65%) and overestimation (up to +450%) is observed for the AR digestion of the MIN sample, in which only the elements below 1000 ppm were wet-chemically analyzed. Although AR is commonly applied for various ores in literature [8,54], the application of HF blends is necessary for breaking silicate structures. For the analysis of trace elements in carbon-containing and silicate-rich samples, the complete digestion with mixtures of HNO3-HF or AR-HF is recommended [54,55,56].
Hence, underestimations in the silicon-rich MIN sample (13% Si) can mainly be attributed to incomplete digestion. Nevertheless, the use of AR to digest REE and other specialty elements (As, Au, P, Sb) proved to work well for both samples in the validated method. Moreover, HNO3-H2O2 can be used for the ferrous and non-ferrous metals in BATT. Therefore, deviations to the simplified methods are mainly caused by the detection method and matrix interferences. In contrast, the validated method applied HF in MIN for Cr, Nb, Ni, Co, Sn, and most specialty metals. For the other target elements, non-destructive WD-XRF was employed to avoid any interferences of acid digestion.

3.3.2. Element Detection with ICP-OES

The concentration range of the element to be measured and the device-specific determination limit (LOQ) primarily limit the applicability of ICP-OES and ICP-MS. When changing detectors for the BATT sample, some ferrous and non-ferrous elements (Fe, Mn, Ni, Al, Co, Cu) cannot be measured with the ICP-MS (above detection range) and most of the elements below 100 ppm (Au, Ce, La, V, Pd) cannot be measured with the ICP-OES (below LOQ).
Regardless of the acid choice, ICP-OES shows underestimations of about 10–25% for almost all elements of the BATT sample for RRS as well as in comparison to the validated method. Given the similar sample preparation and acid selection for BATT, the deviation from the validated method can be attributed to matrix interferences in ICP-OES, such as inter-element effects due to ionization or chemical interferences (halogens), and spectral interferences [57]. Examples of possible spectral interferences occurring in the BATT sample are Fe (238.2 nm) and Co (238.8 nm), as well as Zn (206.2 nm) and Sb (206.8 nm).
Similarly, the use of ICP-OES (with AR) for MIN shows slightly lower element recoveries (RRS), except for Ga and Dy. However, in comparison to the validated method, both over- and underestimations with partly significant deviations are observed for several elements. This simplified method proved to be applicable for some elements (Ni, V, Co, Sn, and Nd), with relative differences below 20%. Higher relative differences, but no significant differences, were identified for Zn, As, Dy, Pr, and Y. However, single elements deviate remarkably from the reference value, despite good element recoveries, such as Nb (440%), Ga (200%), Zr (450%), and Yb (120%).
In other words, the simplified use of ICP-OES (with aqua regia) did not provide satisfying results for any of the two samples (MIN and BATT). In contrast to BATT, the results for MIN show two-sided tendencies with, e.g., quadruple overestimations as compared to the reference value.

3.3.3. Element Detection with ICP-MS

Figure 3 shows the ICP-MS measurement results of the BATT sample. In comparison to ICP-OES, element recovery rates in the sample (RRS) deviate more due to matrix interferences. Accordingly, Zn shows low RRS (70%), whereas Cd (250%), Ce (150%), and La (160%) show very high RRS (Supplementary Materials Table S8). A low RRS leads to an underestimation of the element (negative relative difference), as observed for As (−16%), Au (−33%), P (−16%), Pb (−33%), and Sb (−6%). However, this relationship cannot always be confirmed due to matrix interferences, so that underestimations can be observed for Ce (−52%), La (−65%), and Cd (−74%), despite high RRS and overestimations for Zn (+21%), despite low RRS.
While the ICP-OES results frequently showed underestimations of 10–25%, the ICP-MS deviations are for most elements between −25 and +75%. The simplified analysis using ICP-MS and AR showed good results exclusively for Sb and As with small deviation and no significant difference. Matrix interferences in ICP-MS measurement were identified for most of the elements in BATT. La, Ce, and V are disturbed on all available isotopes due to the main elements of the sample, which can cause large analytical errors on REEs with ICP-MS technique [56]. An interference-free measurement, i.e., avoidance of overlapping peaks in the analysis spectrum, was only possible with the ICP-MS while using oxygen reaction gas mode shifting the element mass to the respective oxide mass, e.g., 139La to 155LaO and 140Ce to 156Ce. However, this technique required appropriate laboratory equipment and it was explicitly excluded in the simplified method.

3.4. Applicability of ED-XRF Measurements

The ED-XRF is a less precise measuring method when compared to the wet-chemical analysis, showing a higher average RSD of 15%, but rarely exceeding 20%. Figure 4a shows the mass fractions of the analyzed elements of both samples when comparing the ED-XRF (y-axis) and validated method (x-axis). Elements that lie directly on the 1:1 slope depict no deviations from the reference value. Elements in black have no significant difference, whereas red elements have a significant difference to the validated methods according to the t-test.
For mass fractions below 1000 ppm (0.1%), the measurement is only accurate for a few elements, while most of the values deviate significantly and are generally over-estimated. For element concentrations above 1000 ppm, the ED-XRF method shows good precision (RSD < 20%) and lower deviations for the tested samples. In general, only a few elements deviate less than 20% from the reference value, i.e., Al, As, Cd, Cu, Fe, Mn, Ni, Pb in BATT and Ca, Ce, Fe, Nb, P, Rb, Si, Y in MIN. Even fewer elements show no significant difference, i.e., As, Fe, Mn in BATT and Ca, Ce, Nb, Y in MIN.
LODs for ED-XRF are dependent on influencing factors, such as testing time, matrix composition, level of statistical confidence [50], and element selection (overlapping peaks). For mining matrices, LODs that are below 100 ppm are stated for elements Z > 12 except Co, which in silicon matrices with Fe shows higher LODs [50] due to possible interferences. In the two samples, Co shows remarkable deviations, as it is strongly under-estimated in BATT (−92% at 6500 ppm) and strongly over-estimated in MIN (+9200% at 16 ppm).
Figure 4b shows the relative difference of the measured element mass fractions from the reference value in relation to the atomic number (Z). In principle, the detection of heavier elements, such as REE, is feasible with the applied high-energy (50 keV) ED-XRF due to the increased excitation energy [22]. However, it can be seen for almost all REE in BATT and MIN that ED-XRF performs poorly (see detailed data in Supplementary Materials Tables S7 and S8). The examples of Ce and La in BATT show to what extent matrix interferences can influence the result, depending on the individual sample composition. In other words, elements up to Z 50 are usually detected while using the characteristic emission spectra of Kα and Kβ. In contrast, heavier elements are quantified by their L-lines due to the limited excitation energy, but consequently these spectra may overlap with the K-lines of light elements. This effect will be reinforced if the interfering element occurs at high mass fractions in the sample and it will lead to a decrease in precision and partly significant deviations [22,58]. While Ce and La deviate slightly in MIN, significant deviations of 300% and over 600% can be observed in BATT for La and Ce, respectively. For instance, the high mass fraction of Ti (8900 ppm, Kα 4.51, Kβ 4.93) originating from, e.g., TiO2 lithium battery systems [59], can cause interferences with the detection of Ce (Lα 4.84, Lβ 5.26) and La (Lα 4.65, Lβ 5.04) [60]. The ED-XRF energy spectra of Co and La in BATT can be found in Supplementary Materials Figures S2 and S3.

4. Conclusions

The investigated battery ash BATT and mining waste MIN samples present complex minerals matrices exhibiting highly different mass contents of many elements. Generating valid and accurate data on the composition of these anthropogenic mineral residues for an urban mine knowledge database poses challenges to chemical analysis due to matrix interferences. This is in agreement with the results of our recent study on printed circuit boards [31], which indicated that multi-element chemical analysis of complex anthropogenic matrices with a high organic content is challenging and it can easily lead to inaccurate compositional data.
Reliable results were obtained developing validated methods applying laborious matrix- and element-specific investigations while using varying acid mixtures, detection methods, and different parameter settings, in combination with sophisticated quality assurances measures.
This study shows that a simplified application of microwave-assisted digestion with aqua regia or HNO3-H2O2 and subsequent measurement with ICP-OES or ICP-MS did not prove to be applicable for half of the analyses. There is no clear dependence of acid selection or mass concentration on the accuracy of the in-house method. Nevertheless, for BATT, a tendency is discernible that elements with high mass fractions can be more accurately determined. The analyses with ICP-OES and ICP-MS frequently showed deviations of 10–25% and 25–75%, respectively. Significant deviations from the validated value were observed, despite internal quality assurance, demonstrated as high precision (RSD) and good accuracy (RRL, RRB, RRS).
ED-XRF analysis can only be used to a limited extent without matrix-specific calibration. However, semi-quantitative analysis with deviations that were below 100% proved to be feasible for most elements (except Co) having (a) an atomic number between Z 12 and Z 50, and (b) mass fractions above 1000 ppm. Strong deviations up to 90 times the validated value were observed, particularly for elements with low mass fractions.
In conclusion, the tested simplified chemical analysis methods are not generally applicable to the tested anthropogenic mineral matrices. The mineral character and the presence of many elements in different mass concentrations make simplified methods prone to errors due to matrix interferences. Internal quality assurance steps for the simplified method did not ensure the identification of these interferences. Consequently, additional measures are required for complex mineral matrices, such as laborious method development, the provision of appropriate reference materials, or sample- and element-specific method validation within interlaboratory tests.

Supplementary Materials

The following are available online: at https://www.mdpi.com/2079-9276/8/3/132/s1, Figure S1: Mass fraction and recovery of arsenic in BATT and MIN sample, Figure S2: The ED-XRF energy spectrum (4–14 keV) of the BATT measurement, Figure S3: The ED-XRF energy spectrum (3–7 keV) of the BATT measurement, Table S1: Parameters of the validated method for determination of total halogens F and Cl, Table S2: Recovery rates measured in liquid standard samples, Table S3: Homogeneity test results for BATT and MIN sample, Table S4: Element composition of BATT and MIN sample determined with the validated method, Table S5: Chemical analysis results of the wet-chemical in-house method, Table S6: Chemical analysis results of the XRF in-house method, Table S7: Overview of applicability of in-house methods for MIN sample, Table S8: Overview of applicability of in-house methods for BATT sample.

Author Contributions

Conceptualization, P.M.M., A.N.L., N.K., P.W. and V.S.R.; methodology, P.M.M., A.N.L., N.K., V.S.R., R.F. and M.R.; software, P.M.M., A.N.L. and M.R.; validation, P.M.M., R.F., C.S. and C.K.; formal analysis, P.M.M., N.K. and A.N.L.; investigation, P.M.M., R.F., C.S. and C.K.; resources, P.M.M., R.F., C.S. and C.K.; data curation, P.M.M.; writing—original draft preparation, P.M.M.; writing—review and editing, P.M.M., N.K., A.N.L., R.F., C.S., M.R., P.W. and V.S.R.; visualization, P.M.M.; supervision, A.N.L., V.S.R. and P.W.; project administration, V.S.R. and P.W.; funding acquisition, P.W. and V.S.R.

Funding

This research was funded by the European Union’s Horizon 2020 research and innovation program (grant agreement No. 641999) as part of the project ‘ProSUM–Prospecting Secondary raw materials in the Urban mine and Mining waste’.

Acknowledgments

The authors would like to thank Davide Bleiner, Empa Dübendorf, for the review of the original manuscript. We acknowledge support by the German Research Foundation and the Open Access Publication Fund of TU Berlin.

Conflicts of Interest

The authors declare no conflict of interest. The study was designed in collaboration with the project partners. The funders had no role in the design of the study; in the collection, analyses, or interpretation of data; in the writing of the manuscript, or in the decision to publish the results.

References

  1. Eurostat. Waste Statistics; Eurostat: Brussels, Belgium, 2019; Available online: https://ec.europa.eu/eurostat/statistics-explained/index.php/Waste_statistics#Total_waste_generation (accessed on 7 March 2019).
  2. Commission of the European Communities. The Raw Materials Initiative—Meeting Our Critical Needs for Growth and Jobs in Europe COM; Commission of the European Communities: Brussels, Belgium, 2008; Available online: https://eur-lex.europa.eu/legal-content/EN/TXT/PDF/?uri=CELEX:52008DC0699&from=EN (accessed on 28 February 2019).
  3. European Commission. Report on Critical Raw Materials for the EU Critical Raw Materials Profiles; European Commission: Brussels, Belgium, 2017. [Google Scholar]
  4. Normenausschuss Wasserwesen (NAW) im DIN. Characterization of Waste—Digestion for Subsequent Determination of Aqua Regia Soluble Portion of Elements; Deutsche Fassung EN 13657:2002; Beuth Verlag GmbH: Berlin, Germany, 2003. [Google Scholar]
  5. Normenausschuss Wasserwesen (NAW) im DIN. Soil Quality—Determination of Trace Elements in Extracts of Soil by Inductively Coupled Plasma—Atomic Emission Spectrometry (ICP-AES); German Version ISO 22036:2008; Beuth Verlag GmbH: Berlin, Germany, 2009. [Google Scholar]
  6. Normenausschuss Wasserwesen (NAW) im DIN. Deutsches Institut Für Normung E. V. Soil Quality—Determination of Cadmium, Chromium, Cobalt, Copper, Lead, Manganese, Nickel and Zinc in Aqua Regia Extracts of Soil—Flame and Electrothermal Atomic Absorption Spectrometric Methods; German Version ISO 11047:1998; Beuth Verlag GmbH: Berlin, Germany, 2003. [Google Scholar]
  7. Normenausschuss Wasserwesen (NAW) im DIN. Characterization of Waste—Microwave Assisted Digestion with Hydrofluoric (Hf), Nitric (Hno3) and Hydrochloric (Hcl) Acid Mixture for Subsequent Determination of Elements, German version EN 13656:2002; Beuth Verlag GmbH: Berlin, Germany, 2003. [Google Scholar]
  8. Bock, R. Handbuch Der Analytisch-Chemischen Aufschlussmethoden; WILEY-VCH Verlag GmbH: Weinheim, Baden-Wutenberg, Germany, 2001; ISBN 352729791X. [Google Scholar]
  9. Meshram, P.; Abhilash; Pandey, B.D.; Mankhand, T.R.; Deveci, H. Acid baking of spent lithium ion batteries for selective recovery of major metals: A two-step process. J. Ind. Eng. Chem. 2016, 43, 117–126. [Google Scholar] [CrossRef]
  10. Meshram, P.; Pandey, B.D.; Mankhand, T.R. Hydrometallurgical processing of spent lithium ion batteries (LIBs) in the presence of a reducing agent with emphasis on kinetics of leaching. Chem. Eng. J. 2015, 281, 418–427. [Google Scholar] [CrossRef]
  11. Meshram, P.; Pandey, B.D.; Mankhand, T.R. Recovery of valuable metals from cathodic active material of spent lithium ion batteries: Leaching and kinetic aspects. Waste Manag. 2015, 45, 306–313. [Google Scholar] [CrossRef] [PubMed]
  12. Swain, B.; Jeong, J.; Lee, J.-C.; Lee, G.-H.; Sohn, J.-S. Hydrometallurgical process for recovery of cobalt from waste cathodic active material generated during manufacturing of lithium ion batteries. J. Power Sources 2007, 167, 536–544. [Google Scholar] [CrossRef]
  13. Kang, J.; Senanayake, G.; Sohn, J.; Shin, S.M. Recovery of cobalt sulfate from spent lithium ion batteries by reductive leaching and solvent extraction with Cyanex 272. Hydrometallurgy 2010, 100, 168–171. [Google Scholar] [CrossRef] [Green Version]
  14. Chen, L.; Tang, X.; Zhang, Y.; Li, L.; Zeng, Z.; Zhang, Y. Process for the recovery of cobalt oxalate from spent lithium-ion batteries. Hydrometallurgy 2011, 108, 80–86. [Google Scholar] [CrossRef]
  15. Lee, C.K.; Rhee, K.-I. Reductive leaching of cathodic active materials from lithium ion battery wastes. Hydrometallurgy 2003, 68, 5–10. [Google Scholar] [CrossRef]
  16. Golmohammadzadeh, R.; Rashchi, F.; Vahidi, E. Recovery of lithium and cobalt from spent lithium-ion batteries using organic acids: Process optimization and kinetic aspects. Waste Manag. 2017, 64, 244–254. [Google Scholar] [CrossRef]
  17. Li, L.; Ge, J.; Chen, R.; Wu, F.; Chen, S.; Zhang, X. Environmental friendly leaching reagent for cobalt and lithium recovery from spent lithium-ion batteries. Waste Manag. 2010, 30, 2615–2621. [Google Scholar] [CrossRef]
  18. Moyle, P.R.; Causey, J.D. Chemical Composition of Samples Collected from Waste Rock Dumps and Other Mining-Related Features at Selected Phosphate Mines in Southeastern Idaho, Western Wyoming, and Northern Utah; US Geological Survey: Reston, VA, USA, 2001. Available online: https://pubs.usgs.gov/of/2001/0411/pdf/OF01-411.pdf (accessed on 24 August 2018).
  19. Pant, D.; Dolker, T. Green and facile method for the recovery of spent Lithium Nickel Manganese Cobalt Oxide (NMC) based Lithium ion batteries. Waste Manag. 2017, 60, 689–695. [Google Scholar] [CrossRef]
  20. Zheng, X.; Gao, W.; Zhang, X.; He, M.; Lin, X.; Cao, H.; Zhang, Y.; Sun, Z. Spent lithium-ion battery recycling—Reductive ammonia leaching of metals from cathode scrap by sodium sulphite. Waste Manag. 2017, 60, 680–688. [Google Scholar] [CrossRef] [PubMed]
  21. Jiang, Y.; Zhang, Y.; Yan, X.; Tian, M.; Xiao, W.; Tang, H. A sustainable route from fly ash to silicon nanorods for high performance lithium ion batteries. Chem. Eng. J. 2017, 330, 1052–1059. [Google Scholar] [CrossRef]
  22. ALS Minerals. Portable XRF in the Mining Industry. 2014. Available online: https://www.alsglobal.com/-/…/als/…/portable-xrf-analysis-technical-note-2014.pdf (accessed on 21 June 2018).
  23. Chen, C.-S.; Shih, Y.-J.; Huang, Y.-H. Recovery of lead from smelting fly ash of waste lead-acid battery by leaching and electrowinning. Waste Manag. 2016, 52, 212–220. [Google Scholar] [CrossRef] [PubMed]
  24. Perez, E.; Andre, M.-L.; Navarro Amador, R.; Hyvrard, F.; Borrini, J.; Carboni, M.; Meyer, D. Recovery of metals from simulant spent lithium-ion battery as organophosphonate coordination polymers in aqueous media. J. Hazard. Mater. 2016, 317, 617–621. [Google Scholar] [CrossRef] [PubMed]
  25. Zhang, P.; Yokoyama, T.; Itabashi, O.; Suzuki, T.M.; Inoue, K. Hydrometallurgical process for recovery of metal values from spent lithium-ion secondary batteries. Hydrometallurgy 1998, 47, 259–271. [Google Scholar] [CrossRef]
  26. Li, L.; Ge, J.; Wu, F.; Chen, R.; Chen, S.; Wu, B. Recovery of cobalt and lithium from spent lithium ion batteries using organic citric acid as leachant. J. Hazard. Mater. 2010, 176, 288–293. [Google Scholar] [CrossRef] [PubMed]
  27. ALS Minerals. Fire Assay Technical Note 2012. 2012. Available online: https://alsglobal.azureedge.net/-/media/als/resources/services-and-products/geochemistry/technical-notes/fire-assay-technical-note-2012.pdf?rev=a63520e2ed72416eb5d55d3ce6bc8cde (accessed on 26 July 2019).
  28. ALS Minerals. Technical Note: Super Trace Methods for Soil Samples. 2012. Available online: https://alsglobal.azureedge.net/-/media/als/resources/services-and-products/geochemistry/technical-notes/super-trace-methods-for-soil-samples.pdf?rev=774caa7f48184edf9624d7a1f3a37856 (accessed on 28 May 2018).
  29. Yang, Y.; Huang, G.; Xu, S.; He, Y.; Liu, X. Thermal treatment process for the recovery of valuable metals from spent lithium-ion batteries. Hydrometallurgy 2016, 165, 390–396. [Google Scholar] [CrossRef]
  30. Götze, R.; Astrup, T.F. Optimal acid digestion for multi-element analysis of different waste matrices. In Proceedings of the 5th Conference on Engineering for Waste and Biomass Valorisation, Rio de Janeiro, Brazil, 25 August 2014. [Google Scholar]
  31. Korf, N.; Løvik, A.N.; Figi, R.; Schreiner, C.; Kuntz, C.; Mählitz, P.M.; Rösslein, M.; Wäger, P.; Rotter, V.S. Multi-element chemical analysis of printed circuit boards—Challenges and pitfalls. Waste Manag. 2019, 92, 124–136. [Google Scholar] [CrossRef] [PubMed]
  32. VARTA Microbattery GmbH. Safety Data Sheet MSDS 2.001.020: Lithium Thionyl Chloride Cylindrical Cell; VARTA Microbattery GmbH: Elwangen, Germany, 2016; Available online: https://products.varta-microbattery.com/applications/mb_data/documents/material_safety_data_sheets/MSDS_20_Primary_Lithium_Cylindrical_Series_ER_en.pdf (accessed on 26 July 2018).
  33. Berndt, D.; Spahrbier, D. Batteries. In Ullmann’s Encyclopedia of Industrial Chemistry; Wiley-VCH: Weinheim, Germany, 2011; pp. 41–93. [Google Scholar]
  34. Länderarbeitsgemeinschaft Abfall (LAGA). Guideline for the Procedure for Physical, Chemical and Biological Investigations in Connection with the Recycling/Disposal of Waste to the Guideline for Sampling (LAGA PN98); Notice M32. German Version; Mitteilungen der Länderarbeitsgemeinschaft Abfall (LAGA), 2001; Available online: https://www.laga-online.de/Publikationen-50-Mitteilungen.html (accessed on 25 June 2019).
  35. Normenausschuss Wasserwesen (NAW) im DIN. Characterization of Waste—Calculation of Dry Matter by Determination of Dry Residue or Water Content, German version EN 14346:2006; Beuth Verlag GmbH: Berlin, Germany, 2007. [Google Scholar]
  36. Luke, E. Technical Report on the Grängesberg Iron Mine Resource Estimate; RPA: Bergslagen, Sweden, 2014; Available online: http://angleseymining.co.uk/projects/grangesberg/29092014-release.pdf (accessed on 17 March 2019).
  37. Geological Survey of Finland (GTK); Geological Survey of Norway (NGU); Geological Survey of Russia (VSEGEI); Geological Survey of Sweden (SGU); SC Mineral. FODD: Fennoscandian Ore Deposit Database; Geological Survey of Finland: Esbo, Finland, 2011; Available online: http://en.gtk.fi/ExplorationFinland/fodd (accessed on 30 November 2018).
  38. Eilu, P.; Boyd, R.; Hallberg, A.; Korsakova, M.; Krasotkin, S.; Nurmi, P.A.; Ripa, M.; Stromov, V.; Tontti, M. Mining History of Fennoscandia; Geological Survey of Finland: Esbo, Finland, 2012; Volume 53, pp. 19–32. [Google Scholar]
  39. Geological Survey of Finland (GTK). Fennoscandian Mineral Deposits Application, Ore Deposits Database and Maps: Essential Information on a Still Under-Explored Region; Geological Survey of Finland: Esbo, Finland, 2017; Available online: http://en.gtk.fi/informationservices/databases/fodd/ (accessed on 27 May 2018).
  40. European Commission. List of Critical Raw Materials for the EU 2017; European Commission: Brussels, Belgium, 2017; Available online: https://eur-lex.europa.eu/legal-content/EN/TXT/PDF/?uri=CELEX:52017DC0490&from=EN (accessed on 24 August 2018).
  41. Normenausschuss Qualitätsmanagement, Statistik und Zertifizierungsgrundlagen (NQSZ) im DIN. General Requirements for the Competence of Testing and Calibration Laboratories; (ISO/IEC DIS 17025:2016); Normenausschuss Qualitätsmanagement, Statistik und Zertifizierungsgrundlagen (NQSZ) im DIN: Berlin, Germany, 2017. [Google Scholar]
  42. Natural Resources Canada. Certificate of Analysis REE-1. Certified Reference Material for Rare Earth Elements, Zirconium and Niobium; Natural Resources Canada: Ottawa, ON, Canada, 2014. Available online: http://www.nrcan.gc.ca/sites/www.nrcan.gc.ca/files/mineralsmetals/files/pdf/tech-tech/ree-1-2a-en.pdf (accessed on 28 May 2018).
  43. Anton Paar GmbH. High Pressure Asher; Anton Paar GmbH: Osterfelden, Germany, 2016; Available online: https://www.anton-paar.com/?eID=documentsDownload&document=837&L=0 (accessed on 29 August 2018).
  44. DIN-Normenausschuss Wasserwesen (NAW). Characterization of Waste—Halogen and Sulfur Content—Oxygen Combustion in Closed Systems and Determination Methods; DIN EN 14582; Beuth Verlag GmbH: Berlin, Germany, 2007. [Google Scholar]
  45. Thermo Scientific. Slag Analysis with the Thermo Scientific Niton XL3 GOLDD Series XRF Analyzer. In Fast, Lab-Quality Analysis on the Production Floor; Thermo Scientific: Waltham, MA, USA, 2009; Available online: https://assets.thermofisher.com/TFS-Assets/CAD/Application-Notes/Slag-Analysis-Application-Summary.pdf (accessed on 29 March 2019).
  46. Hall, G.E.M.; Bonham-Carter, G.F.; Buchar, A. Evaluation of portable X-ray fluorescence (pXRF) in exploration and mining: Phase 1, control reference materials. Geochemistry: Exploration, Environment. Analysis 2014, 14, 99–123. [Google Scholar] [CrossRef]
  47. Aldrian, A.; Ledersteger, A.; Pomberger, R. Monitoring of WEEE plastics in regards to brominated flame retardants using handheld XRF. Waste Manag. 2014, 36, 297–304. [Google Scholar] [CrossRef]
  48. Dimitrakakis, E.; Janz, A.; Bilitewski, B.; Gidarakos, E. Determination of heavy metals and halogens in plastics from electric and electronic waste. Waste Manag. 2009, 29, 2700–2706. [Google Scholar] [CrossRef] [PubMed]
  49. Guzzonato, A.; Puype, F.; Harrad, S.J. Improving the accuracy of hand-held X-ray fluorescence spectrometers as a tool for monitoring brominated flame retardants in waste polymers. Chemosphere 2016, 159, 89–95. [Google Scholar] [CrossRef] [PubMed]
  50. Thermo Scientific. Thermo Scientific. Thermo Scientific Niton XL3t GOLDD+Series Mining Analyzers. In Elemental Limits of Detection in SiO2 and SRM Matrices Using Mining Analysis; Thermo Scientific: Waltham, MA, USA, 2010; Available online: https://www.thermofisher.com/order/catalog/product/10131166 (accessed on 28 May 2018).
  51. Wilcox, R.R. Basic Statistics: Understanding Conventional Methods and Modern Insights; Oxford University Press: Oxford, UK, 2009; ISBN 978-0-19-531510-3. [Google Scholar]
  52. ICH. Validation of Analytical Procedures: Text and Methodology Q2(R1); ICH: Geneva, Switzerland, 2005; Available online: http://www.ich.org/fileadmin/Public_Web_Site/ICH_Products/Guidelines/Quality/Q2_R1/Step4/Q2_R1__Guideline.pdf (accessed on 28 August 2018).
  53. Li, H.; Sharp, G.; Pilkington, C.; Pifat, D.; Petteway, S. GLP-compliant assay validation studies: Considerations for implementation of regulations and audit of studies. Qual. Assur. J. 2006, 10, 92–100. [Google Scholar] [CrossRef]
  54. Das, S.; Ting, Y.-P. Evaluation of Wet Digestion Methods for Quantification of Metal Content in Electronic Scrap Material. Resources 2017, 6, 64. [Google Scholar] [CrossRef]
  55. ALS Minerals. Technical Note Geochemical Soil and Sediment Sampling/Analysis Considerations. Available online: https://alsglobal.azureedge.net/-/media/als/resources/services-and-products/geochemistry/technical-notes/geochemical-soil-and-sediment-sampling.pdf?rev=60a26aede15b473998b74c94528041b5 (accessed on 28 May 2018).
  56. Park, C.-S.; Shin, H.S.; Oh, H.; Cho, H.; Cheong, A.C.-S. Trace element analysis of whole-rock glass beads of geological reference materials by Nd: YAG UV 213 nm LA-ICP-MS. J. Anal. Sci. Technol. 2016, 7, 1693. [Google Scholar] [CrossRef]
  57. Kim, J.; Anawati, J.; Azimi, G. Matrix complexity effect on platinum group metals analysis using inductively coupled plasma optical emission spectrometry. J. Anal. At. Spectrom. 2018, 33, 1310–1321. [Google Scholar] [CrossRef]
  58. Byers, H.L.; McHenry, L.J.; Grundl, T.J. XRF techniques to quantify heavy metals in vegetables at low detection limits. Food Chem. X 2019, 1, 100001. [Google Scholar] [CrossRef]
  59. Madian, M.; Eychmüller, A.; Giebeler, L. Current Advances in TiO2-Based Nanostructure Electrodes for High Performance Lithium Ion Batteries. Batteries 2018, 4, 7. [Google Scholar] [CrossRef]
  60. Gallhofer, D.; Lottermoser, B. The Influence of Spectral Interferences on Critical Element Determination with Portable X-Ray Fluorescence (pXRF). Minerals 2018, 8, 320. [Google Scholar] [CrossRef]
Figure 1. Scheme of mechanical processing for the battery ash sample (a) and mining waste sample (b).
Resources 08 00132 g001
Figure 2. Element mass fraction determined with the validated method for BATT (a) and MIN (c). Error bars represent standard deviation. The mass share of detected and not detected elements as well as oxygen is depicted in (b,d). Figure data are presented in the Supplementary Materials Table S4.
Resources 08 00132 g002
Figure 3. Comparison of the element mass fractions determined with in-house and validated methods, differentiated by sample, measurement method, and the result of the significance test. ‘No’ means no significant difference to the validated method, whereas ‘Yes’ indicates a significant difference.
Resources 08 00132 g003
Figure 4. Comparison of the element mass fractions per sample determined with ED-XRF and validated methods, indicating no significant difference in black and significant differences in red letters (a). Relation of the relative difference to the reference values and the element’s atomic number Z for BATT (green) and MIN (blue) (b). Note: Co in MIN is not depicted in the graph (b). Figure data can be found in Supplementary Materials Tables S6–S8.
Resources 08 00132 g004
Table 1. Element group and elements measured in the Battery Ash Sample (BATT) and Mining Waste Sample (MIN) sample.
Element GroupBattery Ash Sample (BATT)Mining Waste Sample (MIN)
Ferrous metalsFe, Mn, Ni, VCr, Fe, Mn, Nb c, Ni, V
Non-ferrous metalsAl, Co c, Cu, Pb, Ti, ZnAl, Co c, Mg c, Sn, Zn
Precious metalsAu, Pd c-
Specialty metalsAs, Cd, Sb cAs, Ba, Ga c, Li, Sr, W, Zr
REECe c, La cCe c, Dy c, Gd c, La c, Nd c, Pr c, Sm c, Y c, Yb c
OtherCl, P, F *, C *, O *Ca, K, P c, Rb, Si, C *, O *
*: not included in comparison but analyzed for interpretation of results and possible interferences, c: Classified as critical raw materials [40].
Table 2. Wet-chemical analysis procedure.
Validated MethodIn-House Method
Microwave-assisted digestion (MWD)
SamplesBATTMINBATTMIN
Device nameMLS STARTMLS STARTCEM Mars 5CEM MarsExpress
Acid (1): mixture7 mL aqua regia (AR)7 mL aqua regia (AR)7 mL aqua regia (AR)10 mL aqua regia (AR)
Acid (1): elementsAs, Au, Ce, La, P, Sb, TiAs, Ce, Dy, Gd, La, Li, Nd, Pr, Sm, YbAs, Au, Ce, La, P, SbAs, Ba, Ce, Co, Cr, Dy, Ga, Gd, La, Li, Nb, Nd, Ni, Pr, Sm, Sn, Sr, V, Y, Yb, Zn, Zr
Acid (2): mixture6 mL HNO3 + 1 mL H2O27 mL aqua regia (AR) + 1.5 mL HF6 mL HNO3 + 1 mL H2O2-
Acid (2): elementsAl, Cd, Co, Cu, Fe, Li, Mn, Ni, Pb, Pd, V, ZnBa, Co, Cr, Ga, Nb, Ni, Sn, Sr, W, ZrAl, Cd, Co, Cu, Fe, Mn, Ni, Pb, Pd, Zn-
Acid (3): mixture7 mL H2SO4 + 1 mL HNO3 7 mL H2SO4 + 1 mL HNO3 --
Acid (3): elementsAsAs--
Quality of acidsMERCK HCl 30% (s.p.);
MERCK HNO3 65% (s.p.);
MERCK H2O2 30% (s.p.);
MERCK H2SO4 48% (p.a)
MERCK HCl 30% (s.p.);
MERCK HNO3 65% (s.p.);
MERCK HF 40% (s.p.);
MERCK H2SO4 48% (p.a)
Roth HNO3 69% (s.p.);
Roth H2O2 35% (pure)
Digestion programStepPower (W)Time (min)Temp. (°C)Power (W)Time (min)Temp. (°C)Power (W)Time (min)Temp. (°C)Hold. (min)
1700615070011200160051506
2800520080016240160052005
38001821503001600521518
40250---16005025
No. of digestionsn = 5n = 3n = 6n = 6
Sample mass digested0.2 g0.1 g (0.5 g for Acid (3))0.2 g0.2 g
Final volume50 mL (PP tube); filled with 2 mol/L HCl s.p (Acid (1)); H2O deionized (Acid (2) and Acid (3))50 mL (PP tube), filled with 2 mol/L HCl s.p. (Acid (1) and Acid (2)); H2O deionized (Acid (3))50 mL (PP tube); filled with 0.5 M HNO3
ValidationElement spikes for samples added before digestion.Element spikes for samples added before digestion. Dilution experiments (1:10, 1:100). Certified reference material CCRMP REE-1.Element spikes for samples and blinds added before digestion as well as for liquid standards without digestion.
Analytical determination
ICP-OES nameVarian Vista Pro RadialVarian Vista Pro RadialThermo Scientific iCap 6000 Series
ICP-OES elementsAl, As, Co, Cu, Fe, Li, Mn, Ni, P, Pb, Sb, Ti, ZnCe, LaAl, As, Cd, Co, Cu, Fe, Mn, Ni, P, Pb, Sb, ZnAs, Ba, Ce, Co, Cr, Dy, Ga, Gd, La, Li, Nb, Nd, Ni, Pr, Sm, Sn, Sr, V, Y, Yb, Zn, Zr
ICP-MS nameAgilent 8800 QQQAgilent 8800 QQQThermo Scientific iCap Q-
ICP-MS elementsAu (O2), Cd (He), Ce (O2), La (O2), Pd (He), V (O2)As (He), Ba (O2), Co (O2), Cr (He), Dy (O2), Ga (O2), Gd (O2), Li (He), Nb (O2), Nd (He), Ni (He), Pr (O2), Sm (He), Sn (He), Sr (O2), W (He), Yb (He), Zr (He)As, Au, Cd, Ce, La, P, Pb, Pd, Sb, Zn-
ICP-MS gas modeHe (collision), O2 (reaction gas)He (collision), O2 (reaction gas)He (collision)-
Table 3. Wavelength-dispersive X-ray fluorescence (WD-XRF) analysis procedure for MIN sample.
SpecificationValidated Method
Pre-Treatment
SamplesMIN
Fusion8 g Li₂B₄O₇ and LiBO2
Sample mass1 g
Muffle furnaceFluxana Vitriox
Temperature1200 °C
Number of replicatesn = 5
ValidationCertified reference sample CCRMP REE 1
WD-XRF Measurement
WD-XRF device namePrimus IV (Rigaku, Japan)
CalibrationStandardless calibration
X-ray sourceRhodium source 4 kW
Measurement time10 min
WD-XRF elementsAl, Ca, Fe, K, Mg, Mn, Na, P, Rb, Si, V, Y, Zn
LODApproximately 0.01%
Table 4. Overview of the objectives and procedures for element recovery rates in liquid standards (RRL), blind samples (RRB), and sample matrices (RRS).
Spiked Sample ObjectiveAnalysis Procedure
Liquid standardsRRLTest of measurement accuracy without the influence of acid digestion or sample matrix. Multi-element standards (Ag, Al, As, Ba, Cd, Co, Cr, Cu, Fe, Li, Mg, Mn, Mo, Na, Ni, Pb, Sb, Sr, Ti, V, Zn) in different concentrations were dissolved in HNO3 and measured with ICP-OES (Supplementary Materials Table S2).
Blind samplesRRBTest of measurement accuracy with influence caused by digestion acid due to, e.g., volatilization, complex formation, precipitation, etc. but without the influence of the sample matrix.Element standards for all elements and acids mixtures added before digestion and measured with ICP-OES/MS.
Sample matrices (BATT, MIN)RRSTest of measurement accuracy with both influences, acid digestion and sample-specific, such as chemical reactions, overlapping of measuring lines (ICP-OES) or element masses (ICP-MS).Element standards for all elements and acids mixtures added before digestion and measured with ICP-OES/MS.

