Article

Life Cycle Assessment of Reusable Plastic Crates (RPCs)

Department of Civil and Environmental Engineering, Environmental Section, Politecnico di Milano, 20133 Milano, Italy
*
Author to whom correspondence should be addressed.
Resources 2019, 8(2), 110; https://doi.org/10.3390/resources8020110
Submission received: 21 April 2019 / Revised: 6 June 2019 / Accepted: 12 June 2019 / Published: 15 June 2019

Abstract

:
The European packaging market is forecast to grow 1.9% annually in the next years, with an increasing use of returnable packages. In this context, it is important to assess the real environmental effectiveness of the packaging re-use practice in terms of environmental impacts. This life cycle assessment aims to evaluate the environmental performances of reusable plastic crates (RPCs), which are used for the distribution of 36% of fruit and vegetables in Italy. RPCs can be re-used several times after a reconditioning process, i.e., inspection, washing, and sanitization with hot water and chemicals. The analysis was performed considering 12 impact categories, as well as the cumulative energy demand indicator and a tailor-made water consumption indicator. The results show that when the RPCs are used for less than 20 deliveries, the impacts of the life cycle are dominated by the manufacturing stage. By increasing the number of deliveries, the contribution of the reconditioning process increases, reaching 30–70% of the overall impacts for 125 uses. A minimum of three deliveries of the RPCs is required in order to perform better than an alternative system where crates of the same capacity (but 60% lighter) are single-use. The same modeling approach can be used to evaluate the environmental sustainability of other types of returnable packages, in order to have a complete overview for the Italian context and other European countries.

1. Introduction

The European packaging market accounted for EUR 195 billion turnover in the year 2018, and it is forecast to reach EUR 214 billion in 2023, with a compound annual growth rate of 1.9% [1]. In the last few years, there has been a growing demand for returnable packages from various end-use industries in this sector such as food and beverages, consumer goods, pharmaceuticals, and the automotive industry [2]. In fact, the concept of circular economy is gaining momentum in the policy making of the European Commission, and has been increasingly implemented in the production, consumption, and waste sectors. A circular economy model promotes sustainability and competitiveness in the long term by maintaining the value of products and materials as long as possible and minimizing the use of resources and the generation of waste [3,4]. The re-use principle, that refers to the repeated use of products and components for the same purpose for which they were conceived plays a central role in the circular economy. In particular, in the packaging sector, re-use is a means to initiate a change, which is expected to deliver both economic and environmental benefits [5]. Based on product type, returnable packages can be categorized into: pallets, crates, intermediate bulk containers, drums and barrels, bottles, dunnage, and other items (e.g., racks, sacks, carts and dollies). This paper focuses on crates, considering their significant potential for re-use in the European context: around eight billion crates of goods are transported from producers to the commodity stores all over Europe each year [6].
Reusable plastic crates (RPCs) are designed for the transportation of fresh food products, especially fruit and vegetables. This type of packaging is available in different sizes (typically 60 cm × 40 cm or 30 cm × 40 cm, with a height ranging from 12 cm to 25 cm; Table S1) and it is usually manufactured from polypropylene (PP). The crate can be folded in order to provide a cheaper return when empty, and has rounded inner edges to prevent product damage. RPCs are mainly managed based on rental services: the ownership of the container is maintained by a service provider company (the pooler) that delivers the RPCs to the users and manages their return, inspection, and cleaning for another re-use, and their final treatment of recycling.
In Italy, RPCs are currently used to transport 36% of the overall distributed fruit and vegetables, with a predominant use in the large-scale retail trade [7]. In the year 2017, the European Reusable Packaging & Reverse Logistics Consortium (EURepack) rotated about 305 million RPCs, corresponding to a population (i.e., the total number of items assumed as the available material in stock) of 44–51 million crates (considering six to seven rotations per year).
Some studies have recently evaluated the environmental sustainability of the RPCs compared to alternative single-use packages, aiming at finding the most environmentally friendly solution [8]. What emerged is that despite packaging re-use being generally an effective measure of waste prevention, when looking at the environmental impacts of the whole system, the picture looks much more complex, and there is no unique answer. While some past studies (e.g., Singh et al. [9] and Franklin Associates [10] for the North American context, or Albrecht et al. [11] and ADEME [12] for the European countries) found that the RPCs perform generally better than the cardboard boxes and quite similarly to the wooden boxes, other studies (e.g., Capuz et al. for Spain [13]) showed the opposite, i.e., that the environmental impacts of the single-use cardboard boxes can be lower than those of the RPCs. This is because the results of the comparison are strongly affected by different parameters, such as the weight of the packages, the type of manufacturing material (e.g., primary versus secondary material), the disposal treatment, the number of RPC fillings, and the involved transport distances [8,11,14,15].
As regards the service life of the RPCs, the existing literature mainly focuses on the transportation step, showing that longer distances tend to favor single-use packages [8,11,12]. For example, Levi et al. [8] concluded that the RPCs system is generally preferable for distances lower than 1200 km, while beyond the aforementioned value, the corrugated boxes system performs better. On the contrary, few indications are reported about the inventory data and the corresponding environmental loads of the reconditioning process at the facility.
The purpose of this study is to evaluate the environmental impacts associated with the life cycle of the RPCs as a function of the number of provided deliveries in the Italian context. Compared to the above-mentioned studies, especially Levi et al. [8] and Accorsi et al. [15] related to Italy, we paid special attention to the reconditioning process, which was modeled based on primary data collected at the two main poolers operating in the RPCs market in Italy. Results will be used to deliver some suggestions for more sustainable management to the involved stakeholders. In more general terms, the present analysis is part of a research activity focused on a qualitative and quantitative assessment of the packaging re-use practice in Italy. In this research, 38 different types of reusable packages were identified, and for each of them, the constituent material, the market, the sector of use, the main basic characteristics (such as the average size and/or weight), the applied reconditioning process, and the type of service on which it is run (e.g., rental) were analyzed [16]. For some typologies (i.e., intermediate bulk containers, steel drums, and reusable plastic crates), a life cycle assessment (LCA) was also performed [17,18]. Such type of work represents a starting point to get reliable and representative data on packaging reuse in Italy and could serve as an example for a similar assessment in other European member states.

2. Materials and Methods

The study was carried out applying the LCA methodology according to the ISO 14040 [19] and 14044 [20] standards and the Product Environmental Footprint (PEF) Guide [21]. The SimaPro software (version 8.4, PRé Sustainability, Amersfoort, The Netherlands) supported the data processing. According to such documents, the LCA is composed of four main stages: goal and scope definition (Section 2.1, Section 2.2, Section 2.3, Section 2.4, Section 2.5 and Section 2.6), inventory analysis (Section 2.7), impact assessment (Section 3), and interpretation (Section 3 and Section 4).

2.1. Goal definition

The main objectives of the study are:
  • to assess the environmental and energy performances related to the life cycle of RPCs as a function of the number of deliveries;
  • to identify the contribution of the reconditioning stage to the overall environmental indicators and indicate methods for a more sustainable management of RPCs.
Another goal of the analysis is to understand whether the RPCs system based on the packaging reconditioning and re-use performs better than an alternative system based on single-use plastic crates (SPCs) of the same capacity. The comparison between the two delivery systems (including a description of the SPCs system) is reported in Section 3.2.

2.2. RPCs System Description and Analyzed Scenarios

In the RPCs system, crates are manufactured through injection molding of PP granulate and, after the use phase (not considered in the analysis), they are collected by the pooler and subjected to a reconditioning process in order to be used for another delivery. Two prominent poolers of RPCs in Italy were surveyed in order to define the layout and the mass balance of an average reconditioning facility in Italy (see Figure S1 in the Supplementary Material).
Based on the collected information, crates are firstly inspected to identify possible breakages (the average breakage rate is 0.35%). The damaged crates are removed and replaced by new crates to keep the needed total capacity constant. The remaining 99.65% of the total RPCs are sent to a washing step where, depending on the pooling company, only a percentage (about 55%) or the total amount of crates is cleaned and sanitized with hot water and a mix of chemicals. After washing, crates are dried and then further checked for breakages. On average, 0.2% of the washed crates are discarded at this stage. The reconditioning process generates wastewater, which is sent to a chemical–physical treatment plant located in the same facility, and some solid residues are removed from the RPCs (mainly organic residues, plastic residues, and paper labels), which are then sent to incineration.
To consider differences in the reconditioning process, four scenarios based on collected primary data were analyzed in the LCA study (Table 1), according to the combination of the following parameters:
  • the percentage of crates that are washed after the first inspection;
  • the type and amount of chemicals used in the washing step.
After n deliveries, the crates are transported to a recycling plant for the production of secondary granulate.

2.3. Functional Unit

The function of the analyzed system is to provide a certain delivering capacity for the distribution of fruit and vegetables by using plastic crates that carry 12 kg each. Then, the functional unit (FU) is assumed as 1200 kg (corresponding to 100 RPCs) of carrying capacity at each delivery. The number of deliveries (n) is included between 1–125. In the RPCs system, the FU is fulfilled by using 100 RPCs with a capacity of 12 kg and an average empty weight of 1.49 kg. Since the same RPC is used for the n deliveries, the parameter n also indicates the “rotations”.
For n equal to 1, the newly manufactured crates are used only once, and then sent to recycling. Thus, the reference flow is 100 newly manufactured crates. For n equal to 2, the newly manufactured crates, after the first use, are sent to a reconditioning plant. Here, as described in Section 2.2, 0.55 (or 0.46) of the 100 input crates (depending on the washing percentage) cannot be reconditioned and are sent to recycling, whereas the others are regenerated and made available for a second use. Thus, the reference flow is 100.55–100.46 new crates (depending on the analyzed scenario). In general terms, the reference flow is (100 + 0.55 − 0.46(n − 1)) new crates, as can be inferred from Figure 1.

2.4. System Boundaries

The system boundaries (Figure 2) include:
  • the production of the crates (100 input crates plus those replacing the discarded ones during the reconditioning process);
  • the reconditioning process, i.e., the transportation of the crates from the users to the reconditioning plant, the consumption of electrical energy, water, fuel, and chemicals for the process (including the transport of chemicals to the facility), the wastewater treatment, and the incineration of the solid residues removed from the crates;
  • the end of life of the crates through a recycling process (both the crates after n deliveries and those discarded in the reconditioning process);
  • the transportation of the crates, the solid residues, and the sludge (from the wastewater treatment) to their final treatment.
The use phase of RPCs—i.e., packing of the product and RPCs transportation to the distribution centre of the large-scale retail and then to a retail outlet—was not considered. The life cycle of the delivered product (growing and harvesting) was also not included, because the study focuses only on the delivery packaging.
Cases of multi-functionality were solved by expanding the system boundaries [22,23]. The following avoided productions were included:
  • avoided production of PP primary granulate due to the recycling of the RPCs after n deliveries;
  • avoided production of the electric energy from the Italian distribution grid due to the recovery of electricity in the incineration processes (incineration of sludge, solid residues, and plastic scraps from recycling);
  • avoided production of heat from a domestic gas boiler due to the recovery of heat in the incineration processes.

2.5. Data Quality

The geographical scope of the study is northern Italy, and the reference years are the biennium 2016–2017. The foreground system was described with primary data, except for the end of life of the RPCs, for which literature data were taken as reference [11,24].
For the processes of the background system (such as chemicals and energy production), inventory data from the ecoinvent 3.3 database (approach allocation and recycling content) were used [25].

2.6. Selected Indicators

The impact assessment was based on two characterisation methods:
  • International reference life cycle data system—ILCD [26], considering 12 impact categories: climate change (CC), ozone depletion (OD), human toxicity (non-cancer effects; HTNC), human toxicity (cancer effects; HTC), particulate matter (PM), photochemical ozone formation (POF), acidification (A), terrestrial eutrophication (TE), freshwater eutrophication (FE), marine eutrophication (ME), freshwater ecotoxicity (FEC), and mineral, fossil, and renewable resources depletion (RD).
  • Cumulative energy demand—CED [27], to evaluate the energy performance of the system.
Moreover, an ad hoc indicator, which was defined as water resources depletion (WD) and expressed in terms of m3 of water, was used to quantify the net water consumption along the life cycle of the system (water withdrawal from the environment minus the water release in the environment). The value of this indicator was derived from the inventory of the system reported in the results of the SimaPro software. The environmental impact associated to this water consumption was not calculated, because the impact category recommended in the ILCD method has still some problems of implementation, and thus was not considered as completely reliable.

2.7. Inventory

This section reports the primary data used to model the main processes included in the system boundaries. In the Supplementary Material, the corresponding ecoinvent datasets are listed (Tables S2–S6).

2.7.1. RPCs Production

The RPCs have an average weight of 1.49 kg and an average capacity of 12 kg, which was calculated based on the data reported in Table S1. Crates are currently manufactured by the injection molding of PP granulate with an efficiency of 99.4% [25]. The 100 input RPCs are supposed to be produced only from virgin granules, while the RCPs replacing the losses at every reconditioning step are supposed to be manufactured from 39% virgin granulate (0.58 kg/crate) and 61% secondary granulate (0.91 kg/crate), i.e., granulate that comes directly from the recycling process of the damaged crates (closed-loop recycling). The percentage of the secondary granulate was calculated considering a 93% recycling efficiency and a substitution factor by mass between the secondary and the primary material equal to 1:0.66 (Figure 3; see Section 2.7.3 for further details). Note that from now on, the step of the crates production includes the burdens related to the primary granulate manufacturing and the injection molding process. The environmental loads related to the production of the secondary granulate (recycling process of RPCs) are instead included in the end of life stage.

2.7.2. Reconditioning Process
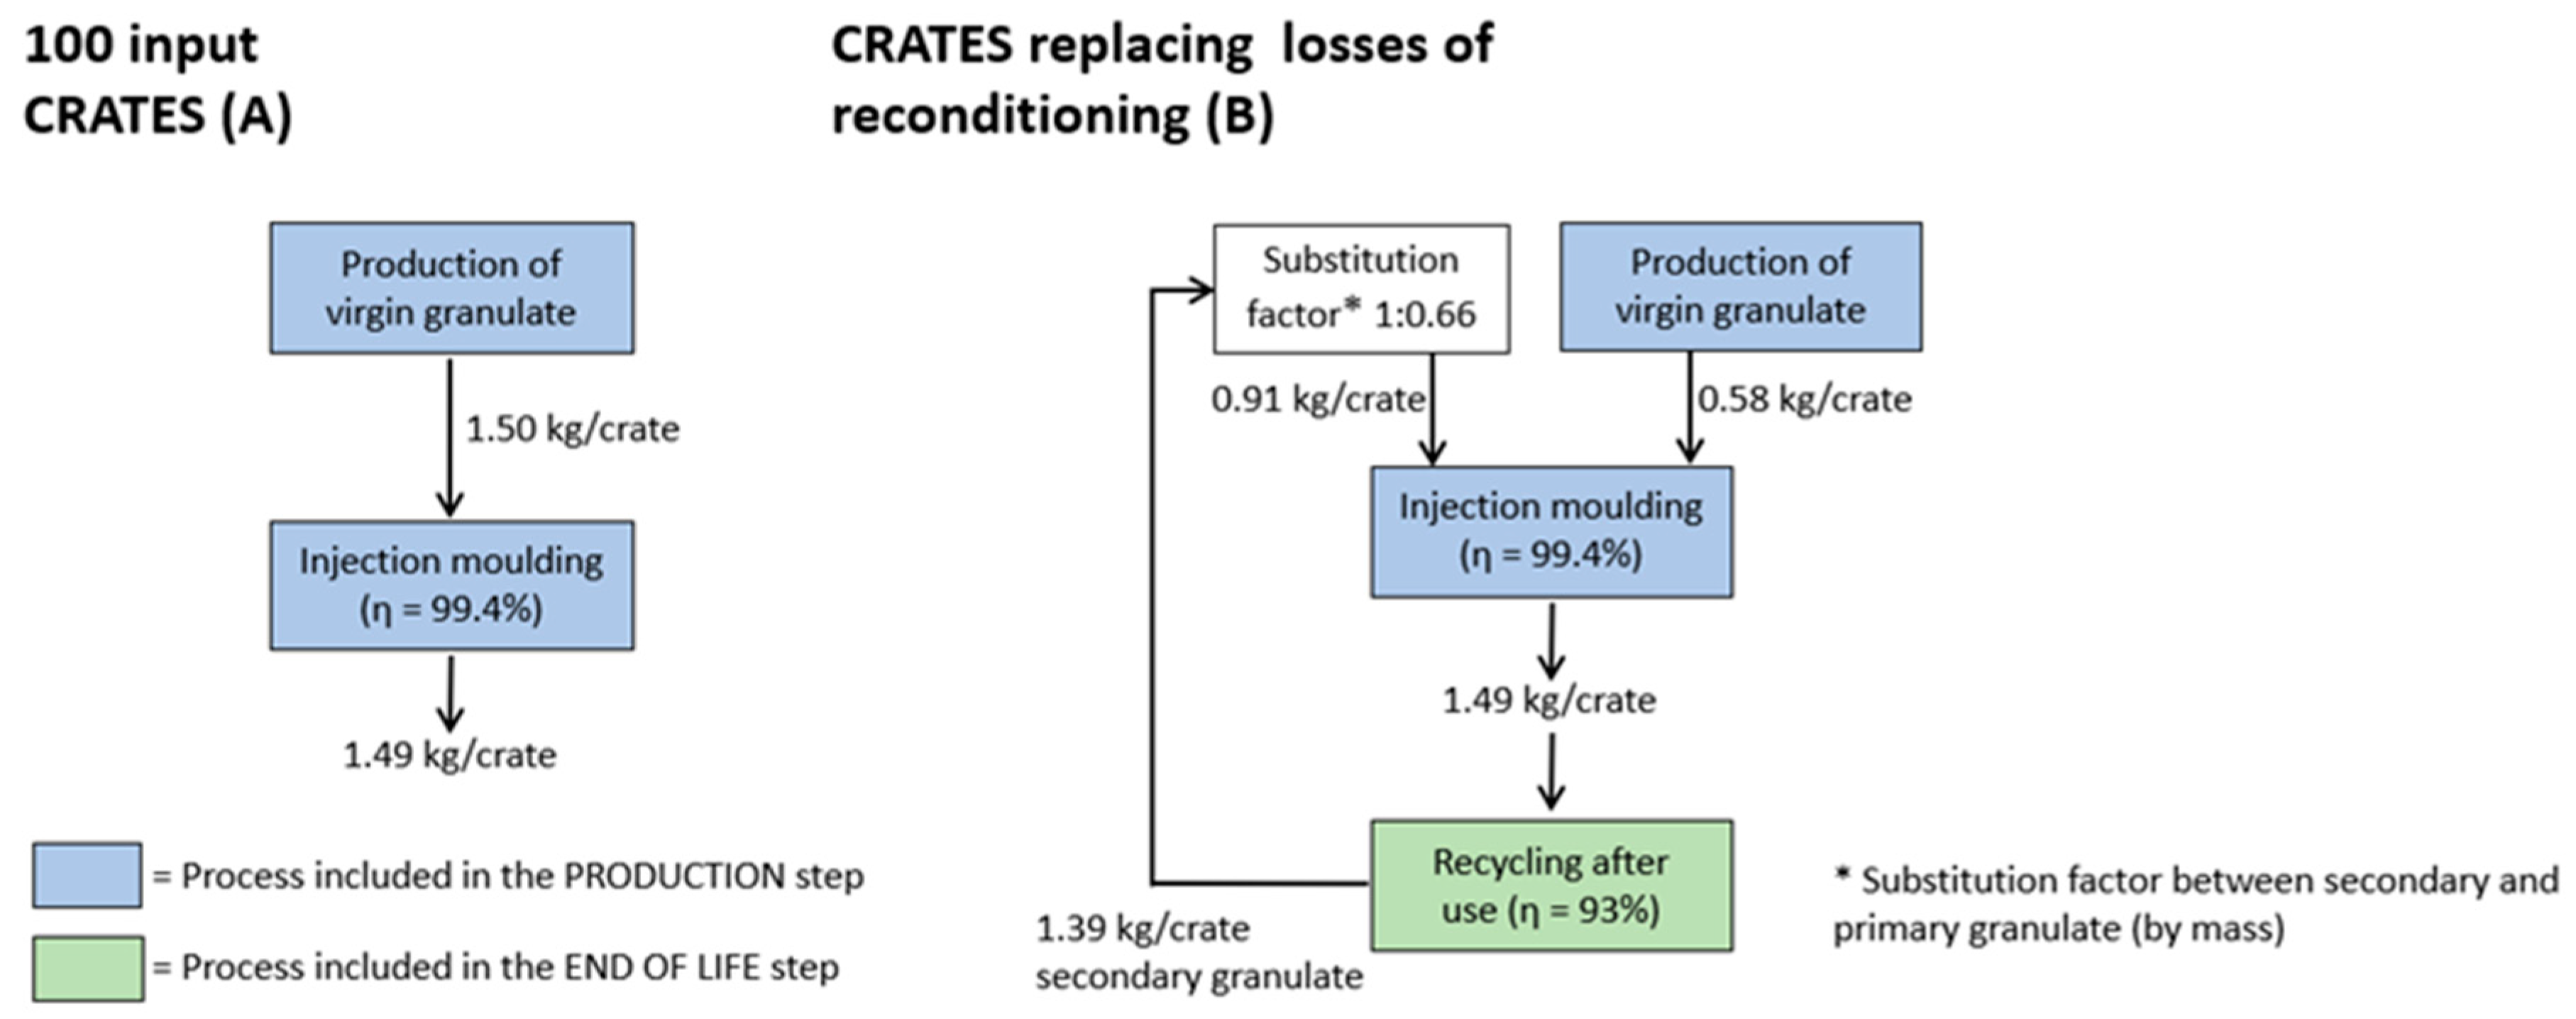
The average distance between the users and the reconditioning plant in Italy is equal to 139 km. Transportation is made by large-size trucks (>32 metric tonnes), complying with the Euro 5 standard.
The complete inventory of the reconditioning process based on collected primary data is reported in Table 2 for each analyzed scenario.
The generated wastewater is treated in a physical–chemical treatment plant (located within the same reconditioning facility). In particular, the treatment of 1 m3 of wastewater requires 0.54 kg of polyaluminum chloride (10% aqueous solution), 0.65 kg of sulfuric acid (50% aqueous solution), and 2.7 kWh of electricity. The process produces 1 m3 of water, which is sent to a medium-size urban wastewater treatment plant and 1.67 kg of sludge, which is destined to a municipal waste incinerator (100-km distance).

2.7.3. End of Life

The RPCs used for n deliveries and the damaged crates at each reconditioning step are transported to a recycling facility (100-km distance on average). The crates are received separately from the other plastic streams, and so the initial sorting process is not implemented. In the recycling process, crates are shredded and ground for the production of secondary granulate, with an average efficiency of 93% [11]. The secondary granulate can be used in the manufacturing of new RPCS (closed-loop recycling applied to the discarded crates at each reconditioning step) or for other applications such as the production of crates for returnable glass bottles (open-loop recycling applied to the RPCS at their end of life after n deliveries). In both cases, according to the approach followed by Albrecht et al. [11], a substitution ratio between the secondary and primary granulate equal to 1:0.66 by mass was assumed, based on the market prices in Italy for the year 2017 [28]. In the sensitivity analysis, a parameter variation was performed (Section 3.3.3), in order to analyze its influence on the final results.
According to the inventory data reported in Rigamonti et al. [24] for the recycling of the polyolefins, the treatment of one crate requires 0.7 kWh of electric energy, 2.47 kg of well water, and 0.90 MJ of heat produced by a conventional gas boiler. Scraps produced by the treatment (100 g/crate) are sent to a municipal waste incinerator located 100 km away from the recycling plant.

3. Results

Tables S7–S10 in the Supplementary Material report the results of the LCA for each analyzed scenario. They refer to the life cycle of 100 RPCs that provide 1200 kg of carrying capacity at each delivery, with n representing the number of deliveries made with the same crates (rotations). The overall impact includes the burdens of:
  • the production step of (100 + 0.55 × (n − 1)) crates in case of the scenarios W1 and (100 + 0.46 × (n − 1)) crates for the scenarios W2;
  • the reconditioning process of 100 × (n − 1) crates. This step includes the transportation of the crates from the users to the reconditioning plant, the washing step (consumption of electric energy, chemicals, and hot water), the wastewater treatment, and the incineration of the solid residues removed by the crates;
  • the end of life of [100 + 0.55 × (n − 1)] crates in case of the scenarios W1 and of (100 + 0.46 × (n − 1)) crates for the scenarios W2.

3.1. Impact assessment

Scenario W1-RE1 (washing percentage equal to 100% and reagents of type RE1) shows the highest potential impacts, while scenario W2-RE2 (washing percentage equal to 55% and reagents of type RE2) performed the best. In particular, the impacts turn out to be mostly influenced by the percentage of washing (scenario W1 versus scenario W2). For example, for n = 125, most of the indicators increase by more than 14% when all of the crates are washed. The type and quantity of washing chemicals are less important in comparison: for 125 deliveries, the difference between the indicators of scenario RE1 and those of scenario RE2 is always lower than 13.5%, regardless of the percentage of washed crates (see Table S11).
In each scenario, the value of the indicators can be divided into three main stages: production, reconditioning (only for n > 1), and end of life (see Table S12 for scenario W1-RE1). Similar indications can be derived for all the analyzed scenarios. For a low number of rotations (e.g., n = 20), the burdens are mainly associated to the production stage (52–85% of the overall indicator for scenario W1-RE1). By increasing the number of rotations, one can observe a larger contribution of the reconditioning stage. Considering for example the scenario W1-RE1, this process contributes to 15–55% for n = 40, 21–63% for n = 60, 25–68% for n = 80, and 29–71% for n = 100 deliveries (Figure 4).
Focusing on the reconditioning stage, when the washing percentage is equal to 100%, most of the environmental burdens are associated with:
  • the transportation of the crates from the users to the reconditioning plant (this is valid especially for the impact categories particulate matter, photochemical ozone formation, terrestrial and marine eutrophication, and resource depletion);
  • the electricity consumption of the reconditioning plant in case of freshwater eutrophication and ecotoxicity impact categories;
  • the washing stage, especially for the climate change and ozone depletion impact categories and the CED and water depletion indicators. In this stage, the most impacting processes are the heating of the water, the consumption of the disinfectant based on peracetic acid (only for the scenario RE1), and the consumption of water.
A non-negligible contribution is also given by the wastewater treatment for the human toxicity, non-cancer effects, marine eutrophication, and the water depletion (Figure 5 and Tables S13 and S14).
If only 55% of crates are washed, most of the impact is due to the transportation of the crates in all the analyzed indicators except for freshwater eutrophication, freshwater ecotoxicity, and water depletion, where the consumption of electricity (FE category), the management of solid residues (FEC category), and the consumption of water (WD indicator) represent the most important contributions (Figure 5 and Table S15).
Based on these outcomes, a widespread distribution of the reconditioning plants should be encouraged in order to reduce the traveled average distance from the users to the cleaning facility. Moreover, the management of the reconditioning facility could be optimized by reducing energy consumptions and by promoting the use of alternative/renewable energy sources (see Section 3.3.1 and Section 3.3.2 related to the sensitivity analysis). The consumption of a disinfectant alternative to the commercial reagent based on peracetic acid should also be encouraged.

3.2. Reconditioning System (RPCs) vs. Single-Use System (SPCs)

In this section, the RPCs system is compared to an alternative system for fruit and vegetables distribution based on single-use plastic crates of the same capacity (SPCs system), which are sent to recycling and substituted with new ones at each delivery. In this case, the reference flow that fulfills the FU defined in Section 2.3 is 100 × n × SPCs.
SPCs have the same capacity of RPCs (12 kg), but an average empty weight of 579 g, i.e., 60% lower (Table S16). The life cycle of SPCs (stages of production and end of life) was modeled as previously described for the 100 input RPCs (Section 2.7), and the LCA results are reported in Table S17.
Regardless of the analyzed re-use scenario, the SPCs system performs significantly better just until two deliveries of the RPCs. On average, the burdens of the RPCs system are 2.6 (n = 1) and 1.3 (n = 2) times higher than those related to the SPCs system. Starting from three deliveries, the results rapidly change in favor of the RPCs system, i.e., the reconditioning and re-use of crates is preferable than the single-use and recycling, for all of the analyzed indicators. Considering for example the scenario W1-RE1, depending on the indicators, the environmental impacts and the water consumption of the RPCs system range from 54% to 60% of those of the SPCs system if n = 5, from 35% to 42% for n = 8, from 16% to 23% for n = 20, from 12% to 19% for n = 30, from 7% to 14% for n = 80, and from 6% to 13% for n = 125 (Figure 6 and Figures S2 and S3).

3.3. Sensitivity Analysis

A sensitivity analysis was performed by changing some of the assumptions adopted in modeling the RPCs life cycle. Assumptions are related to the following aspects:
  • the production of the electricity used in the reconditioning plant;
  • the production of the heat used in the reconditioning plant;
  • the substitution ratio between secondary and virgin PP granulate.
The sensitivity analysis was performed on the best (W2-RE2) and the worst (W1-RE1) RPCs scenarios.

3.3.1. Production of the Electricity Used in the Reconditioning Plant

The contribution of the consumption of electricity from the Italian mix resulted up to 50% of the reconditioning burdens in the scenario W1-RE1 (Table S13) and up to 42% in the scenario W2-RE2. Thus, in the sensitivity analysis, the electricity was assumed to be produced in an alternative way, i.e., by a solar photovoltaic system (inventory data from the ecoinvent 3.3 dataset: Electricity, low voltage {IT}| electricity production, photovoltaic, 3 kWp slanted-roof installation, multi-Si, panel, mounted).
Compared to the baseline situation, the use of renewable energy allows for a reduction of the reconditioning burdens by up to 25% in the scenario W1-RE1 and up to 29% in the scenario W2-RE2, for all the indicators, except for the resource depletion impact category, where an increase of the impact is shown due to the environmental load of the panels production (Table S18). By considering the whole RPCs life cycle, the sensitivity scenario performs slightly better than the baseline scenario (Table S19), but the comparison with the single-use system does not change in general terms.

3.3.2. Production of Heat Used in the Reconditioning Plant

The contribution of the production of heat from a conventional gas boiler resulted up to 35% of the reconditioning burdens in the scenario W1-RE1 (Tables S13 and S14), and 29% in the scenario W2-RE2. For this reason, a sensitivity analysis was performed by assuming that heat is produced with a natural gas combined heat and power (CHP) boiler that also provides electricity for the process. The remaining amount of electricity is taken from the national grid. Detailed modeling is reported in Table S20.
Compared to the baseline situation, the production of heat from a CHP boiler allows for a reduction of the reconditioning burdens by up to 30% (scenario W1-RE1) and 32% (scenario W2-RE2) for all the indicators, except for the impact categories photochemical ozone formation, acidification, and terrestrial eutrophication, which show a slight increase of the impact (less than 2%, Table S21). Also, in this case, the overall results of the LCA are not affected.

3.3.3. Substitution Ratio between Secondary and Virgin Polypropylene Granulate

In the baseline LCA, a substitution ratio between secondary and primary PP granulate equal to 1:0.66 by mass was assumed, based on the current market prices of the two materials in Italy. In the sensitivity analysis, a substitution ratio equal to 1:1 was applied, assuming that the physical and technical properties of the secondary granulate are the same as those of the primary product, and that during the recycling process, it is not necessary to add virgin material to meet the minimum technical specifications. This change in the parameter was applied to both the RPCs and the SPCs systems. The burdens associated to the overall life cycle of the RPCs and SPCs decrease (Tables S23 and S24), but the LCA comparison between the two systems does not change.

4. Discussion and Conclusions

The study has evaluated, according to a life cycle perspective, the environmental and energy performances of RPCs for the distribution of fruit and vegetables in Italy, as a function of the number of provided deliveries (1 ≤ n ≤ 125). Specific attention was dedicated to the reconditioning process, for which primary data were collected at the two main poolers.
The main burdens of the reconditioning process are associated with the transportation of the crates from the users to the plant, and for this reason, a more widespread distribution of the facilities should be promoted to reduce the distance traveled. This is in line with the indications of the previously mentioned studies (e.g., [8,11,14,15]), showing that a longer distance tends to favor a single-use packaging system, where the backhaul and washing is not necessary.
Other significant sources of environmental impact in the reconditioning stage are the consumption of electricity from the national grid—and, when 100% of the RPCs are washed, the washing step, i.e., the heating of the water by a conventional gas boiler and the consumption of the water itself. In this case, as recommended also by Albrecht et al. [11], the management of the reconditioning facility should be optimized by reducing energy consumptions and promoting the use of renewable energy sources. For example, based on the performed sensitivity analysis, the use of photovoltaic energy or the cogeneration of heat and electricity in a CHP gas unit would reduce the burdens of the reconditioning process by up to 25–30% compared to the baseline situation.
The chemicals used for the washing process do not affect significantly the overall results, but the use of peracetic acid as disinfectant is not recommended.
As it was expected, the reconditioning step becomes more relevant within the RPCs system impacts when the number of crate rotations increases (up to 75% of the overall indicators for 125 rotations), especially when all the crates are washed.
The re-use system was also compared with an alternative system of fruit and vegetables distribution, where single-use plastic crates of the same capacity (but 60% lighter) are sent to recycling and substituted with new ones (SPCs system). Starting from three deliveries, the RPCs system results are preferable to the SPCs system for all the analyzed indicators. Considering the worst performing scenario of re-use, depending on the indicators, its environmental impacts and the water consumption are 54–60% of those of a SPCs system for five deliveries, 16–23% for 20 deliveries, 7–14% for 80 deliveries, and 6–13% for 125 deliveries.
The performed LCA allowed identifying the main critical points and consequently the possible improvements in the RPCs life cycle, especially in the management of their washing and sanitation. If our indications will be taken into account by the pooling societies, it is expected to have a significant improvement in the RPCs environmental sustainability. This can have positive consequences in Italy, where the RPCs are the dominant type of packaging for the delivery of fruit and vegetables in the large-scale retail trade.
As previously reported, the reconditioning process was modeled on the basis of primary data collected from two pooling societies, which have a strong business in Europe and account for a large RPCs market share in Italy. This represents the main strength of the study. In fact, compared with previous LCAs on the topic [8,15], where the reconditioning process was modeled based on literature data, in our study, we used recent and representative primary data. Instead, the main gap is related to the use stage of the RPCs (i.e., use of the packaging for the delivery of fruit and vegetables from the growers to the distribution centres and then to the local retail stores), which was not included within the system boundaries. Thus, a future development of the study could be focused on the logistic aspects of this service phase, with the collection of primary data regarding the transportation modes and mean traveled distances.
This study is part of a wider research activity related to an environmental assessment of the re-use practice in Italy. For this reason, new LCAs on other reusable packages identified in the initial survey [16] will be implemented by applying the same modeling approach.

Supplementary Materials

The file containing the Supplementary Material is available online at https://www.mdpi.com/2079-9276/8/2/110/s1. Figure S1: Layout and mass balance of an average reconditioning plant in Italy for 100 input crates. W1 = washing percentage of 100%; W2 = washing percentage of 55%; RE1 = chemicals of type RE1; RE2 = chemicals of type RE2; Figure S2: Comparison between the system based on reconditioning and re-use (RPCs system) and the single-use system (SPCs system): for each number of rotations, the ratio between the value of the indicator in the RPCs and SPCs systems is reported. The figure is related to the scenario W1-RE1; Figure S3: Comparison between the system based on reconditioning and re-use (RPCs system) and the single use system (SPCs system): for each number of rotations, the ratio between the value of the indicator in the RPCs and SPCs systems is reported. The figure is related to the scenario W2-RE2; Table S1: RPCs characteristics for the two surveyed societies; Table S2: Ecoinvent datasets (version 3.3) implemented in SimaPro 8.4 to model the production of crates (re-use system and single use system); Table S3: Ecoinvent datasets (version 3.3) implemented in SimaPro 8.4 to model the reconditioning process; Table S4: Ecoinvent datasets (version 3.3) implemented in SimaPro 8.4 to model the treatment of the wastewater produced by the reconditioning process; Table S5: Air emission factors for the production of heat from a gas domestic boiler. Values are expressed per GJ of consumed natural gas; Table S6: Ecoinvent datasets (version 3.3) implemented in SimaPro 8.4 to model the end of life process (re-use system and single-use system); Table S7: Impact indicators and water resources consumption associated with the life cycle of the 100 RPCs ready for nth use (1≤ n ≤125) for the scenario W1-RE1 (washing percentage equal to 100% and chemicals of type RE1); Table S8: Impact indicators and water resources consumption associated with the life cycle of the 100 RPCs ready for nth use (1≤ n ≤125) for the scenario W1-RE2 (washing percentage equal to 100% and chemicals of type RE2); Table S9: Impact indicators and water resources consumption associated with the life cycle of the 100 RPCs ready for nth use (1≤ n ≤125) for the scenario W2-RE1 (washing percentage equal to 55% and chemicals of type RE1); Table S10: Impact indicators and water resources consumption associated with the life cycle of the 100 RPCs ready for nth use (1≤ n ≤125) for the scenario W2-RE2 (washing percentage equal to 55% and chemicals of type RE2); Table S11: Percent change of the impacts and water consumption associated with the RPCs life cycle, according to the different ways of management for the reconditioning step. Considering for example the first column (coloured), the percentage change is calculated as: Δ% = [IMPACT SC. W1 − IMPACTSC. W2]/IMPACT SC. W2, keeping constant the type of used reagents (RE1). The impact changes are reported for 20, 50, 80, and 125 rotations; Table S12: Impact indicators and water resources consumption associated with the life cycle stages “production”, “reconditioning”, and “end of life” of the 100 RPCs for 20 and 125 uses in the scenario W1-RE1: absolute and relative values. For each number of uses, the stage with the highest contribution to the overall indicator is highlighted; Table S13: Impact indicators and water resources consumption associated with the reconditioning process of the 100 RPCs in the scenario W1-RE1 (washing percentage equal to 100% and chemicals of type RE1): total value and contribution analysis. For each indicator, the stage with the highest contribution is highlighted; Table S14: Impact indicators and water resources associated to the washing step of the 100 RPCs in the scenario W1-RE1: Total value and contribution analysis. For each indicator, the stage with the highest contribution is highlighted; Table S15: Impact indicators and water resources associated to the reconditioning process of the 100 RPCs in the scenario W2-RE1 (washing percentage equal to 55% and chemicals of type RE1): Total value and contribution analysis. For each indicator, the stage with the highest contribution is highlighted; Table S16: Characteristics of the single use plastic crates. The market share is assumed the same provided for the RCPs; Table S17: Impact indicators and water resources consumption associated with the life cycle of 100 single-use plastic crates and the corresponding contribution analysis; Table S18: Impact indicators and water resources consumption for the reconditioning process in the scenario W1-RE1 and W2-RE2: comparison between the use of electricity from the Italian grid and by a photovoltaic system. The percent change is calculated as: Δ% = [IMPACT PHOTOVOLTAIC − IMPACTGRID]/IMPACT GRID. Table S19: Percent change of the impacts and water resources consumption associated with the whole RPCs life cycle, according to the different source of electricity for the reconditioning stage. Considering for example the first column, the percent change is calculated as: Δ% = [IMPACT PHOTOVOLTAIC − IMPACTGRID]/IMPACT GRID, keeping constant the type of scenario (W1-RE1) and the number of uses (n= 20). The impact changes are reported for 20, 50, 80, and 125 rotations; Table S20: Stage of reconditioning - modeling of the energy consumption (electricity and heat production) by a gas heat and power combined boiler (inventory data and selected Ecoinvent datasets); Table S21: Impact indicators and water resources consumption for the reconditioning stage in the scenarios W1-RE1 and W2-RE2: comparison between the use of conventional and CHP boiler. The percent change of the indicator is calculated as: Δ% = [IMPACT CHP − IMPACTCONVENTIONAL]/IMPACT CONVENTIONAL; Table S22: Percent change of the impacts and water consumption associated with the whole RPCs life cycle, according to the different sources of heat production for the reconditioning step. Considering for example the first column, the percent change is calculated as: Δ% = [IMPACTCHP BOILER − IMPACTCONV. BOILER]/IMPACT CONV. BOILER, keeping constant the type of scenario (W1-RE1) and the number of uses (n = 20). The impact changes are reported for 20, 50, 80, and 125 rotations; Table S23: Percent change of the impacts and water consumption associated with the whole RPCs life cycle, according to the different values of the substitution ratio between secondary and primary PP granulate. Considering for example the first column, the percent change is calculated as: Δ% = [IMPACT ratio 1:1 − IMPACT ratio 1:0.66]/IMPACT ratio 1:0.66, keeping constant the type of scenario (W1-RE1) and the number of uses (n = 20). The impact changes are reported for 20, 50, 80, and 125 rotations; Table S24: Impact indicators and water resources consumption associated with the life cycle of 100 single use plastic crates when the substitution ratio between the secondary and primary granulate is 1:1 by mass. The percent change is calculated as: Δ% = [IMPACT ratio 1:1 − IMPACT ratio 1:0.66]/MPACT ratio 1:0.66.

Author Contributions

Conceptualization and methodology, L.B. and L.R.; data curation, L.B.; LCA formal analysis and results investigation, L.B., L.R., and C.T.; writing—original draft preparation, C.T. and L.B.; writing—review and editing, L.R. and M.G.; supervision, L.R. and M.G.; project administration, L.R. and M.G.

Funding

The research was supported by the National Packaging Consortium (Conai).

Acknowledgments

The authors wish to thank the operators of the RPCS reconditioning facilities who provided primary data for the LCA study and the EURepak Consortium that provides the contacts of the Italian poolers.

Conflicts of Interest

The authors declare no conflict of interest.

References

  1. Platt, D. European Packaging Competitive Landscape Strategic Forecasts to 2023. Smithers Pira in Association with Packaging Europe 2018. Available online: https://www.smitherspira.com/industry-market-reports/european-packaging-competitive-landscape-to-2023 (accessed on 20 May 2019).
  2. Markets and Markets TM INC. Returnable Packaging Market by Product Type (Pallets, Crates, Intermediate Bulk Containers, Drums & Barrels, Bottles, Dunnage), Material (Plastic, Metal, Wood, Glass, Foam), End-Use Industry, Region-Global Forecast to 2023. Market Research Report. 2018. Available online: https://www.marketsandmarkets.com/Market-Reports/returnable-packaging-market-231944920.html (accessed on 20 May 2019).
  3. Circular Economy, European Commission. Available online: https://ec.europa.eu/growth/industry/sustainability/circular-economy_en (accessed on 5 April 2019).
  4. Geueke, B.; Groh, K.; Muncke, J. Food packaging in the circular economy: Overview of chemical safety aspects for commonly used materials. J. Clean. Prod. 2018, 193, 491–505. [Google Scholar] [CrossRef]
  5. European Commission. Proposal for a Directive of the European Parliament and of the Council amending Directive 94/62/EC on Packaging and Packaging Waste. COM/2015/0596 final 2015. Available online: https://eur-lex.europa.eu/legal-content/EN/TXT/?uri=CELEX%3A52015PC0596 (accessed on 5 April 2019).
  6. Svenska Retursystem, A.B. Eurocrate, A Full-Scale Demonstration of Reusable Crates and Pallets. Report for the Life EU Project LIFE00 ENV/S/000867. 2003. Available online: http://ec.europa.eu/environment/life/project/Projects/index.cfm?fuseaction=home.showFile&rep=file&fil=LIFE00_ENV_S_000867_LAYMAN.pdf (accessed on 20 May 2019).
  7. Centro Servizi Ortofrutticoli-Confezioni in ortofrutta: Un elemento per creare valore? (Fruit and Vegetables Packaging. An Element to Create Value?). Available online: https://www.csoservizi.com (accessed on 20 May 2019).
  8. Levi, M.; Cortesi, S.; Vezzoli, C.; Salvia, G. A Comparative Life Cycle Assessment of Disposable and Reusable Packaging for the Distribution of Italian Fruit and Vegetables. Packag. Technol. Sci. 2011, 24, 387–400. [Google Scholar] [CrossRef]
  9. Singh, S.P.; Chonhenchob, V.; Singh, J. Life Cycle Inventory and Analysis of Re-usable Plastic Containers and Display-ready Corrugated Containers Used for Packaging Fresh Fruits and Vegetables. Packag. Technol. Sci. 2006, 19, 279–293. [Google Scholar] [CrossRef]
  10. Franklin Associates. A Division of Eastern Research Group. Comparative Life Cycle Assessment of Reusable Plastic Containers and Display and Non-Display-Ready Corrugated Containers Used for Fresh Produce Applications. Peer Reviewed Report 2016 Prepared for IFCO Corporation. Available online: https://scrivito-public-cdn.s3-eu-west-1.amazonaws.com/f152d078e18222739495b38742ac2b85/a05acb93a2d038b7/f8b60f8f41a4/IFCO-RPC-Life-Cycle-Assessment-March-2016---Executive-Summary.pdf (accessed on 5 April 2019).
  11. Albrecht, S.; Brandstetter, P.; Beck, T.; Fullana-i-Palmer, P.; Grönman, K.; Baitz, M.; Deimling, S.; Sandilands, J.; Fischer, M. An extended life cycle analysis of packaging systems for fruit and vegetable transport in Europe. Int. J. Life Cycle Assess. 2013, 18, 1549–1567. [Google Scholar] [CrossRef]
  12. Agence de l’Environnement et de la Maîtrise de l’Énergie. Analyse du cycle de vie des caisses en bois, carton ondulé et plastique pour pommes (LCA of Wooden Boxes, Cardboard Boxes and Plastic Crates for Apples). Final Report Prepared for ECOBILAN 2000. Available online: https://www.ademe.fr/sites/default/files/assets/documents/28246_acvs.pdf (accessed on 5 April 2019).
  13. Bala, A.; Fullana, P. Comparative Analysis of Different Options for Distribution of Fruit and Vegetables in Spain by Means of Life Cycle Assessment. Executive Summary of a Work Commissioned by ARECO 2017. Available online: http://www.areco.org.es/pdf/LCA_Study_ARECO_%20Executive%20Summary_ENG.pdf (accessed on 5 April 2019).
  14. Koskela, S.; Dahlbo, H.; Judl, J.; Korhonen, M.R.; Niininen, M. Reusable plastic crate or recyclable cardboard box? A comparison of two delivery systems. J. Clean. Prod. 2014, 69, 83–90. [Google Scholar] [CrossRef]
  15. Accorsi, R.; Cascini, A.; Cholette, S.; Manzini, R.; Mora, C. Economic and environmental assessment of reusable plastic containers: A food catering supply chain case study. Int. J. Prod. Econ. 2014, 152, 88–101. [Google Scholar] [CrossRef]
  16. Rigamonti, L.; Biganzoli, L.; Grosso, M. Packaging re-use: A starting point for its quantification. J. Mater. Cycles Waste Manag. 2019, 21, 35–43. [Google Scholar] [CrossRef]
  17. Biganzoli, L.; Rigamonti, L.; Grosso, M. Intermediate bulk containers re-use in the circular economy: An LCA evaluation. In Proceedings of the CIRP Life Cycle Engineering (LCE) Conference, Copenhagen, Denmark, 30 April–2 May 2018; Volume 69, pp. 827–832. [Google Scholar]
  18. Biganzoli, L.; Rigamonti, L.; Grosso, M. LCA evaluation of packaging re-use: The steel drums case study. J. Mater. Cycles Waste Manag. 2019, 21, 67–78. [Google Scholar] [CrossRef]
  19. International Organisation for Standardisation. ISO 14040: Environmental Management-Life Cycle Assessment-Principles and Framework. Edition of ISO 14040. 2006. Available online: https://www.iso.org/standard/37456.html (accessed on 6 April 2019).
  20. International Organisation for Standardisation. ISO 14044: Environmental Management-Life Cycle Assessment-Requirements and Guidelines. Edition of ISO 14044. 2018. Available online: http://store.uni.com/catalogo/index.php/en-iso-14044-2006-a1-2018.html (accessed on 6 April 2019).
  21. European Commission. Commission Recommendation of 9 April 2013 on the Use of Common Methods to Measure and Communicate the Life Cycle Environmental Performance of Products and Organisations (2013/179/EU). Official Journal of the European Union L124/1. 2013. Available online: https://publications.europa.eu/en/publication-detail/-/publication/93cb8358-b80d-11e2-ab01-01aa75ed71a1/language-en (accessed on 6 April 2019).
  22. Finnveden, G.; Hauschild, M.Z.; Ekvall, T.; Guinée, J.; Heijungs, R.; Hellweg, S.; Koehler, A.; Pennington, D.; Suh, S. Recent developments in Life Cycle Assessment. J. Environ. Manag. 2009, 91, 1–21. [Google Scholar] [CrossRef] [PubMed]
  23. European Commission-Joint Research Centre. ILCD Handbook-General Guide for Life Cycle Assessment-Detailed Guidance, 1st ed. 2010. Available online: https://eplca.jrc.ec.europa.eu/uploads/ILCD-Handbook-General-guide-for-LCA-DETAILED-GUIDANCE-12March2010-ISBN-fin-v1.0-EN.pdf (accessed on 6 April 2019).
  24. Rigamonti, L.; Grosso, M. Riciclo dei rifiuti-Analisi del ciclo di vita dei materiali da imballaggio (Waste Recycling-LCA of Packaging Materials), 1st ed.; Dario Flaccovio: Palermo, Italy, 2009. [Google Scholar]
  25. ecoinvent 3.3 Database. Available online: https://www.ecoinvent.org/database/ecoinvent-33/ecoinvent-33.html (accessed on 6 April 2019).
  26. Michael, H.; Mark, G.; Jerome, G.; Reinout, H.; Mark, H.; Olivier, J.; Manuele, M.; de An, S. ILCD Handbook-Recommendations for Life Cycle Impact Assessment in the European Context-Based on Existing Environmental Impact Assessment Models and Factors, 1st ed.; European Commission-Joint Research Centre: Ispra, Italy, 2011; ISBN 978-92-79-17451-3. [Google Scholar]
  27. Hischier, R.; Weidema, B.; Althaus, H.J.; Bauer, C.; Doka, G.; Dones, R.; Frischknecht, R.; Hellweg, S.; Humbert, S.; Jungbluth, N.; et al. Implementation of Life Cycle Impact Assessment Methods. Ecoinvent Report No. 3; Version 2.2; Swiss Centre for Life Cycle Inventories: Duebendorf, Switzerland, 2019. [Google Scholar]
  28. BORSINO RIFIUTI-Market Prices of Virgin and Secondary PP Granulate in Italy. Available online: http://www.borsinorifiuti.com/ (accessed on 6 April 2019).
Figure 1. Simplified chart of the life cycle of 100 RPCs as the number of rotations changes.
Resources 08 00110 g001
Figure 2. System under study and related boundaries (steps in boxes with a dotted line are excluded from the analysis).
Resources 08 00110 g002
Figure 3. Layout and mass balance of the production process of the RPCs. (A) Case of 100 new RPCs; (B) Case of RPCs replacing the losses of each reconditioning process.
Resources 08 00110 g003
Figure 4. Percentage contribution of the life cycle stages “production”, “end of life”, and “reconditioning” to the total value of all the indicators for 20 and 125 rotations of the RPCS. Results refer to the scenario W1-RE1. In order to better see the contribution of the reconditioning stage in response to the rotations, a focus on the ‘Ozone Depletion’ category (the category with the highest contribution of the reconditioning stage) and CED (the indicator with the lowest contribution of the reconditioning stage) is reported. Legend: CC: climate change; OD: ozone depletion; HT,NC: human toxicity, non-cancer effects; HT,C: human toxicity, cancer effects; PM: particulate matter; POF: photochemical ozone formation; A: acidification; TE: terrestrial eutrophication; FE: freshwater eutrophication; ME: marine eutrophication; FEC: freshwater ecotoxicity; RD: mineral, fossil and renewable resources depletion; CED: cumulative energy demand; WD: water resources depletion.
Resources 08 00110 g004
Figure 5. Contribution analysis of the reconditioning process for the four analyzed scenarios to the impact categories ozone depletion, terrestrial eutrophication, and freshwater ecotoxicity.
Resources 08 00110 g005
Figure 6. Comparison between the system based on reconditioning and re-use (RPCs system) and the single-use plastic crates (SPCs system): for each number of rotations, the ratio between the value of the indicator climate change in the RPCs and SPCs systems is reported. The other indicators are reported in Figures S2 and S3 of the Supplementary Material.
Resources 08 00110 g006
Table 1. Definition of the four analyzed scenarios (W1-RE1; W1-RE2; W2-RE1; W2-RE2) for the reusable plastic crates (RPCs) system. The scenarios were defined according to the current practice of reconditioning in Italy.
ParameterAnalyzed Scenarios
Percentage of crates that are washedW1: After the first inspection, all the crates are washed. The breakage rate 1 of the overall process (before and after washing) is 0.55%W2: After the first inspection, only 55% of the crates are washed, whereas the others are considered in sufficient hygienic conditions to be re-used without being washed. The breakage rate 1 of the overall process is 0.46%
Chemicals used in the washing stepRE1
  • commercial detergent based on soda
  • commercial disinfectant based on peracetic acid
RE2
  • soda (30% aqueous solution)
  • sodium hypochlorite (14% aqueous solution)
  • stabilizer based on citric acid
1 This is the average breakage rate established at the reconditioning facility, not including the rate of crates missed during the use phase and not returned to the poolers. This second rate is almost negligible and then, since no specific primary data were available, it was assumed equal to 0%.
Table 2. Inventory of the reconditioning step based on collected primary data. Data refer to 100 crates entering the reconditioning facility.
InputScenario
W1-RE1W1-RE2W2-RE1W2-RE2
Water for washing0.055 m30.030 m3
Heating of water (gas conventional boiler)32.2 MJ17.7 MJ
Electric energy2.48 kWh1.37 kWh
Disinfectant RE1 (16% acetic acid, 15% peracetic acid, 23% hydrogen peroxide, 1% stabilizer, 45% deionized water)0.099 kg-0.054 kg-
Disinfectant RE2 (sodium hypochlorite, 14% solution)-0.043 kg-0.024 kg
Detergent RE1 (40% soda, 0.6% alkyl alcohol alkoxylate, 59.4% deionized water)0.523 kg-0.288 kg-
Detergent RE2 (soda, 30% solution)-0.179 kg-0.099 kg
Stabiliser (10% citric acid, 5% lactic acid, 0.25% potassium iodate, 84.75% deionized water)-0.011 kg-0.006 kg
Transport for the supply of chemicals (light commercial vehicle)0.62 kg transported for 100 km0.23 kg transported for 100 km0.34 kg transported for 100 km0.13 kg transported for 100 km
Solid residues removed from crates (sent to incineration for municipal waste—100 km distance)46 g199 g
Wastewater (sent to a physical–chemical pre-treatment and then to a wastewater treatment plant)0.055 m30.030 m3

