Article

Future of Coastal Lagoons in Arid Zones under Climate Change and Anthropogenic Pressure. A Case Study from San Jose Lagoon, Mexico

by
Miguel Angel Imaz-Lamadrid
*,
Jobst Wurl
and
Ernesto Ramos-Velázquez
Área de conocimiento de Ciencias del Mar y de la Tierra, Universidad Autónoma de Baja California Sur, La Paz 23085, Mexico
*
Author to whom correspondence should be addressed.
Resources 2019, 8(1), 57; https://doi.org/10.3390/resources8010057
Submission received: 5 February 2019 / Revised: 15 March 2019 / Accepted: 20 March 2019 / Published: 25 March 2019

Abstract

:
In arid and semiarid zones, groundwater plays a key role in the ecology and availability of freshwater. Coastal lagoons in arid zones have great importance as a refuge for species of flora and fauna, as a source of freshwater, and for recreational purposes for local communities and tourism. In addition, as environments under natural stress, they are suffering pressure from anthropogenic activities and climate change, especially in zones with intense touristic development as in the case of the Baja California Peninsula in northwest Mexico. In this paper, we analyze the future of a coastal lagoon impacted by climate change and anthropogenic pressures. We constructed a groundwater MODFLOW-SWI2 model to predict changes in freshwater–saltwater inputs and correlated them with the geospatial analysis of the distribution and evolution of the water body and surrounding vegetation. The methodology was applied to the San Jose lagoon, one of the most important wetlands in the Baja California peninsula, which had been affected by anthropogenic activities and endangered by climate change. According to our water balance, the deficit of the San Jose aquifer will increase by 2040 as a result of climate change. The water table north of the lagoon will drop, affecting the amount of freshwater inflow. This reduction, together with an increase of evapotranspiration and the sea-level rise, will favor an increase of mineralization, reducing the surface water and groundwater quality and in consequence affecting the vegetation cover. Without proper management and adequate measures to mitigate these impacts, the lagoon may disappear as a freshwater ecosystem. Results of this research indicate that the use of a groundwater flow model, together with a geospatial analysis provide effective tools to predict scenarios for the future of coastal lagoons, and serve as a basis for land planning, nature conservation, and sustainable management of these ecosystems.

1. Introduction

Groundwater plays a key role in the distribution of freshwater and the ecology of arid and semi-arid zones [1], mainly due to low precipitation and high temperature, which means that the availability of surface water is low or non-existent.
Coastal lagoons are shallow water bodies with the influence of marine water and a particular ecology [2,3]. Freshwater inflow can come from in situ rainfall, runoffs, and horizontal groundwater flow [3,4,5]. In the case of the San Jose Lagoon, the groundwater flow plays an important role in the water and mass budget [5].
Usually, coastal lagoons have seasonal or limited connectivity to the sea through coastal barrier outlets, generating a confluence of fresh and saltwater [2,3,5]. They are also highly productive ecosystems, providing a wide range of ecosystemic services of socioeconomic value to coastal communities [3,6]. As a groundwater dependent ecosystem, they are facing increasing pressure from anthropogenic activities [6,7,8] and climate change [7]. These pressures modify groundwater levels and their temporal patterns and threaten vital ecosystem services such as arable land irrigation and ecosystem water requirements, especially during droughts [7]. Low groundwater levels may lead to an increase of seawater inflow [9] and an advance of the seawater intrusion into the aquifer [5], affecting not just the ecosystem but also groundwater quality. An important role is also played by the influx of seawater through a coastal barrier after extensive rainfall. This situation is clearly observable in the Baja California Peninsula, Northwest Mexico, where touristic development, agriculture and the increasing demand for freshwater, are increasing the pressure to aquifers and coastal environments. The San Jose Lagoon, located in the southern tip of the Baja California Peninsula, is a clear example of this situation. As a State Natural Reserve and RAMSAR site [5,10], it has been affected by anthropogenic pressures, reducing its extension and biodiversity [5,10]. In addition, this ecosystem will suffer additional pressure according to climate change scenarios [11,12,13].
The lagoon has been studied from a biological and chemical point of view so far, but the hydraulic interactions of inflows and outflows from surface water and groundwater have not been quantified for the lagoon, or for the sandbar outlet. These hydraulic variables are very important for the calculation of water budgets, to quantify changes of water levels, to determine the evolution of a seawater intrusion wedge, and to understand the impacts of these changes to the eco-hydrology of the lagoon.
One of the most popular groundwater models is MODFLOW, a cell-centered, 3D-finite difference model, which is recognized as a very useful tool for understanding regional groundwater systems, management of groundwater resources, and planning for future water consumption [14,15,16]; additionally, it has been demonstrated to be useful for the analysis of surface water bodies as lakes and lagoons [17,18,19,20].
Based on the geospatial analysis of recent and historical data and a groundwater model (MODFLOW and SWI2), we predict changes of freshwater and seawater inflows, calculate current and future water budgets, and define the potential effects to the eco-hydrology of San Jose Lagoon.

2. Materials and Methods
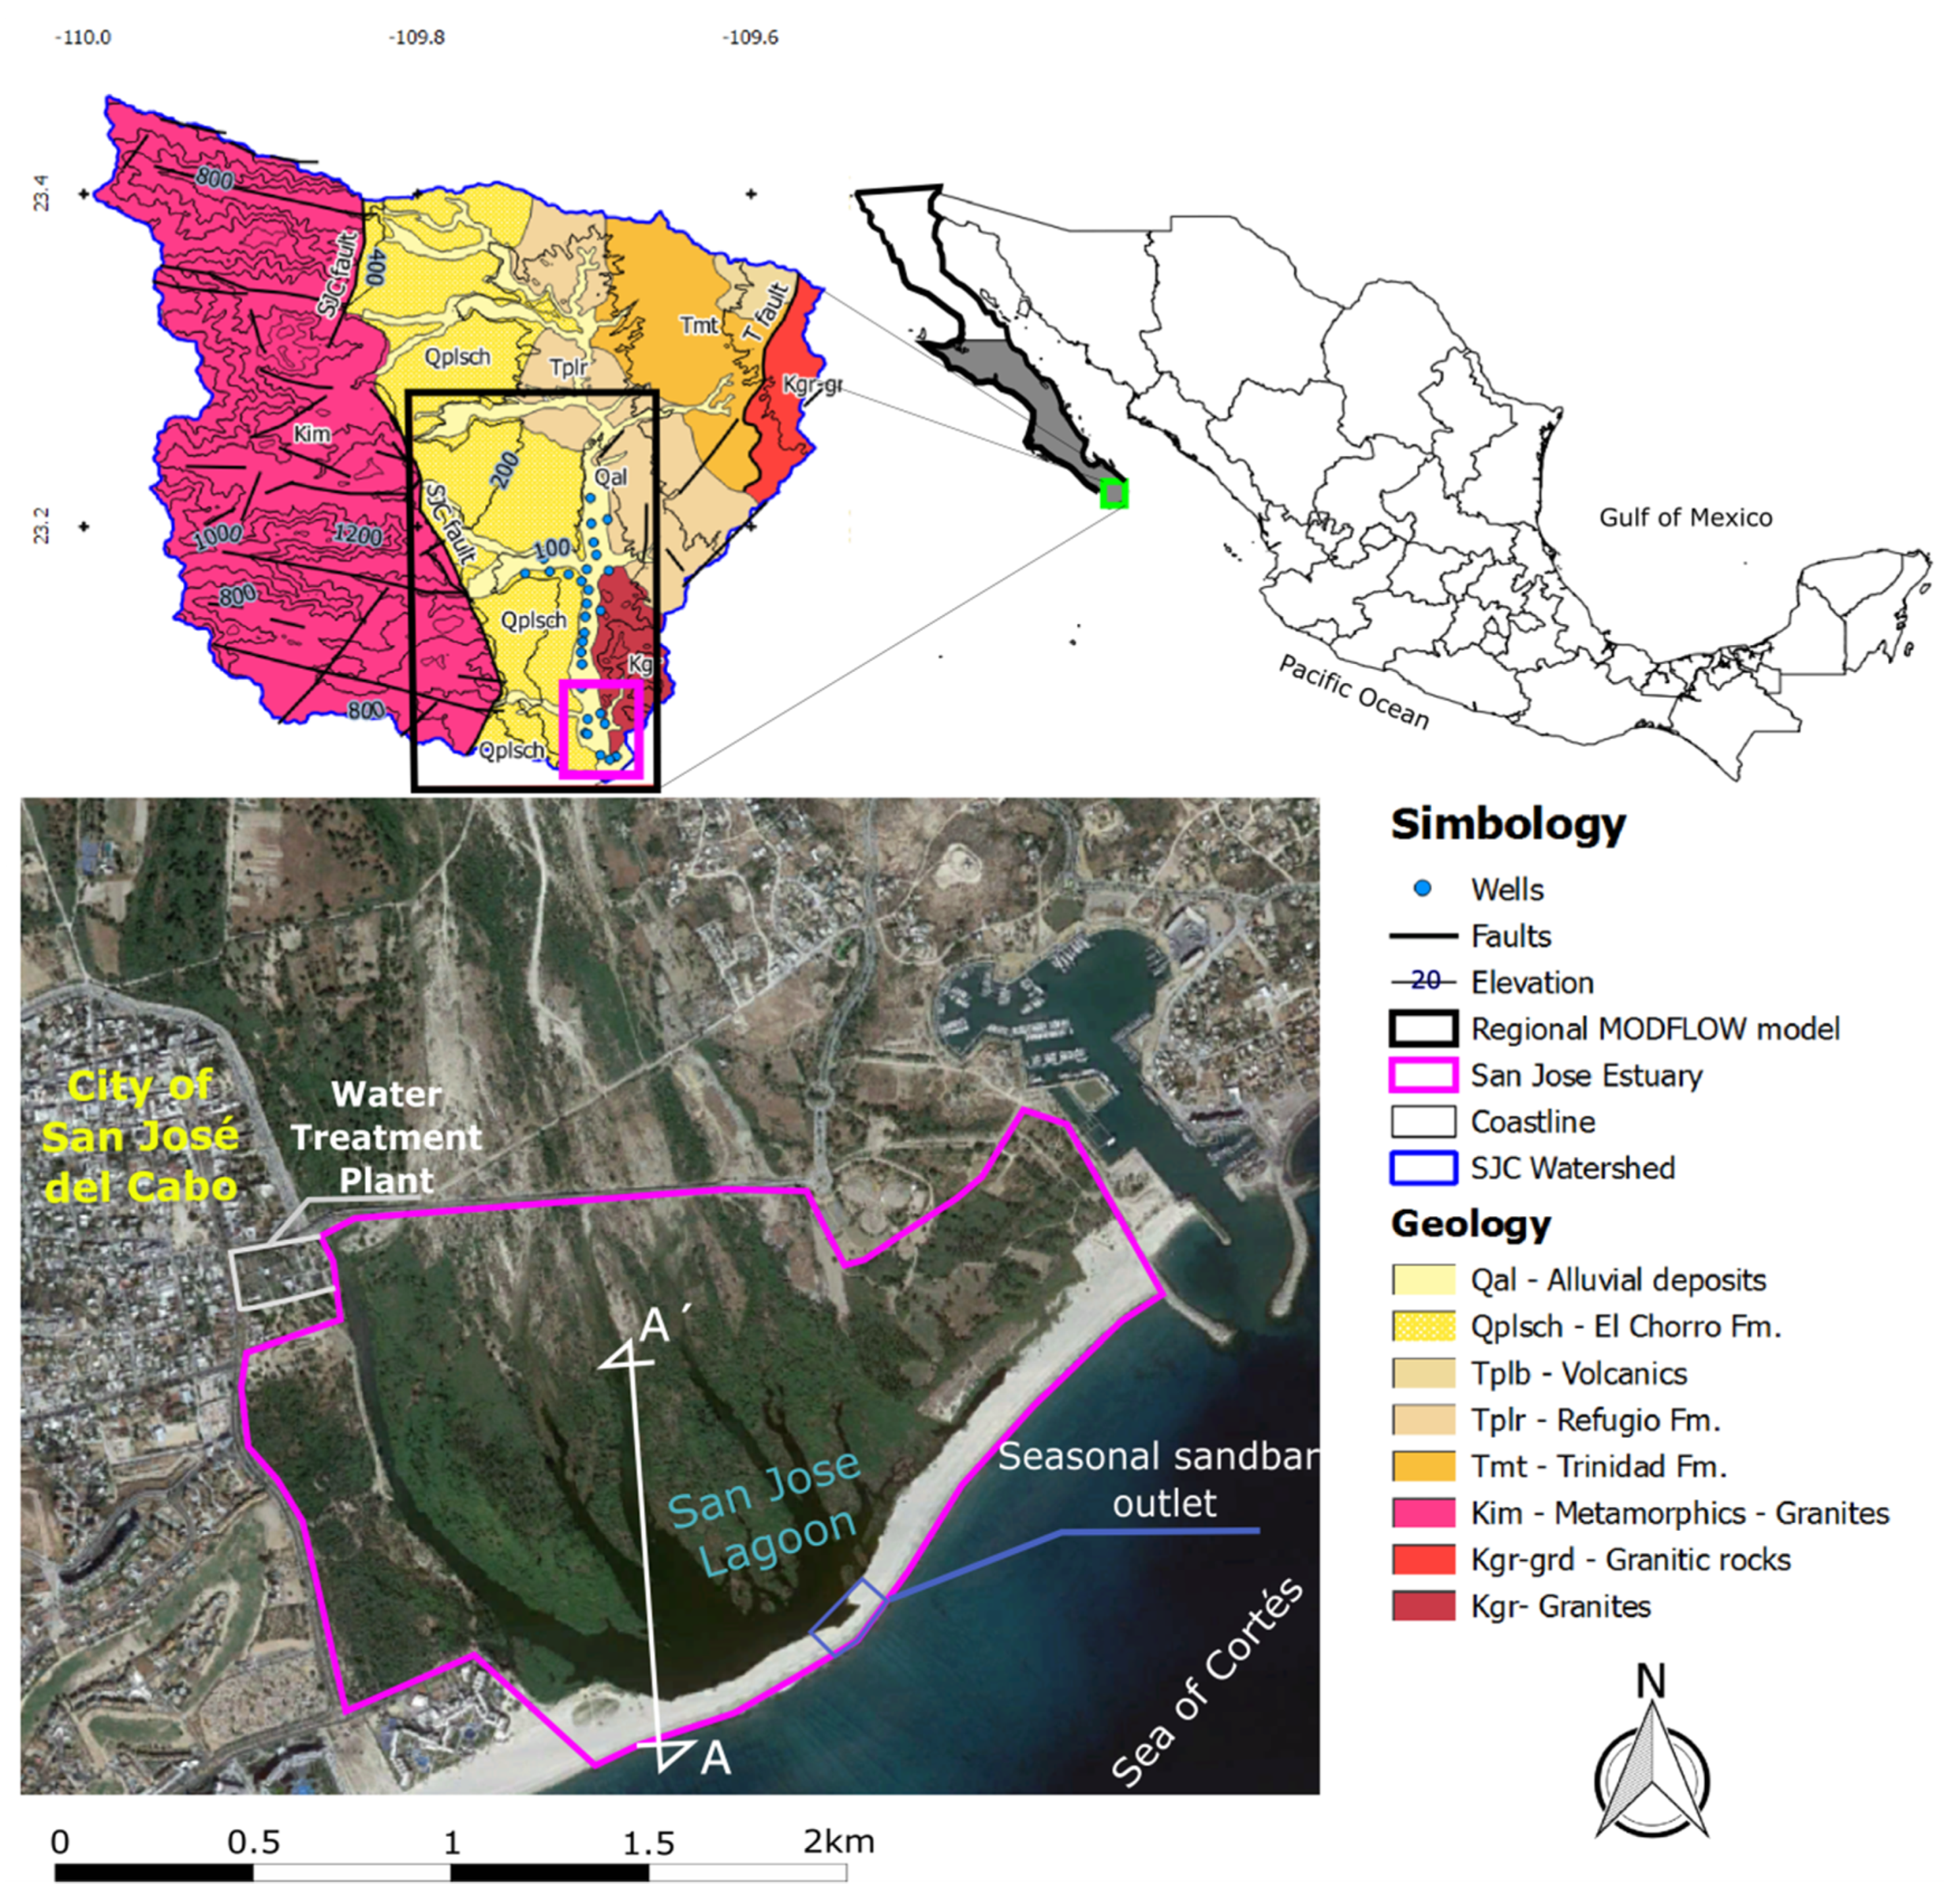
2.1. Study Area

San Jose Lagoon is one of the most important wetlands in the Baja California Peninsula because of its great biodiversity [5,10,21]. It forms part of the San Jose del Cabo watershed, located in the Mexican state of Baja California Sur on the southern tip of the Baja California Peninsula (Figure 1).
The extension of the watershed is 1278 km2 [5]. The climate is characterized by semi-arid conditions, with a temperature interval ranging from a maximum of 42.0 °C to a minimum of −2.0 °C with an average of 23.5 °C. Average annual rainfall is 421.5 mm/year, of which 30% occurs in the winter and 70% in the summer [5]. Summer rains are usually of high intensity and short duration, caused by the approach of tropical cyclones to the peninsula. The lagoon consists of fresh-brackish water, whose natural influx depends on the runoff from the upper part of the San Jose del Cabo watershed, flowing into the San Jose creek down to the lagoon and a saltwater flux from the sea [5]. There is also an influx from the water treatment plant of the nearby city of San Jose del Cabo [5].

2.1.1. Geology and Hydrogeology of San Jose Aquifer

From a geologic-tectonic perspective, San José del Cabo aquifer is located within the San Jose del Cabo sedimentary basin, which forms part of the Gulf of California Extensional Province. The evolution of the basin began during the Late Miocene [22] and represents a half-graben structure [22,23], with a sedimentary filling ranging from shallow marine to continental alluvial fans [23]. Mountain ranges of Cretaceous crystalline rocks (considered low permeability fractured aquifers) are located on both sides of the basin separated from the sedimentary units by normal faults [22,23] (Figure 1). The thickness of the sedimentary filling varies from 1.6 km north of the study area to less than 150 m near the coast [5,24]. The Trinidad Formation, located over the crystalline basement, is composed of shales, interbedded with sandstones with a maximum estimated thickness of 400 m [22]; it is considered a low permeability porous aquifer. The overlying Refugio Formation, with a maximum thickness of 380 m, is formed by coarse- to medium-grained sandstone beds, interbedded with limestones and shales [22]. This unit is weakly cemented with carbonates and considered a medium permeability porous aquifer. The El Chorro Formation, on top of Refugio Formation, with an estimated maximum thickness of 150 m, represents a classic alluvial fan landform which overlies older strata along an angular unconformity [22]. It is composed of coarse grain sandstones and conglomerates and considered a medium-high permeability porous aquifer. Quaternary sediments, with grain size from silts to pebbles and a thickness of 0.2–200 m are considered the youngest unit in the basin [22,23,25]. This unit is located in the arroyos and it is considered the main aquifer in the watershed [5,26].
The aquifer is over-exploited [5,26]. According to [26], the annual recharge volume of the aquifer is 35.9 × 10⁶ m3 of which 30.0 × 10⁶ m3 correspond to rainfall-runoff infiltration and groundwater inflows and 5.9 × 10⁶ m3 represents irrigation return flows and leakage of the water distribution system. The volume of outflows reaches 38.5 × 10⁶ m3, of which 27.7 × 10⁶ m3 are related to groundwater pumping and 10.8 × 10⁶ m3 to evapotranspiration, horizontal groundwater discharge, and spring discharge [26]. The annual water budget shows a deficit of 2.6 × 10⁶ m3 [26].

2.1.2. Hydrogeology of San Jose Lagoon

San Jose Lagoon is a highly complex hydrogeological environment. In this area, the watershed is narrower, with only 3 km width and a shallow sedimentary filling above the granitic basement [5]. There are no studies about the sedimentary column in the area; however, three main deposits can be identified: (a) alluvial deposits of the San Jose Arroyo stream bed composed of fine to coarse grain sands, pebbles, and boulders; (b) clayey sediments at the bottom of the San Jose Lagoon; and (c) sandy sediments of the coastal sandbar (Figure 1).
The hydrogeological database on the lagoon is very scarce. Most of the publications refer to conceptual models of the lagoon without calculating a water budget. The amount of freshwater in the lagoon varies seasonally during the year depending on groundwater levels, runoff from the upper part of San Jose del Cabo watershed, an influx of seawater from the ocean (superficial and underground), and in situ rainfall [5]; however, the condition of the lagoon can change drastically during the presence of tropical cyclones, and depending on their intensity. As water level increases (due to the inflow of freshwater from runoffs and in situ rainfall), the coastal sandbar weakens until it breaks, generating an outlet where freshwater is released to the sea. Then, there is an exchange of freshwater–seawater through the outlet, depending on the tides and the volume of water in the lagoon. After months, if climatic conditions are stable, the outlet closes and freshwater level increases again in the lagoon; however, an underground seawater intrusion through the sandbar sediments remains. Under extreme climatic conditions, runoff volume increases, causing changes to the geomorphology and ecology of the lagoon; for example in September 2001, runoffs generated by Hurricane Juliette removed 31.7% of vegetation [21].
An additional input of water comes from the wastewater treatment plant of San Jose, which discharges wastewater into San Jose stream, north of the lagoon at a rate of 2.5 to 6.3 × 10⁶ m3/year [27]. Although most of this discharge infiltrates or evaporates, an important volume reaches the lagoon generating an additional source of water and also pollution [5].

2.1.3. Ecological Importance of San Jose Lagoon

San Jose Lagoon is considered a valuable ecosystem in the region with important biodiversity of flora and fauna. According to [28], there are at least three species of freshwater shrimps, 14 species of continental and estuarine ichthyofauna, mammals such as Lepus californicus xanti, Sylvilagus audobonii confinis, Sylvilagus bachmani peninsularis, Urocyon cinereoargenteus, Ammospermophilus leucurus extimus, Neotoma lepida atenacea, Perognathus arenarius, and Peromyscus eva eva. Several species of birds have been observed in the area including Geothlypis beldingi which is in danger of extinction [28].
Around the lagoon, the most abundant species of vegetation are mesquite forest (genus Prosopis), carrizo (Phragmites australis), palmar (Washingtonia robusta), grasses, and halophytes.
In 1994 the government declared the zone as a State Ecological Reserve, subject to ecological conservation. After the effects generated by hurricane Juliette in 2001 [10], the management plan had to be updated. Since 2009, the lagoon was designated a RAMSAR site.
According to [10], the main problems in the State Ecological Reserve are irregular construction of facilities within the reserve as well as motorbike rental; deforestation due to illegal harvesting of palm leaf and complete extraction of palms; dumping of debris, pans, and trash up the lagoon; urbanization; introduction of new species of flora and fauna; impairment of vegetation due to burning and increased fires; fragmentation of topography and hydrology resulting from sidewalks, roads, with man-modified environment substituting for natural environment.

2.1.4. Climate Change Scenarios Expected for the Study Area

In several publications the effects of climate change have been addressed; some of them refer to global models [29,30,31], others are focused on Mexico [11,12,13,32,33].
Rainfall-related models predict a reduction of non-cyclonic rains and intensification of tropical cyclones for the short-term future (2040). According to [30], a reduction of 10% is forecasted for non-cyclonic rains while cyclonic rains will increase by 10% for RCP 4.5. Cavazos et al. [12], propose a mean annual rainfall reduction of −27 to −32% for RCP 4.5 and RCP 8.5, respectively. Bello-Jiménez et al. [11] and [13] estimate an increase of intensity and frequency of tropical cyclones (Table 1.)
Changes of evapotranspiration due to climate change are also expected. In Northwest Mexico, [33] proposes an increment of 10% (A1B scenario) for 2100, while [32] proposes an increment ranging from 2–7% for 2050 and under the A1B scenario.
Regarding global sea-level rise, the most detailed data compilation is presented in [29], ranging from 0.26 to 1.4 m for 2100 under different RCP scenarios. Vermeer et al. [31] forecast a maximum rise of 1.9 m (A2 scenario) for 2100. Other predictions consider a sea-level rise as a result of hydrometeorological events. Melillo et al. [34] propose for United States an increase of hurricane intensity in the near future, generating a sea-level rise of 0.9 to 4.6 m for 2050 (combination of sea-level rise and storm surges).

2.2. Spatial Analysis of Vegetation Distribution and Lagoon Surface

In order to estimate the evolution of the extension of the vegetation coverage and the flooding area of the lagoon, a spatial analysis was done using satellite imagery.
Landsat 8 and Sentinel images with a resolution of 10 m for years 2001–2008, 2010, 2012–2014, and 2016–2017 were uploaded in Qgis 3.0 to estimate the coverage of the vegetation and the shape of the lagoon for each year. The results of this evaluation were compared with the annual rainfall between 2001 and 2017 using data from San Jose del Cabo weather station [35]. This station is the closest to the study area, located 3 km northwest of the lagoon. Its database includes daily records from 1926 to 2016. The mean annual rainfall measured at this station is 259.2 mm/year, with a standard deviation of 190.8 mm/year. Years with extreme rainfall values were correlated with tropical cyclones using the weather-UNISYS hurricane track database [36].
The evolution of the spatial distribution of mesquite forest (genus Prosopis), carrizo (Phragmites australis) and palmar (Washingtonia robusta) around San Jose Lagoon was calculated using data from [21], field data and satellite imagery.

2.3. Groundwater Model

Due, to the importance of groundwater in the water budget of the lagoon, a regional groundwater MODFLOW-SWI2 model was built, to understand the depletion of water levels and the behavior of seawater intrusion. The model was calibrated for the period 2010–2016, dividing each year into three periods: dry season (180 days), and wet season (60 days of cyclonic rains + 125 days of non-cyclonic rains).

Conceptual Mathematical Model Design

Groundwater modeling of San Jose aquifer was constructed using Model Muse [37], which incorporates MODFLOW-2005. Model Muse is a graphical user interface (GUI) developed by the United States Geological Survey (USGS) for the MODFLOW-2005 algorithm [38], which is a modular finite-difference flow model that solves the groundwater flow equation. This program simulates steady and transient flows in an irregular flow system in which the layers of the aquifer can be confined, unconfined or a combination of them [39]. The governing equation used by MODFLOW-2005 is
x ( K x x h x ) + y + ( K y y h y ) + z + ( K z z h z ) + W = S s   h t
where h denotes the potentiometric head (L); K denotes the hydraulic conductivity (L/T); Ss denotes the specific storage of the porous material (L−1); W denotes the volumetric flux per unit volume representing sources and/or sinks of water (T−1); and D denotes the model domain.
The San Jose Aquifer model includes three natural boundaries: the coastline of the Pacific Ocean, simulated as general head condition, and fractured aquitards of Sierra La Victoria to the west and Sierra La Trinidad and Cerro Las Cabras to the east, defined as no flow condition. Using a finite difference approach, the mesh consisted of five layers with cell sizes of 25 × 25 m near the coastline and 100 × 100 m in the rest of the model; the modeled area is 326 km2. Starting heads of the model were the 2010 water levels provided by the Mexican National Water Commission [40]. The top of the aquifer was obtained, from an ASTER-GDEM 30 m elevation model re-sampled to 25 m, and our field measurements obtained with a barometric corrected GPS. The granitic basement and the thickness of the layers were defined using geological sections from the Mexican Geological Survey [41], geological studies [22,23], and resistivity sections provided by [40]. A database of 59 wells and their extraction volumes provided by [40] was introduced to the model using the Well package.
The initial hydraulic conductivity for the top layer (unconsolidated sediments) was calculated from 25 soils samples analyzed with a permeameter (TMI, Ohio, USA). After calibration, resulting values ranged from 5.7 to 47.5 m/d. In Layer 2 (medium to coarse grain sedimentary rocks), values ranged from 0.3 to 4.6 m/d. Theoretical values of 0.1, 0.001 and 0.0001 m/d from [42], were used for layer 3 (fine grain sedimentary rocks), layer 4 (weathered granitic rocks) and layer 5 (fresh granitic rocks) respectively. Specific storage and specific yield values obtained from [43,44], were applied according to the simulated rock (Table 2).
The average annual recharge of San Jose del Cabo aquifer is 35.9 × 10⁶ m3 [26] of which 5.2 × 10⁶ m3 are considered as irrigation return flow. The recharge of the aquifer results from direct infiltration of rainfall, infiltration of runoffs via the arroyos after storm events, horizontal groundwater flows from the Sierras, and anthropogenic processes (irrigation return flow and infiltration of discharges of wastewater). The recharge package was used to simulate direct infiltration of rainfall, horizontal groundwater flow, and irrigation return flow. Infiltration of surface water in the arroyos was simulated using Streamflow package [45]. The mean annual runoff volume was calculated using the mean annual rainfall value of 421 mm/year [26] and a runoff coefficient of 17% [5]. An estimated volume of 9.5 × 10⁶ m3, which represents the 50% of the capacity of two dams located in the watershed was rested, resulting in a volume of 82 × 106 m3. Ninety-one percent of this value was introduced into the wet-hurricane season time step (60 days), while the remaining 9% was introduced in the wet-raining season time step (125 days).
SWI2 package [46], was used to perform the simulation of the seawater intrusion. This package was designed to simulate regional seawater intrusion in coastal aquifer systems by representing variable-density flow with discrete zones of uniform or linearly varying density [46]. SWI2 adopts de Dupuit approximation and is able to simulate multiple aquifers; each aquifer (represented as a single layer model) is discretized vertically into zones of different densities. As a result a SWI2 model requires far fewer cells than dispersive solute transport simulations [14].
To carry out this process, the groundwater was defined as zone 1 with a dimensionless density of 0.000 while the ocean was defined as zone 2 with a dimensionless density of 0.025. The coastline was modeled as a fixed level “0” for all scenarios. The initial Z surface (interface seawater–freshwater) was introduced based on the Ghyben-Herzberg equation, and the 2016 water levels obtained from [40].
In the manual calibration process, hydraulic conductivity values were adjusted by zones to achieve a concordance between the observed and simulated hydraulic heads for the period 2010–2016. A total of 100 randomly chosen points were selected for the calibration process. The regression between the calculated and the observed levels had an R2 of 0.9943 which represents a valid model according to [47] and [48] (Figure 2).
After the calibration step, three scenarios were simulated for the year 2040 (Table 3). The CUR17/40 scenario was designed to simulate water levels under current climatic and oceanographic conditions. A conservative scenario CON40 represents a reduction of 10% of rainfall, 10% increase of runoffs [30], and an increase of 2.6% of evapotranspiration (calculated after [32]); finally, the extreme scenario EXT40 represents a reduction of 32% of rainfall [12], increase of evapotranspiration of 7.6% (calculated after [32]), and an augmentation of 20% of runoffs. The sea-level rise was defined at 0.83m and 1.0m for CON40 and EXT40 scenarios (calculated after [29,31]).
After the prognostic run, water budgets were calculated for the aquifer and for the lagoon. The water budgets for the lagoon considered scenarios with the sandbar outlet opened and closed. The CUR17 scenario was used as a baseline to compare with the other scenarios.

3. Results

3.1. Water Budget and Climate Change Effects for the Regional Groundwater Model and San José lagoon

For the regional groundwater model, CUR40 scenario shows a reduction in a range of −0.1 to −3.0 m for 2040. The maximum water level for CUR40 is 140 m. As for the CON40 scenario, water levels drop in a range of −0.1 to −4.0 m; finally, the EXT40 scenario shows a water level reduction in a range of 0.1 to 4.5 m and up to 1.5 m in the lagoon area (Table 3).
Regarding water budget, for CUR40 scenario, the annual aquifer balance indicates an average deficit of −3.5 × 10⁶ m3, with a positive balance of 7.8 × 10⁶ m3 during the wet season, due to the increase of recharge, and a deficit in the dry season of −11.3 × 10⁶ m3. The annual deficit for CON40 and EXT40 scenarios increases to −4.3 × 10⁶ m3 and −6.5 × 10⁶ m3, respectively, as a result of a reduction of freshwater input during the wet season (Table 4).
Regarding San Jose Lagoon, especially on its northern side, water levels will drop from 2.4 m in 2017 to 2.1, 1.7, and 0.9 m for 2040, for CUR40, CON40, and EXT40 scenarios respectively.
The scenario CUR17, which defines the current state of the lagoon, results in an annual water balance of 102 × 104 m3 with the sandbar outlet closed, and a deficit of −97.8 × 10⁴ m3, with the sandbar outlet opened (Table 4). For the year 2040 (CUR40), the groundwater inflow (HGI) decreases to 82.7 × 10⁴ m3; therefore, the annual balance with the sandbar outlet closed reduces to 66.5 × 10⁴ m3, and the deficit with the sandbar outlet opened increases to −133.3 × 10⁴ m3 (Table 4).
As for CON40 and EXT40 scenarios, reductions are observed for in situ rainfall (R), horizontal groundwater inflow (HGI), and outflow (HGO), while there is an increase of evapotranspiration (ETO). This generates for CON40 an annual balance of 10.6 X 10⁴ m3 with the sandbar outlet closed, and a deficit of −189.1 X 10⁴ m3 with the sandbar outlet opened, while for EXT40 and regardless the status of the sandbar outlet, water balances show a deficit of −108.6 X 10⁴ m3 and −308.5 X 10⁴ m3 (Table 5).

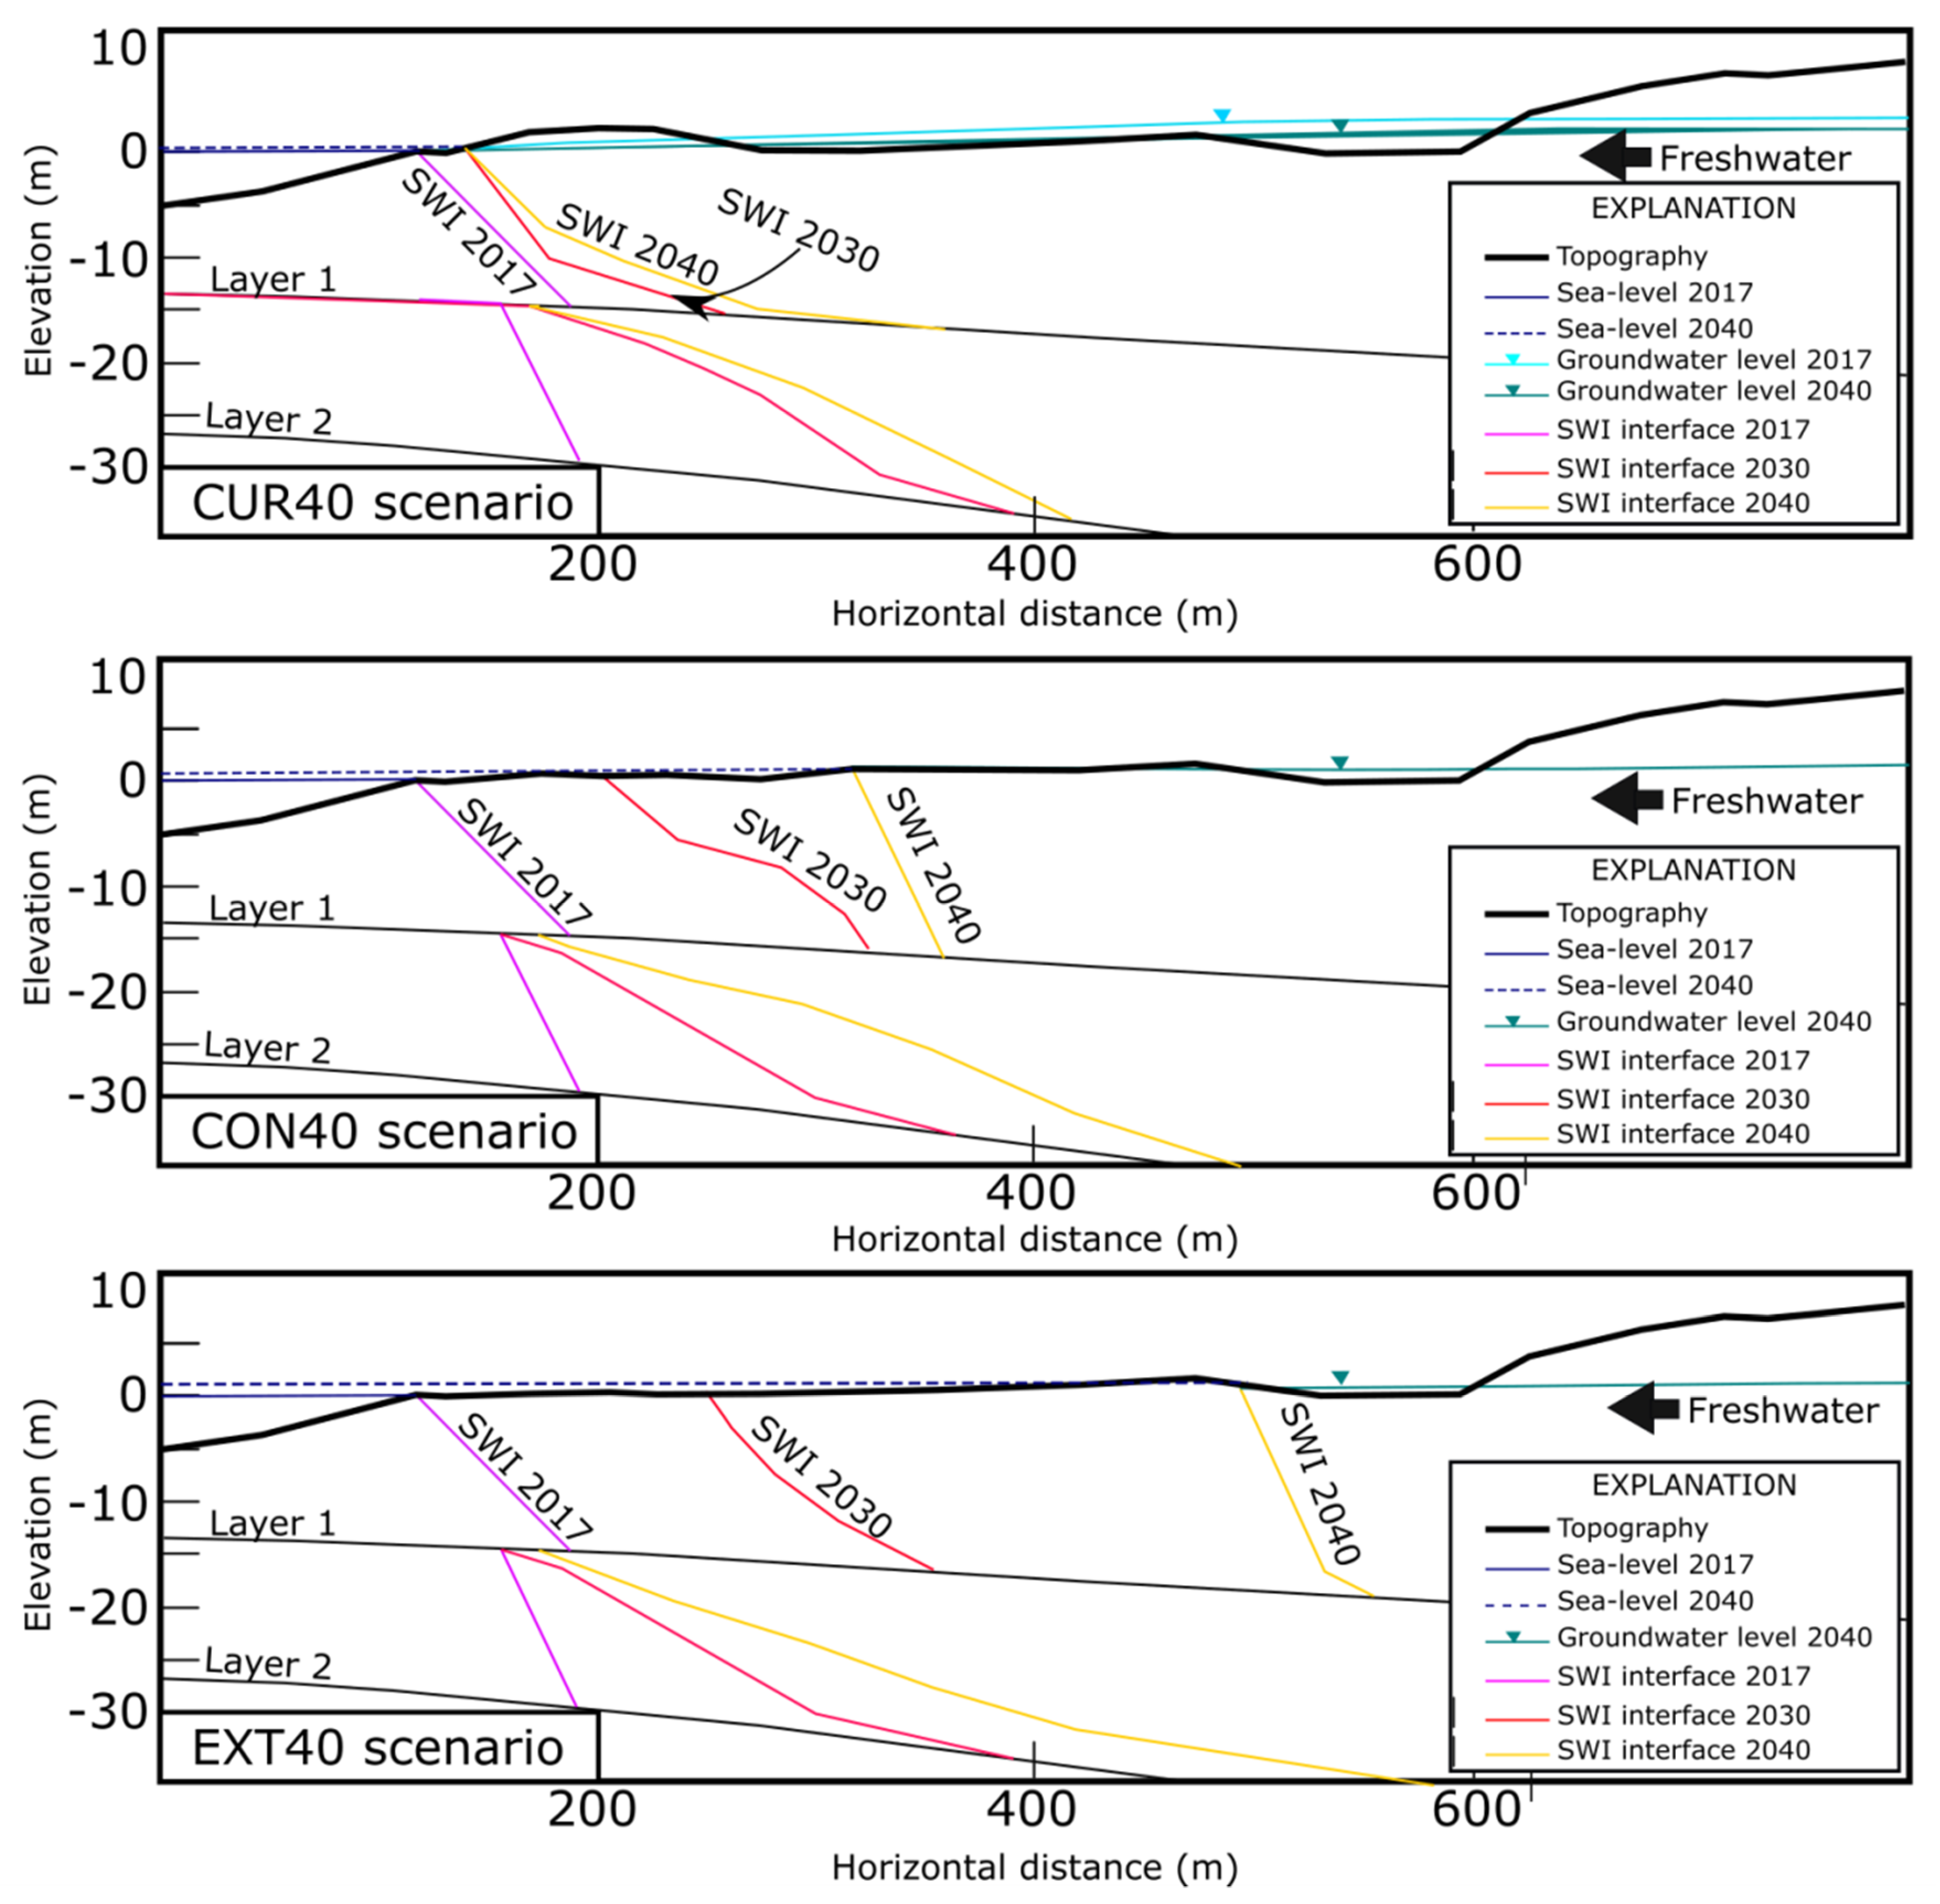
3.2. Expected Surface and Underground Seawater Intrusion in the Lagoon

Considering a sea-level rise of 0.8 m (scenario CON40), seawater will migrate 60 m inland flooding an area of 29,115 m2. With a 1.0 m sea-level rise (scenario EXT40), the migration will be up to 230 m, affecting an area of 52,390 m2 of the lagoon. The affected area represents 17 and 29% of the actual coverage of the lagoon (Figure 3).
Seawater wedge maximum advance for the CUR40 scenario is 74 and 103 m towards land for 2030 and 2040 respectively. Regarding the CON40 scenario, the movement of the wedge is higher, reaching a maximum advance of 122 m for 2030 and 143 m for 2040; finally, the EXT40 scenario has the highest advance of the wedge, with a maximum of 131 and 328 m for 2030 and 2040 respectively (Figure 3).
In the case of layer 2, the maximum advances for CUR40, CON40, and EXT40 scenarios for 2030 are 111, 113, and 125 m and 150, 199, and 290 m for 2040 respectively.
According to the model, for the CUR40 scenario, the volume of the seawater wedge is 7.3 × 10⁶ m3. This value increases for the CON40 scenario, reaching 11.73 × 10⁶ m3; finally, for the EXT40 scenario, the volume is 13.2 × 10⁶ m3.

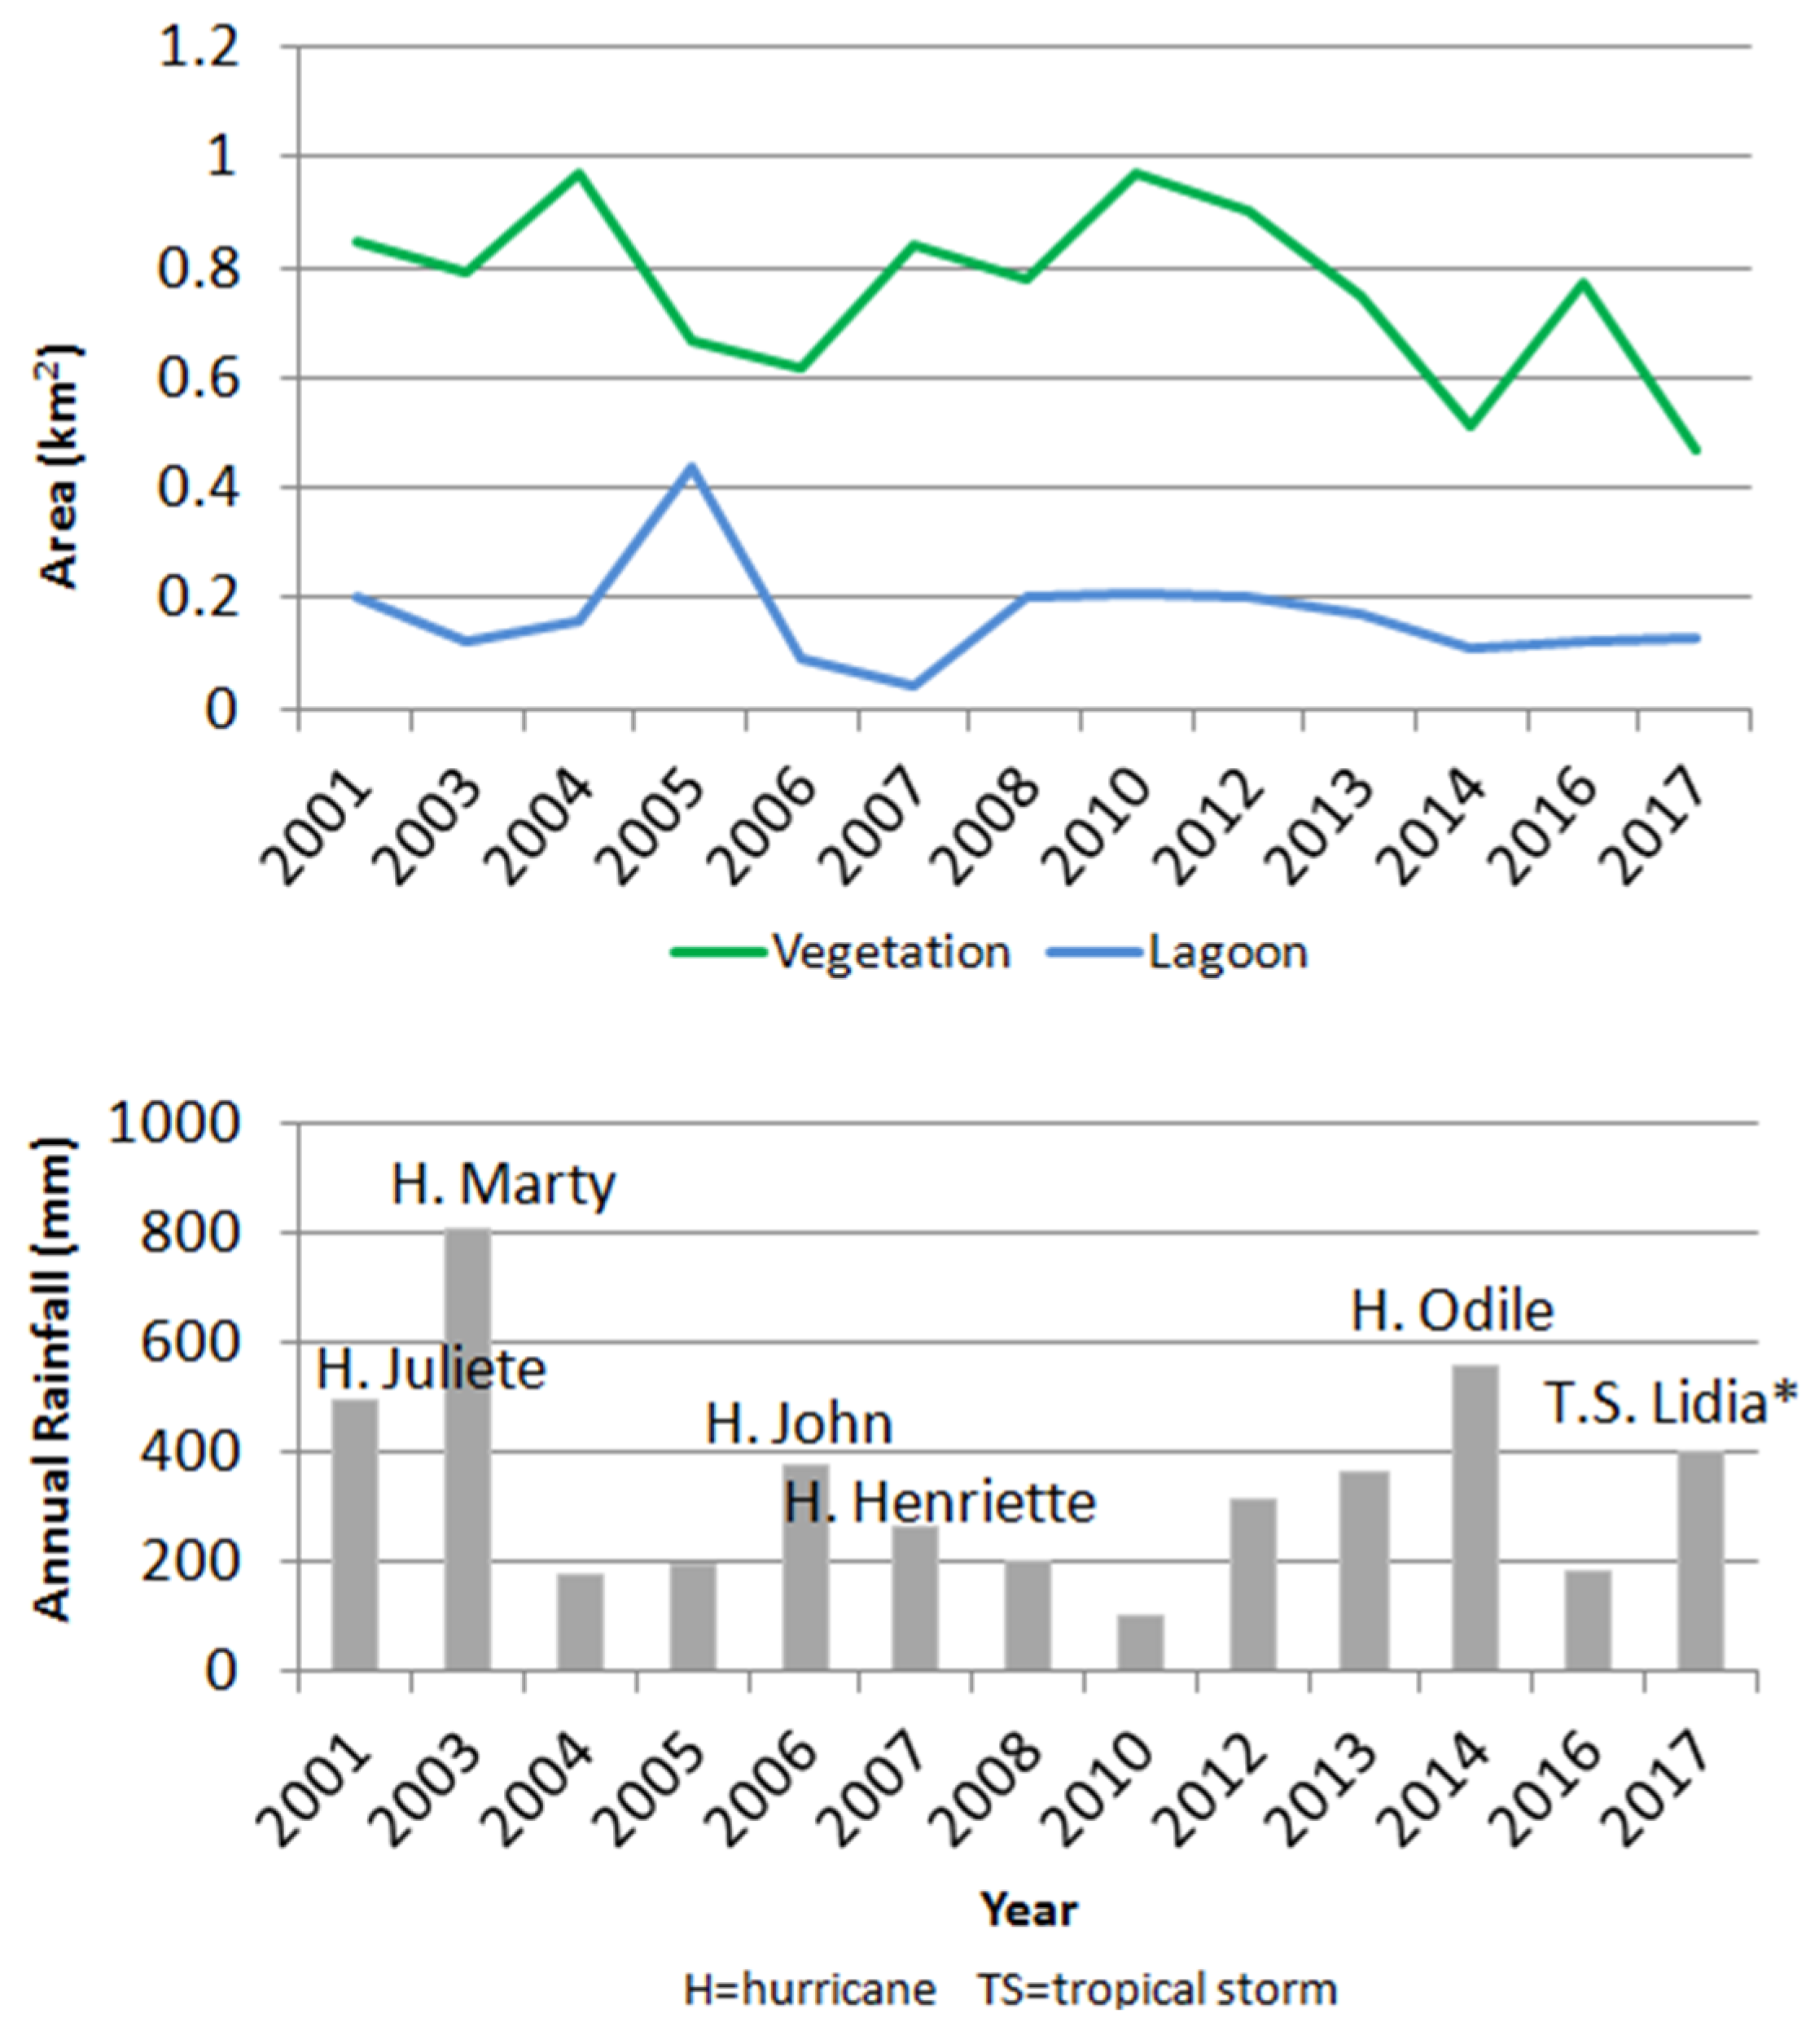
3.3. Changes in the Spatial Distribution of Vegetation and the Lagoon (2001–2017)

The results indicate that both the vegetation cover and the extent of the lagoon have been reduced from 2001 to date. With respect to the vegetation, the maximum observed coverage was 0.97 km2, in 2010, while the minimum was 0.47 km2 in 2017. The average from 2001 to 2017 is 0.76 km2 (Figure 4).
Nowadays, three species of flora are dominant around the lagoon: Prosopis pubescens covering an area of 0.16 km2, Phragmites australis with 0.15 km2; finally, Washingtonia robusta with 0.14 km2. Halophiles are found near the southern part of the lagoon.
About the water body, the maximum extension occurred in 2005 reaching 0.44 km2, while the minimum was 0.04 km2 in 2007. The mean surface from 2001 to 2017 is 0.17 km2. The lagoon has decreased by 26% since 2001 (Figure 4).

4. Discussion

4.1. Limitations

The quality of the data and the calibration process is essential to validate any model. Once calibrated, MODFLOW and SWI2 act as powerful tools for simulating groundwater conditions and for groundwater-surface water interaction. Although this has been established in the current study, the current novelty of the model and dependence on its components give rise to some limitations.
Climate change scenarios always have an amount of uncertainty, particularly related to the magnitude and rate that each parameter change [29,30]. This uncertainty increases with time. Although we perform the simulations for the short-term future (to reduce uncertainty), it is possible to expect variability compared to real data. This situation reaffirms the need to continue recalibrating the model as new updates of climate change impacts are published.
About anthropogenic impacts, the amount of pumping from the aquifer and governance are aspects which are difficult to forecast and need to be recalibrated in case of new patterns observed within the simulated time.
With this methodology is possible to forecast changes to the vegetation coverage and salinity of the water body; however, its quantification is not viable due to the limitations of MODFLOW and SWI2 as hydraulic models.

4.2. Expected Hydrogeological and Geomorphological Impacts on the Lagoon

After the calibration step, the calculated water budget indicates that nowadays, the aquifer is overexploited, with an annual deficit of −3.5 × 10⁶ m3, which is 0.68 × 10⁶ m3 more than reported by [26].
Climate change scenarios for Northwest Mexico suggest that most of this area will have a reduction of rainfall [11,12,13,30] and an increase of evapotranspiration [32,33]; however, places located near the tip of Baja California peninsula could expect an increase of intensity and frequency of tropical cyclones [11,13]. These scenarios are congruent with the global scenarios presented by [30].
Cyclonic rains in the study area are usually intense and short duration [5]. According to the model, an increase of intensity will augment the volume of runoffs, but recharge will not increase. This phenomenon has been previously predicted for the Santo Domingo aquifer, located 400km north of the study area [15].
As infiltration by streams remains stable, recharge related to groundwater horizontal flow and in situ rainfall become more important. The expected reduction of these inputs and an increase of evapotranspiration will reduce the annual recharge of the aquifer; thus, generating depletion of water levels and an increase in the deficit by 2040.
Considering the lagoon as a complex hydrological system with a surface interaction between continental and marine water through a seasonal sandbar outlet and a second underground interaction between fresh groundwater and seawater [5], the forecasted results show that a water level depletion of 1.5 m, north of the lagoon may have an important effect in the inflow of freshwater to the lagoon. Climate change scenarios will worsen this situation as the forecasted increase of runoff volumes and storm surges as a result of the intensification of tropical cyclones [11,13,30,34], in combination with the forecasted global sea-level rise [29,31], will increase the rate of erosion upstream and in the sandbar which represents an hydrological separation between the lagoon and the sea according to [5]. As a result, the amount of surface saltwater flowing into the lagoon will increase, modifying its salinity. Underground, the seawater intrusion wedge will move inland (Figure 3), affecting groundwater quality.
Another important aspect to consider is that geomorphological changes occur in the lagoon. According to [10,21], and the analysis of satellite imagery, the geomorphology of the lagoon has changed considerably since 2001. After extreme runoff events, due to the impact of tropical cyclones, erosion is generated in the upper-central zone of the lagoon while a deposit of sediments occurs in the coastline, extending the beach, but also reducing the height of the sandbar. In addition, and depending on the intensity of the event, the sandbar outlet grows, increasing the exchange of fresh-saline water. This situation together with a sea-level rise may undergo a change in coastal dynamics, generating two possible scenarios: the disappearance of the lagoon as such, giving rise to a new coastal environment, or the migration of the lagoon upstream.

4.3. Expected Ecological Impacts on the Lagoon

In 2001 a reduction of the vegetation coverage, specially Prosopis pubescens, Phragmites australis, and Washingtonia robusta was analyzed by [21]. After this event, recovery was observed for 2004, 2007, and 2010; however, results of the geospatial analysis show a trend to reduction for the period 2001–2017.
As previously discussed by [5,10], the expansion of the touristic infrastructure has led to the increase of freshwater demand, affecting groundwater inflow into the lagoon, the removal of vegetation, and the modification of the coastline for the construction of touristic related projects. Inadequate management protocols have led to the disposal of wastewater from the treatment plant and other not officially published sources, contributing to the pollution of the lagoon. Also, several fires have affected large portions of the area in the past. The impact of six tropical cyclones has also contributed to the reduction of vegetation. The forecasted increase of frequency and intensity of tropical cyclones [11,13,30], will worsen this situation, as the recovery time will be reduced and the erosive force of runoffs will be greater.
Another scenario to consider is the expected increase in salinity. As salinity in the lagoon increases due to the reduction of freshwater inflow and augments of seawater input, vegetation will suffer stress, possibly accelerating the reduction of freshwater-dependent vegetation.

5. Conclusions

Coastal lagoons and wetlands are valuable ecosystems which play an important role in providing ecological services to coastal populations, sources of freshwater and refuge of fauna species. They are fragile ecosystems which are susceptible to degradation in the face of natural or anthropogenic impacts. In arid areas with strong touristic development such as Baja California Sur, where desert climates predominate, the pressure on these ecosystems is even greater.
Its geographical location places San Jose Lagoon in a vulnerable situation, as it is surrounded by population centers which generate pressures to the ecosystem. The extraction of groundwater for the town of San Jose and its touristic industry and the discharge of wastewater from the treatment plant is reducing the extension and quality of the lagoon. The inappropriate land planning which has led to urbanization, illegal harvesting of palm, dumping of debris, fragmentation of the environment—resulting from sidewalks, roads, and man-made structures—has generated a drastic transformation of the borders of the lagoon affecting the distribution of the vegetation and also contributing to the reduction of the water body. Climate change will worsen this situation as saltwater from the sea will flood the southern portion of the lagoon, promoting a migration inland of the seawater intrusion wedge. As a result, salinity of the lagoon and the southern part of the aquifer will increase.
The future of the lagoon as a freshwater body is uncertain, however; actions can be done to mitigate the impacts of anthropogenic activities and climate change. An adequate management of the San Jose aquifer may lead to the restoration of freshwater inflow to the lagoon; the implementation of programs for ecological protection and restoration may contribute to improving the health of the ecosystem, the upgrade of the State Reserve to a Natural Protected Area may lead to the creation of buffer zones to reduce the impact of the touristic industry and illegal activities.
The methodology we proposed, lets us quantify the response of the eco-hydrology of the lagoon to anthropogenic and climate change pressures for the near future, demonstrating its effectiveness as a tool for promoting the conservation of coastal lagoons.

Author Contributions

Conceptualization, M.A.I.-L. and J.W.; methodology, M.A.I.-L. and J.W.; writing—original draft preparation, M.A.I.-L.; writing—review and editing, E.R.-V. and J.W.

Funding

This research received no external funding.

Acknowledgments

To Consejo Nacional de Ciencia y Tecnología (CONACYT) for supporting me with a maintenance studentship number 472873 (CVU 336427). To the University of Baja California Sur (UABCS) for its support, especially to CIMACO doctoral program, Engineering in Fisheries Department and Engineering in Prevention of Disasters and Civil Protection program.

Conflicts of Interest

The author declares that there is no conflict of interest. The sponsors had no role in the design of the study, a collection of analysis, interpretation of the data, writing of the article and in the decision to publish the results.

References

  1. Cui, Y.; Shao, J. The role of groundwater in Arid/Semiarid Ecosystems, Northwest China. Groundw 2005, 42, 471–477. [Google Scholar] [CrossRef] [PubMed]
  2. Mencio, A.; Casamitjana, X.; Mas-Pla, J.; Coll, N.; Compte, J.; Martinoy, M.; Pascual, J.; Quintana, X.D. Groundwater dependence of coastal lagoons: The case of La Pletera salt marshes (NE Catalonia). J. Hydrol. 2017, 552, 793–806. [Google Scholar] [CrossRef]
  3. Stumpp, C.; Ekdal, A.; Gönenc, I.E.; Maloszewski, P. Hydrological dynamics of water sources in a Mediterranean lagoon. Earth Syst. Sci. 2014, 18, 4825–4837. [Google Scholar] [CrossRef] [Green Version]
  4. Kazuhisa, A.C.; Iwasaka, W.; Al Mamun, A.; Ohmori, K.; Yo-suke, I. The role of groundwater outflow in the water cycle of a coastal lagoon sporadically opening to the ocean. J. Hydrol. 2012, 423–430. [Google Scholar] [CrossRef]
  5. Wurl, J.; Imaz-Lamadrid, M.A. The hydrogeological conditions in the San José del Cabo basin, Baja California Sur, Mexico. Areas Nat. Prot. Scripta 2016, 2, 91–102. [Google Scholar] [CrossRef]
  6. Camacho-Ibar, V.F.; Rivera-Monroy, V.H. Coastal Lagoons and Estuaries in Mexico: Processes and Vulnerability. Estuaries Coasts 2014, 37, 1313–1318. [Google Scholar] [CrossRef] [Green Version]
  7. Felix, P.M.; Correia, M.J.; Chainho, P.; Costa, J.L.; Chaves, M.L.; Cruz, T.; Castro, J.J.; Mirra, C.; Domingos, I.; Silva, C.F.; et al. Impact of freshwater inputs on the spatial structure of benthic macroinvertebrate communities in two landlocked coastal lagoons. Hydrobiologia 2015, 758, 179–209. [Google Scholar] [CrossRef]
  8. Kløve, B.; Ala-Aho, P.; Bertrand, G.; Gurdak, J.J.; Kupfersberger, H.; Kværner, J.; Muotka, T.; Mykrä, H.; Preda, E.; Rossi, P.; et al. Climate change impacts on groundwater and dependent ecosystems. J. Hydrol. 2014, 518, 250–266. [Google Scholar] [CrossRef] [Green Version]
  9. Dussaillant, A.; Galdames, P.; Sun, C. Water level fluctuations in a coastal lagoon: El Yali Ramsar wetland, Chile. Desalination 2009, 246, 202–214. [Google Scholar] [CrossRef] [Green Version]
  10. Olmos-Martínez, E.; Arizpe-Covarrubias, O.; Contreras-Loera, M.R.; González-Ávila, M.E.; Casas-Beltrán, D.A. Public opinion and perception on the conservation of Estero San José del Cabo state ecological reserve. Vivat Academ. 2016, 135, 24–40. [Google Scholar] [CrossRef]
  11. Bello-Jiménez, B. Evaluación de la Influencia de la Oscilación Decadal del Pacífico (PDO) en la Lluvia de Verano y la Incidencia de Sistemas Tropicales en Baja California Sur, bajo el Efecto del Cambio Climático. Master’s Thesis, Autonomous University of Baja California Sur, La Paz, México, 2018. Available online: http://biblio.uabcs.mx/tesis/te3920.pdf (accessed on 15 September 2018).
  12. Cavazos, T.; Salinas, J.A.; Martínez, B.; Colorado, G.; De Gra, P.; González, R.; Conde, A.C.; Quintanar, A.; Santana, J.S.; Romero, R.; et al. Actualización de Escenarios de Cambio Climático para México, Como Parte de los Productos de la Quinta Comunicación Nacional; Instituto Nacional de Ecología y Cambio Climático: México city, México, 2013; 151p. Available online: http://atlasclimatico.unam.mx/inecc/Atlas_2_190215_documentacion.pdf (accessed on 29 October 2018).
  13. Vadillo-Romero, E.; Romero-Vadillo, I.G. Ciclones tropicales: Tendencias y potencial de afectación en Baja California Sur. In Baja California Sur Ante el Cambio Climático: Vulnerabilidad, Adaptación y Mitigación; Ivanova-Boncheva, A., Gamez, A.E., Eds.; PEACC-BCS: La Paz, México, 2013; Available online: http://www.uabcs.mx/secciones/descarga/archivo:CAMBIO_CLIMATICO_LIBRO.pdf (accessed on 2 September 2018).
  14. Pappa, A.; Dokou, Z.; Karatzas, P.G. Saltwater intrusion management using SWI2 model: Application in coastal aquifer Hersonissos, Crete, Greece. Desal. Water. Trat. 2017, 99, 49–58. [Google Scholar] [CrossRef]
  15. Wurl, J.; Gámez, A.E.; Ivanova, A.; Imaz-Lamadrid, M.A.; Hernández-Morales, P. Socio-hydrological resilience of an arid aquifer system, subject to changing climate and inadequate agricultural management: A case study from the Valley of Santo Domingo, México. J. Hydrol. 2018, 559, 486–498. [Google Scholar] [CrossRef]
  16. Yangxiao, Z.; Wenpeng, L. A review of regional groundwater flow modeling. Geosci. Front. 2011, 2, 205–214. [Google Scholar] [CrossRef] [Green Version]
  17. Huizar-Álvarez, R.; Hernández-García, G.; Carrillo-Rivera, J.J. Simulation of groundwater flow and the hydrological balance of the Tecocomulco Lagoon, Central México. Open Environ. Sci. 2009, 3, 1–13. [Google Scholar] [CrossRef]
  18. Sidiropoulos, P.; Mylopoulos, N.; Loukas, A. Reservoir-aquifer combined optimization for groundwater restoration: The case of lake Karla watershed, Greece. Water Util. J. 2016, 12, 17–26. [Google Scholar]
  19. Surinaidu, L.; Gurunadha, R.; Srinivasa, V.; Srinu, S. Hydrogeological and groundwater modeling studies to estimate groundwater inflows into the coal mines at different mine development stages using MODFLOW, Andhra Pradesh, India. Water. Resour. Ind. 2014, 7–8, 49–65. [Google Scholar] [CrossRef]
  20. Yicheng, G.; Ganming, L.; Schwartz, F.W. Quantifying the response time of a lake-groundwater interacting system to climatic perturbation. Water 2015, 7, 6598–6615. [Google Scholar] [CrossRef]
  21. Santoyo-Reyes, H. Manejo y Gestión de la Reserva Ecológica Estero San José. UABCS. 2008. Available online: http://intranet.cibnor.mx/investigacion/ramsar/presentaciones/06Jueves/13Academia/1330_Santoyo-SJC_RAMSAR2008.pdf (accessed on 15 September 2018).
  22. Arreguín-Rodríguez, G.; Schwennicke, T. Estratigrafía de la Margen Occidental de la Cuenca San José del Cabo, Baja California Sur; Boletín de la Sociedad Geológica Mexicana: Sociedad Geológica Mexicana: México City, México, 2013; Volume 65, pp. 481–496. Available online: http://boletinsgm.igeolcu.unam.mx/bsgm/vols/epoca04/6503/%284%29Arreguin.pdf (accessed on 15 September 2018).
  23. Martínez–Gutiérrez, G.; Sethi, P.S. Miocene–Pliocene sediments within the San Jose del Cabo Basin, Baja California Sur, Mexico. In Pliocene Carbonates and Related Facies Flanking the Gulf of California, Baja California, Mexico; Johnson, M.E., Ledesma–Vazquez, J., Eds.; Geological Society of America: Boulder, CO, USA, 1997; pp. 141–166. [Google Scholar]
  24. Busch, M.M.; Arrowsmith, R.J.; Umhoefer, P.J.; Coyan, J.A.; Maloney, S.J.; Gutiérrez-Martínez, G. Geometry and evolution of rift-margin, normal-fault-bounded basins from gravity and geology, La Paz-Los Cabos region, Baja California Sur, Mexico. Lithos 2011, 3, 110–127. [Google Scholar] [CrossRef]
  25. Martínez-Gutierrez, G.; Díaz-Gutierrez, J.J.; Cosio-González, O. Morphometric analysis of the San José del Cabo hydrologic basin, B.C.S: An approximation in the identification of potential capture areas. Rev. Mex. Cienc. Geol. 2010, 27, 581–592. [Google Scholar]
  26. Comisión Nacional del Agua (CONAGUA). Actualización de la Disponibilidad Media Anual de agua en el Acuífero San José del Cabo (0319), Estado de Baja California Sur; Comisión Nacional del Agua: México City, México, 2015. Available online: https://www.gob.mx/cms/uploads/attachment/file/102821/DR_0319.pdf (accessed on 15 September 2018).
  27. Comisión Nacional del Agua (CONAGUA). Database of Water Treatment Plants in Mexico [Dataset]; Comisión Nacional del Agua: México City, México, 2013.
  28. Pronatura Noroeste, A.C. (PRONATURA). Plan de Conservación del Estero San José del Cabo, B.C.S. PRONATURA, México. 2010. Available online: http://mexicobirdingtrail.org/wp-content/uploads/2013/06/Plan-de-Conservacion-ESJC_ver.2.pdf (accessed on 15 September 2018).
  29. Church, J.A.; Clark, P.U.; Cazenave, A.; Gregory, J.M.; Jevrejeva, S.; Levermann, A.; Merrifield, M.A.; Milne, G.A.; Nerem, R.S.; Nunn, P.D.; et al. Sea Level Change. In Climate Change: The Physical Science Basis. Contribution of Working Group I to the Fifth Assessment Report of the Intergovernmental Panel on Climate Change; Stocker, T.F., Qin, D., Plattner, G.-K., Tignor, M., Allen, S.K., Boschung, J., Nauels, A., Xia, Y., Bex, V., Midgley, P.M., Eds.; Cambridge University Press: Cambridge, UK; New York, NY, USA, 2013; Available online: https://www.ipcc.ch/pdf/assessment-report/ar5/wg1/WG1AR5_Chapter13_FINAL.pdf (accessed on 29 October 2018).
  30. Kirtman, B.; Power, S.B.; Adedoyin, J.A.; Boer, G.J.; Bojariu, R.; Camilloni, I.; Doblas-Reyes, F.J.; Fiore, A.M.; Kimoto, M.; Meehl, G.A.; et al. Near-term Climate Change: Projections and Predictability. In Climate Change 2013: The Physical Science Basis. Contribution of Working Group I to the Fifth Assessment Report of the Intergovernmental Panel on Climate Change; Stocker, T.F., Qin, D., Plattner, G.-K., Tignor, M., Allen, S.K., Boschung, J., Nauels, A., Xia, Y., Bex, V., Midgley, P.M., Eds.; Cambridge University Press: Cambridge, UK; New York, NY, USA, 2013; pp. 1137–1215. Available online: https://www.ipcc.ch/pdf/assessment-report/ar5/wg1/WG1AR5_Chapter11_FINAL.pdf (accessed on 29 October 2018).
  31. Vermeer, M.; Rahmstorf, S. Global sea level linked to global temperature. PNAS 2009, 106, 21527–21532. [Google Scholar] [CrossRef] [Green Version]
  32. Mundo-Molina, M. Climate Change Effects on Evapotranspiration in Mexico. Am. J. Clim. Chang. 2015, 4, 163–172. [Google Scholar] [CrossRef]
  33. Ojeda Bustamante, W.; Sifuentes-Ibarra, E.; Íñiguez-Covarrubias, M.; Montero-Martínez, M.J. Climate change impact on crop development and water requirements. Agrociencia 2011, 45, 1–11. [Google Scholar]
  34. Melillo, J.M.; Terese, R.; Gary, W.Y. Climate Change Impacts in the United States: The Third National Climate Assessment; U.S. Global Change Research Program: Washington, DC, USA, 2014. [Google Scholar] [CrossRef]
  35. Servicio Meteorológico Nacional (SMN). Rainfall Database of San José del Cabo Weather Station [Dataset]. 2015. Available online: http://smn.cna.gob.mx/tools/RESOURCES/estacion/EstacionesClimatologicas.kmz (accessed on 2 September 2018).
  36. UNISYS. Archival Hurricane Data from 1851 to 2017. 2018. Available online: http://weather.unisys.com/hurricanes (accessed on 1 September 2018).
  37. Winston, R.B. ModelMuse—A Graphical User Interface for MODFLOW-2005 and PHAST. In USGS Techniques and Methods 6–A29; U.S. Geological Survey: Reston, VA, USA, 2009. Available online: https://pubs.usgs.gov/tm/tm6A29 (accessed on 17 July 2018).
  38. Harbaugh, A.W.; Banta, E.R.; Hill, M.C.; McDonald, M.G. MODFLOW-2000, the U.S. Geological Survey Modular Ground-Water Model—User Guide to Modularization Concepts and the Ground-Water Flow Process; USGS Open-File Report 00-92; U.S. Geological Survey: Reston, VA, USA, 2000. [CrossRef]
  39. Shuwei, Q.; Xiujuan, L.; Changlai, X.; He, H.; Zhang, F.; Fengchao, L. Numerical simulation of groundwater flow in a river valley basin in Jillin urban area, China. Water 2015, 7, 5768–5787. [Google Scholar] [CrossRef]
  40. Comisión Nacional del Agua (CONAGUA). Database of Water Levels, Resistivity Data and Extraction Volumes for San José del Cabo Aquifer; [Dataset]; CONAGUA Dirección Local BCS: La Paz, Mexico, 2018.
  41. Servicio Geológico Mexicano (SGM). Geologic Map San José del Cabo F12-2-3-5-6. 2000. Available online: https://mapserver.sgm.gob.mx/Cartas_Online/geologia/24_F12-2-3-5-6_GM.pdf (accessed on 2 September 2018).
  42. Heath, R.C. Basic Groundwater Hydrology; USGS Water Supply Paper 2220; U.S. Geological Survey: Reston, VA, USA, 1983. [CrossRef]
  43. Domenico, P.A.; Miflin, M.D. Water from low-permeability sediments and land subsidence. Water Resour. Res. 1965, 1, 563–576. [Google Scholar] [CrossRef]
  44. Morris, D.A.; Johnson, A.I. Summary of Hydrologic and Physical Properties of Rock and Soil Materials, as Analyzed by the Hydrologic Laboratory of the U.S. Geological Survey. Contributions to the Hydrology of the United States. 1967. Available online: https://pubs.usgs.gov/wsp/1839d/report.pdf (accessed on 2 September 2018).
  45. Prudic, D.E.; Konikow, L.F.; Banta, E.R. A New Stream-Flow Routing (SFR1) Package to Simulate Stream-Aquifer Interaction with MODFLOW-2000: USGS Open-File Report 2004-1042; U.S. Geological Survey: Carson City, NV, USA, 2004. Available online: https://water.usgs.gov/nrp/gwsoftware/modflow2000/ofr2004-1042.pdf (accessed on 2 September 2018).
  46. Bakker, M.; Shaars, F.; Hughes, D.J.; Langevin, C.D.; Dausman, A.M. Documentation of Seawater Intrusion (SWI2) Package for MODFLOW; USGS Modeling Techniques Book 6; U.S. Geological Survey: Reston, VA, USA, 2013; 60p. Available online: https://pubs.usgs.gov/tm/6a46/tm6-a46.pdf (accessed on 28 February 2019).
  47. Hill, C.M. Methods and Guidelines for Effective Model Calibration, USGS Water-Resources Investigations Report 98-4005; US Geological Survey: Reston, VA, USA, 1998. [Google Scholar] [CrossRef]
  48. Wels, C.; Mackie, D.; Scibek, J. Guidelines for Groundwater Modeling to Assess Impacts of Proposed Natural Resource Development Activities; British Columbia Minister of Environment: Victoria, BC, Canada, 2012. Available online: http://www.env.gov.bc.ca/wsd/plan_protect_sustain/groundwater/groundwater_modelling_guidelines_final-2012.pdf (accessed on 1 September 2018).
Figure 1. Location of the study area. The top map shows the sedimentary basin, extraction wells, and the regional modeling area. The bottom map presents the location of the wetland and the sandbar outlet. The results given in Figure 3 refer to section A–A´.
Resources 08 00057 g001
Figure 2. Difference between simulated and observed heads using 100 randomly chosen points for the year 2016.
Resources 08 00057 g002
Figure 3. Evolution of water levels and seawater intrusion wedge according to different climate change scenarios along section A–A’. (Top is CUR40 scenario, in the middle is CON40 scenario and bottom is EXT40 scenario).
Resources 08 00057 g003
Figure 4. Variations of the area with vegetation and the lagoon from 2001 to 2017 and its relation with intense rainfall events. (*) Rainfall value represents the accumulated rain during the impact of T.S. Lidia.
Resources 08 00057 g004
Table 1. Climate change effects for the study area according to different authors.
Author∆R (%)∆ROFF (%)∆ETO (%)∆SL (%)
[30]−10% RCP 4.5 20400 to 10% RCP 4.5 2040n/an/a
[12]−32% RCP 8.5 2040
−27% RCP4.5 2040
n/an/an/a
[13] Increment (not quantified)n/an/a
[11]−57% 2040Increment (not quantified)n/an/a
[33]n/an/a+10% A1B 2100n/a
[32]n/an/a+2 to +7% A1B 2030n/a
[29]n/an/an/a+0.26–1.4 m RCP 2.5–8.5 2100
[31]n/an/an/a+0.75 B1 to 1.9 m A2 2100
n/a = data not available or reported by the author. ∆R = changes in rainfall, ∆ROFF = changes in runoffs, ∆ETO = changes in evapotranspiration, ∆SLR = changes in sea-level.
Table 2. Hydraulic parameters for each layer of the model after calibration.
LayerSimulated AquiferHydraulic Conductivity
(m/d)
Specific Storage
(m−1)
Specific YieldThickness
(m)
1Alluvial deposits5.7 to 47.50.0010.258–68
2Fine grain sandstones0.3 to 4.60.00020.218–70
3Siltstones, shales0.16 × 10−50.128–70
4Weathered granite0.0011.6 × 10−60.0620
5Fresh granite0.00011.6 × 10−60.00120
Table 3. Summary of climate change scenarios used in the regional groundwater model.
ScenarioR
(mm/year)
ROFF
(1 X 10⁶ m3)
ETO
(mm/year)
SLR
(m)
CUR40/CUR17421.582.01573.00
CON40379.390.21604.00.8
EXT40273.998.41692.51.0
Table 4. Water budget for San Jose del Cabo aquifer according to different climate change scenarios. The calculations are presented for the dry–wet season and annually.
ScenarioRCHIRSTRHGFWELLS∑In∑OutBalance
CUR40_DRY0.12.20−4.2−9.42.3−13.6−11.3
CURO40_WET12.74.013.6−4.3−18.230.3−22.57.8
CUR40_ANUAL12.86.213.6−8.5−27.632.6−36.1−3.5
CON40_DRY0.12.10−4.1−9.42.2−13.5−11.3
CON40_WET11.84.113.5−4.2−18.229.4−22.47.0
CON40_ANUAL11.96.213.5−8.3−27.631.6−35.9−4.3
EXT40_DRY0.12.20.0−3.9−9.42.3−13.3−11.0
EXT40_WET8.64.013.6−4.0−18.226.2−22.24.0
EXT40_ANUAL8.76.213.6−7.9−27.628.5−35.0−6.5
Values represent 106 cubic meters. Inflows (green color), Outflows (orange color). Underground and rainfall recharge (RCH), Induced Recharge (IR), Recharge by streams (STR), Horizontal Groundwater Flow (HGF), Pumping (WELLS).
Table 5. Water budget for San Jose Lagoon, according to different climate change scenarios with sandbar outlet opened (O) and sandbar outlet closed (C).
ScenarioAWWDHGIRETOHGOSWO∑In∑OutBalance
CUR17c478.094.6500.8−745.9−249.101097.0−995.0102.0
CUR17o478.094.6500.8−745.9−249.1−199.81097.0−1194.9−97.8
CUR40c478.082.7500.8−745.9−249.101061.5−995.066.5
CUR40o478.082.7500.8−745.9−249.1−199.81061.5−1194.8−133.3
CON40c478.067.0450.7−768.3−216.70995.7−985.010.6
CON40o478.067.0450.7−768.3−216.7−199.8995.7−1184.8−189.1
EXT40c478.035.4340.3−798.1−164.40853.9−962.5−108.6
EXT40o478.035.4340.3−798.1−164.4−199.8853.8−1162.4−308.5
Values represent 104 cubic meters. Inflows (green color), Outflows (orange color). Available Waste Water Discharge (AWWD), Horizontal Groundwater Inflow (HGI), In situ rainfall and runoffs (R), Evapotranspiration (ETO), Horizontal Groundwater Outflow (HGO), surface water outflow (SWO).

