Article

Geochemistry of Flood Waters from the Tar River, North Carolina Associated with Hurricane Matthew

1
Environmental Health Program, East Carolina University, Greenville, NC 27858, USA
2
DrPH Program, East Carolina University, Greenville, NC 27858, USA
3
Craven County Environmental Health, New Bern, NC 28562, USA
4
Mecklenburg County Environmental Health, Charlotte, NC 28208, USA
*
Author to whom correspondence should be addressed.
Resources 2019, 8(1), 48; https://doi.org/10.3390/resources8010048
Submission received: 12 February 2019 / Revised: 2 March 2019 / Accepted: 3 March 2019 / Published: 6 March 2019

Abstract

:
Hurricane Matthew caused flooding in Eastern North Carolina that was categorized as a one in 500-year frequency event. Matthew was the second such event in less than 20 years, following Hurricane Floyd in 1999. The frequency of intense storms is projected to increase for many coastal areas, including North Carolina, because of climate change. The goal of this study was to gain a better insight into the geochemistry of flood waters associated with major flood events. Water samples (n = 22) from the Tar River in Greenville, North Carolina were collected over a two-week period after Matthew moved across the state. Results show that total Kjeldahl nitrogen, dissolved organic carbon, phosphate, and Escherichia coli concentrations and exports were significantly (p < 0.05) higher when the river was above flood stage relative to below. Isotopic analyses of δ15N and δ18O in NO3 in flood waters suggest that wastewater, possibly from sanitary sewer and confined animal feeding operation overflows, was the major source of nitrate associated with flood waters. Regulatory efforts to reduce nutrient loading to coastal waters may be complicated by contributions associated with intense storm events, given that such storms are becoming more frequent.

Graphical Abstract

1. Introduction

Stream concentrations and watershed exports of common water quality contaminants including nitrogen, phosphorus, and Escherichia coli often increase in response to rain events [1,2,3,4]. The increases in stream concentrations and exports can be attributed to various processes, including runoff that transports pollutants collected on urban and agricultural lands to waterways [1,5], mobilization of pollutants attached to sediment in drainageways [6,7], groundwater contributions [8,9], wastewater overflow or bypass of municipal sewer systems [6,10,11,12], and overflow of animal waste lagoons or runoff from pastures [13,14]. While the influence of stormwater runoff on water quality has been extensively documented, less information is available with regards to pollutant concentrations and exports from rivers during extreme weather events such as hurricanes. During such events, the focus is providing shelter and necessities for residents in affected areas, and routine water quality sampling locations may be inaccessible during these events [15]. Some climate models indicate that intense storm and weather conditions may become more common for many coastal regions including the Southeastern U.S. [16]. Over the past two decades, the frequency and intensity of tropical cyclones has increased for the Pacific and Atlantic Basins [16,17], causing extensive flooding.
Hurricane Matthew moved along the North Carolina (NC) coast between 8 and 9 October 2016 and delivered over 30 cm of rainfall to much of the eastern and central regions of the state. Six days later, the Tar River surpassed flood stage by nearly 4 m in the city of Greenville [18]. Matthew was the second 500-year frequency flood event in less than 20 years for eastern NC, following Hurricane Floyd in 1999. The role that major storms play in delivering mass loads of nutrients and other contaminants to estuaries and oceans may also be increasing. However, little information is available regarding the geochemistry of floodwaters following major storms. Many watersheds in the U.S. are already impaired because of complications resulting from excess concentrations of nutrients and/or microorganisms [17,19,20]. More information is needed to determine the nutrient and bacteria loading to coastal waters during intense storm events.
The goal of this study was to gain a better understanding of the geochemistry of floodwaters associated with a major hurricane. The specific objectives were to assess nutrient and E. coli concentrations and exports when a river was above and below flood stage and to compare concentrations of nutrients and bacteria during flood stage to suggested reference conditions [21] and thresholds [22] for the region.

2. Materials and Methods
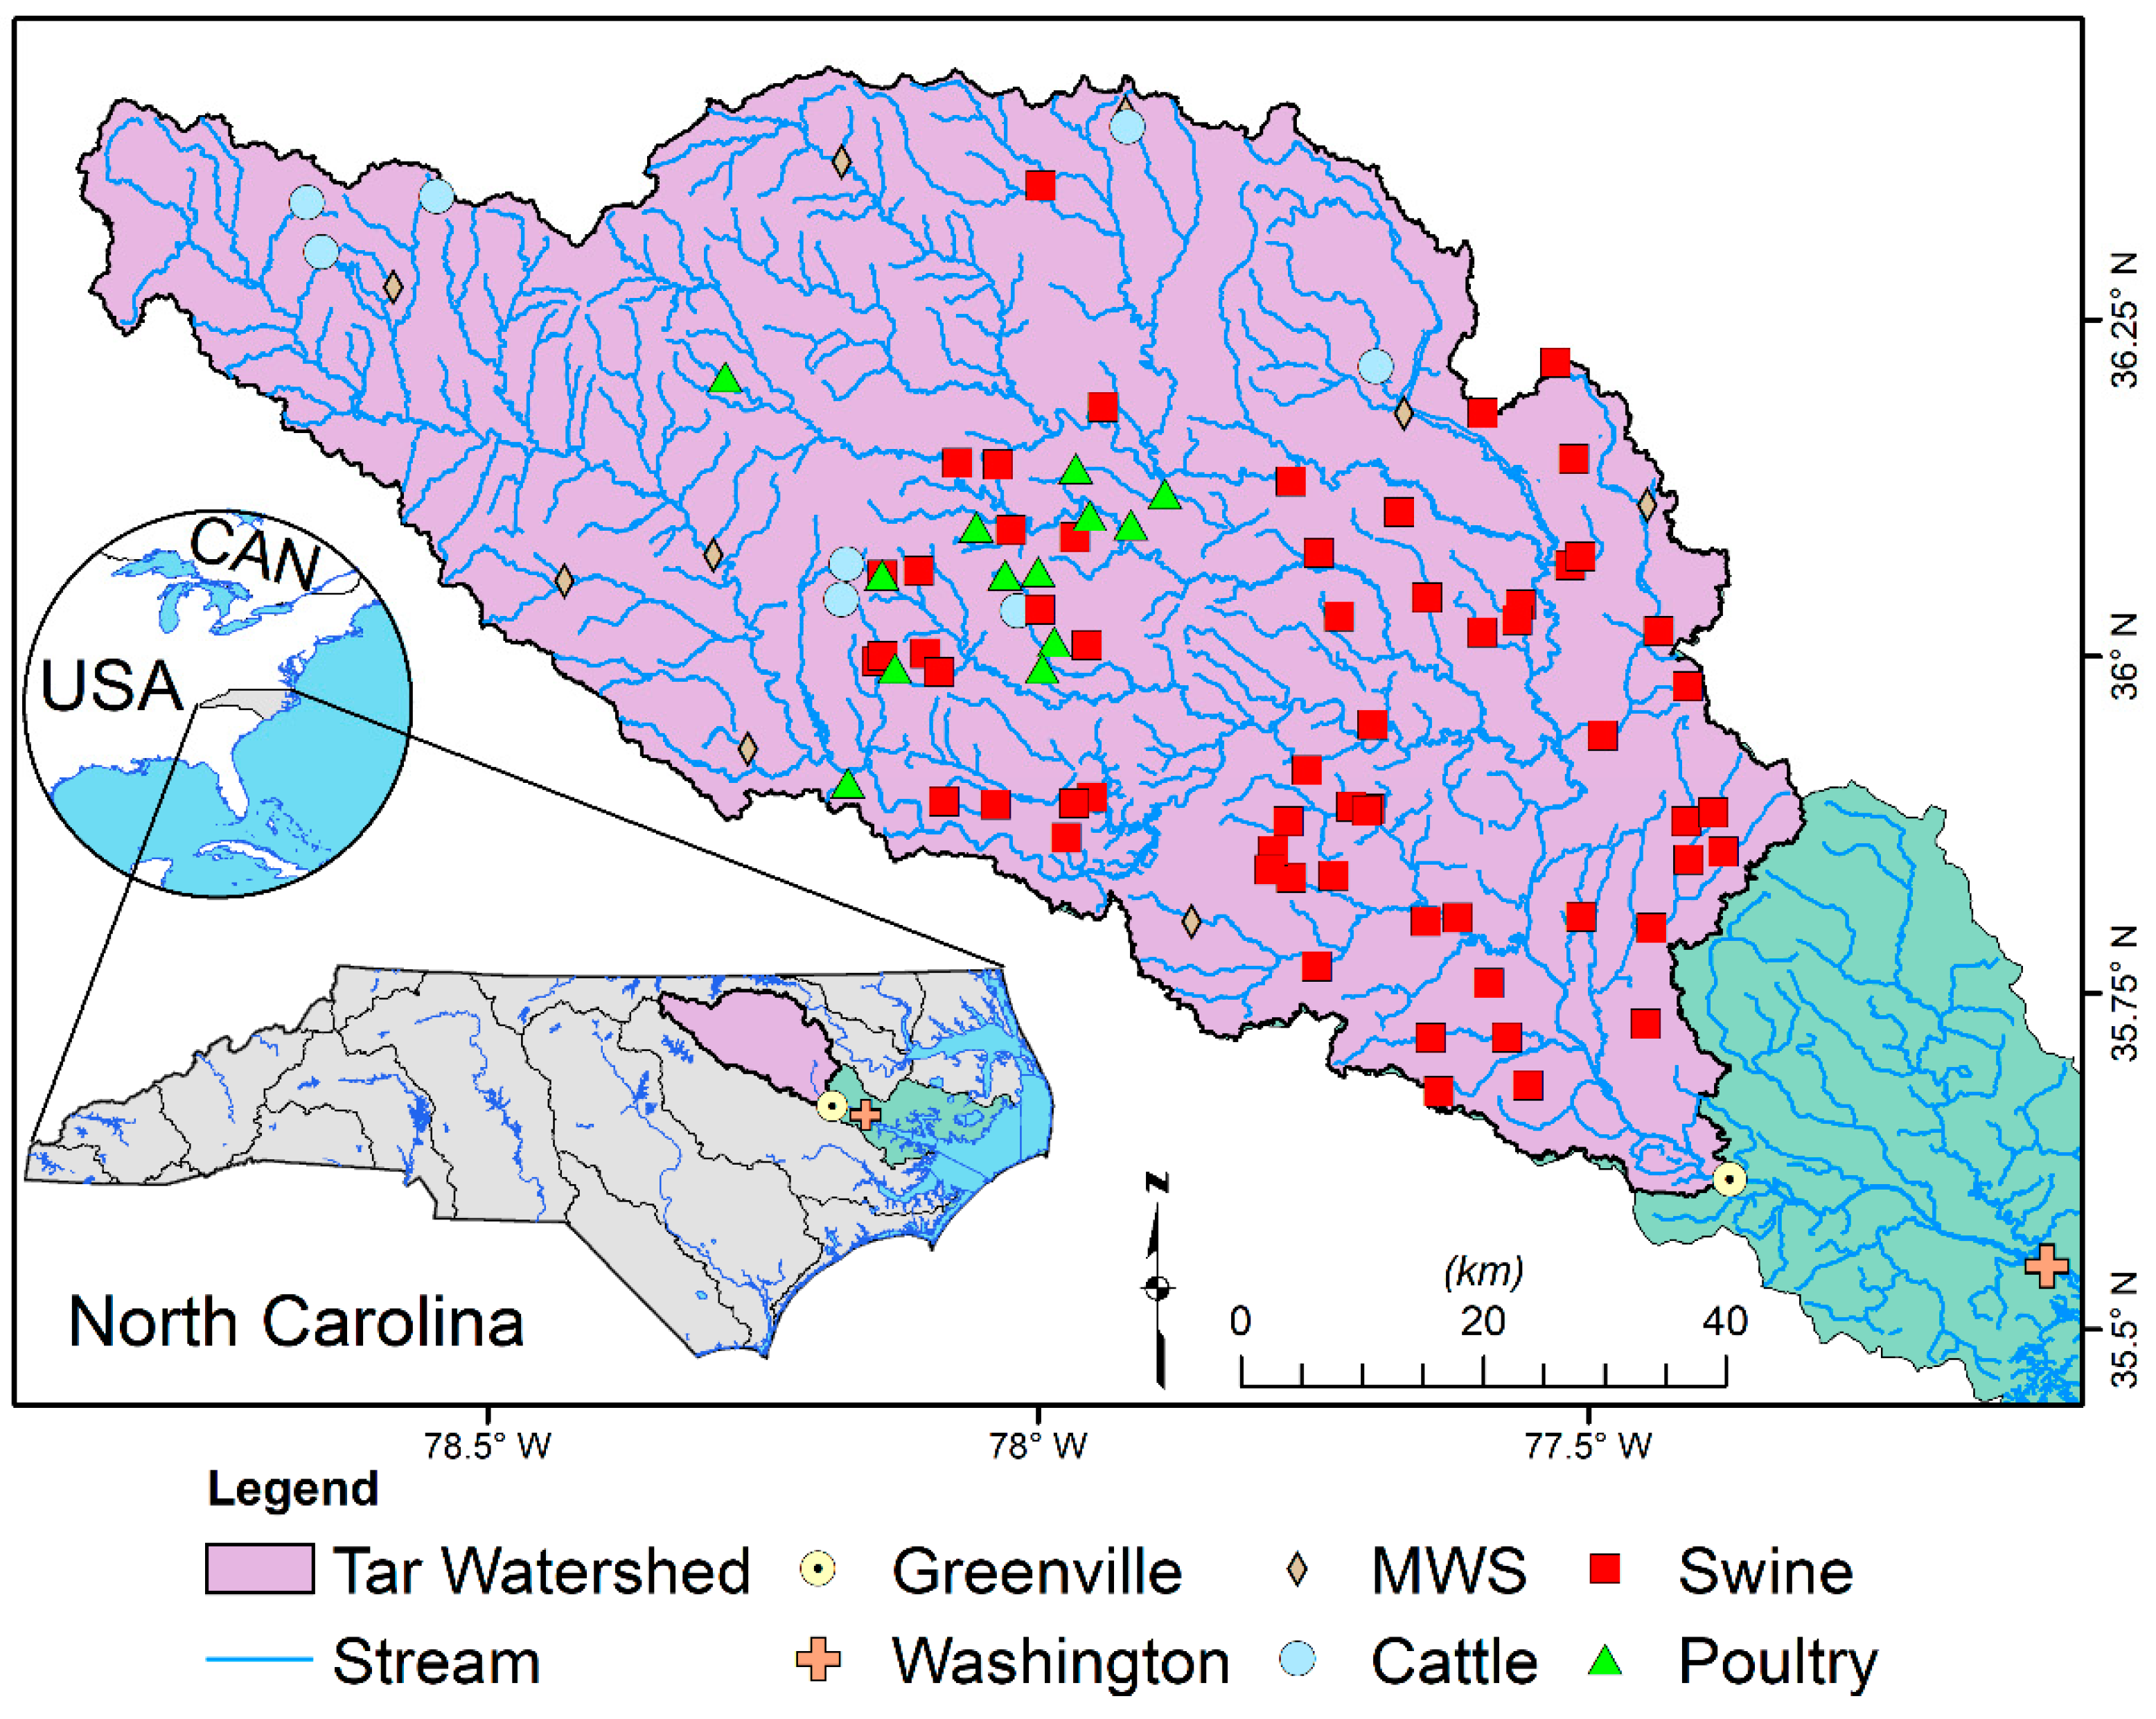
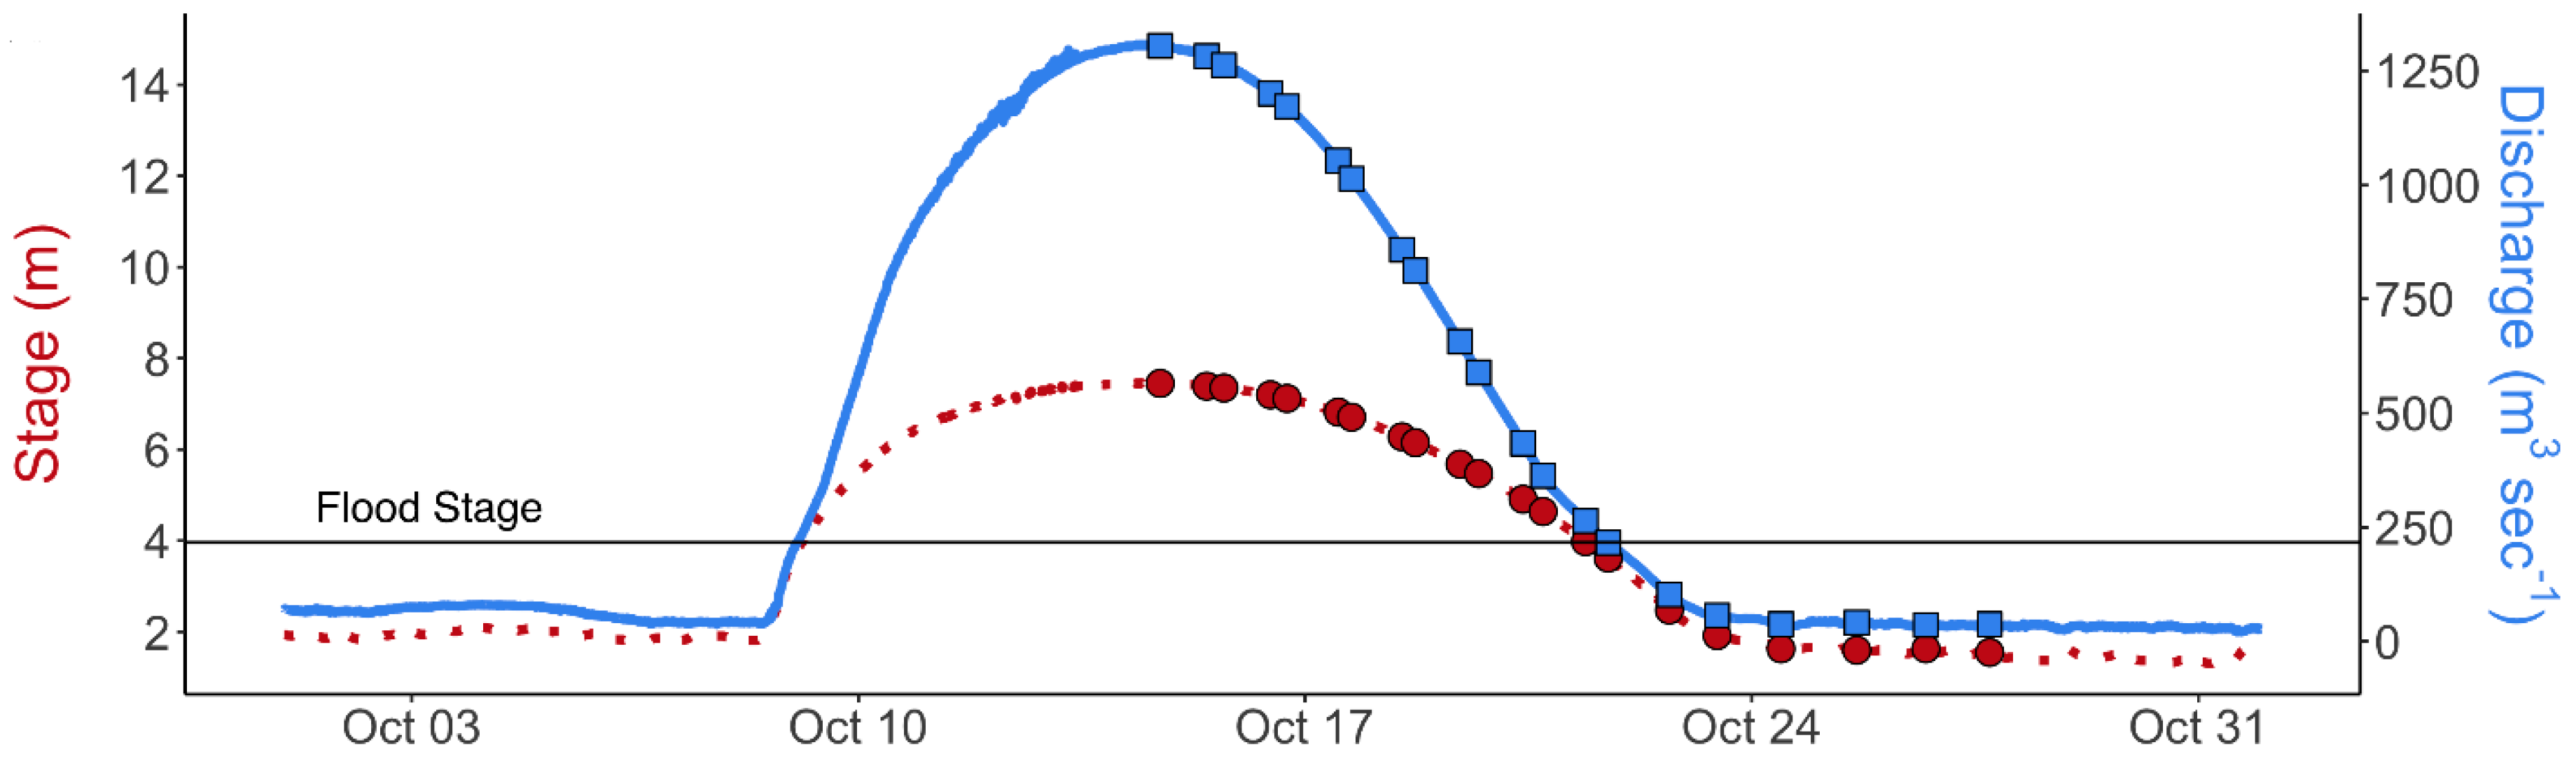
2.1. Study Location

The specific sampling location was in the city of Greenville in the coastal plain of NC and within the lower portion of the Tar River watershed (Figure 1). The Greenville area has mean daily temperatures ranging from 11.2 °C in January to 32.2 °C in July. The mean annual precipitation for Greenville is 126 cm with the highest monthly mean of 15.6 cm in August and the lowest mean of 7.9 cm in November [23]. The mean annual streamflow for the Tar River at Greenville is approximately 70 m3 s−1 [18]. The mean stream discharge is highest during the winter months of January through March (92 m3 s−1 to 114 m3 s−1) and the lowest discharges are typically during the summer months of July through September (32 m3 s−1 to 45 m3 s−1) [18].
The Tar River originates in north central NC and flows southeast for over 340 km before it discharges to the Albemarle Pamlico Sound near Washington, NC (Figure 1). Overall, land use in the Tar River basin is predominantly for agriculture (29%) and forestry (27%), followed by wetlands (23%), grasslands (12%), development (7%), and barren land (2%) [24]. There are 20 major wastewater dischargers within the basin and 77 permitted animal waste operations that manage waste from most of the 445,000 people, 283,000 hogs, and 726,000 poultry in the watershed [24]. Wastewater discharges from humans and animals have been documented as a source of nutrients and fecal bacteria to coastal waters in NC [3,4,6,9,13,25]. The Tar River basin was classified as nutrient sensitive in 1989, and a basin-wide nutrient management strategy was implemented in 2002 to reduce nitrogen loading by 30% and prevent increases in phosphorus loads relative to 1991 baseline conditions [20]. The strategy included goals of reducing nutrient contributions from wastewater treatment plants, agriculture, and urban runoff. Fecal bacteria are a commonly cited pollutant causing water use impairment in coastal regions across the U.S., including NC [19]. Therefore, nutrient and fecal bacteria loading to water resources has been a major environmental concern for decades.

2.2. Sampling Protocol

Water samples (n = 22) from the Tar River in Greenville, NC were collected one to two times daily for two weeks beginning with the crest of flood waters associated with Hurricane Matthew on 14 October 2016 and ending on 27 October 2016 when stream stage was like pre-hurricane conditions (1.8 m). The samples were collected near a United States Geological Survey (USGS) stream monitoring station on the Tar River in Greenville and the date and time of sample collection were noted to match with the river stage (m) and discharge (m3 s−1). Grab samples were collected using 250 mL HDPE bottles for total dissolved nitrogen (TDN), nitrate, ammonium, dissolved organic carbon (DOC), and phosphate (PO4-P) analyses and with sterile 120 mL vessels for E. coli analyses. The bottles were labeled with the date and time of collection and placed in coolers with ice for transport to the East Carolina University Environmental Health Sciences Water Lab (E. coli) and the Environmental Research Lab (nutrients). River stage and discharge from the USGS station were used in conjunction with the nutrient and bacteria concentrations to estimate loadings.

2.3. Nutrient and E. coli Analyses

Samples collected for determination of nutrient concentrations were filtered using a pore size of 0.7 µm prior to analyses. A Shimadzu TNM-L unit using catalytic thermal decomposition/chemiluminescence was used for analyzing TDN and DOC concentrations (Shimadzu Corporation, Kyoto, Japan). Nitrate, ammonium, and phosphate concentrations were analyzed using a SmartChem 200 discrete analyzer (Westco Scientific Instruments Inc., Danbury, CT, USA). Dissolved organic nitrogen (DON) concentrations were determined by subtracting ammonium and nitrate concentrations from TDN. Total Kjeldahl nitrogen (TKN) concentrations were determined by subtracting nitrate from TDN concentrations. Samples were analyzed for E. coli concentrations using IDEXX Colilert media with Quanti Tray 2000 methods. For each sample bottle, Colilert media was added and mixed until homogenized. The mixture was transferred to a Quanti Tray 2000, sealed, and incubated at 35 °C for 24 h. The wells that illuminated under ultraviolet light were counted and the corresponding most probable number (MPN) of E. coli was recorded after referencing the IDEXX chart.

2.4. Physiochemical Characterization of River Water

During sample collection, physiochemical parameters including pH, temperature, dissolved oxygen, and specific conductance were measured using an YSI 556 multiprobe meter (YSI Inc., Yellow Springs, OH, USA). The origin of nitrate in stream samples was determined via stable isotopic analyses of δ15N and δ18O [26,27]. Stream samples were filtered, frozen, and shipped to the Stable Isotope Facility at UC-Davis for laboratory analyses. UC-Davis uses a ThermoFinnigan GasBench plus a PreCon trace gas concentration system interfaced to a ThermoScientific Delta V Plus isotope-ration mass spectrometer [28]. Samples for isotopic analyses were collected on five dates (15, 19, 21, 23, and 26 October 2016). Stable isotopes were used to differentiate probable sources (e.g., human and animal waste, fertilizer, soil organic matter) of nitrate in surface water based on relative values of δ15N to δ18O [26,27].

2.5. Statistical Analyses

Concentrations and exports of nutrients and E. coli and the physiochemical properties of water were compared when the river was above and below flood stage. The data did not follow a normal distribution; thus, Mann–Whitney non-parametric tests were used to determine if the differences in concentrations, exports, and physiochemical properties of water above and below flood stage were statistically significant (p < 0.05). Spearman’s correlations were used to determine if significant correlations were observed between stream discharge and the concentration and exports of nutrients and E. coli. Minitab v17 statistical software was used for the analyses. Concentrations of TDN and phosphate in flood waters were compared to United States Environmental Protection Agency (US EPA) [21] recommended reference conditions for the Ecoregion (IX) that includes Greenville, NC (TDN: 0.48 to 0.87 mg L−1; TP: 0.0068 to 0.0528 mg L−1), and to historical published concentrations [29] of nutrients and fecal bacteria for the Tar River in Greenville, NC. Concentrations of E. coli were compared to thresholds referenced by the US EPA [22] for recreational waters (geometric mean: 100 CFU 100 mL−1; statistical threshold value (STV): 320 CFU 100 mL−1). Frequencies of exceedance were determined for nutrients and E. coli. Data figures were developed using Microsoft Excel and R statistical software using the “ggplot2” and “cowplot” packages.

3. Results and Discussion

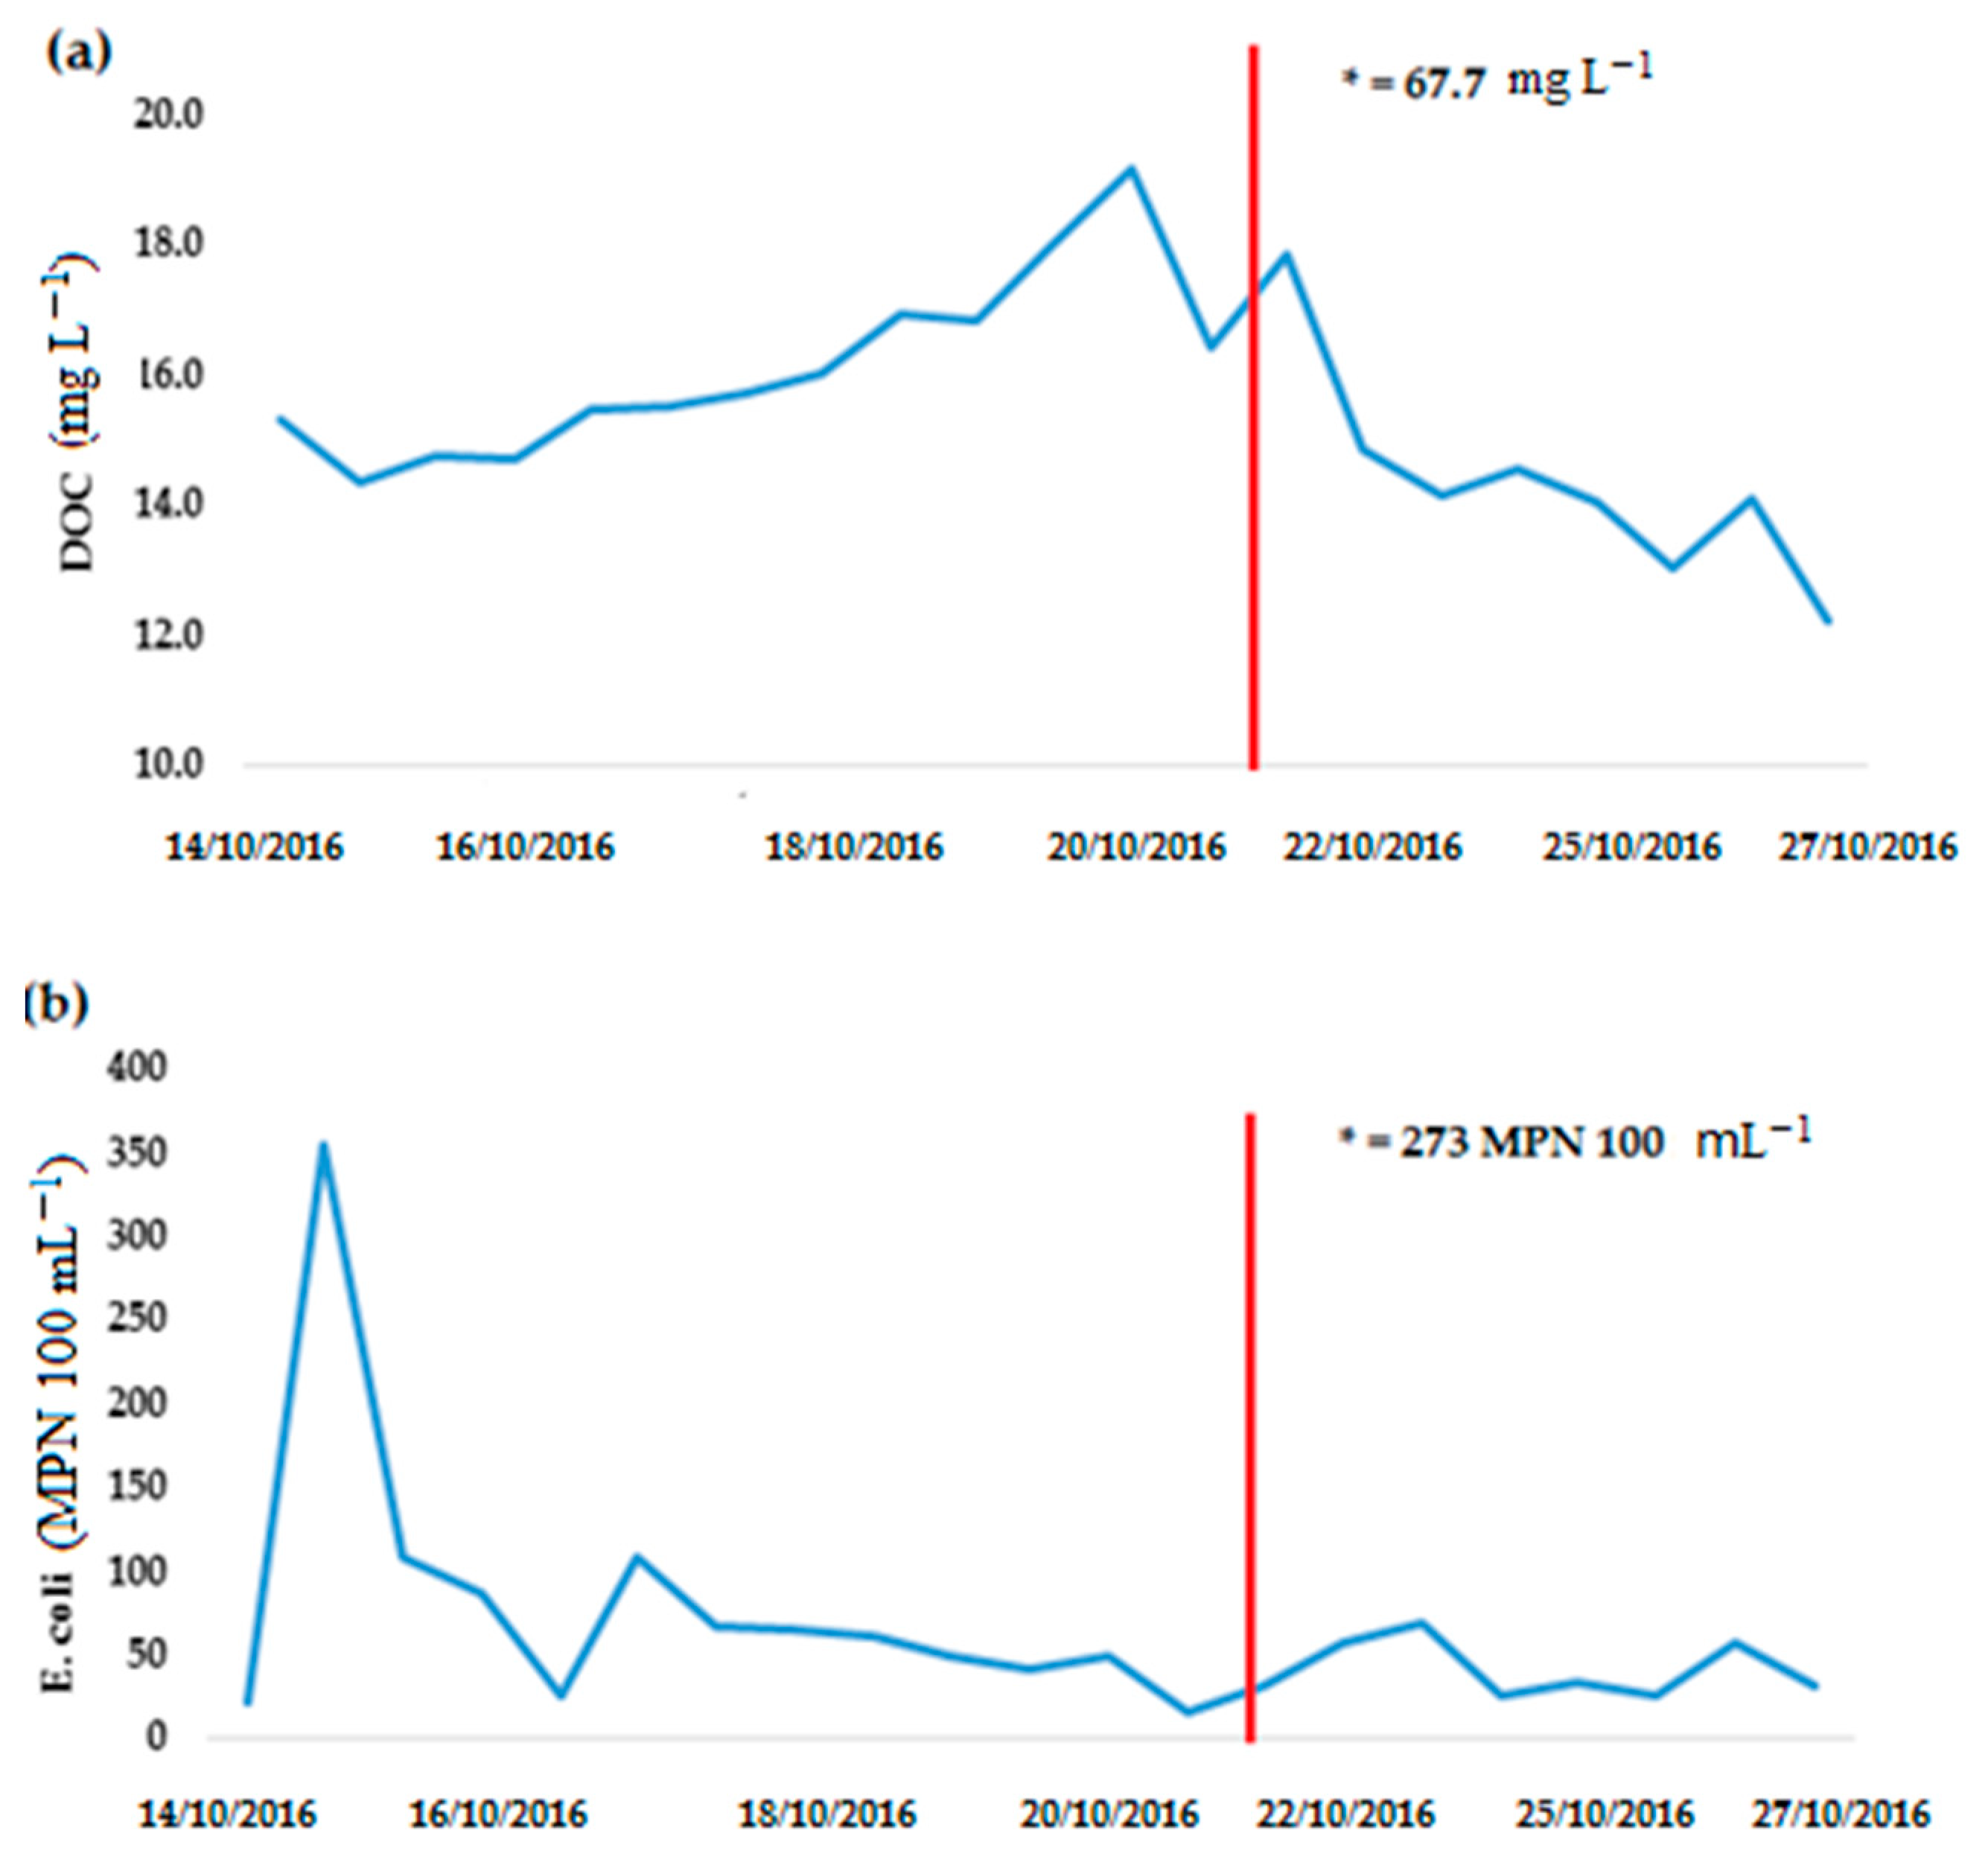
3.1. Nutrient and E. coli Concentrations

Nutrient and E. coli concentrations in water samples collected from the Tar River during the flood stage were variable (TDN: 1.25 to 1.54 mg L−1; TKN: 0.79 to 1.22 mg L−1; PO4-P: 0.015 to 0.112 mg L−1: DOC: 14.3 to 19.2 mg L−1; E. coli: 21 to 354 MPN 100 mL−1), but most concentrations were higher during flood stage relative to below flood stage (Figure 2, Figure 3 and Figure 4, Table 1.). More specifically, the river dropped below flood stage during the afternoon of 21 October 2016, and samples collected after that time had median concentrations of E. coli (45 MPN 100 mL−1), PO4-P (0.002 mg L−1), DON (0.44 mg L−1), TKN (0.87 mg L−1), and DOC (14.1 mg L−1) that were lower in comparison to those in river water sampled during flood conditions (E. coli: 55 MPN 100 mL−1; PO4-P: 0.032 mg L−1; DON:0.95 mg L−1; TKN: 1.16 mg L−1; DOC: 15.9 mg L−1) (Table 1). Statistically significant differences (p < 0.05) were observed when comparing PO4-P, DON, TKN, and DOC concentrations above flood stage (greater) to river water sampled during non-flood stage conditions on the falling limb of the hydrograph. Water samples from the Tar River were not collected immediately before the hurricane, but historic data (2008–2012) with regards to TKN (n = 60) and TP (n = 57) concentrations, and physiochemical parameters (n = 56 to 77) of Tar River water in Greenville were available to provide a baseline for comparison [29]. The median and maximum concentrations of TKN (0.68 mg L−1; 1.78 mg L−1) in the Tar River at Greenville reported by North Carolina Department of Environmental Quality (NC DEQ) were lower relative to the median (1.16 mg L−1) and maximum concentrations (5.14 mg L−1) observed during and shortly after flood conditions associated with Hurricane Matthew. While TP was not analyzed during this study, PO4-P concentrations were determined, and the maximum PO4-P concentration observed (1.57 mg L−1) was more than 2 times greater than the maximum TP concentration (0.61 mg L−1) reported by NC DEQ during their five-year ambient water quality monitoring. These data show that nutrient concentrations in large rivers can greatly increase in response to extreme storm events such as hurricanes, as the discharge increases. Prior research has also shown similar trends with regards to nutrient concentration increases in variable-sized flood events for other rivers [30,31,32].
Concentrations of TDN and PO4-P were elevated relative to suggested reference conditions for the ecoregion by 100% and 13.6%, respectively, on all sampling occasions. The frequency of exceedance of TP standards was slightly higher when waters were above flood stage (14.3 %) in comparison to below flood stage (12.5%). It is likely that exceedances were more frequent for TP relative to PO4-P, but TP was not analyzed during this study. Concentrations of E. coli exceeded the STV of 320 CFU 100 mL-1 on one occasion during flood stage (7%) but never when waters were below flood stage. These data suggest that the concentrations of nutrients and E. coli are more likely to exceed recommended standards during flood conditions in comparison to below flood stage.
The concentrations of E. coli were highest on 15 October (354 MPN 100 mL−1) when the river was near maximum stage (~7.4 m) (Figure 4). As the river stage declined over the next 6 days to 4.2 m, there was a corresponding decrease in the concentration of E. coli (354 to 32 MPN 100 mL−1). A significant correlation was observed between river stage and E. coli concentrations (r = 0.757; p = 0.003) during this six-day period. After the hurricane passed through North Carolina on 9 October 2016, no precipitation was received within the Tar River watershed until the afternoon of 21 October, when a local storm delivered over 1 cm of rain to the Greenville area. There were significant increases in the concentrations of TDN (+3.76 mg L−1), DOC (+49.9 mg L−1), phosphate (+1.56 mg L−1), and E. coli (+241 MPN 100 mL−1) in response to the local storm (Figure 3 and Figure 4). Concentrations of TDN reached 5.3 mg L−1 on 21 October 2016, and most of the TDN was either DON (2.08 mg L−1) or NH4+ (3.06 mg L−1). The sharp increases in concentrations of PO4-P, DOC, reduced forms of nitrogen, and E. coli suggest a wastewater source [6,11,12,33]. The concentrations of nutrients and E. coli dropped the day after the local storm (22 October) to levels like or below those observed prior to the local rain event; thus, researchers likely sampled a localized “first flush” event [34].
Wastewater from nearby large confined animal feeding operations (CAFOs) (Figure 1) and/or from sanitary sewer overflow may have been contributing sources of nutrients and E. coli to the river during the flood and localized storm. The results of the isotopic analyses of nitrate (δ15N and δ18O) in water samples collected on 21 October 2016 showed a signature (δ15N of 8.87 and δ18O of 10.11) suggestive of wastewater as a nitrogen source in the river water [26,27]. Isotopic analyses of river water samples collected on 19, 23, and 26 October also had signatures suggestive of wastewater (δ15N of 8.6 to 9.3 and δ18O of 6.8 to 7.61). Samples collected on 15 October had a signature suggesting soil organic matter as a source (δ15N of 4.25 and δ18O of 8.29). Therefore, on most dates, isotopic analyses suggested that wastewater was a likely source of nitrate in the river water, with some contributions during the peak of flooding dominated by soil organic matter (Figure 5). There are 20 permitted major municipal wastewater dischargers and 77 facilities with animal waste operator permits in the region (Figure 1). Wastewater from these treatment plants and/or animal feeding operations were likely contributors of nutrients to the Tar River during the study period. Wetlands and agricultural lands which comprise 52% of the land area in the basin may also have been sources of soil organic matter and nitrogen during the flood.

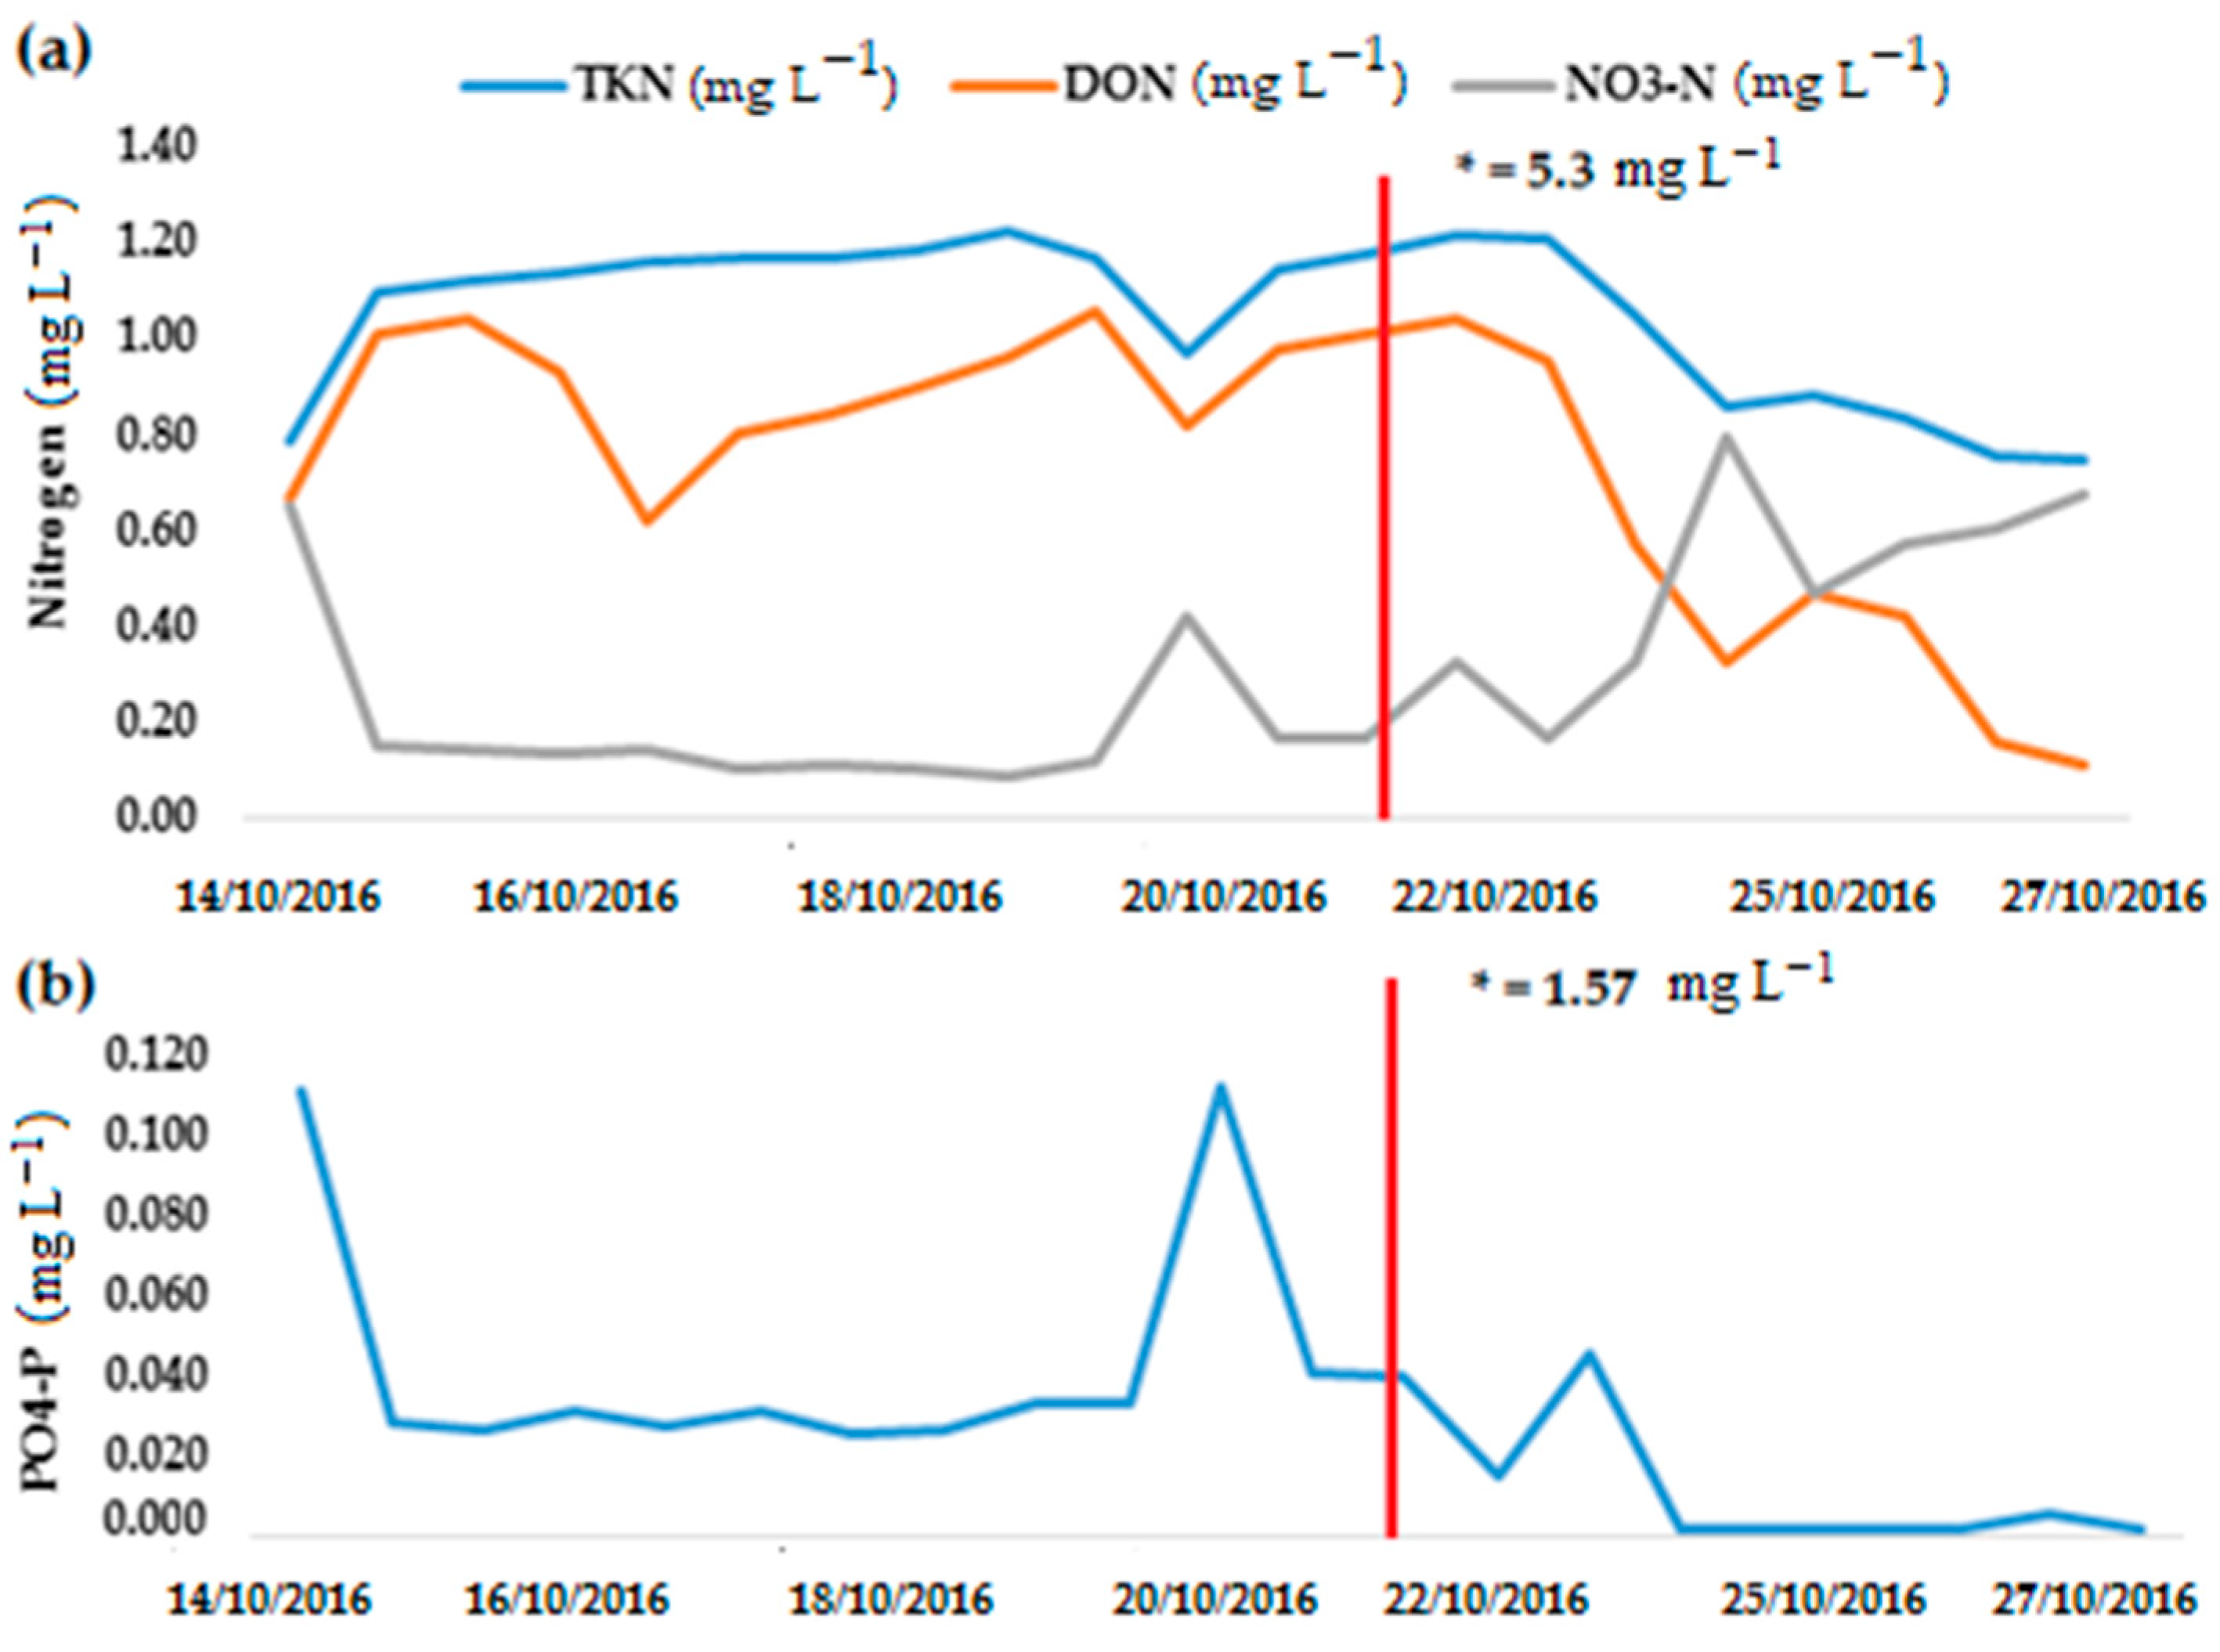
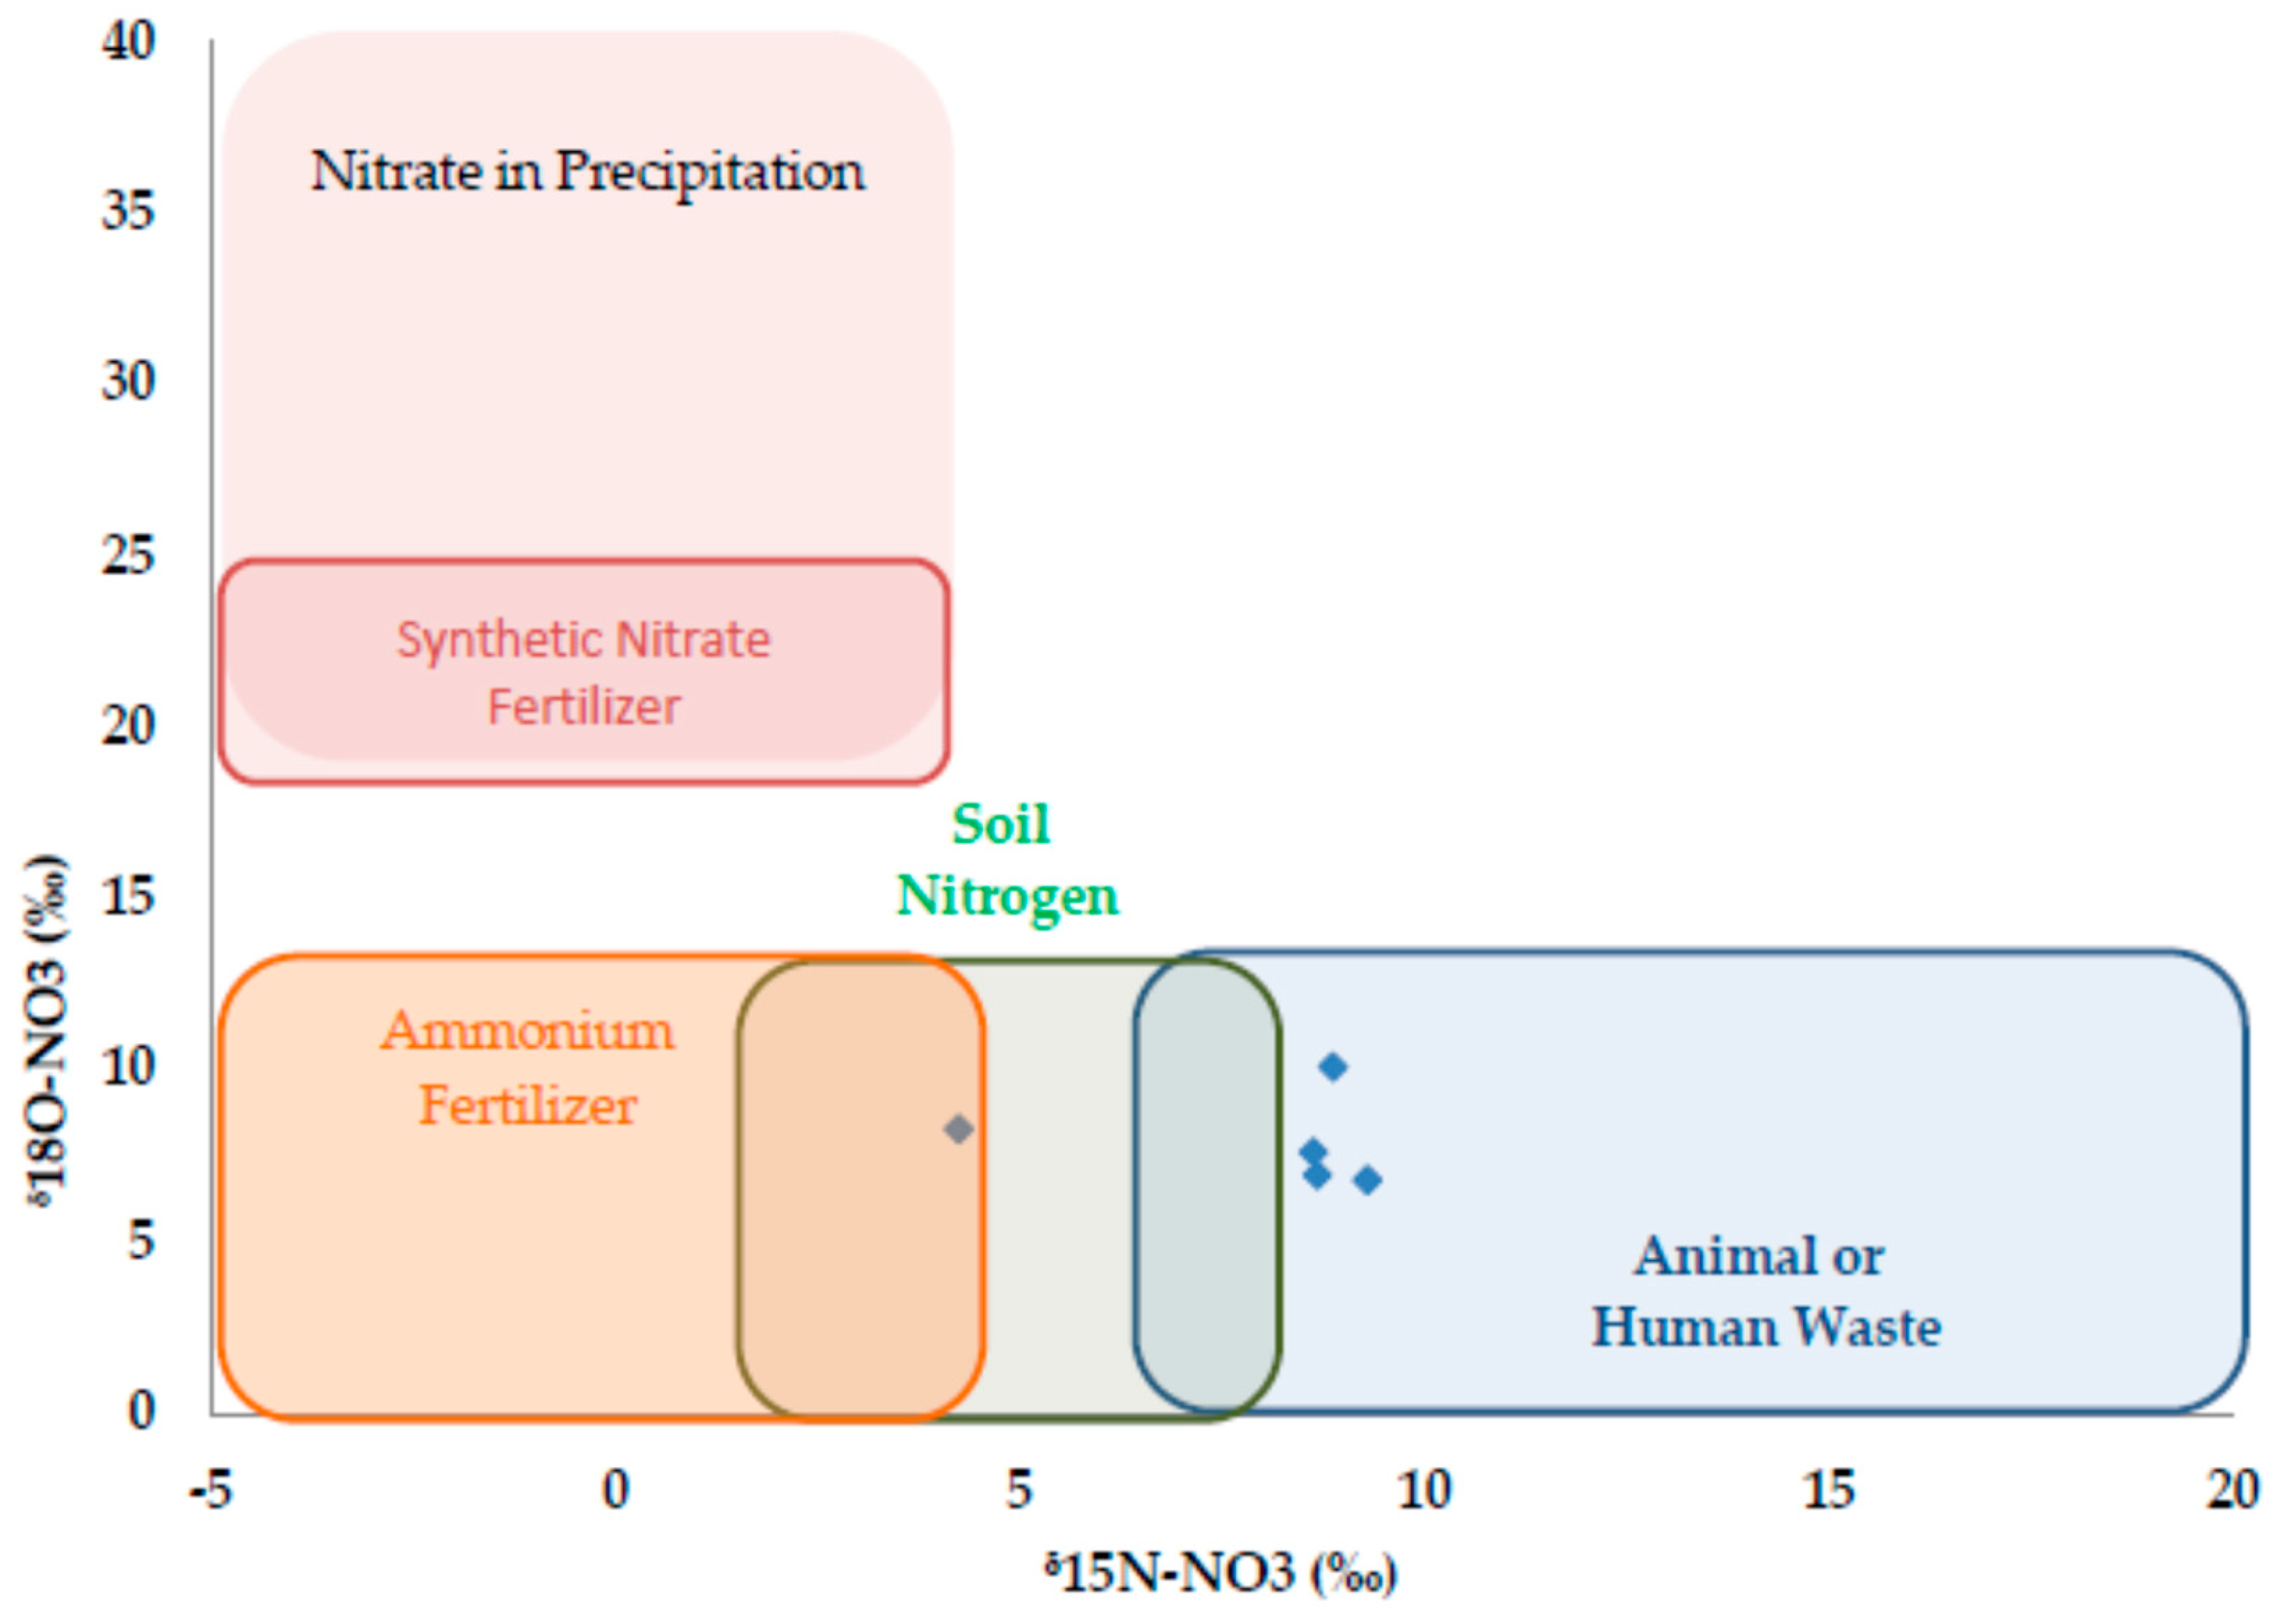
3.2. Nitrogen Dynamics

The median concentrations of TDN were significantly different (p = 0.007) when the river was below (1.39 mg L−1) relative to above (1.29 mg L−1) flood stage (Table 1). DON comprised most (69%) of the TDN during flood conditions, followed by ammonium (16%) and nitrate (15%). Once the river dropped below flood stage, ammonium (33%) and nitrate (36%) were higher relative to DON (31%). The increase in percentage of TDN that was nitrate (15% to 36%) coincided with increases in the median dissolved oxygen concentrations (4.9 mg L−1 to 7.5 mg L−1) and decreases in the median temperature (19.4 to 18.2 °C) when the river dropped below flood stage. Temperature has been shown to be inversely related to dissolved oxygen concentrations and nitrate is often the dominant nitrogen species in aerobic or oxidizing environments [35,36]. Median concentrations of DON (0.95 mg L−1) and TKN (1.16 mg L−1) were significantly higher (p = < 0.05) during flood stage relative to below flood stage (DON: 0.44 mg L−1; TKN: 0.86 mg L−1) (Table 1.). Median concentrations of ammonium (0.18 mg L−1) and nitrate (0.14 mg L−1) during flood stage were significantly lower (p < 0.01) relative to concentrations below flood stage (ammonium: 0.51 mg L−1; nitrate: 0.52 mg L−1). Research by Wallace [37] in Queensland, Australia, and Harris et al. [38] in Victoria, Australia, also showed that DON was often the dominant form of nitrogen during flooding or high-flow events.
There was a statistically significant positive correlation between river discharge and concentrations of DON (r = 0.443; p = 0.039) and TKN (r = 0.827; p = 0.047) and inverse correlations between discharge and concentrations of ammonium (r = −0.613; p = 0.002) and nitrate (r = −0.609; p = 0.003). While nitrate and ammonium are readily bioavailable and thus are most often studied, research has also shown that greater than 20% of DON may be bioavailable during some conditions [39,40]. The bioavailability of DON may be influenced by land use characteristics and seasons. Seitzinger et al. [40] reported that in some New Jersey, USA streams, the mean percentage of DON that was bioavailable for agricultural (30%) and forested watersheds (24%) was lower in comparison to that for urban watersheds (50%). Agricultural and urban watersheds had the highest percentage of DON that was bioavailable during the spring, while forested watersheds peaked during the summer. The percentage of DON that was bioavailable during the fall was 14% for agricultural and 26% for forested watersheds. The Tar River watershed is approximately 27% forestry and 29% agriculture, and flooding from Matthew occurred during the fall. These data suggest that ~20% of the DON in flood waters may be bioavailable.

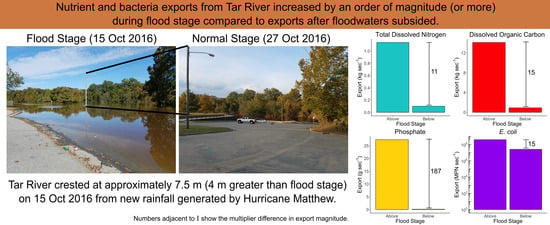
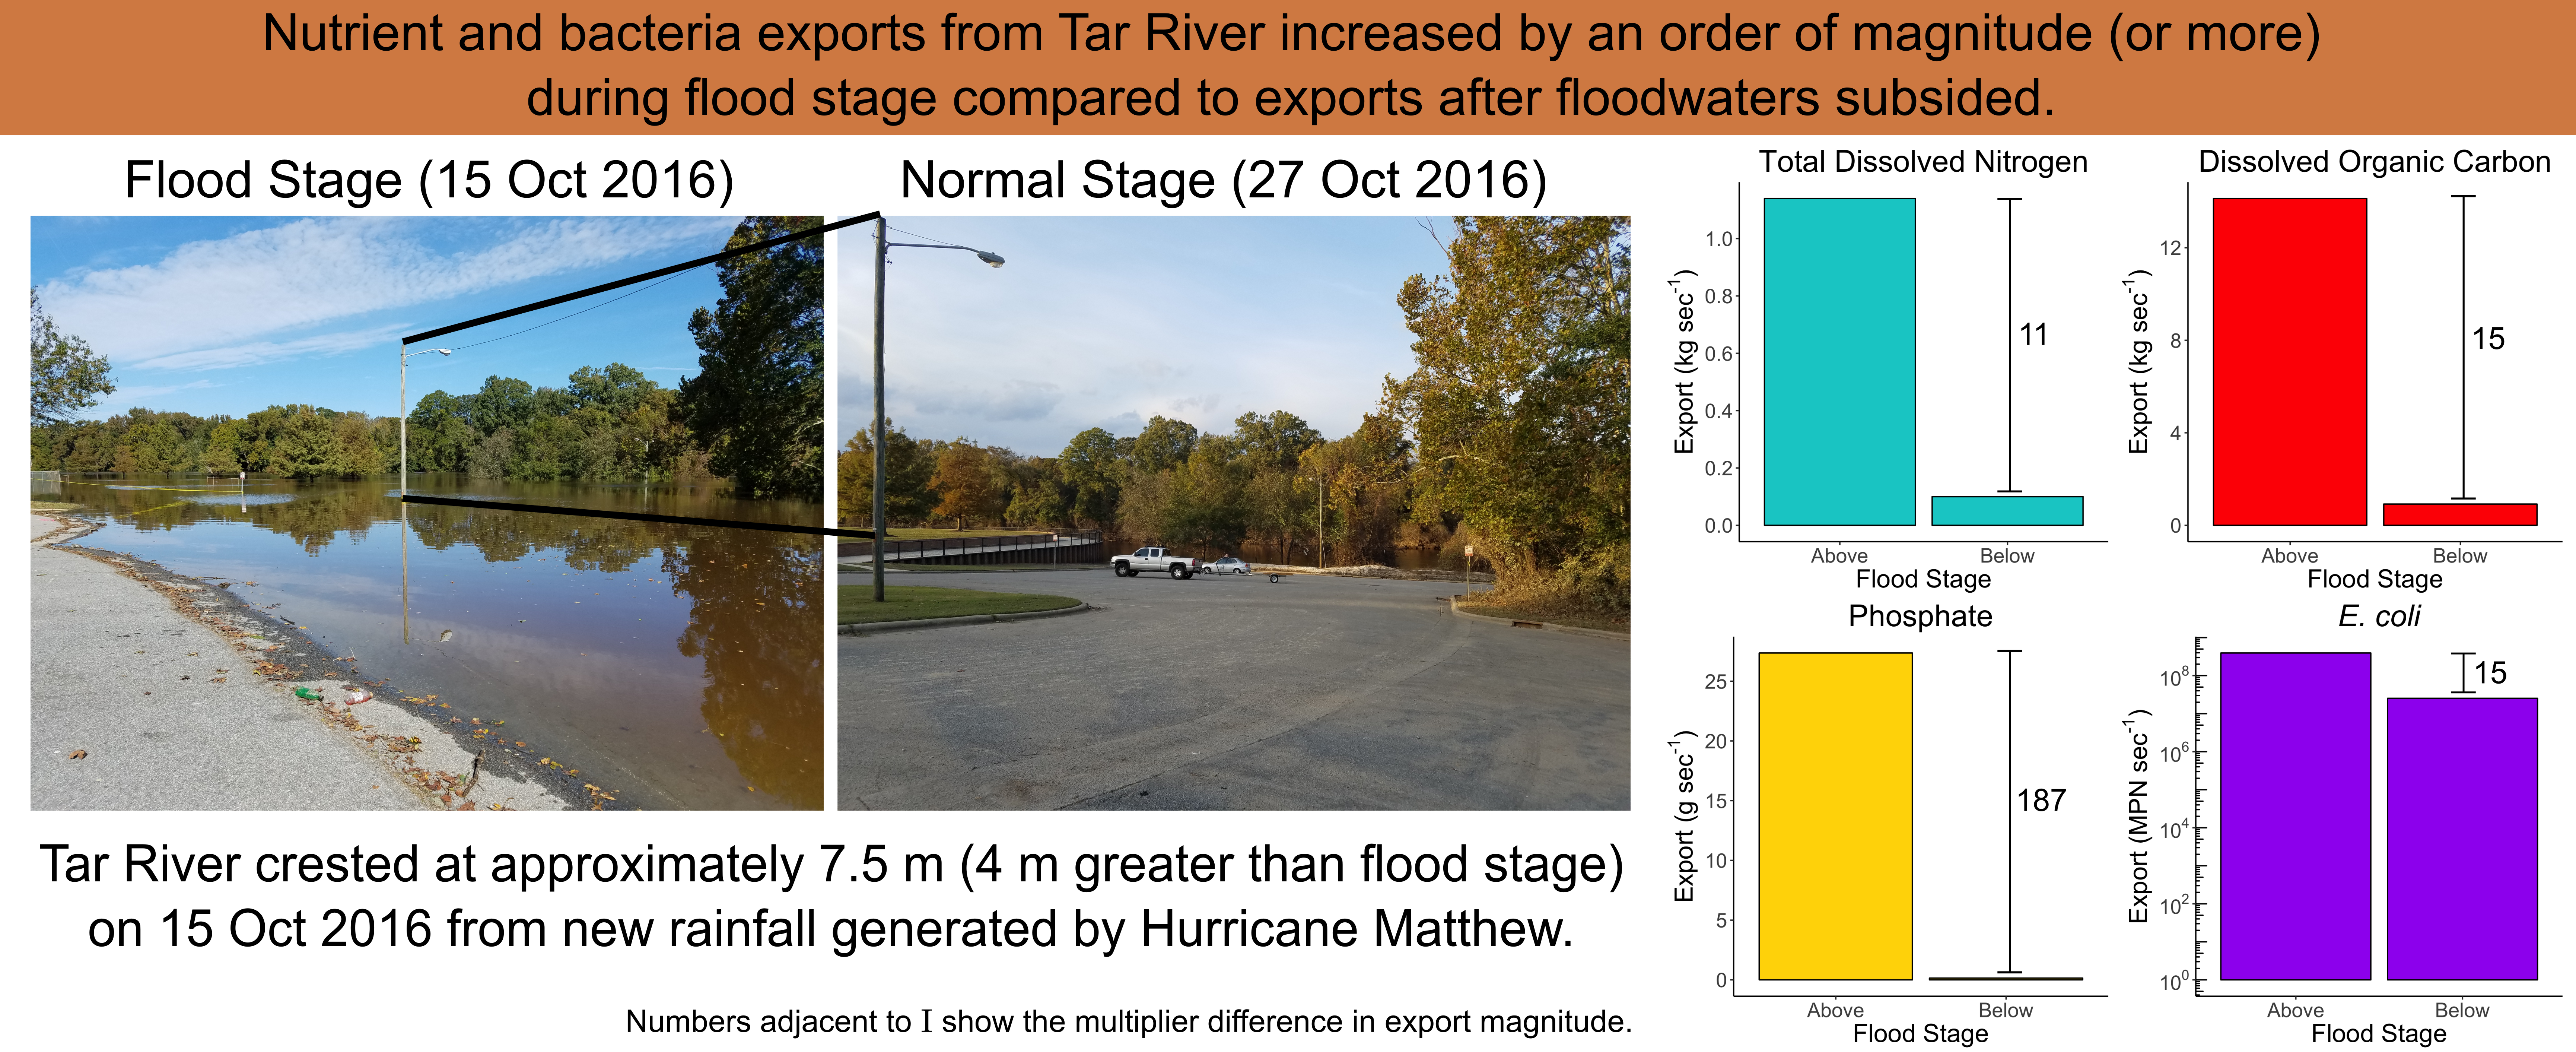
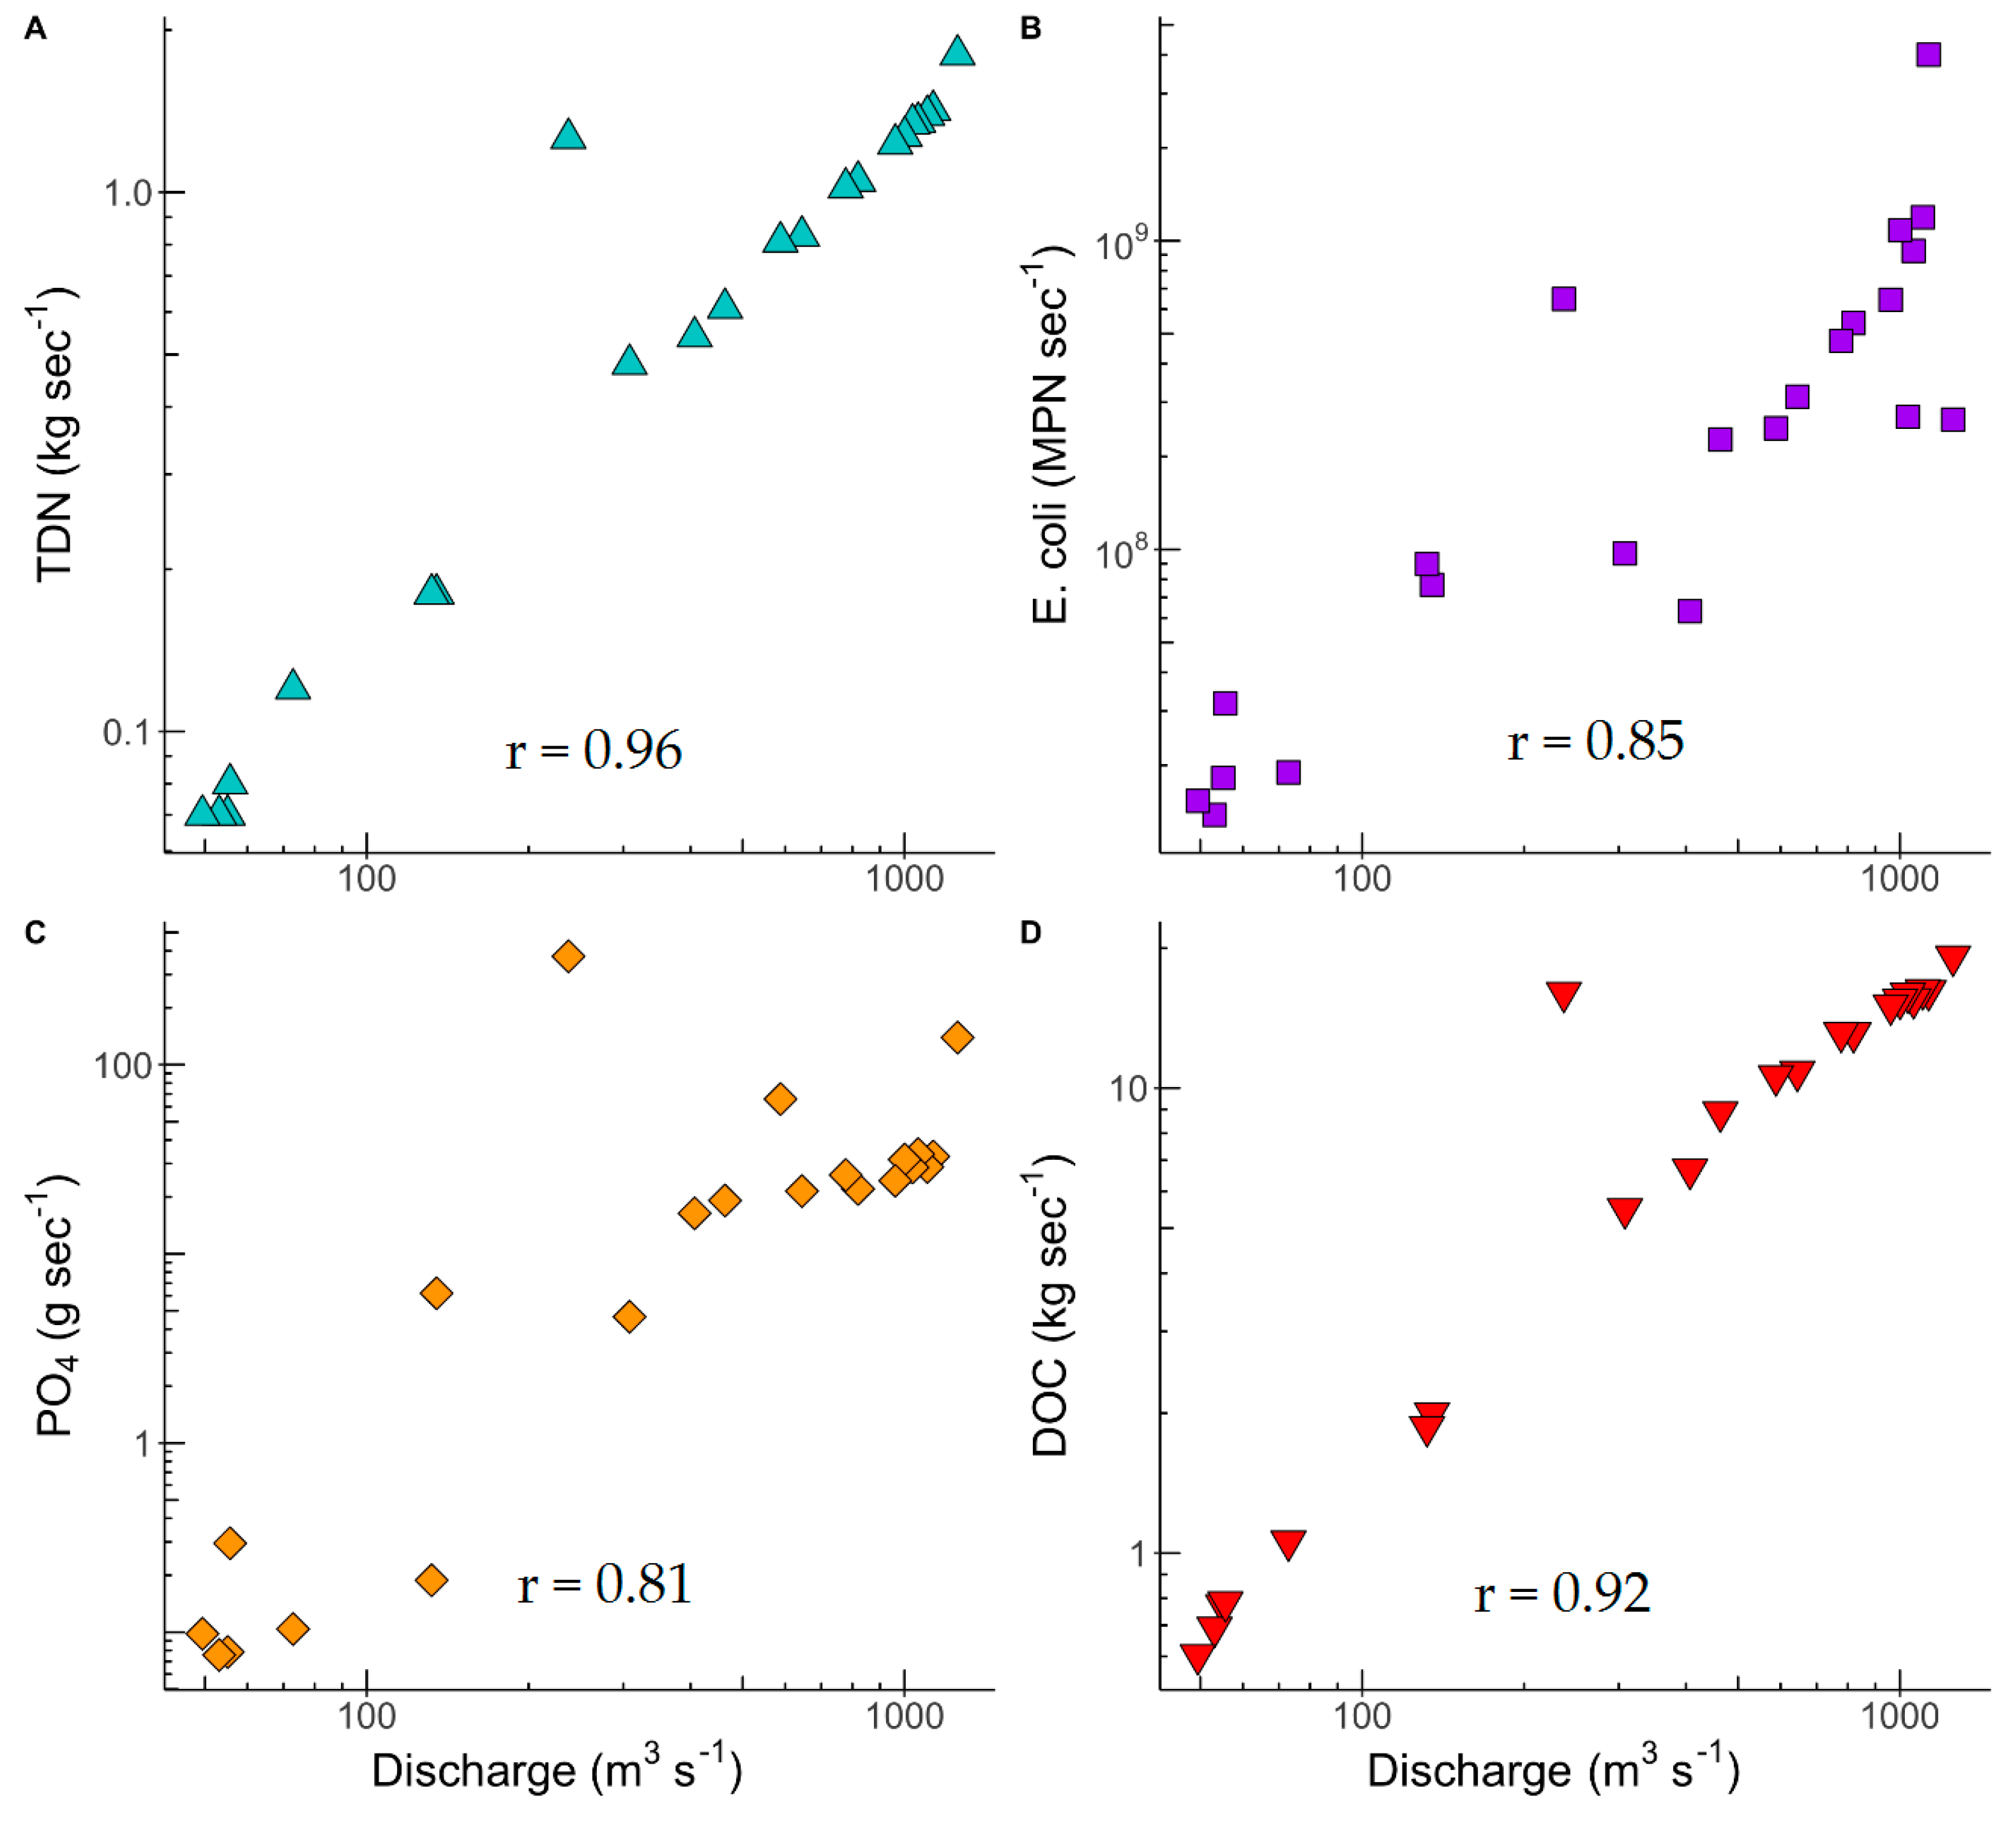
3.3. Nutrient and E. coli Exports

Nutrient and E. coli exports were significantly correlated to river discharge. More specifically, there were statistically significant correlations between river discharge and exports of TDN (r = 0.96; p < 0.01) and all nitrogen species, PO4-P (r = 0.81; p < 0.01), E. coli (r = 0.85; p < 0.01), and DOC (r = 0.91l p < 0.01) (Figure 6). The largest exports of TDN (1.8 kg s−1), DOC (16.3 kg s−1), and E. coli (4 × 10⁹ MPN s−1) occurred during 14 or 15 October, when the stage of the Tar River was greater than 7.3 m and discharge was over 1130 m3 s−1. The lowest exports of TDN (0.07 kg s−1), PO4-P (0.10 g s−1), DOC (0.6 kg s−1), and E. coli (15.3 × 10⁶ MPN s−1) occurred on the final sampling day of 27 October 2016 when the river stage (1.54 m) and discharge (49.5 m3 s−1) were lowest. The median exports of TDN (1.14 kg s−1), PO4-P (27.4 g s−1), DOC (14.1 kg s−1), and E. coli (3.93 × 10⁸ MPN s−1) measured near the crest of the Tar River flooding (7.4 m) were more than an order of magnitude greater than exports measured below the flood stage of 3.9 m (TDN: 0.1 kg s−1; PO4-P: 0.002 g s−1; DOC: 0.9 kg s−1; E. coli: 2.53 × 10⁷ MPN s−1). The median exports of TDN, TKN, PO4-P, DOC, and E. coli were significantly (p < 0.05) larger for the Tar River during flood stage (>3.9 m) relative to below flood stage. These results suggest that hurricanes can cause significant increases in not only stream stage and flow, but also nutrient and microbial concentrations and, thus, also exports. An analysis of flow data analyzed from the USGS gauge station for the Tar River at Greenville [18] shows that the discharge associated with Hurricane Matthew was estimated to be just over 1 billion cubic meters, or approximately 46% of the mean annual discharge (2.2 billion cubic meters). Because river flow and nutrient concentrations increased in response to the hurricane, nutrient loadings to the estuary also increased significantly relative to mean conditions.
The concentrations and exports of TKN (DON + ammonium) have increased in the coastal waters of North Carolina since the early 2000s [41] despite watershed-scale nutrient management regulations for the Tar River and Neuse River. Therefore, reducing loading of TKN is still a priority. The concentration and watershed export of TKN were significantly correlated by discharge (r = 0.96; p < 0.01). The data from this research suggest that large flood events may cause significant increases in E. coli, TKN, DOC, and other nutrient exports. Prior research [42] has shown that the recycling rate of nutrients in estuarine waters of North Carolina is high; thus, once riverine exports of nutrients enter the estuary, their effects may last for years.

4. Conclusions

Extreme weather events in Eastern North Carolina such as hurricanes and associated flooding are becoming more common. Many rivers and coastal waters of the state are nutrient sensitive or impaired because of excess nitrogen, phosphorus, and fecal indicator bacteria concentrations. This research has shown that flood waters associated with a major hurricane contained elevated concentrations of DON, TKN, DOC, PO4-P, and E. coli and exports of these nutrients and bacteria were orders of magnitude greater during flood stage relative to below flood stage and ambient historical conditions. Many efforts have been made to reduce nutrient loading to coastal NC waters including the implementation of more stringent wastewater discharge rules, construction of agricultural best management practices, installation of stormwater control measures for urbanizing areas, and protection of riparian buffers [20]. These measures were designed to reduce nutrient exports during baseflow and small storm (typically <3 cm precipitation) events. The success of these efforts to improve water quality by reducing pollutant loading from rivers to estuarine waters may be undermined by extreme events that occur over a few weeks but export a high percentage of the typical annual loads of nutrients to the estuary. These extreme event-driven loadings may have lasting effects on the estuary and will complicate the already challenging task of managing nutrient loads at the watershed-scale. Since wastewater from CAFOs was a likely source of nutrient exports associated with the hurricane, development and implementation of a buyout program for CAFOs in flood-prone areas may be one additional measure to help reduce pollutant loading. Buyout programs have been used for decades to relocate people living in homes in flood-prone regions to less hazardous areas [43].

Author Contributions

This manuscript was conceptualized by C.H.J., G.I., C.S., C.S., and J.B. and C.H.J., G.I., C.S., C.S., and J.B. contributed to methodology, validation, formal analysis, writing, and visualization.

Funding

This research received no external funding

Acknowledgments

The authors would like to thank Tom Vogel and Kailey Adams for field assistance. Furthermore, the authors acknowledge the efforts of the laboratory staff at the Environmental Research Laboratory for assisting with analysis of nutrient parameters.

Conflicts of Interest

The authors declare no conflict of interest.

References

  1. Hathaway, J.M.; Hunt, W.F.; Simmons III, O.D. Statistical evaluation of factors affecting indicator bacteria in urban storm-water runoff. J. Environ. Eng. 2010, 136, 1360–1368. [Google Scholar] [CrossRef]
  2. Janke, B.D.; Finlay, J.C.; Hobbie, S.E.; Baker, L.A.; Sterner, R.W.; Nidzgorski, D.; Wilson, B.N. Contrasting influences of stormflow and baseflow pathways on nitrogen and phosphorus export from an urban watershed. Biogeochemistry 2014, 121, 209–228. [Google Scholar] [CrossRef]
  3. Humphrey, C.; Anderson-Evans, E.; O’Driscoll, M.; Manda, A.; Iverson, G. Comparison of Phosphorus Concentrations in Coastal Plain Watersheds Served by Onsite Wastewater Treatment Systems and a Municipal Sewer Treatment System. Water Air Soil Pollut. 2015, 226, 1–18. [Google Scholar] [CrossRef]
  4. Iverson, G.; Humphrey, C.; Postma, M.H.; O’Driscoll, M.A.; Manda, A.K.; Finley, A. Influence of sewered versus septic systems on watershed exports of E. coli. Water Air Soil Pollut. 2017, 228, 237. [Google Scholar] [CrossRef]
  5. Osmond, D.L.; Neas, K.; Johnson, A.M.; Cahill, S.L. Fertilizer use in regulated river Basins: Is it what we think? J. Contemp. Water Res. Educ. 2013, 151, 20–26. [Google Scholar] [CrossRef]
  6. Mallin, M.A.; Cahoon, L.B.; Toothman, B.R.; Parsons, D.C.; McIver, M.R.; Ortwine, M.L.; Harrington, R.N. Impacts of a raw sewage spill on water and sediment quality in an urbanized estuary. Mar. Pollut. Bull. 2007, 54, 81–88. [Google Scholar] [CrossRef] [PubMed]
  7. Pachepsky, Y.A.; Shelton, D.R. Escherichia coli and Fecal Coliforms in Freshwater and Estuarine Sediments. Crit. Rev. Environ. Sci. Technol. 2011, 41, 1067–1110. [Google Scholar] [CrossRef]
  8. O’Driscoll, M.A.; Humphrey, C.P., Jr.; Deal, N.E.; Lindbo, D.L.; Zarate-Bermudez, M.A. Meteorological influences on nitrogen dynamics of a coastal onsite wastewater treatment system. J. Environ. Qual. 2014, 43, 1873–1885. [Google Scholar] [CrossRef] [PubMed]
  9. Humphrey, C.P.; Finley, A.J.; O’Driscoll, M.A.; Manda, A.; Iverson, G. Groundwater and stream E. coli concentrations in coastal plain watersheds served by onsite wastewater and a municipal sewer treatment system. Water Sci. Technol. 2015, 72, 1851–1860. [Google Scholar] [CrossRef] [PubMed]
  10. Cahoon, L.B.; Hales, J.C.; Carey, E.S.; Loucaides, S.; Rowland, K.R.; Toothman, B.R. Multiple modes of water quality impairment by fecal contamination in a rapidly developing coastal area: Southwest Brunswick County, North Carolina. Environ. Monit. Assess. 2016, 188, 89. [Google Scholar] [CrossRef] [PubMed]
  11. Iverson, G.; Humphrey, C.P., Jr.; O’Driscoll, M.A.; Sanderford, C.; Jernigan, J.; Serozi, B. Nutrient exports from watersheds with varying septic system densities in the North Carolina Piedmont. J. Environ. Manag. 2018, 211, 206–217. [Google Scholar] [CrossRef] [PubMed]
  12. Humphrey, C.; Sanderford, C.; Iverson, G. Concentrations and Exports of Fecal Indicator Bacteria in Watersheds with Varying Densities of Onsite Wastewater Systems. Water Air Soil Pollut. 2018, 229, 277. [Google Scholar] [CrossRef]
  13. Liwimbi, L.; Graves, A.K.; Israel, D.W.; van Heugten, E.; Robinson, B.; Cahoon, C.W.; Lubbers, J.F. Microbial source tracking in a watershed dominated by swine. Water 2010, 2, 587–604. [Google Scholar] [CrossRef]
  14. Jokinen, C.C.; Edge, T.A.; Koning, W.; Laing, C.R.; Lapen, D.R.; Miller, J. Spatial and temporal drivers of zoonotic pathogen contamination of an agricultural watershed. J. Environ. Qual. 2012, 41, 242–252. [Google Scholar] [CrossRef] [PubMed]
  15. Ratnapradipa, D.; Cardinal, C.; Ratnapradipa, K.L.; Scarbrough, A.; Xie, Y. Implications of Hurricane Harvey on public health in Harris County, Texas. J. Environ. Health 2018, 81, 24–32. [Google Scholar]
  16. Intergovernmental Panel on Climate Change (IPCC). Climate Change 2014: Synthesis Report. Contribution of Working Groups I, II and III to the Fifth Assessment Report of the Intergovernmental Panel on Climate Change; Core Writing Team, Pachauri, R.K., Meyer, L.A., Eds.; IPCC: Geneva, Switzerland, 2014. [Google Scholar]
  17. Paerl, H.W.; Crosswell, J.R.; Van Dam, B.; Hall, N.S.; Rossignol, K.L.; Osburn, C.L.; Hounshell, A.G.; Sloup, R.S.; Harding, L.W., Jr. Two decades of tropical cyclone impacts on North Carolina’s estuarine carbon, nutrient and phytoplankton dynamics: Implications for biogeochemical cycling and water quality in a stormier world. Biogeochemistry 2018, 141, 307–332. [Google Scholar] [CrossRef]
  18. United States Geological Survey. National Water Information System: Web Interface. USGS 02084000 Tar River at Greenville, NC. 2019. Available online: https://waterdata.usgs.gov/nc/nwis/uv?site_no=02084000 (accessed on 10 January 2019).
  19. United States Environmental Protection Agency. National Summary of State Information. USEPA, 2017. Available online: https://ofmpub.epa.gov/waters10/attains_nation_cy.control (accessed on 15 December 2017).
  20. North Carolina Department of Environmental Quality. Nutrient Sensitive Waters and Special Watersheds. 2018. Available online: https://deq.nc.gov/about/divisions/energy-mineral-land-resources/nsw-special-watersheds (accessed on 8 December 2018).
  21. United States Environmental Protection Agency. Ambient Water Quality Criteria Recommendations. Information Supporting the Development of State and Tribal Nutrient Criteria for Rivers and Streams in Nutrient Ecoregion IX; Report EPA-822-B-00-022; Environmental Protection Agency, Office of Water, Science and Technology, Health and Ecological Criteria Division: Washington, DC, USA, 2000.
  22. United States Environmental Protection Agency. Recreational Water Quality Criteria; EPA-820-F-12-061; Office of Water: Washington, DC, USA, 2012.
  23. United States Climate Data. Climate Greenville, NC. Available online: https://www.usclimatedata.com/climate/greenville/north-carolina/united-states/usnc0281/2018/1 (accessed on 8 December 2018).
  24. North Carolina Division of Water Resources. Tar-Pamlico River Basin Water Resources Plan. 2014. Available online: https://www.ncwater.org/basins/Tar-Pamlico/index.php (accessed on 5 December 2018).
  25. Harden, S.L. Surface-Water Quality in Agricultural Watersheds of the North Carolina Coastal Plain Associated with Concentrated Animal Feeding Operations; U.S. Geological Survey Scientific Investigations Report 2015-5080; U.S. Geological Survey Scientific: Reston, VA, USA, 2015; 55p, 7 apps. [CrossRef]
  26. Kendall, C.; McDonnell, J.J. Isotope Tracers in Catchment Hydrology, 1st ed.; Elsevier Science B.V.: Amsterdam, The Netherlands, 1998. [Google Scholar]
  27. Silva, S.R.; Ging, P.B.; Lee, R.W.; Ebbert, J.C.; Tesoriero, A.J.; Inkpen, E.L. Forensic applications of nitrogen and oxygen isotopes of nitrate in an urban environment. Environ. Forensics 2002, 3, 125–130. [Google Scholar] [CrossRef]
  28. University of California, Davis. Nitrate (NO3) Analysis by Bacteria Denitrification. Stable Isotope Facility, University of California at Davis. Available online: http://stableisotopefacility.ucdavis.edu/no3.html (accessed on 10 December 2018).
  29. North Carolina Department of Environmental Quality. Tar-Pamlico River Basin. Ambient Data Summary Sheets. 2019. Available online: https://deq.nc.gov/map-page/tar-pamlico-river-basin (accessed on 9 February 2019).
  30. Paerl, H.W.; Bales, J.D.; Ausley, L.W.; Buzzel, C.P.; Crowder, L.B.; Eby, L.A.; Fear, J.M.; Go, M.; Peierls, B.L.; Richardson, T.L.; et al. Ecosystem impacts of three sequential hurricanes (Dennis, Floyd, and Irene) on the United States’ Largest lagoonal estuary, Pamlico Sound, NC. Proc. Natl. Acad. Sci. USA 2001, 98, 5655–5660. [Google Scholar] [CrossRef] [PubMed]
  31. Paerl, H.W.; Valdes, L.M.; Joyner, A.R.; Peierls, B.L.; Piehler, M.F.; Riggs, S.R.; Christian, R.R.; Eby, L.A.; Crowder, L.B.; Ramus, J.S.; et al. Ecological response to hurricane events in the Pamlico Sound system, North Carolina, and implications for assessment and management in a regime of increased frequency. Estuar. Coasts 2006, 29, 1033–1045. [Google Scholar] [CrossRef]
  32. Dhillon, G.S.; Inamadar, S. Extreme storms and changes in particulate and dissolved organic carbon in runoff: Entering uncharted waters? Geophys. Rese. Lett. 2013, 40, 1322–1327. [Google Scholar] [CrossRef] [Green Version]
  33. Del Rosario, K.L.; Humphrey, C.P.; Mitra, S.; O’Driscoll, M. Nitrogen and carbon dynamics beneath on-site wastewater treatment systems in Pitt County, North Carolina. Water Sci. Technol. 2014, 69, 663–671. [Google Scholar] [CrossRef] [PubMed]
  34. Hathaway, J.M.; Tucker, R.S.; Spooner, J.M.; Hunt, W.F. A traditional analysis of the first flush effect for nutrients in stormwater runoff from two small urban catchments. Water Air Soil Pollut. 2012, 223, 5903–5915. [Google Scholar] [CrossRef]
  35. Mitsch, W.J.; Gosselink, J.G. Wetlands, 3rd ed.; John Wiley & Sons, Inc.: New York, NY, USA, 2000; 172p. [Google Scholar]
  36. Humphrey, C.; Iverson, G.; O’Driscoll, M. Nitrogen Treatment Efficiency of a Large Onsite Wastewater System in Relation to Water Table Dynamics. Clean-Soil Air Water 2017, 45, 1700551. [Google Scholar] [CrossRef]
  37. Wallace, J.; Stewart, L.; Hwwdon, A.; Keen, R.; Karim, F.; Kemei, J. Flood water quality and marine sediment and nutrient loads from the Tully and Murray catchments in north Queensland, Australia. Mar. Freshw. Res. 2009, 60, 1123–1131. [Google Scholar] [CrossRef] [Green Version]
  38. Harris, C.W.; Rees, G.N.; Stoffels, R.J.; Pengelly, J.; Barlow, K.; Silvester, E. Longitudinal trends in concentration and composition of dissolved organic nitrogen (DON) in a largely unregulated river system. Biogoechemistry 2018, 139, 139–153. [Google Scholar] [CrossRef]
  39. Wiegner, T.N.; Seitzinger, P. Photochemical and microbial degradation of external dissolved organic matter in- puts to rivers. Aquat. Microb. Ecol. 2001, 24, 27–40. [Google Scholar] [CrossRef]
  40. Seitzinger, S.P.; Sanders, R.W.; Styles, R. Bioavailability of DON from Natural and Anthropogenic Sources to Estuarine Plankton. Limnol. Oceanogr. 2002, 47, 353–366. [Google Scholar] [CrossRef]
  41. Lebo, M.E.; Paerl, H.W.; Peierls, B.L. Evaluation of progress in achieving the TMDL mandated nitrogen reductions in the Neuse River Basin, North Carolina. Environ. Manag. 2012, 49, 253–266. [Google Scholar] [CrossRef] [PubMed]
  42. Christian, R.C.; Thomas, C.R. Network analysis of nitrogen inputs and cycling in the Neuse River Estuary, North Carolina, USA. Estuaries 2003, 26, 815–828. [Google Scholar] [CrossRef]
  43. Siders, A.R. Social justice implications of US managed retreat buyout programs. Clim. Chang. 2019, 152, 239–257. [Google Scholar] [CrossRef]
Figure 1. Tar River basin in Eastern North Carolina, USA.
Resources 08 00048 g001
Figure 2. Tar River stage and discharge before, during, and after Hurricane Matthew made landfall in North Carolina on 8 October 2016.
Resources 08 00048 g002
Figure 3. Concentrations of (a) nitrogen including total Kjeldhal nitrogen (TKN), dissolved organic nitrogen (DON), and nitrate (NO3-N) and (b) phosphate phosphorus (PO4-P) in the Tar River following Hurricane Matthew. The river dropped below flood stage on 21 October 2016 (red line). A local storm caused a temporary increase (*) in nitrogen and PO4-P concentrations.
Resources 08 00048 g003
Figure 4. Concentrations of (a) dissolved organic carbon (DOC) and (b) Escherichia coli in the Tar River following Hurricane Matthew. The river dropped below flood stage on 21 October 2016 (red line). A local storm caused a temporary spike (*) in DOC and E. coli concentrations.
Resources 08 00048 g004
Figure 5. Isotopic analyses of water samples collected during Hurricane Matthew showed a signatuate indicative of animal or human waste or soil nitrogen. Boundaries denote likely sources of nitrate indicated in prior work [27,28].
Resources 08 00048 g005
Figure 6. Correlations between Tar River discharge and watershed exports of (a) total dissolved nitrogen, (b) E. coli, (c) PO4-P, and (d) dissolved organic carbon.
Resources 08 00048 g006
Table 1. Median and range (in parentheses) of the physiochemical parameters of river water above flood stage (FS) and below FS. Parameters include temperature (Temp.), specific conductance (SC), dissolved oxygen (DO), pH, E. coli, total Kheldhal nitrogen (TKN), dissolved organic nitrogen (DON), ammonium (NH4-N), nitrate (NO3-N), total dissolved nitrogen (TDN), and phosphate (PO4-P).
Sampling PeriodTemp
(°C)
SC
(µS cm−1)
DO
(mg L−1)
pHE. coli
(MPN 100 mL−1)
TKN
(mg L−1)
Above FS19.4
(18.4–20.6)
41.0
(36.0–83.0)
4.9
(3.3–6.7)
6.7
(6.1–8.0)
55
(16–354)
1.16
(0.79–1.22)
Below FS18.2
(17.0–20.6)
90.0
(57.0–105.0)
7.5
(6.5–8.2)
6.7
(6.4–7.3)
45
(26–273)
0.86
(0.75–5.14)
Sampling PeriodDON
(mg L−1)
NH4-N
(mg L−1)
NO3-N
(mg L−1)
TDN
(mg L−1)
DOC
(mg L−1)
PO4-P
(mg L−1)
Above FS0.95
(0.62–1.06)
0.18
(0.08–0.54)
0.14
(0.08–0.65)
1.29
(1.25–1.54)
15.87
(14.32–17.84)
0.032
(0.026–0.111)
Below FS0.44
(0.11–2.08)
0.51
(0.25–3.06)
0.52
(0.16–0.79)
1.39
(1.35–5.30)
14.13
(12.21–67.67)
0.002
(0.001–1.577)

