1. Introduction
The threat to marine environment, due to waste disposal from ships, is substantial [
1,
2]. In recent decades, a strong adverse human influence on the environment has been noted, especially in the coastal zones with wide seasonal population variations (tourism activities) and extensive commercial enterprises [
3,
4]. Cruise tourism is a dynamic sector which has continued to show a high growing rate, both in the global tourism market and, also, in Croatia. In the past few years, the Adriatic Sea, as part of the Mediterranean Sea, has attracted far more cruise ships than a decade ago, and the cruising boom, although possibly being a gold vein for the economic development and revenue, may also be a possible environmental threat with long-term consequences. Due to the purity of the Adriatic Sea and the beauty of the landscape, in the absence of appropriate waste management on land, pollution caused by waste could have a negative effect on Croatia’s attraction.
The aim of this study is to estimate the waste (plastic, domestic, and food) which is produced by cruise ships in the three main cruise ports in the Croatian part of the Adriatic Sea, i.e., the ports of Dubrovnik, Zadar, and Split. Moreover, one of the aims of this paper is to raise awareness of the waste issue, which can arise from the increased cruise traffic in the Croatian part of the Adriatic Sea in the past several years.
In order to adequately organize waste management, it is necessary to predict the quantities that can be produced onboard ships. Furthermore, these estimations can serve as a basis for future port reception facilities’ planning [
5]. Although, onboard cruise ships, different categories of waste are generated, the focus of the paper is solely on plastic, domestic, and food waste, considering that, in the Republic of Croatia, the management of this type of waste is still inappropriate.
The fact should be stressed that the Republic of Croatia also has great seasonal fluctuations in the number of tourists, and the quantities of waste produced onshore, which cannot be properly managed. Most of the waste from cruisers is actually domestic waste, and it poses a huge pressure on the infrastructure of the coastal cities. The problem in Croatia is still how to sustainably manage even the domestic waste produced by households and, based on that fact, we find it important to point out the possible waste type and quantities that can be produced by cruisers. The Republic of Croatia, after becoming a member of the European Union in 2013, assumed some obligations for drafting and complying the waste issue regulations with the EU regulation. It was only in 2017 that Croatia adopted a Waste Management Plan (WMP) 2017–2023 and Waste Prevention Programme (WPP), together with the Regulation on Municipal Waste Management [
6]. However, the implementation of the documents mentioned is inadequate, which means that the practice of landfilling the waste is still the main option [
6].
The paper analyses the background of cruise ship-generated waste, and the regulatory framework for waste prevention in the Croatian part of the Adriatic Sea. Using the newest data from European Maritime Safety Agency—EMSA, the calculation of plastic, domestic, and food waste generated from cruise ships in the three main ports of Dubrovnik, Split, and Zadar was done. Also, the paper gives further recommendations for better management of waste originating from cruise ships.
2. Background of Cruise Ship Generated Waste in the Adriatic Sea
The waste generated on cruise ships may be sorted into different categories, and the categorization varies but, generally, oily bilge water, oily sludge, oily tank washings, sewage, plastics, food waste, domestic waste, cooking oil, incinerator ashes, operational waste, cargo residues, ozone-depleting substances, and others are distinguished [
7]. Also, it should be noted that the classification of waste is sometimes not clear, and there is a mismatch between the classification of waste in The International Convention for the Prevention of Pollution from Ships MARPOL Annex V, the classification used onboard ships, and the classification used by waste operators. For example, onboard ships, paper, glass, and fluorescent tubes are often collected separately, while their classification in MARPOL Annex V is as “domestic waste” [
7]. Domestic waste is all the waste from the domestic spaces onboard ships which is not food waste, cooking oil, or plastic, but which is, e.g., paper, cardboard, fluorescent lamps, synthetic material, foils, metal cans, lids, glass, pantry packaging waste, etc. [
7]. Also, each cruise ship has onboard treatment facilities, and the treatment of each of the mentioned waste types differs. The EMSA Report [
7] summarizes that, for example, plastics are usually not incinerated, and dirty plastics (plastics that have been in contact with food) are often treated as a separate waste stream. For domestic waste, the treatment differs depending on the type and amount of the waste generated. The treatments include glass crusher, compactors for cans and tins, and incineration of paper and cardboard. The International Maritime Organization IMO defines food waste as any spoiled or unspoiled food substances and includes fruits, vegetables, dairy products, poultry, meat products, and food scraps generated onboard ship. Finally, regarding onboard treatment of food waste, in the areas where it is permitted under MARPOL Annex V, food waste is often discharged into the sea.
However, all types of waste produced onboard ships should be separated and, if possible, processed before they are discharged to port reception facilities and managed according to the national legislation [
8,
9,
10,
11]. Increased maritime transport in all the EU ports presents new challenges to the port logistics in order to efficiently manage waste [
2]. According to the Directive 2000/59/EC, port reception facilities should be able to receive all the waste types produced onboard ships [
2,
11]. Under this Directive, there is no special requirements regarding the environmental fees, methods of waste delivering, and notifications [
2]. Yet, Port Authority should enable the usage of port reception facilities in such a manner that a ship has no delay in the schedule [
12].
According to the most recent data, in 2016, Cruise Lines International Association (CLIA) estimated 24.2 million passengers at a global level, while the number is expected to grow in 2017 to 25.3 million, and in 2018 to 27.2 million passengers [
13]. As the cruise industry is growing fast, and the vessels are increasing in size, the awareness of a consequent increase in the waste generated onboard should also increase. Although cruise ships participate with only 1% in the world shipping fleet, they produce 25% of all the waste generated on ships [
14]. The management of the waste produced due to the daily activities onboard cruise ships is far more complicated than the management of waste produced on land. As the categorization of the onboard-produced waste differs, generally speaking, pollutants and waste from the cruise ships also include air emissions, ballast water, wastewater, hazardous waste, and solid waste [
15]. The Cruise Ship Discharge Assessment Report from 2008 [
16] specifies that the solid waste, which is generated onboard cruise ships, includes food waste, plastics, glass, paper, wood, cardboard, incinerator ash, and metal cans. There are different estimations of the amount of waste produced onboard, but the quantity varies in accordance with the size of the ship, number of passengers and crew onboard, as well as the consumption. It is estimated that an average cruise ship of 3000 passengers and crew generates about 50 tons of solid waste in one week [
15]. Furthermore, the United States Environmental Protection Agency states, in the 2008 Report, that the waste generated per cruise guest varies from 2.6–3.5 kg/person/day [
16].
If the focus is on the Mediterranean region, particularly the area of the Adriatic Sea, the statistics show positive results for all forms of maritime tourism, especially in the part of the cruising industry, with over 5 million passenger movements in 2016. As the focus is on the Croatian part of the Adriatic Sea, it is important to emphasize that the most recent analysis for 2015–2016 has rated the Croatian ports of Dubrovnik, Split, and Zadar in the top 10 of the 20 main cruising ports in the Adriatic Sea (
Figure 1.) While Venice has been rated first regarding passenger movements, Dubrovnik has confirmed its leadership in terms of cruise calls (more than 600), with a share of 17% of the total [
17]. By comparing the maritime tourism intensity in 2012 and 2016, it can be seen that some regions, such as Zadar and Primorje-Gorski Kotar Counties, show higher maritime intensity. The higher intensity is due to the growth of cruise traffic in the ports of Zadar and Rijeka.
Dubrovnik, the most important Croatian cruise destination, is one of the major destinations in the Mediterranean. In order to sustainably manage cruising industry in the port, under the provisions of the study “Sustainable Development of Tourism in Croatian Cruising” made by the Institute of Tourism, the Dubrovnik Port Authority seeks to limit the number of passengers from cruise ships to 8000 a day. Also, the Port of Dubrovnik, together with Dubrovnik County, signed an agreement on a common way of booking, according to the principle 2 + 1, which means the reservation of two big ships in the harbor and a large ship in front of the old town [
18].
The City of Split, the second largest city in the Republic of Croatia, became an obligatory stop on the Mediterranean cruise routes. Cruise ships usually come to the port of Split after visiting Dubrovnik, and they usually stay for 10 h. During the high season, Split becomes too crowded with yachts, leisure crafts, and weekenders. Furthermore, a problem arises from the fact that the port of Split, ferry port and docking place for cruise ships, is in the very center of the city. This means that, on some days, without the so-called transit guests and ferry crowds, up to five cruisers dock in the port, which amounts to approximately 12,000 people being disembarked onto the narrow streets of the city.
The port of Zadar has an ideal geographical location; halfway between Venice and Dubrovnik, Zadar has always been an important transit port. Besides its role in the local, domestic, and international passenger traffic, the past few years have been very intensive for Zadar regarding cruise traffic.
3. Regulatory Framework for Waste Prevention
Nowadays, it is of particular importance to set up the strategies for the identification of sources and a successful management of pollution. The first step to address this problem is through the legislation and international agreements. As the Mediterranean Sea has been described as one of the most affected by cruising tourism in the world, it is important to mention the Convention for the Protection of the Mediterranean Sea against Pollution (Barcelona Convention, 1976) [
19]. The main objectives of this Convention, ratified by Republic of Croatia more than 20 years ago, is the protection of the marine environment and coastal zones through the prevention and reduction of pollution, and elimination of pollution (land- or sea-based).
Besides the earlier mentioned European Marine Strategy Framework Directive, the EU Directive on port reception facilities for ship-generated waste and cargo residues [
11] is of genuine importance for the prevention of ocean-based sources of pollution, especially for the reduction of the illegal discharge of ship-generated waste. This Directive is mandatory for all the EU member states. In this Directive, which came into force in July 2003, the following is stated [
11]:
Member States shall ensure the availability of port reception facilities adequate to meet the needs of the ships.
An appropriate waste reception and handling plan shall be developed and implemented for each port.
A ship may proceed to the next port of call without delivering the ship generated waste, if it follows from the information given in accordance with Article 6 and Annex II, that there is sufficient dedicated storage capacity for all ship-generated waste that has been accumulated and will be accumulated during the intended voyage of the ship until the port of delivery.
Furthermore, one of the Directive’s key factors is also the establishment of cost-recovery systems by ports. In this way, vessels are encouraged to discharge their waste on land, and discouraged to dump it into the sea.
More than twenty years ago, the Republic of Croatia ratified the United Nations Convention on Oceans and the Law of the Sea (UNCLOS). This Convention outlines the basic obligations for the reduction, prevention, and control of pollution from various kinds of sources, including land-based and ocean-based sources, but marine litter and discharge of debris at sea were specifically addressed as part of the UN General Assembly Resolution A/RES/60/30—Oceans and the Law of the Sea [
20], underlining the importance of setting up strategies for waste management in the coastal zone, ports, and maritime industries, which should also include recycling, reuse, reduction, and disposal of waste.
One of the most important international documents regarding pollution prevention from the sea is The International Convention for the Prevention of Pollution from Ships (MARPOL 73/78), which concentrates on different kinds of pollution from ships through the six annexes. The fact is that this convention was ratified by 156 countries with 99.42% of world tonnage [
21]. Annex V of the MARPOL Convention, which covers garbage produced onboard ship, entered into force in late 1988 and, so far, has been ratified by 153 countries, including the Republic of Croatia, i.e., 98.97% of the world tonnage [
21]. Within the Annex V of MARPOL Convention, the types and quantities of garbage that ships may discharge into the sea, and the distances from land and manner in which they may be disposed of, are determined. For the purposes of the Annex V, garbage includes
all kinds of food, domestic and operational waste, all plastics, cargo residues, incinerator ashes, cooking oil, fishing gear, and animal carcasses generated during the normal operation of the ship and liable to be disposed of continuously or periodically [
22].
In July 2011, the Marine Environment Protection Committee (MEPC) adopted, by resolution, MEPC.201(62) [
23], the revised MARPOL Annex V, which entered into force on 1 January 2013. According to the revised Annex V of MARPOL 73/78 Convention, the discharge of all garbage into the sea is prohibited, with some exceptions, regarding food waste, cargo residues, cleaning agents and additives, and animal carcasses. Furthermore, for all the types of ships found within special areas, ships outside the special areas, and offshore platforms and all ships within 500 m of such platforms, the discharge of all other garbage, which includes plastics, domestic waste, cooking oil, incinerator ashes, operational waste, and fishing gear, is strictly prohibited.
Also, in March 2012, the MEPC adopted the Guidelines for the implementation of MARPOL Annex V [
24] and the Guidelines for the development of garbage management plans [
25]. Within the Guidelines for the implementation of MARPOL Annex V, it is stated that, due to the restriction of garbage discharge, the garbage management plan for ships is required. Furthermore, the Guidelines highlight that governments must ensure adequate port reception facilities for garbage from ships, and must promote and encourage ships to use them. The minimization of taking onboard materials that could become garbage is encouraged. Also, MEPC supports the development and conduct of studies and research for the minimization of potential garbage, and a reduction of the negative impact on the environment. The Guidelines propose areas for waste minimization studies [
24]:
development of recycling technology and systems for all types of materials that may be returned to shore as garbage;
development of technology for use of biodegradable materials to replace current plastic products as appropriate. In connection with this, governments should also study the impacts on the environment of the products from degradation of such new materials.
Since March 2018, new amendments of the MARPOL Convention have entered into force. The Amendments of Annex V of the Convention are related to the cargo residues of products hazardous to the marine environment (HME) and Form of Garbage Record Book. Also, the Amendments introduced a new category of garbage, i.e., e-waste. E-waste means
electrical and electronic equipment used for the normal operation of the ship or in the accommodation spaces, including all components, sub-assemblies and consumables which are part of the equipment at the time of discarding, with the presence of material potentially hazardous to human health and/or the environment [
26].
The Garbage Record Book is divided into Part I for the use of all ships, and Part II which is required for the ships carrying solid bulk cargoes. The new garbage category distribution is shown in
Table 1.
4. Methodology for Calculation of Plastic, Domestic, and Food Waste Generated from Cruise Ships in the Three Main Ports of Dubrovnik, Split, and Zadar
As there are various categorizations of waste, there are also different kinds of approaches to the calculation of solid waste quantities generated from cruise ships [
5,
27,
28,
29].
For the purpose of this paper, a new source of data regarding estimation of plastic, domestic, and food waste quantities was used. In 2017, the European Maritime Safety Agency published the report “The Management of Ship Generated Waste On -board Ships” [
7], where all the categories of ship-produced waste are presented, and the results are based on the data which are collected through ship audits, interviews, literature review, survey among stakeholders, and audits of waste notification forms. The data about the quantities of waste produced daily onboard cruise ships, which are the subject of this paper, are presented in
Table 2.
The duration of passenger stay and the number of persons onboard determine the solid waste quantities [
5]. The data for cruise guest total number and the average number of days spent in the main ports are obtained from the port authority [
18,
30,
31]. By multiplying these values, a detailed statistics of guests per day are calculated. The calculation of waste amount in m
3, which is produced onboard ship, was done by multiplying the quantities of each type of waste produced daily per person, and the number of guests per day.
By using repeated measures one-way ANOVA, the significance of dynamics of variables of interest was examined. F-statistics, together with the degrees of freedom (F), significance (p), and effect size measure (η2) were presented. Correlation analysis was also applied and the coefficient of correlation (r), coefficient of determination (r2) and significance level (p) were presented. The result was interpreted as significant if p < 0.05. All the calculations were performed by using data analysis software system Statistica 13.2. (Dell Inc., Tulsa, OK, USA).
To compare the approach used and the accuracy of the calculated data, information about the accepted amount of waste from cruise ships for the period was requested from the port authorities. The exact data on the amount of the collected waste from cruise ships is provided only by Dubrovnik Port Authority [
18]. For the other two ports, data are unavailable (Zadar Port Authority), since waste collection is performed by concessionaires. For the Split Port Authority, there are two concessionaires, and the information is provided only on the total amount of waste which is collected from ships for that year. To test the approach and calculation, the data provided by the Dubrovnik Port Authority will be used.
5. Results
In 2014, Dubrovnik recorded 577 cruise ship arrivals, and 915,065 cruise guests [
18]. Two years later, in 2016, the number of guests from cruise ships decreased, but the number of cruise ships increased to 638, which placed Dubrovnik first regarding cruise calls in the Adriatic. The year 2017 showed lower results regarding guest and cruise calls: 742,665 guests and 538 cruise calls [
18].
According to the Split Port Authority, in 2016, the port of Split recorded the highest number of cruise calls. With 286 cruise calls and 278,259 cruise guests, this was the best season for the port of Split. Just for comparison, ten years earlier, in 2006, Split recorded 162 cruise calls with 46,999 cruise guests [
30].
Cruise numbers that Zadar has shown for the short period 2014–2017 are quite impressive. In 2014, 77 cruise calls with 53,791 passengers were recorded. Three years later, that number doubled; in 2017, there were 110 cruise calls with 145,000 passengers. An even larger number of guests is expected in 2018, between 140–150 cruise calls with around 150,000 passengers [
31].
Although the numbers of port calls (2014: 295.67 ± 255.82; 2015: 319.33 ± 257.50; 2016: 346.00 ± 267.10; 2017: 294.00 ± 220.22;
F3,6 = 4.01;
p = 0.07;
η2 = 0.68) and cruise guests expressed in 100,000 (2014: 3.64 ± 4.30; 2015: 3.90 ± 3.88; 2016: 4.16 ± 3.79; 2017: 3.60 ± 3.00;
F3,6 = 0.61;
p = 0.63;
η2 = 0.23) in the three main ports in the Croatian part of the Adriatic Sea for the observed period had an increasing trend, ANOVA did not identify significant differences. Furthermore, the data for Dubrovnik (
r = −0.80;
r2 = 0.64;
p = 0.20), Split (
r = 0.45;
r2 = 0.20;
p = 0.55), and Zadar (
r = 0.98;
r2 = 0.97;
p = 0.02) by using correlation analysis revealed a decreasing and not significant trend, increasing and not significant trend, and decreasing and significant trend of the number of cruise guests, respectively. All the data were provided by the respective Port Authorities [
18,
30,
31].
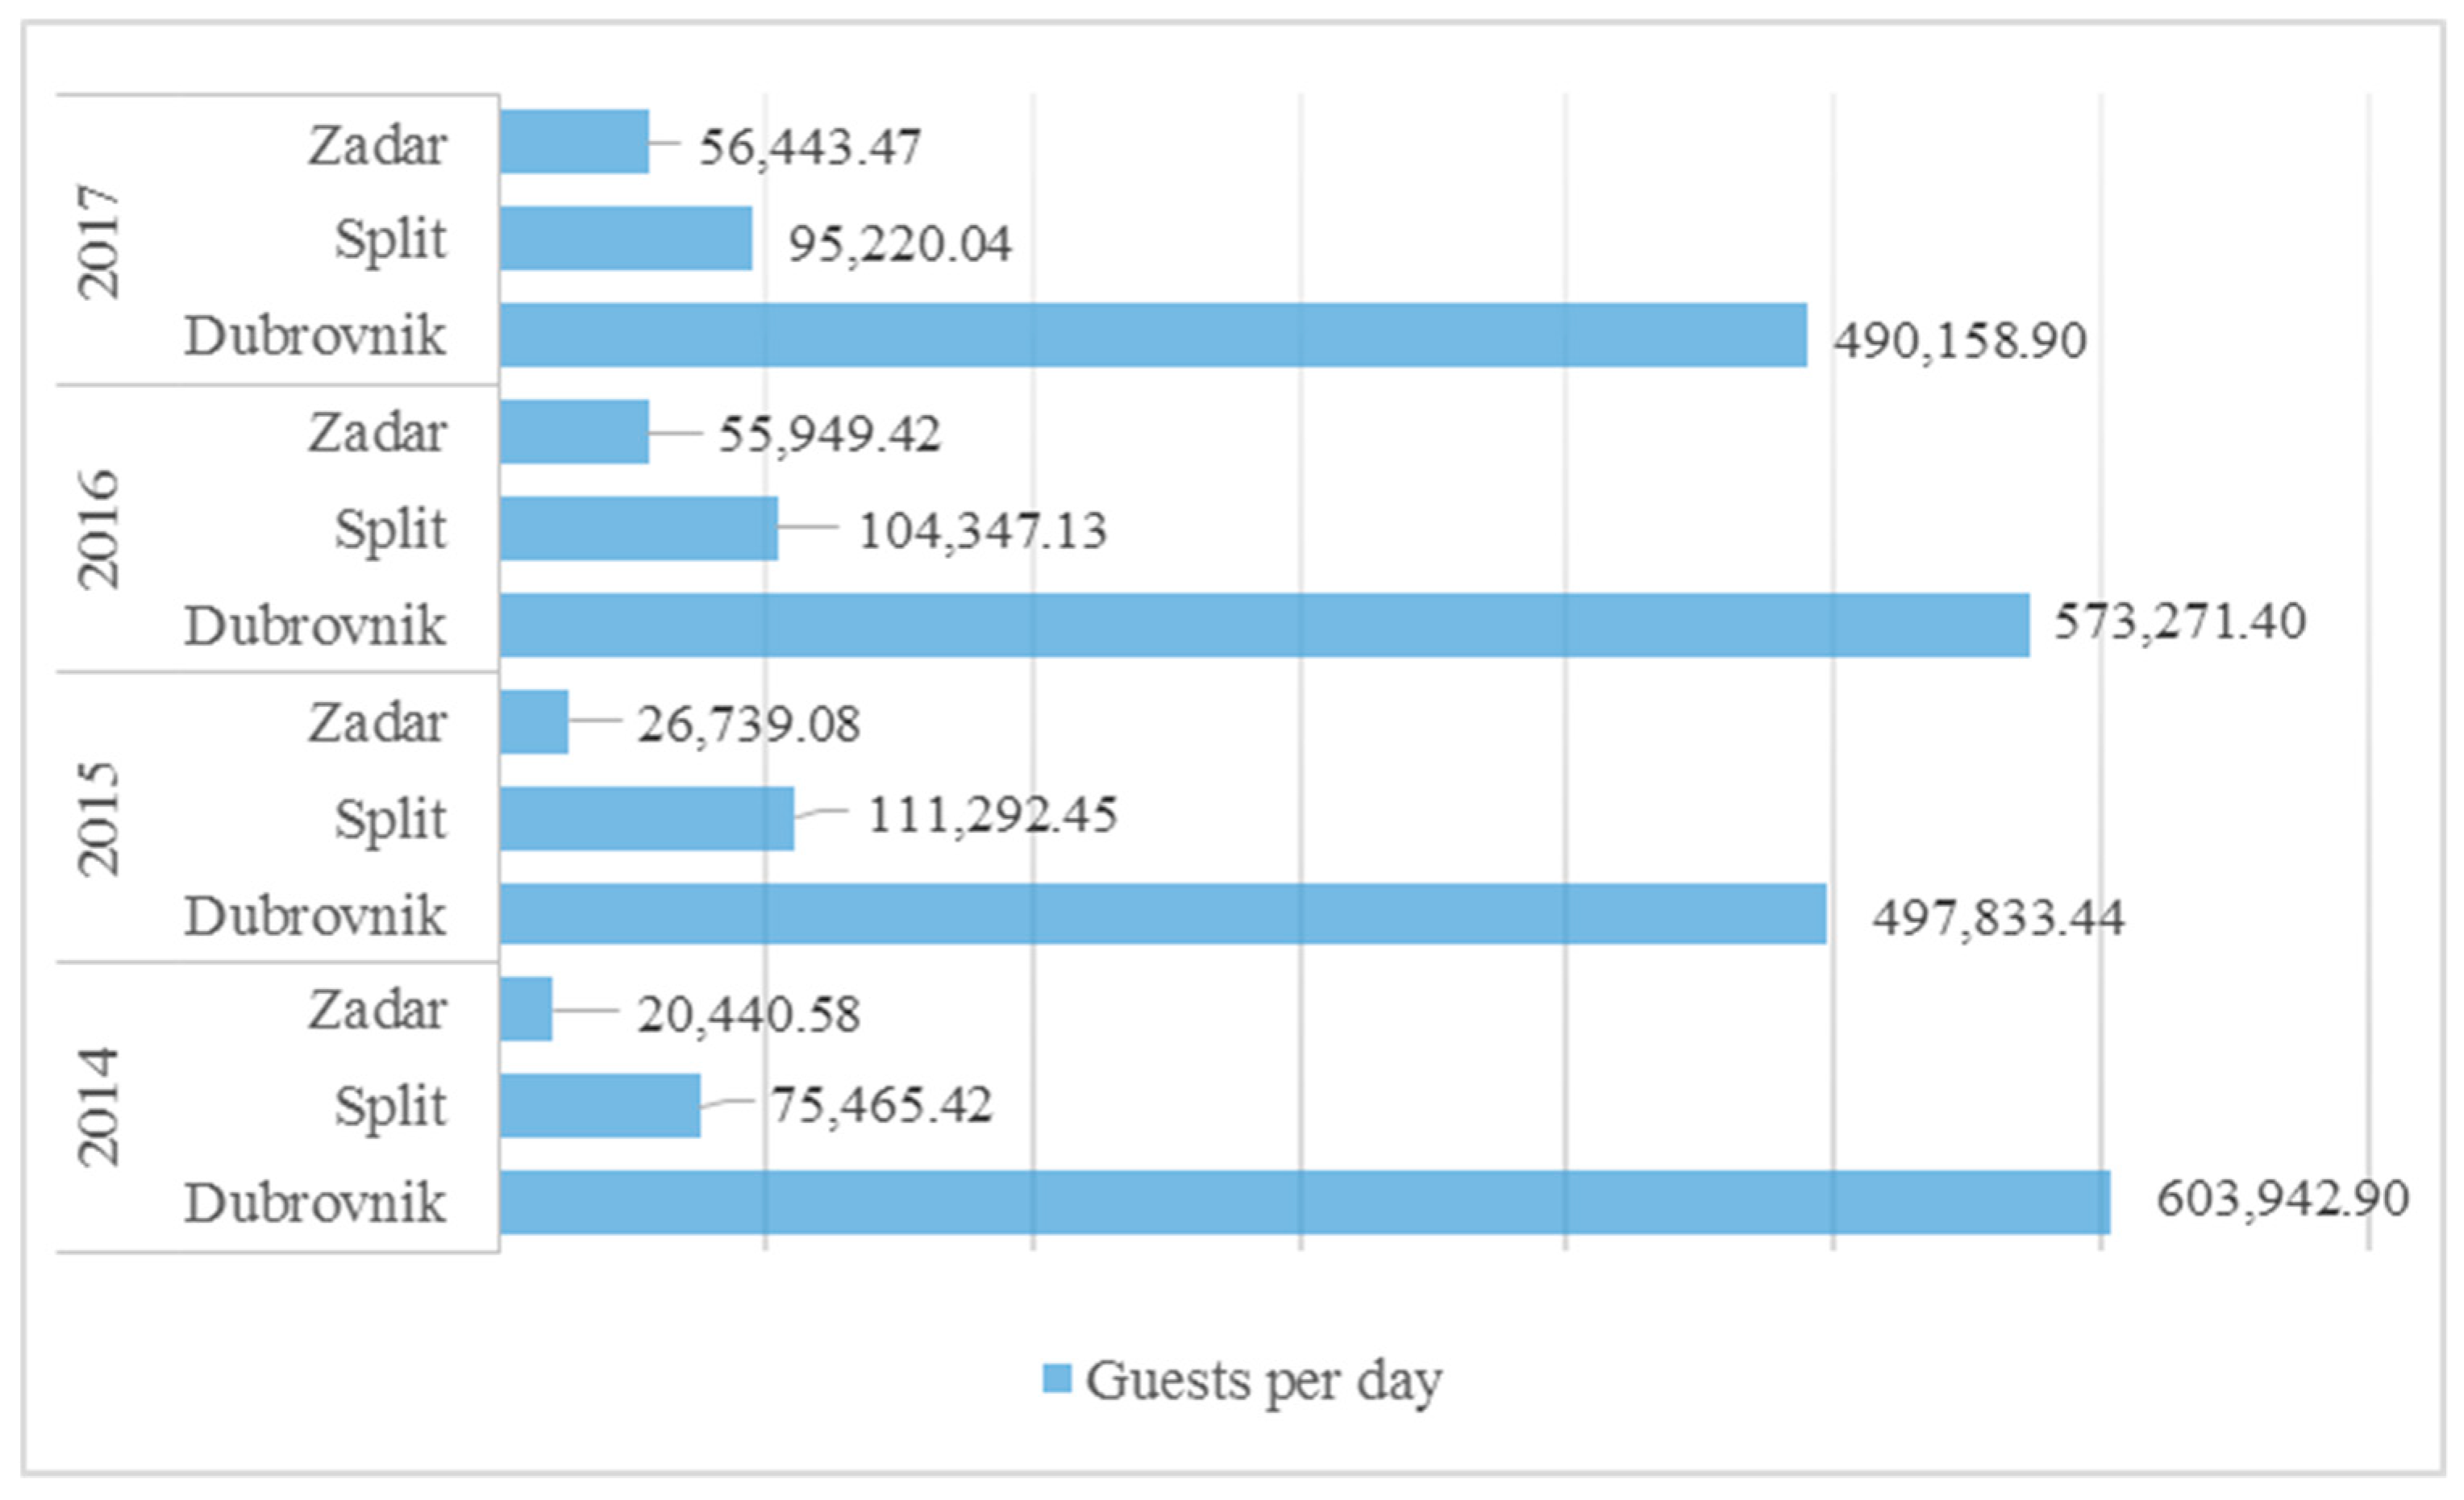
Taking into account the average day stay, and the number of cruise guests in total, the number of guests per day for each port was calculated. An average day spent differs from port to port; in Dubrovnik, the guests usually spend 13–16 h, in Split and Zadar, the number is lower, i.e., from 8–10 h [
18,
30,
31]. A detailed statistics of guests per day in the ports of Dubrovnik, Split, and Zadar for the four-year period, 2014–2017, is given in
Figure 2.
One-way ANOVA did not reveal significant differences in the 2014–2017 period (F3,6 = 0.46; p = 0.60; η2 = 0.20). As expected, with some fluctuation in the numbers, the port of Dubrovnik had the highest number of guests per day in the observed period, with an average of 541,301.66 ± 56,128.00 guests per day. However, comparing the first and the last year of the observed period, a decrease of 19% was noticed. The port of Split is the second largest cruise port with an average of 96,581.26 ± 15,539.83 guests per day for the observed period. In the same period, the port of Zadar set itself as another major cruise port in Croatia, with the number of guests per day in 2017 almost three times higher than in 2014. In the observed period of four years, the average number of guests per day was 39,893.14 ± 19,001.30.
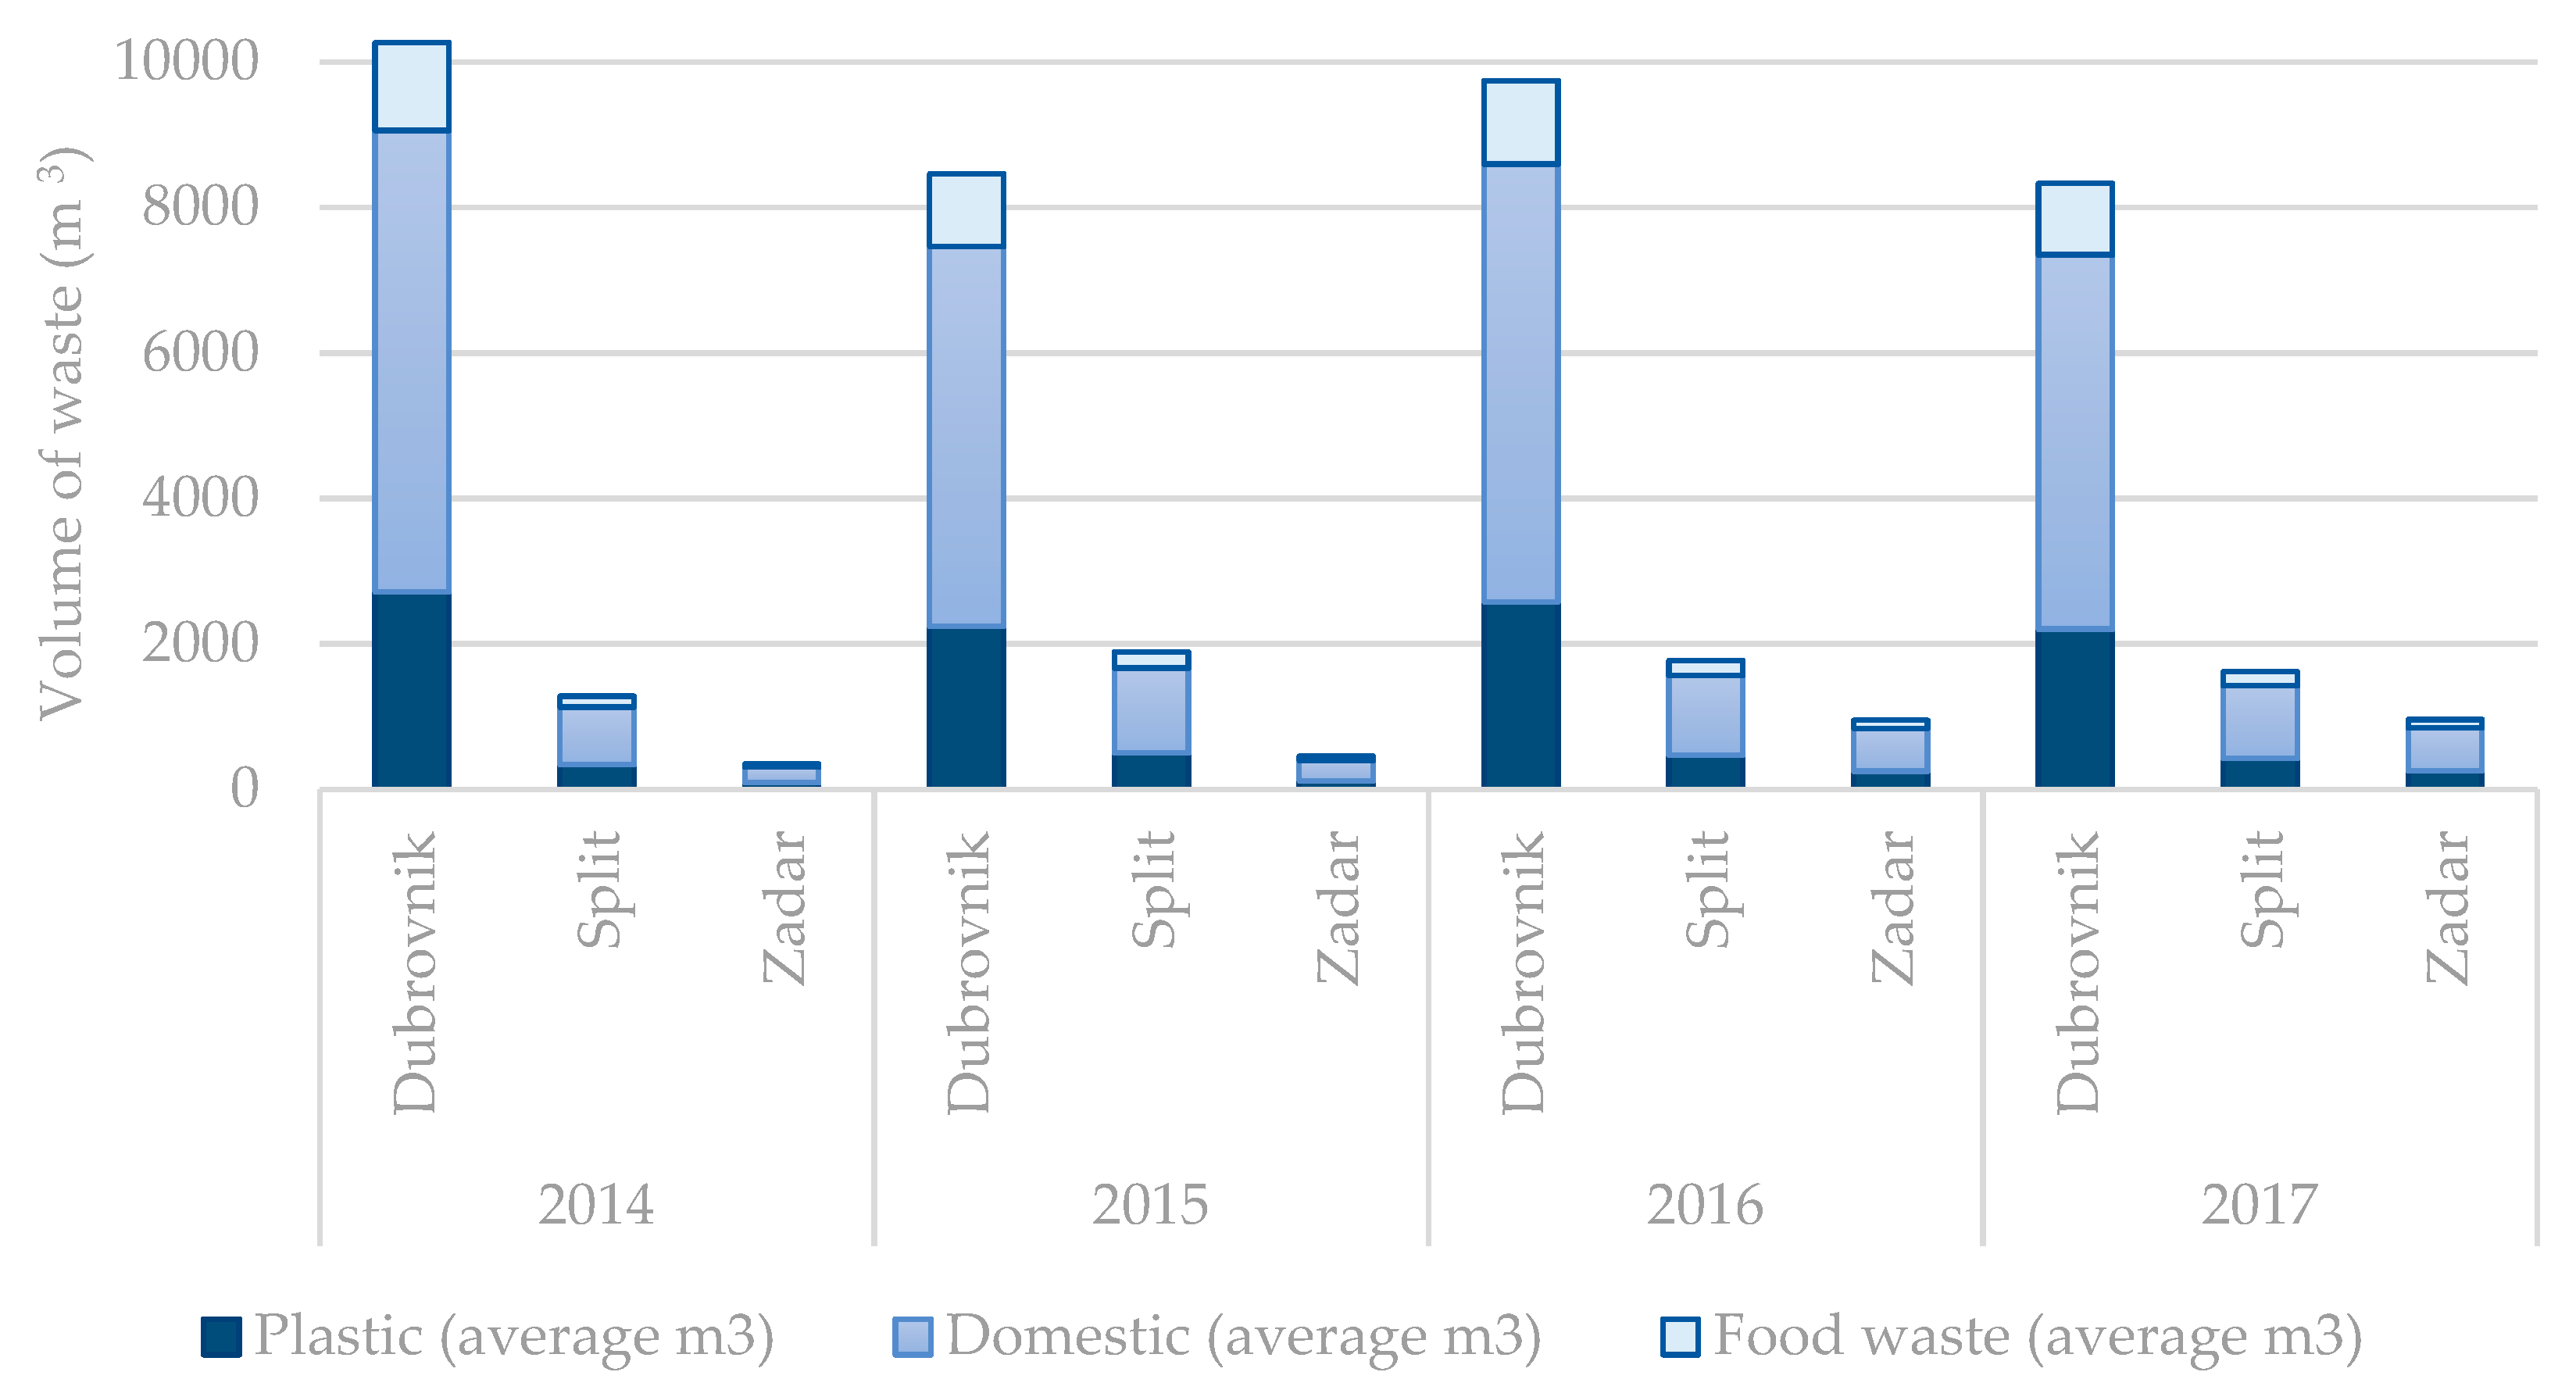
As indicated in
Table 2, the quantities of ship-generated waste, which are the subject of this paper, are shown within the range of the minimum and maximum values. This means that, for the detailed analysis, the minimum (lowest) and maximum (highest) quantities of generated waste are calculated and, ultimately, an average between the two values for the observed period, which is shown in
Figure 3. The results showed that the amount of each waste depended directly on the number of guests per day and the types of products used.
Analyzing the results shown in
Figure 3, the largest quantities of the total amount of waste were recorded in the port of Dubrovnik in 2014, amounting to 10,267.03 m
3, which is in line with the highest number of guests, per day, calculated for this port. In the port of Split, the largest total waste quantities in the amount of the 1891.97 m
3 were recorded in 2015, again, in the year when the highest number of guests per day was calculated. For the port of Zadar in the year 2017, the largest quantities were calculated in the amount of 959.54 m
3. The obtained results showed large differences in the waste quantities of more than 10 times from the maximum recorded in Dubrovnik, and the minimum recorded in Zadar. Only for the port of Zadar, a continuous increase in the total waste quantities were recorded, with doubled quantities observed from 2015 to 2016. Regarding the type of waste, domestic waste contributes the most with 62%, followed by plastic waste with 26%, and food waste, which makes only 11% of the total amount of the waste for that year.
Also, the amount of collected waste from cruise ships was obtained from the Dubrovnik Port Authority for the observed period. In
Table 3, the comparison of the actual situation, in terms of collected waste from cruise ships and the data obtained by calculation with the used range of estimated values, is presented. Considering the fact that ships are obligated to deliver waste, in order to have enough space to store the waste until the next port of waste delivery, the collected waste is not only waste generated while the ship is in port.
From the data presented, it can be seen that there are differences between the actual and calculated data. It is important to highlight that the estimations used are liable to changes, due to the number of persons onboard ship. Also, this contributes to the earlier mentioned facts that the classification of waste is sometimes not clear, and there is a mismatch between the classification of waste used onboard ships and the classification used by waste handlers. Although the waste handler should be responsible for a sustainable management of each classification category, according to MARPOL Annex V, this is not the case in many Croatian ports.
6. Conclusions and Further Recommendations
It is evident that the cruising industry will continue to grow and develop even more. Profit is always one of the important parts of any equation, but the negative effects and consequences that arise from it should not be neglected. To achieve a smart growth of this industry, all stakeholders must be involved. From the calculations for the three main cruising ports, it can be seen that the waste generated onboard cruise ships in the near future will become a problem, especially the further treatment and disposal of the accepted waste at ports. As there are no proper management policies, it is often the case that the waste is properly separated and treated onboard, but the same procedure is not followed at the port, due to the lack of appropriate facilities. This review, with the following estimations, may be one of the first steps for planning the future management of waste in Croatian main cruise ports.
Although the aim of this paper was not waste management, i.e., processes used onboard ships, it all starts there. According to the results and the abovementioned potential problems, possible first steps can be made in waste minimization. In order to effectively minimize waste, it is necessary to sort the waste accordingly. Proper management of the generated waste, which includes minimization of waste and further improvement of waste minimization strategies and practices onboard vessels, is the key for the environment protection and future sustainable development of the cruising industry. Waste management should include reducing, reusing, and recycling methods. The suppliers, with reduced packaging, can also significantly contribute to waste minimization. Additionally, use of grinders, comminutors, or incinerators for domestic waste, which contributes the most to the quantity of onboard waste, is another way to reduce the quantity of waste. The process of drying reduces the quantity and decay of food waste. Through a reduction in the volume and toxicity of waste, great results regarding reduced environmental impact are obtained.
As the focus of this paper is on the plastic, food, and domestic waste generated onboard cruise ships, the main issue for Croatia can arise form non-compliance with MARPOL, as well as the EU and national regulations onshore. Although each port authority has its own port rules and regulations in which the procedure of waste collecting is described, this periodically large quantity of domestic waste produces |n additional workload on municipal landfills.
Regarding plastic waste, it is extremely important to sort it onboard ships, in order to appropriately manage the plastic waste onshore according to regulations. Due to the fact that plastic can be incinerated only in an approved incinerator, a reduced volume of plastic waste can be obtained using a comminutor or compactor. In our review, plastics make only 26% of the waste quantities; nevertheless, the management of plastic waste is a significant issue. Especially, usage of single-use plastics should be minimized, or forbidden, in order to reduce the quantities of different plastic wastes.
It is of genuine importance to set a quality system regarding waste management, to improve logistic measures for waste acceptance and disposal at the port, to implement new waste minimization processes and procedures, and to educate not only the crew, but also the local community.
Obviously, the damage from pollution cannot be completely eliminated, but should be minimized as much as possible, and it is important to establish a quality control system in cruising which, together with legal measures, should contribute to raising awareness about the potential long-term consequences.


