Article

A Model-Based Framework to Evaluate Alternative Wildfire Suppression Strategies

by
Karin L. Riley
1,*,
Matthew P. Thompson
2,
Joe H. Scott
3 and
Julie W. Gilbertson-Day
3
1
Rocky Mountain Research Station, Forestry Sciences Lab, U.S. Forest Service, Missoula, MT 59801, USA
2
Rocky Mountain Research Station, U.S. Forest Service, Fort Collins, CO 80526, USA
3
Pyrologix, Limited Liability Company (LLC), Missoula, MT 59802, USA
*
Author to whom correspondence should be addressed.
Resources 2018, 7(1), 4; https://doi.org/10.3390/resources7010004
Submission received: 30 August 2017 / Revised: 19 December 2017 / Accepted: 20 December 2017 / Published: 3 January 2018

Abstract

:
The complexity and demands of wildland firefighting in the western U.S. have increased over recent decades due to factors including the expansion of the wildland-urban interface, lengthening fire seasons associated with climate change, and changes in vegetation due to past fire suppression and timber harvest. In light of these changes, the use of more wildland fire on the landscape could reduce fuels and form barriers to the spread of future fires while performing forest restoration in some areas. However, the risks, costs and benefits of changing fire response strategy have not been quantified. Here, we identify gaps regarding the ability to simulate alternative wildfire suppression strategies, due to a number of factors including limited data collected on fireline construction, as well as synergies between firefighting resources and resource effectiveness. We present a fire management continuum: at one end lies full suppression of all fires under all circumstances, and at the opposite end lies no suppression of any fires regardless of location or time in season, with a wide array of managed fire options falling in between. Next, we demonstrate the proof-of-concept using a stochastic fire simulation model, FSim, to simulate two alternative fire suppression strategies close to opposite ends of this continuum for the Sierra National Forest of California: (1) business-as-usual, which equates to nearly full fire suppression; and (2) full suppression of human-caused fires and no suppression actions on lightning-caused fires. Results indicate that fire management strategy can substantially affect the number of large fires and landscape burn probabilities, both of which were shown to increase under the second scenario. However, temporal feedbacks are expected to play an important role: we show that increases in burned area substantially limit ignition potential and the extent of subsequent fires within the first five to ten years, especially under the second scenario. While subject to current data gaps and limitations in fire modeling, the methodology presented here can be used to simulate a number of alternative fire suppression strategies, including decisions to suppress or not suppress fires based on location, time of season or other factors. This method also provides basic inputs needed to estimate risks, costs and benefits of various alternative suppression strategies in future work. In future work, uncertainties resulting from current limitations in knowledge can be addressed using techniques such as scenario planning in order to provide land managers with a set of possible fire outcomes.

Graphical Abstract

1. Introduction

Wildland fire management in the United States and elsewhere has increased in complexity commensurate with dramatic shifts in the fire environment due to factors such as changing climate, land use and population [1,2,3,4]. These shifts produce continued if not growing concerns over escalating fire suppression costs, losses of highly valued resources including homes, and firefighter fatalities (e.g., [5,6]). Where fires are of higher severity than would be expected by the range of natural variability, concerns are raised about losses to natural ecosystems and endangered species habitat [7,8]. The legacy of past management practices contributes to the problem, since aggressive fire suppression produces increased fuel loading and continuity that makes future fires resistant to control, a syndrome known as the fire paradox [9,10,11,12,13]. Continuing a business-as-usual full suppression strategy is recognized as unsustainable [14], and new paradigms call for learning to live with fire and promote socioecological resilience that can adapt to disturbance rather than futilely attempt to minimize or exclude it [15,16,17]. In many locations, the biophysical solution might well be more fire, not less: the choices lie around where and under what conditions to leverage prescribed and managed fires [18,19]. Mechanical treatment alone is insufficient to reduce fuels without the use of prescribed fires [20], is limited in spatial scope compared to the scale of many wildfires [18,21] and is constrained by practical factors including access in many areas [22,23]. Therefore, an increasing role exists for using unplanned ignitions to manage fuels in selected areas and under selected conditions [24].
Significant recent improvements in spatial risk analysis help prioritize and target areas where fuel treatments are more likely to be effective and efficient at mitigating risk [25,26,27,28,29,30,31]. Embracing risk management and upstream planning (before a fire ignites) has the benefits of buying time and expanding option space once an ignition occurs [32] and is consistent with principles of effective fire management planning developed using the best available science and information [33]. Spatial risk assessment can play an important role in informing the spectrum of management and mitigation decisions. For example, probabilistic fire simulation modeling can serve as the underpinning for assessment of risk to highly valued resources, and subsequent delineation of zones where unplanned ignitions can be used as a tool for fuel reduction and forest restoration with low risk [34]. These assessments can further be coupled with spatially-explicit information on factors related to responder safety and suppression difficulty to improve fire management operations [35,36]. These new analytical products show promise in supporting risk-informed decision making, ideally resulting in expanded use of unplanned ignitions for resource benefit, fuel treatment and reduced responder exposure.
Despite this promise and growing recognition of the need for more fire, little work is being completed on evaluating, modeling and analyzing how, where and under what conditions the footprint of fire could be expanded on the landscape, and with what consequences. Previous modeling efforts indicate that the fuel treatment effect resulting from a fire may result in substantial cost savings on future fires [37]. However, the current reactive situation incentivizes land managers to send fire suppression resources to attack fires rather than utilizing them as opportunities to achieve longer-term land management objectives. Duff and Tolhurst [38] noted, “As large fires tie up resources for extended periods and are disproportionately expensive [39], the need to effectively forecast the impacts and suppression effectiveness remains critical”. That is to say, although the need for expanding the use of beneficial fire is well recognized, how to do so is not well understood in terms of a pathway forward. While, in certain areas, experience with fire use is strong, gaps remain in capacity for broad-scale implementation and in current approaches to modeling fire suppression. A clear need exists for development and validation of model-based evaluation of alternative response strategies in order to anticipate costs and consequences of leveraging unplanned ignitions, as well as improving understanding of unknowns and uncertainties [40].
We conceive of fire management as occurring along a continuum, with full suppression in all locations on the landscape at one end of the continuum and no suppression at any location at the opposite end of the continuum (Figure 1). In between lies a rich array of managed fire options, consisting of those where fire suppression actions are taken based on location of the fire, time of season, cause of ignition or other factors. These locations and times can be evaluated before the ignition occurs through a spatial fire planning process [33,34]. Notice that “no fire” is not an option on the continuum: although many land management agencies have at times during their histories tried to eliminate fire from the landscape, they have not been successful [24]. Thus, full suppression is as close to the “no fire” end of the continuum as fire response can feasibly come. Full suppression may be the most appealing choice for many land managers even in locations where increasing area burned is ecologically desirable: the potential for conflict increases where unsuppressed fires may cross boundaries into other land ownerships and the degree of uncertainty can increase, as well, since unsuppressed fires are likely to remain active on the landscape for longer periods of time under varying weather conditions [41].
While the continuum provides an organizing framework for modeling choices around when and where to suppress fires, models that characterize fire spread and the moderating effects of suppression actions on fire spread are also necessary [37]. A simple but useful abstraction is to consider suppression models as in effect being stopping rules where fire growth ceases after some thresholds or criteria are met. These rules can vary in terms of how they are implemented in space and time and whether they are probabilistic or deterministic. A related feature of suppression models is whether suppression actions are modeled explicitly. The most basic of these ignore suppression actions and typically cease fire growth when fire behavior metrics are below some user-defined threshold [42,43]. Simple models of coupled fire-suppression dynamics consider rates of fire growth and fireline construction independently, where the stopping rule dictates that fire spread ceases in all directions when the amount of fireline that has been constructed equals or exceeds the length of the fire perimeter [38]. More complex approaches instead interact fireline construction with fire growth such that shape and size are affected, but similar basic stopping rules apply [38].
As it stands, investments in improving fire suppression modeling systems largely surpass investments in improving data collection of fire suppression operations. Thus, despite enhanced modeling capabilities, modelers have a limited ability to credibly parameterize these models and instead are often forced to rely on assumptions, rulesets, expert judgment and sensitivity analysis [38,42,44,45,46,47,48,49,50,51,52,53,54,55]. Findings from Gebert and Black [56] suggest that less aggressive suppression strategies may result in larger fire sizes. However, the authors did not statistically analyze the potential influence of non-managerial variables (i.e., weather, vegetation and topography) on fire size and further did not test for endogeneity where for instance fires burning into undeveloped wildlands may be more likely to grow larger and be managed at less-than-full suppression. Martell and Sun [57] did account for vegetation and weather and demonstrated that higher levels of fire protection effort can reduce area burned. However, neither study provided details on actual changes in suppression efforts and tactics such as the location and extent of fireline construction. Only with additional investments in empirically-driven research to better characterize the productivity and effectiveness of suppression resources will operational modeling of suppression actions on large fires be possible [58].
As a modeling philosophy, here we opt for a simpler approach that is less reliant on parameters that are difficult to calibrate and that is less susceptible to compounding model uncertainties. Instead of modeling suppression efforts directly, we vary model parameters and structure to capture changes in suppression via proxy. The drawback with such an approach is that it does limit the types of questions we might explore in terms of suppression tactics and actions, but with the benefit of fewer parameters to calibrate. It is also largely consistent with findings indicating that weather is often the primary driver of fire spread, that suppression resources can be overwhelmed or ineffective during periods of rapid fire growth and that during these severe burning periods, the fires largely define themselves and suppression resources are playing catch up [45,49,53,59]. The stopping rules employed here in effect assume that sufficient suppression resources are in place to capitalize on changes in weather and fire behavior, or that fire spread stops by itself given moderated conditions or the presence of barriers on the landscape (e.g., [43,50]).
In this manuscript, we utilize stochastic fire simulation to assess the impact of different fire suppression strategies on annual number of large fires, fire sizes and burn probabilities on a landscape encompassing the Sierra National Forest in California. We leverage recent research and best practices in framing possible alternative strategies in a novel modeling framework in order to yield insight into the impact of changing suppression strategies and as a tool to understand knowledge gaps [32,35]. We alter model inputs and parameters to approximate alternative management strategies during large fires. We chose two fire management strategies at opposite ends of the continuum to simulate: (1) full suppression of all fires and (2) suppression of human-caused fires with no suppression of lightning-caused fires. In our estimation, Scenario 2 is as far toward the no-suppression end of the continuum as might be feasible given societal constraints, but this scenario is not meant to simulate a pre-European fire regime, as the pattern of human ignitions is likely quite different and the landscape has changed considerably since pre-European times.
Parameterization of these two scenarios required some novel methods, presented in the following section. Next, we present results on how the annual number of large fires, fire sizes and burn probabilities are affected by these two strategies. In addition, we examine how the alternative strategies affect feedbacks in area burned: (1) the likelihood that an ignition will fall on an area that is non-burnable due to being burned during the previous five to ten years; or (2) the extent by which burned area will be reduced if it is assumed that an area can only burn once within a five- to ten-year period. The modeling framework presented here can be augmented in future work to examine other possible fire suppression strategies or to examine the effect of using different suppression strategies for different segments of the landscape.

2. Materials and Methods

2.1. Study Area

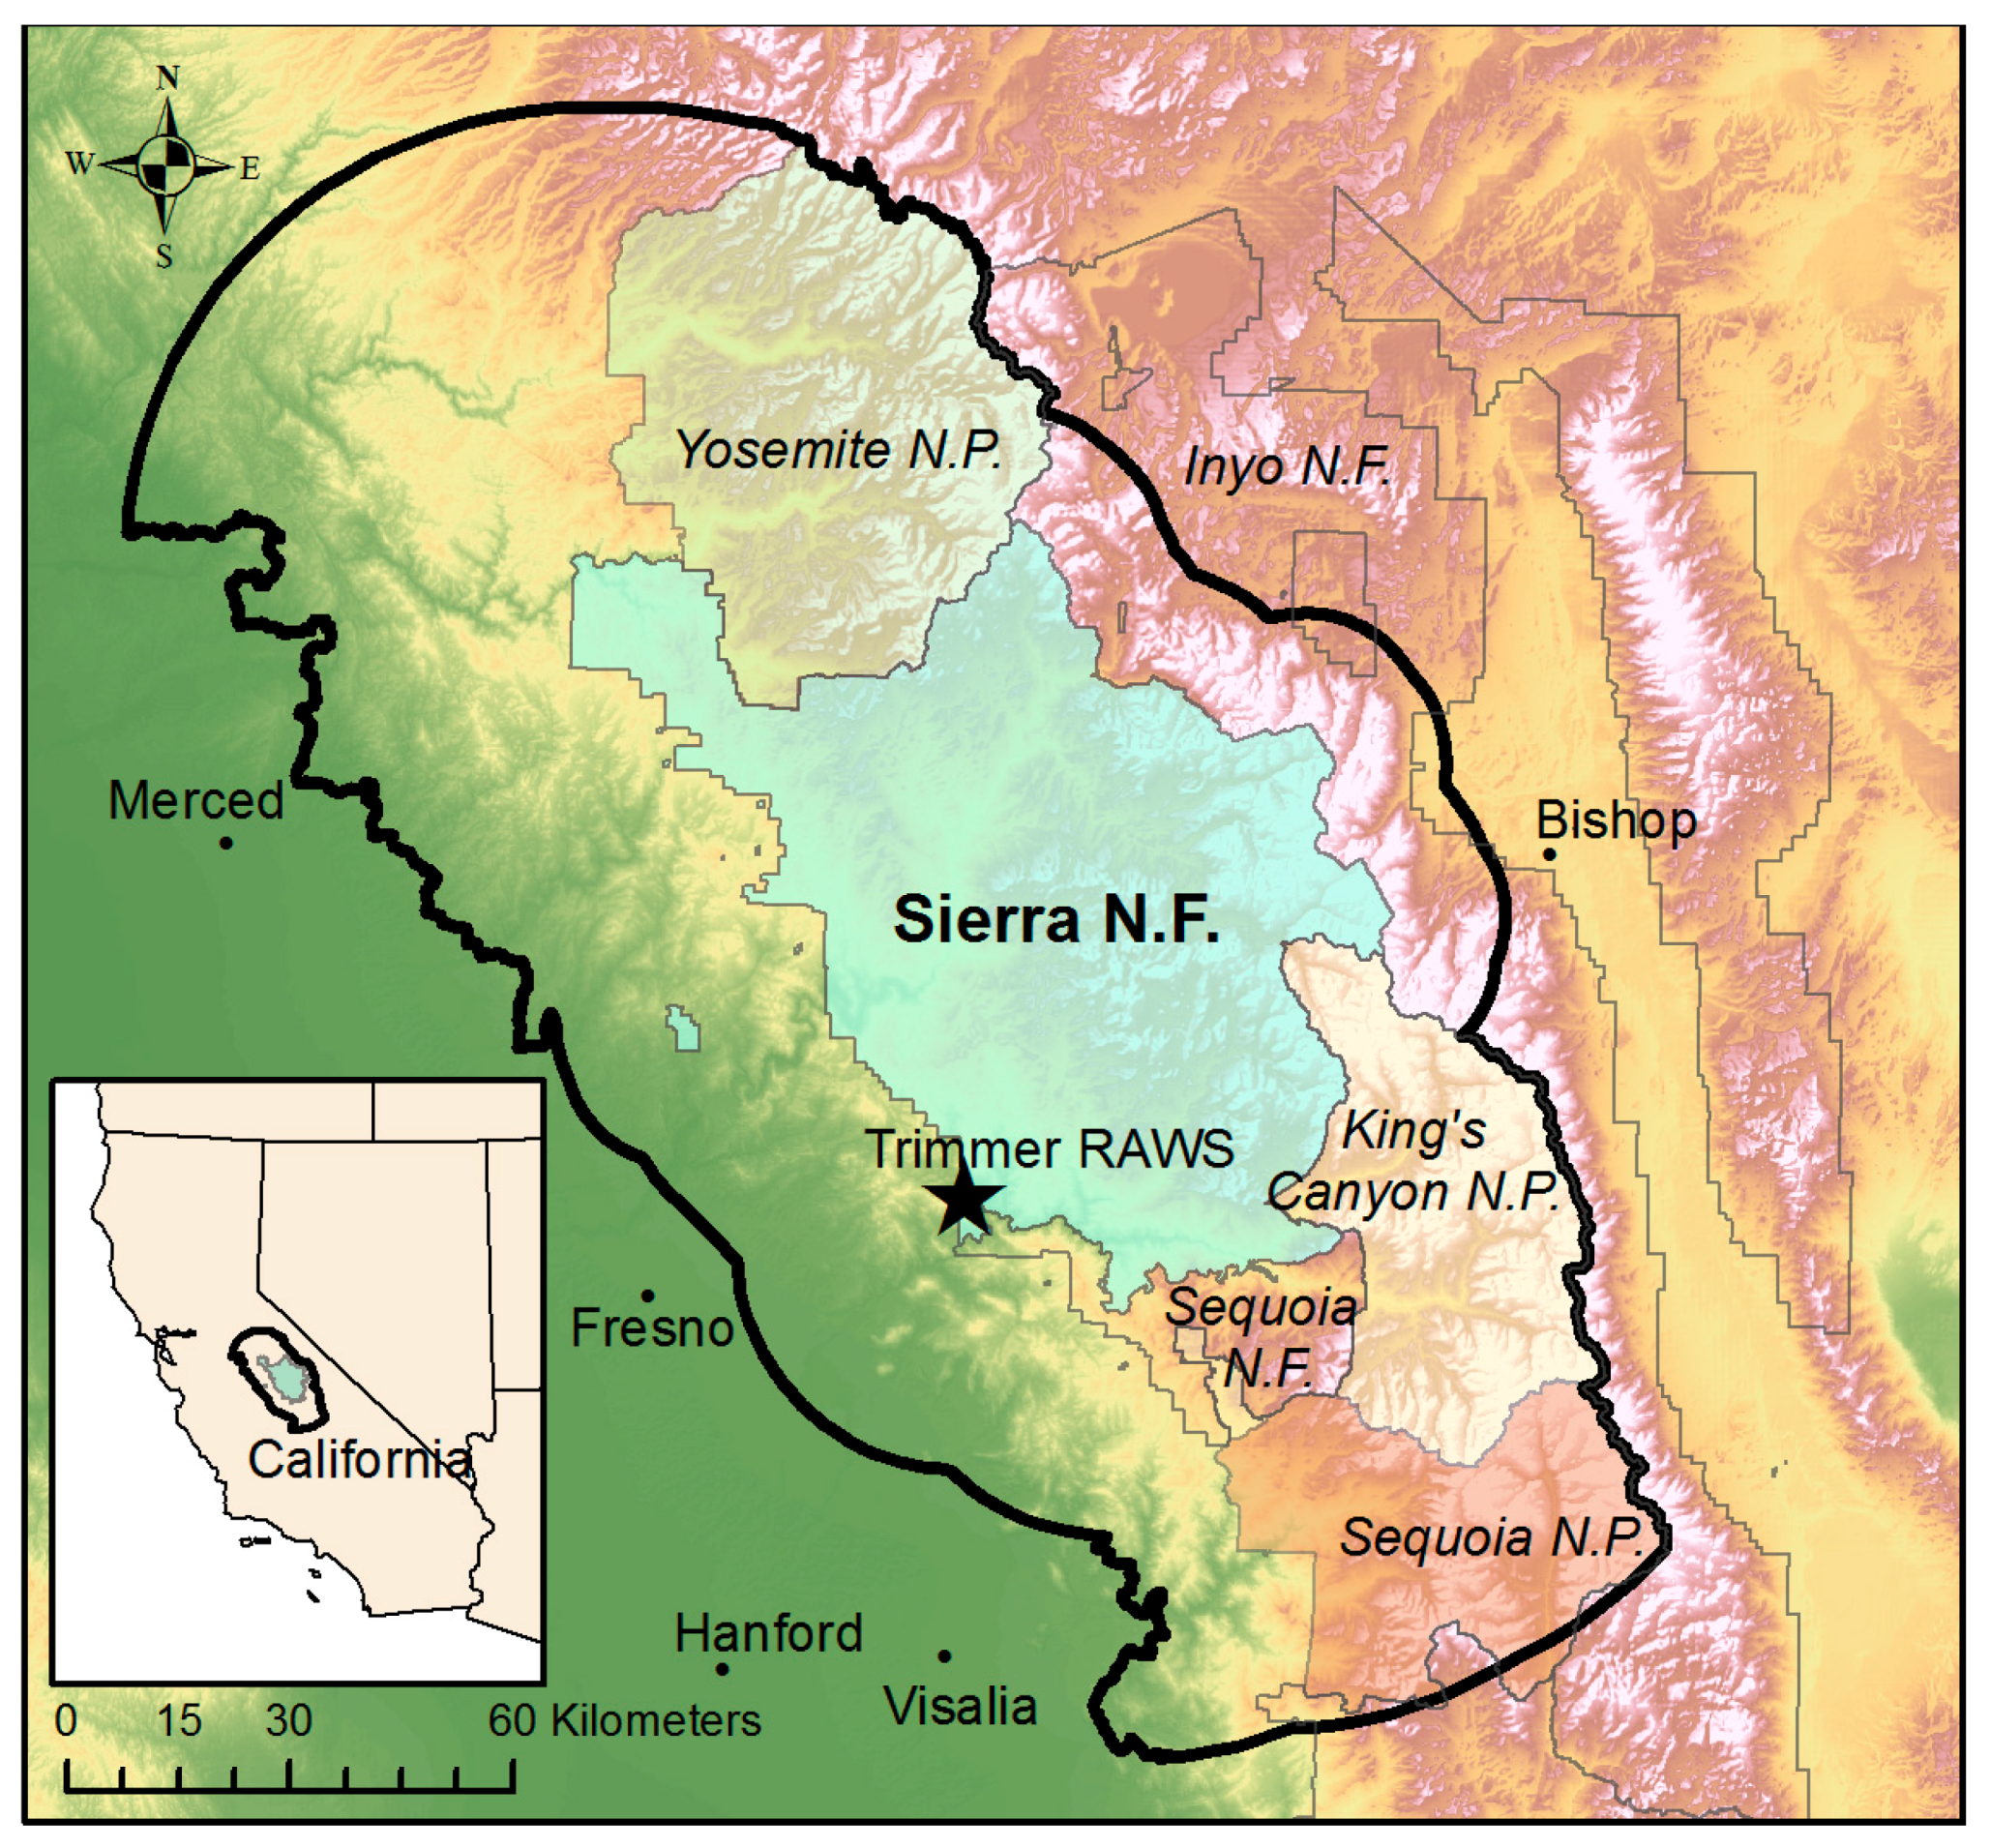
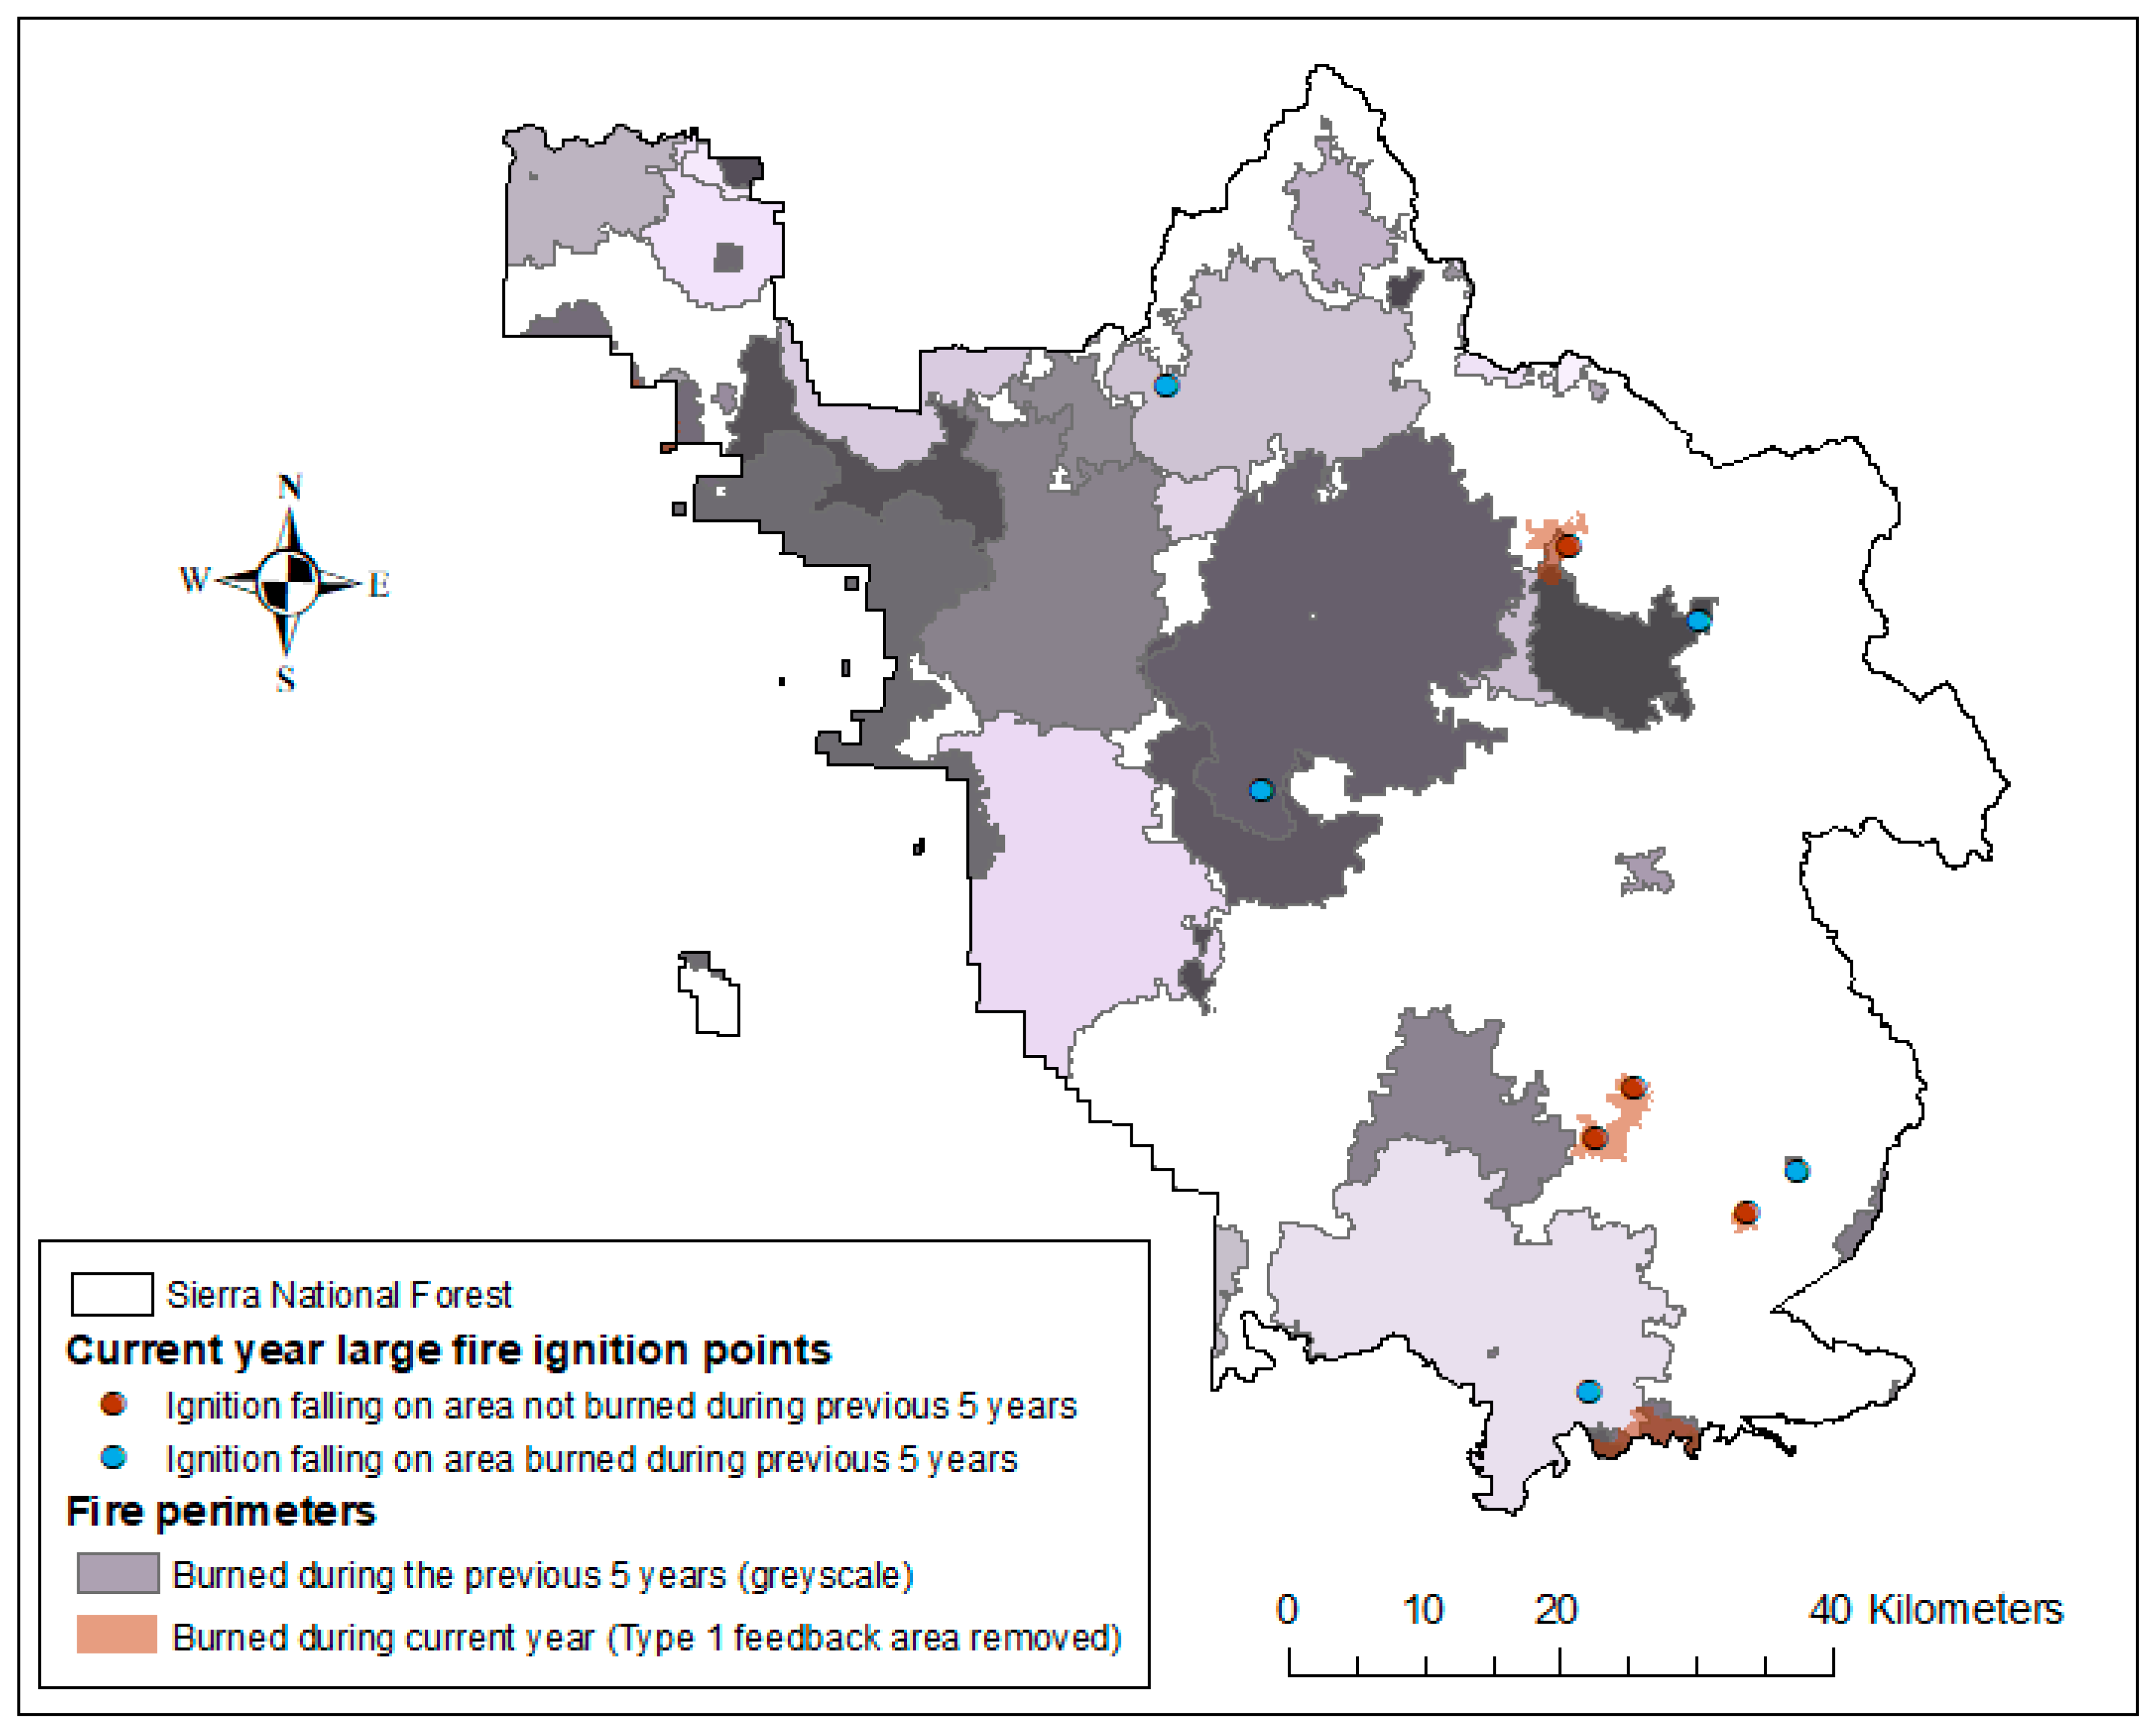
While this methodology could be tested and applied anywhere for which input data are available (landscape, weather and fire occurrence), we chose the Sierra National Forest of California as a case study landscape (Figure 2). The Sierra National Forest was an early adopter and innovator of spatial risk assessment and strategic pre-fire planning processes that have and will continue to be closely replicated on other National Forests throughout the country [34]. Fire managers identified zones in this National Forest where moderated suppression responses are desirable for ecological objectives, i.e., this case study landscape reflects exactly the type of context where the modeling efforts we develop could provide useful information to guide future response strategy development.
The Sierra National Forest comprises about 525,000 hectares situated on the west side of the Sierra Nevada Mountains of California and varies from about 300–3700 m in elevation. Seventy-six percent of the National Forest is tree-dominated, with the remainder being non-vegetated (10%), shrub-dominated (8%), herbaceous (5%) and no dominant life-form (2%) [60]. The most common vegetation types are red fir forest, mesic mixed conifer forest and woodland, and mixed oak woodland [60]. The fire regime consists primarily of frequent fires (≤35-year fire return interval) of low to moderate severity, with 54% of the National Forest having this designation, primarily in the lower elevation areas [61]. As the elevation increases, the fire regime shifts to a longer fire return interval (35–200 years) with low to moderate severity (31% of the National Forest). Other fire regimes in the National Forest include (in order of decreasing prevalence): barren/non-burnable (8%), 35–200 year return interval with replacement severity (4%), sparsely vegetated (1%), water (1%), less than 35-year return interval with replacement severity (0.2%), longer than 200-year return interval with replacement severity (0.2%), snow and ice (0.0005%) and indeterminate fire regime (0.00008%).
Recent large fires in the Sierra National Forest include the Aspen Fire of 2013 (9536 ha) and the Tehipite Fire of 2008 (4938 ha) [62]. In 2013, the 104,038-hectare Rim Fire occurred only about 10 km north of the Sierra National Forest, illustrating the possibility of much larger fires occurring in the Sierra National Forest as well. Extensive tree mortality due to drought is causing concerns regarding extreme fire behavior in the future [63].

2.2. Fire Modeling Approach: The Large Fire Simulator

For this project, we required a simulation program that would model fire initiation and growth, landscape-level burn probability and fire perimeters under different fire suppression scenarios. We chose the Large Fire Simulator (FSim) as it has these capabilities [64]. FSim has been widely used in hazard and risk assessments [3,30,65,66]. FSim was designed to simulate the ignition and growth of fires under weather conditions during which fires grow large, as these fires contribute the vast majority of burned area under current fire suppression strategies [64]. Simulation time is saved by not simulating the many small fires that do not contribute meaningfully to area burned. As our primary interest pertains to large fires here (those that fall under extended attack), this simulation approach is appropriate.
FSim models ignition and growth of large fires in response to topography, fuel and weather conditions. Inputs required by FSim are: (1) a list of recent large fires with their final area, ignition location and date of discovery; (2) daily weather data from a nearby weather station generally representative of the weather for the simulation area; and (3) a landscape file including fuel and topography information [64]. Daily large fire ignitions are modeled via logistic regression of a fire danger metric (the Energy Release Component for Fuel Model G) with historical large fire ignitions [64,67]. Once ignited, fire growth proceeds via a minimum travel time algorithm [68] based on the Rothermel rate-of-spread equations and a crown fire model. In addition, FSim contains a fire suppression module that may be activated, presenting users with the opportunity to model fires under a strategy of no suppression or suppression of various intensities [59,69]. Three key outputs of FSim required for this project are: (1) a raster of the annual probability of burning at all points on the landscape; (2) a list of the ignition date, location and size of each fire; and (3) a set of simulated fire perimeters.

2.2.1. Weather

In order to produce a map of burn probabilities, a modeled approach is necessary: the documentary record of large fire perimeters is too sparse [64]. To remedy this problem, FSim generates artificial yearly weather sequences whose statistics are representative of the local weather station records [70]. Each weather sequence represents a yearly weather scenario that is simulated by FSim; in this sense, FSim is a stochastic model [64]. The length of each weather scenario simulated by FSim is one year. The weather streams consist of daily sequences of a fire danger index (the Energy Release Component (ERC) for Fuel Model G) and random draws from the monthly distribution of wind speed and direction at a local weather station. The ERC is an index in the U.S. National Fire Danger Rating System that provides an approximation of fuel dryness [64]. ERC calculations are based on daily weather records of temperature, humidity, solar radiation and precipitation duration, which are in turn used to calculate fuel moistures in four dead fuel time lag classes (1 h, 10 h, 100 h and 1000 h), as well as live woody and live herbaceous components [71,72,73]. The Fuel Model G includes a substantial loading of large dead fuels; because it takes about 1.5 months for these 1000 h fuels (7.6–20.3 cm in diameter) to equilibrate to constant atmospheric conditions, the ERC for this fuel model tracks seasonal trends in fuel dryness [64].
As an input for generating ERC streams for FSim, we obtained gridded daily ERC values for the period 1992–2012 at a spatial resolution of 0.017 degrees [74]. The average daily value, daily standard deviation and temporal autocorrelation in ERC form the basis for the statistically-generated weather streams in FSim [70]. Due to the lack of temporal correlation in wind speed and direction, daily values are randomly drawn from the historical monthly distributions, in this case at the local Trimmer weather station (Figure 2). Correspondingly, ERC values were drawn from the pixel in which the Trimmer Remote Automated Weather Station (RAWS) is located. The Trimmer RAWS was selected from amongst other nearby weather stations based on: (1) representativeness of the study area; and (2) length and completeness of record.
We used 10,000 years of simulated weather for each FSim run. Note that each year of weather is statistically representative of the contemporary period (21 years of weather from 1992–2012) and does not represent projected changes in weather for the next 10,000 years. Thus, annual burn probabilities represent the annual likelihood of burning given the current landscape and contemporary weather, and fire ignitions and fire perimeters represent a plausible event set of wildfires given the same.

2.2.2. Large Fire Ignition and Growth

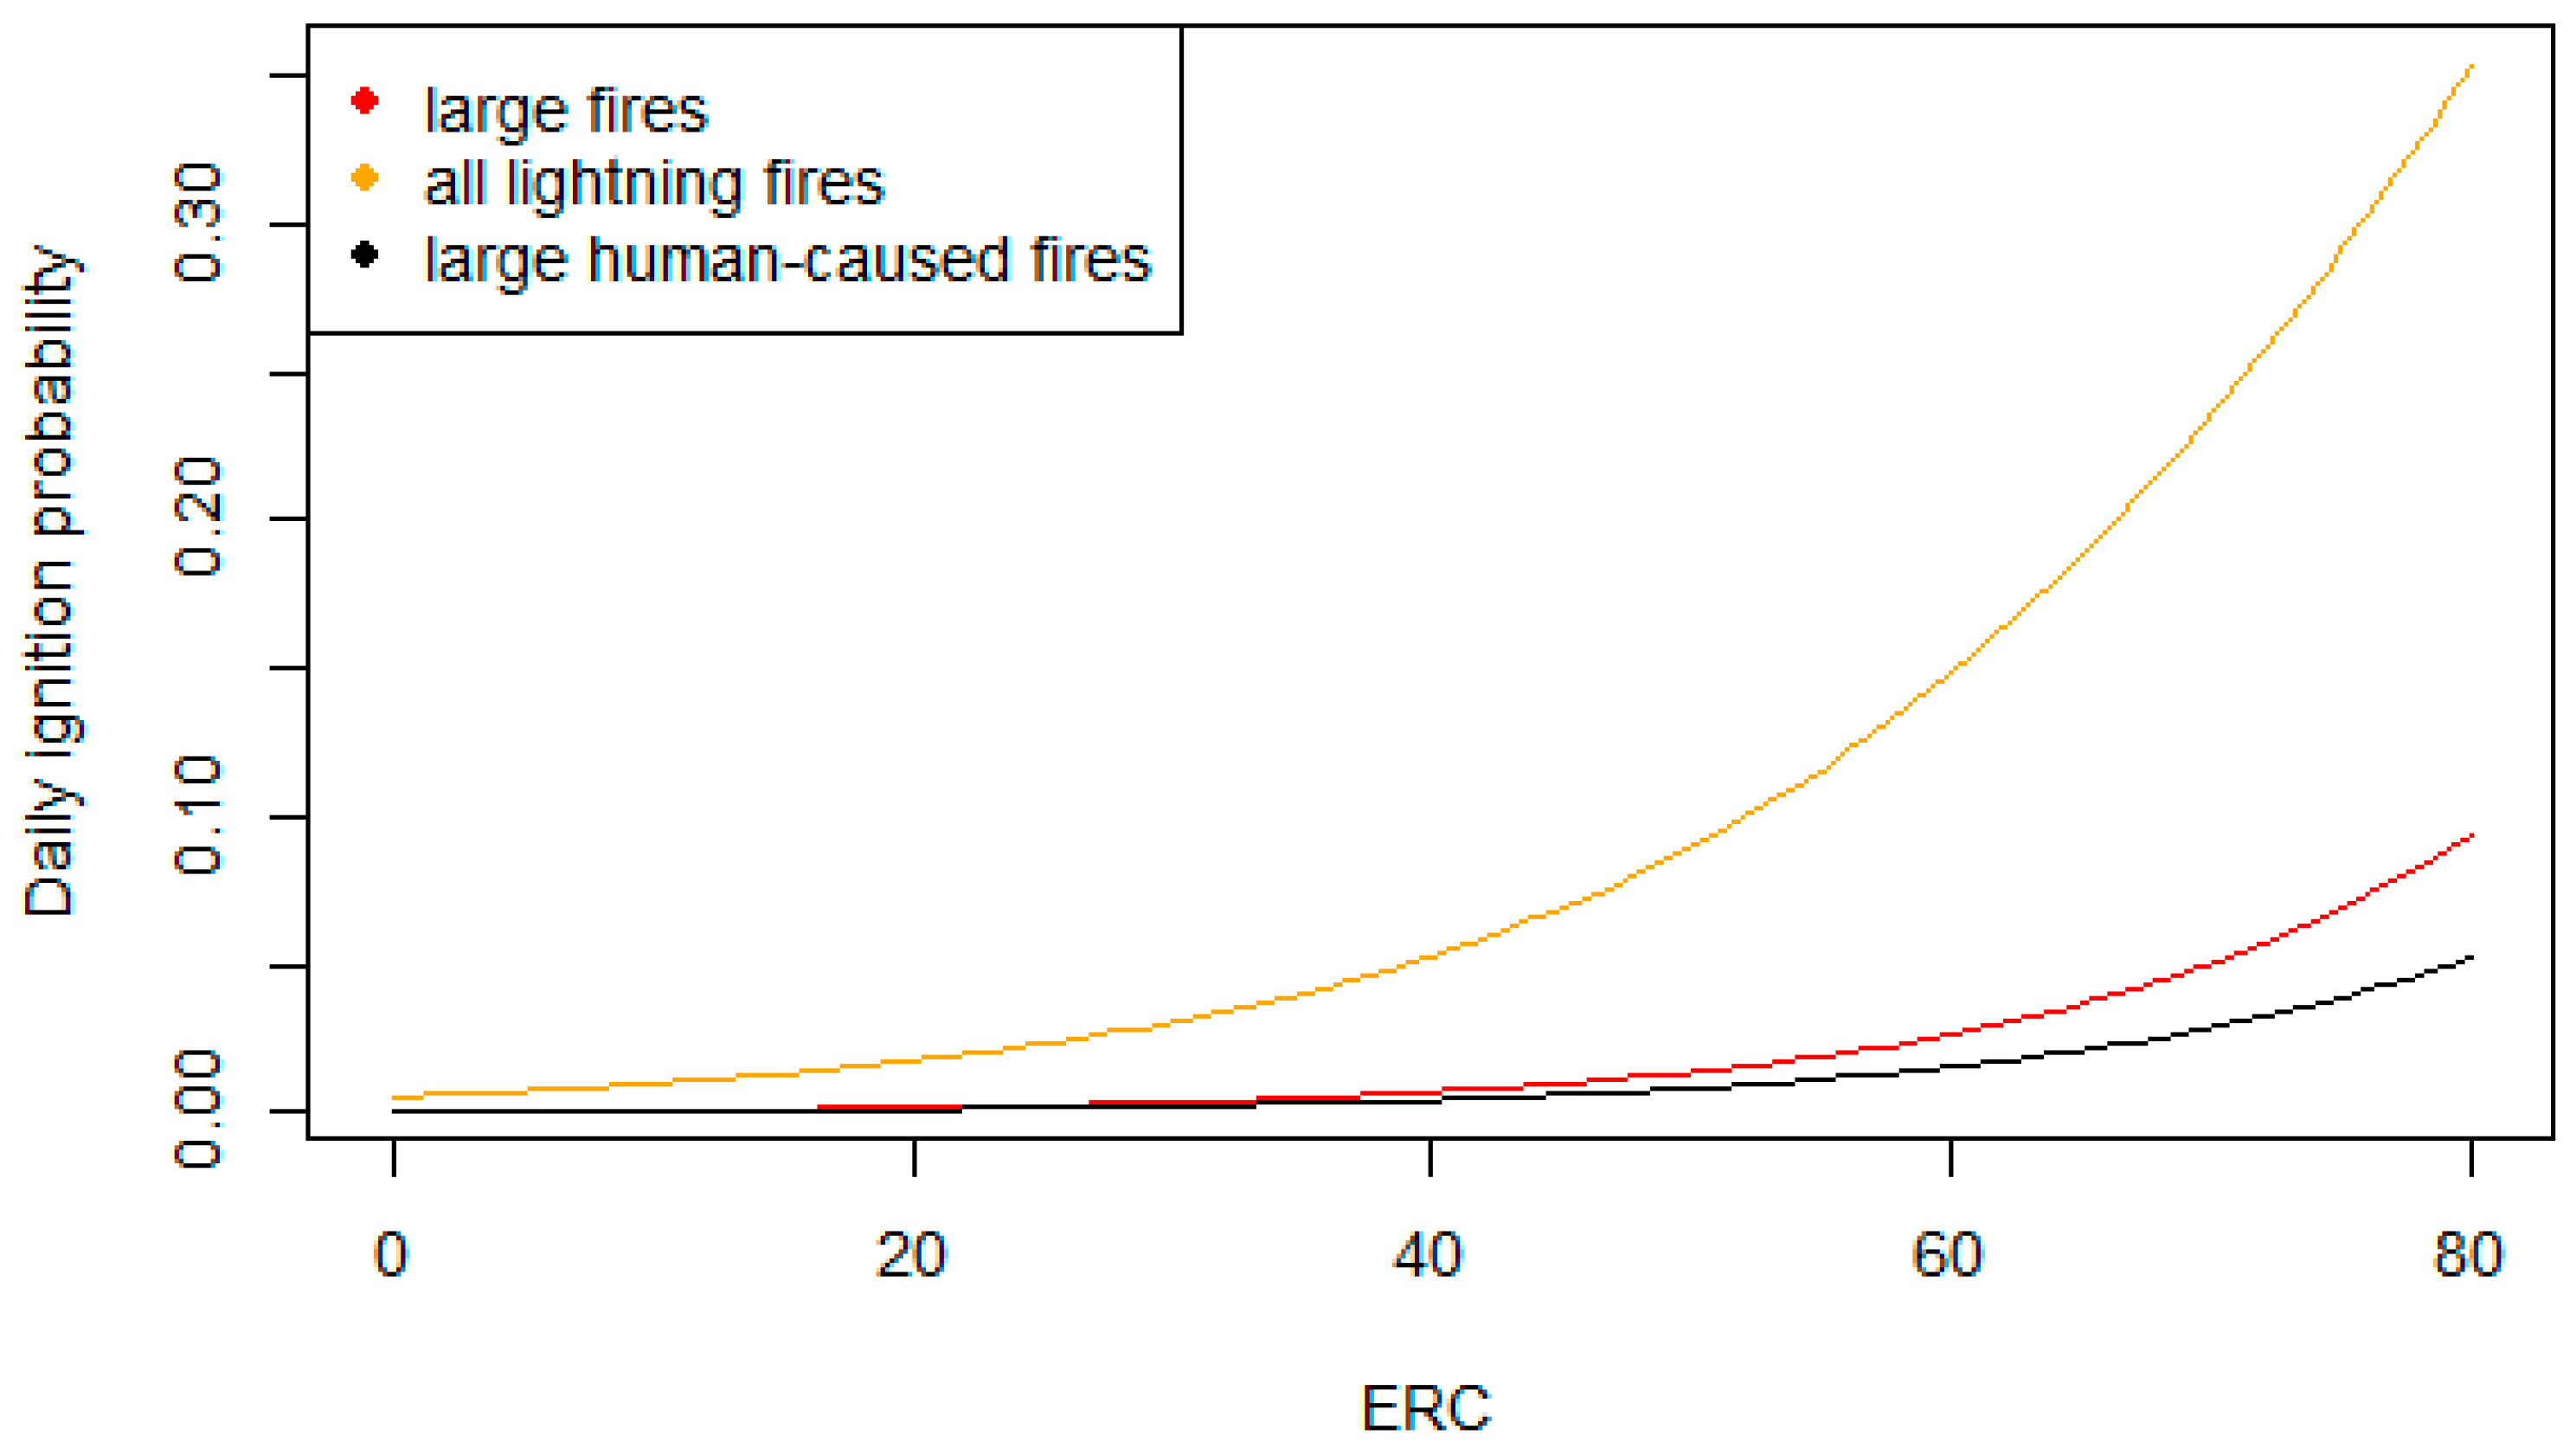
Previous work has documented a strong relationship between daily ERC and the probability of ignition of a large fire, as well as area burned [1,67,75]. Accordingly, FSim models daily large fire ignition probability based on ERC. We parameterized the logistic regression for several different model runs, namely (Figure 3): (1) all large fires (Scenario 1); (2) all lightning fires (a component of Scenario 2); and (3) large human-caused fires (the second component of Scenario 2). When a fire ignites, fire growth and behavior are subsequently determined by daily ERC, wind speed and wind direction in conjunction with a set of landscape inputs including topography and fuels data [68].

2.2.3. Landscape

We obtained the required landscape inputs for topography (slope, aspect and elevation) and vegetation (surface fuel model, canopy bulk density, canopy base height, canopy cover and canopy height) from the Landscape Fire and Resource Management Planning Tools, or LANDFIRE program, for landscape conditions circa 2012 [76]. Fuel models were based on the 40-model set of Scott and Burgan [77]. Data layers were upscaled from 30 m × 30 m to 180 m × 180 m pixel resolution for modeling efficiency using a nearest neighbor methodology.
FSim was run with ignitions occurring in an area larger than the Sierra National Forest, in order to allow fires to ignite outside the Sierra National Forest and burn into it (Figure 2). This ignition area, also called the Fire Occurrence Area (FOA), is identical to that used by Scott et al. [78], which includes a 60-km buffer to the north, northwest and south of the National Forest, a 30-km buffer to the west, and no buffer to the east where the National Forest boundary is located at the Sierra Crest (where fires do not cross from east to west due to a band of rock and ice). The width of these buffers was established by Scott et al. [78] based on analysis of past fires.

2.2.4. Fire Suppression

In its basic form, FSim employs a relatively simple stopping rule, built from the regression model of Finney et al. [59]. This algorithm determines the temporal extent of the fire by probabilistically determining on which day fire growth ceases based on the fire’s duration, the fuel type (forest or non-forest) and whether the fire is in a period of high or low growth. The suppression algorithm is applied to the entire fire (as opposed to modeling the cessation of spread in individual cells or along individual flanks).
A perimeter trimming factor can be applied in addition to the stopping rule; while the stopping rule limits the temporal extent, the perimeter trimming factor limits the spatial extent. The perimeter trimming approach is similar to the Petrovic and Carlson [42] approach, which stops fire growth along certain flanks in different burn periods if the fire intensity or rate of spread is below a certain threshold. However, the perimeter trimming approach is distinct in that it in essence builds the fireline each day at the rate determined by a scaling parameter that is specified by the user, with the fireline being built preferentially in the area of lowest fireline intensity [69]. The scaling parameter varies by region.
FSim can also be run under a “no suppression” scenario. The “no suppression” scenario inactivates the stopping rule and allows fires to spread, on days with fire weather conducive to spread, for the duration of a simulated year. Fire growth ceases when the ERC remains below the 80th percentile for a number of days, indicating moist conditions that would extinguish the fire. The number of days is specified by the user based on historical patterns and expert judgement. When the suppression module is active, fires may be halted by either successful suppression or by an extended period of low ERC.

2.3. Scenarios for Alternative Suppression Strategies

2.3.1. Scenario 1: Business-As-Usual, or Full Suppression

This run was calibrated to emulate annual burn probabilities and fire size distributions during the period 1992–2013, when the de facto national strategy has been full suppression of virtually all fires [79]. Scenario 1 approximates a business-as-usual approach, since only 1.3% of fires in our study area during the period 1999–2009 were designated as wildland fire use, meaning that the remaining 98.7% of fires had active suppression [80]. During the same period, only 6.6% of large fires in the study area were designated wildland fire use [80].
In FSim, ignitions are allocated temporally based on the simulated weather streams, as discussed above, and they are allocated spatially via an ignition density grid, a raster that gives the relative probability of ignition based on where large fires have ignited in the contemporary period [80]. For Scenario 1, we used an ignition density grid of equal weight for all pixels, since visual inspection of the ignitions did not show a strong pattern.
Large fire size was set at 100 ha (247.1 acres), as this number is approximately that considered by suppression forces to constitute an escaped fire. We used the crown fire model of Scott and Reinhardt [81], as the input landscape data from LANDFIRE is calibrated for use with this crown fire model. The suppression factor, or alpha in the single-parameter Equation (1), in the calibration run was set at 2.0 based on previous work showing that this setting generally produces a fire size distribution similar to that of historical fires in the western U.S. (It has been observed in the empirical record of daily containment percentage from Incident Status Summary reports (Incident Command System ICS-209 forms) that alpha varies regionally, perhaps based on resistance to control [82].) Equation (1) describes the Fraction Contained (FC), which follows a sigmoidal function [82]:
FC = ( 2 x 1 + x 2 ) a
where x is the fraction of fire days and a is the regression coefficient.
In initial test runs, modeled fire sizes were much larger than those in the observed record, so the rate-of-spread was iteratively reduced to bring the mean and median fire size within range of observed values for the period 1992–2013 [80]. In the end, rates of spread in grass, grass-shrub and shrub fuel models were set at 0.4 of the value predicted by the Rothermel spread equation, while rates of spread in timber understory and timber litter fuel models were set at 0.6 [83]. As the outputs of the Rothermel spread equation are widely considered to be accurate within a factor or two or three [40,84,85], these reductions are well within accepted bounds. Fire sizes may also be adjusted via the alpha parameter described above, which changes the rate at which fires are contained and thus the fire size distribution. In this case, we elected to adjust the rate of spread instead, due to well-documented uncertainty in the spread equation. The number of ignitions in the model can be increased or reduced via a parameter (the “acrefract”) that proportionally adjusts the number of ignitions to account for factors such as: (1) the size of the simulation area does not match the area from which the fire records are drawn; (2) the occurrence of modeled fires that are too small to count as large fires because their area has been reduced by fireline construction (as discussed regarding perimeter trimming above) or due to factors including mild weather or fuel types with slow rate of spread; or (3) the fact that large fires cannot ignite below 80th percentile ERC in the model (In our study area, 28% of the area burned was by large fires that started below 80th percentile ERC. However, large fire growth does not typically occur below 80th percentile ERC [75]. Thus, adjusting the acrefract in effect causes the “missing” large fires that would have ignited below the 80th percentile ERC to start once the ERC is at the 80th percentile or above; the outcome should be similar in terms of model outputs and affects a minority of the large fires modeled.). As a final measure once fire sizes had been calibrated using a rate-of-spread adjustment, we iteratively changed the acrefract until the annual number of large fires was near the observed value.
In addition, we compared the mean historical and modeled burn probabilities as a metric indicating whether the run was sufficiently calibrated (results are reported in Table 1). The observed burn probability for the period 1992–2013 was calculated based on observed fires that ignited in the Sierra National Forest, as recorded in the Fire Program Analysis Fire Occurrence Database (FPA FOD) [80]. The mean modeled burn probability was calculated by averaging the burn probability of each pixel in the Sierra National Forest.

2.3.2. Scenario 2: Full Suppression of Human-Caused Fires, No Suppression of Lightning-Caused Fires

This scenario consists of two separate FSim runs, of which the outputs are additive. Using the fire cause code in the Fire Occurrence Database [80], we separated fires into two classes: lightning-caused (cause code = 1) and human-caused (all other cause codes).
In order to simulate lightning-caused fires, we performed a logistic regression using the ERC on days when at least one lightning fire of any size ignited. This yielded the probability of a lightning ignition as a function of ERC. Here, we included fires of all sizes (not just large fires) since any of these fires may have the opportunity to grow large in the absence of suppression. We created an ignition density grid for lightning ignitions, which had a spatial pattern indicating ignitions increased with elevation, using kernel density of lightning ignitions within a 50-km radius assigned to a grid of resolution 180 × 180 m. The perimeter trimming and suppression modules were turned off, so that fires were extinguished only by weather. We chose to set the number of consecutive days below the 80th percentile ERC that will result in fire extinguishment at five days based on expert opinion [86]. Acrefract was set at 1, which resulted in an average of 60.1 ignitions per modeled year (this is about half as many ignitions as in the observed record, due to the fact that FSim does not allow fires to ignite at ERCs below the 80th percentile, since they are unlikely to grow large under those weather conditions). All other settings from the calibrated run for Scenario 1 were retained. This run thus yielded expected annual burn probabilities and fire perimeters from lightning ignitions alone.
To simulate the other component of Scenario 2, human-caused large fires, we built the logistic regression based on the ERC on days when a human-caused fire that grew to be over 100 ha ignited. This restricted the population of fires simulated to human-caused large fires. Accordingly, we created an ignition density grid based on only human-caused large fires, which were more common near areas of population which roughly coincided with lower elevations (again, a kernel density function was performed using a 50-km radius). We kept other settings and inputs from Scenario 1, including the acrefract. The results of this run indicate annual burn probabilities and perimeters for human-caused large fires only.
When added, the burn probability grids from these two runs indicate the annual burn probability under a strategy where human-caused large fires are suppressed in a similar fashion to those in the recent historical period but lightning ignitions are not suppressed. Similarly, the two sets of fire ignitions and fire perimeters yielded by these runs were combined to form a full set of fire ignitions and perimeters under this strategy. Because the weather streams were necessarily different across the two runs, we classified the simulation years in each of the two runs into four quartiles based on total area burned, as a proxy for whether the year was an active or slow fire season. Within the quartiles, years were randomly matched (for example, Simulation Year 3 for the human-caused large fires was in the 4th quantile for area burned and was randomly matched to simulation year 1005 of the lightning-caused fires, which was also in the 4th quantile for area burned).

2.4. Post-Processing of FSim Outputs

The FSim model has a static landscape and, as such, does not limit the number of times in a year that a pixel can burn. When the suppression module is activated, the amount of overlap (hereafter called “overburn”) is generally negligible. For example, for the Scenario 1 run in this study, the amount was 1.5%, while in the human-caused large fire run, the amount of overburn was 1.2% of the total. However, when suppression is turned off and fires grow larger, the amount of overburn increases. This effect was further augmented in the Scenario 2 run, in which we parameterized the daily probability of lightning ignitions of all sizes, which resulted in more and larger fires on the landscape than in a typical run where suppression is activated. For Scenario 2, the amount of overburn was 46.1% of the total area burned. Therefore, we decided to remove the areas of overburn from the results, as it would be rare, if not unheard of, for an area to burn twice in the same year in this particular ecosystem.
To remove overburn, we selected all fire perimeters from a given model year and identified where they overlapped. Then, we examined the date that each fire started. The fire that started first was assumed to have burned the area, and the area of overlap was deleted from subsequent fires that started in that model year. The analysis was automated via a Python script that output a new set of perimeters with overburn deleted. However, this new set of perimeters cannot account for the fact that some fire perimeters had unburned areas remaining within them; these islands cannot be identified since the perimeters demarcate only the outer outline of the area burned. However, we were able to capture some of the unburned islands via the fuel model layer, which contains non-burnable pixels. In order to remain consistent across the two runs, we deleted overburn from both Scenarios 1 and 2. We used the resulting fire perimeters to generate a new burn probability raster. Where fuels were non-burnable, we stamped a burn probability value of 0 onto the recreated burn probability raster, since non-burnable pixels by definition cannot burn. The results presented here are based on the resulting perimeters and the burn probability raster with overburn deleted.
We posit that due to long computational times for the removal of overburn, this endeavor is likely worthwhile only in cases where suppression is not activated and the area of overburn is large. In addition, in some productive ecosystems such as in the southern U.S., burning twice within one year may be possible. We elected to remove overburn here since it would be expected to occur only in very rare circumstances in this ecosystem.

2.5. Analysis

2.5.1. Number of Large Fires, Fire Sizes and Burn Probability

We analyzed the FPA FOD [80] in order to calculate the mean annual number of observed fires in the FOA. We subset fires into lightning versus human-caused by using the cause code (“STAT_CAUSE” field) where lightning fires are STAT_CAUSE = 1 and human-caused fires are all other cause codes. We also calculated the average annual area burned by all fires, all lightning fires and all human-caused fires. In addition, we calculated the mean annual number of large fires (>100 ha), as well as subsetting these into large lightning fires and large human-caused fires.
We counted the number of large fires (>100 ha) in the model runs and compared it to the number in the observed record. Observed burn probability for the Sierra National Forest was calculated based on fires igniting within the national forest between 1992 and 2013 [80], while burn probability in the model runs is the mean for pixels inside the national forest boundary.
We plotted the fire size distributions of observed fires, modeled large fires under full suppression (the results of Scenario 1), human-caused large fires under full suppression (a component of Scenario 2) and all lightning fires with no suppression (the other component of Scenario 2). We calculated the slopes in log10-log10 space using Kendall’s tau regression as this method is less sensitive to outliers [64]. We used a bin size of 404.7 ha (1000 acres). The smallest bin in a frequency-magnitude distribution is overpopulated because data spanning several orders of magnitude are compressed into this bin, while the largest bins are underpopulated due to the rarity of the largest events, causing the distribution to curve slightly [64,87]. Therefore, we fitted the regression lines to fires of sizes 404.7–8093.7 ha (1000–20,000 acres) for modeled fires and 404.7–3237.5 ha (1000–8000 acres) for observed fires. A similar slope coefficient indicates similarity in the proportions of fires in each size class, regardless of the intercept (which is sensitive to the total number of fires; that number is higher in the modeled runs, which operate over 10,000 modeled years, while the observed record extends for only 22 years). As FSim was designed to primarily simulate large fires, we used parameters from observed fires in order to estimate how many small fires were missing from FSim’s output. As mentioned before, these fires do not contribute meaningfully to area burned; thus, they are not simulated in FSim, but we wanted to include them in the fire size distributions for completeness. In order to estimate the number of small fires that did not ignite in FSim and would thus be missing from the fire size distribution, we assumed that the total annual number of ignitions would be the same in the modeled scenarios as in the observed record. Thus, we can infer the number of missing small fires and add these to the smallest bin in our fire size distributions. In addition, from this methodology, we were able to estimate the percent of ignitions that grow large in both the observed record and model results (Table 2).

2.5.2. Feedback Analysis

We examined two types of feedbacks in area burned, which we call Type 1 and Type 2. Under Type 1 feedbacks, we counted how often a fire attempted to ignite in an area not receptive to burning due to having burned within the previous 5–10 years, and calculated the avoided area burned. Due to uncertainty in how long a recently-burned area would limit fire ignition, we calculated encounter rates under two scenarios: previously-burned areas limit fire ignition for a period (1) of five years, and (2) for ten years. In order to calculate Type 1 feedbacks for the five-year time period, we randomly sampled without replacement six years from the 10,000 simulated years of modeled fires (one of these years is considered to be the current fire year, while the other years constitute the previous five years of fires). We selected years randomly since model years are not implied to be consecutive in FSim. We completed 10,000 random draws of six years for Scenario 1, and also for Scenario 2. We overlaid the large fire ignitions from random Year 6 over the large fire perimeters from Years 1, 2, 3, 4 and 5. If an ignition fell inside a perimeter from the previous five (or ten) years, we assumed the fire could not have ignited. This assumption is based on work by Parks et al. [88], who found that wildland fire limits the occurrence of subsequent fires in four study areas in the U.S. West, with the amount of time varying by ecosystem from nine to over 20 years. Our choice of five and ten years is thus probably conservative. If we found at least one instance where a fire would not have ignited because the ignition fell on a recently-burned area, we reported this case as a positive outcome under Type 1 feedbacks. In addition, we summed the area of fires that would not have ignited under this rule. Then, we calculated the percentage of total area burned that would be avoided under the Type 1 rule (ignitions cannot grow when they fall atop recently-burned areas). We repeated the process above for Scenarios 1 and 2 with a 10-year limitation. We report Type 1 feedback rates and avoided area burned for Scenarios 1 and 2 as a first step in examining temporal feedbacks resulting from alternative fire suppression strategies.
Under Type 2 feedbacks, we assumed that an area would only be able to carry a spreading fire once within a five-year period. We first removed fires that would not have ignited under the Type 1 rules. We then deleted any part of a fire that overlapped with an area that burned during the previous five years. This is equivalent to assuming that an area cannot reburn within a five-year period due to limitations in fuels. We based this assumption on a study by Parks et al. [89], who found that recently-burned areas limited the spread of future fires for 6–18 years after fire in four wilderness areas in the U.S. West. We repeated the Type 2 analysis assuming that the limitation in fire spread lasted for a ten-year period instead. Again, our assumption that the effect persists for five to ten years may be conservative. The Type 2 feedback rate refers to the percent of random draws in which there was at least one instance in which a fire overlapped an area burned during the previous five or ten years. We also calculated the acreage reduction based on the deleted polygons in areas that could not reburn under Type 2 rules, as well as the percentage of total area burned that would be avoided.
For this feedback analysis, we used the Sierra National Forest as the study area of interest. We considered only large fires in our analysis. The large fire perimeters were clipped to the boundary of the Sierra National Forest, so all calculations of area burned and avoided area were confined to the National Forest.
This method is a first approximation that explores how feedbacks vary with two effective durations for effects of past fires (five and ten years). Future modeling efforts could apply similar methods but vary the effective duration with spatial variables related to, for instance, elevation and aspect. In addition, since the landscape file in FSim is static, it does not account for how a spreading fire would interact temporally with a recently-burned area, which could affect the final fire extent. We elected not to delete orphaned fire perimeters after clipping burned areas as this would have increased computational time considerably; we investigated a subset of the clipped perimeters and did not find any instances where this occurred, so we concluded that it was a relatively rare incidence.

3. Results

We present results regarding the observed fire record of the study area and of two alternative fire suppression strategies from nearly opposite ends of the fire management continuum. These two strategies have different implications for the daily probability of a large fire ignition, the commensurate number of large fires modeled, the fire size distribution and burn probabilities. In addition, the prevalence of feedbacks self-limiting future fire growth is markedly different between the two scenarios.

3.1. Number of Large Fires, Fire Sizes and Burn Probability

In the observed record of fires occurring in the study area between 1992 and 2013, the vast majority of area was burned by large fires (>100 ha). In the FOA, fires larger than 100 ha burned 93% of the total area burned [80]. Large lightning fires burned 96% of the area attributed to lightning fires, while large human-caused fires burned 91% of the area attributed to human-caused fires. Thus, FSim, which is focused on simulating fires during conditions when fires grow large, captures the vast majority of total area burned, regardless of fire cause. Annual acreage totals indicate that on average, about 12,500 ha burns in the FOA, of which about 66% is from human-caused fires (Table 1) [80]. Thus, the fire regime is currently dominated by human-caused fires.
The probability of a fire ignition increases with ERC, as higher ERCs indicate drier fuels. In the observed record, ignition of a lightning fire was more likely for a given ERC than ignition of a large fire, which was more likely than ignition of a large human-caused fire (Figure 3).
Once a fire ignites in FSim, it grows based on weather (ERC, wind speed and wind direction) subject to the suppression rules. An average of 8.4 large fires per year occurred in Scenario 1, which was close to the observed number of large fires (9.1) due to calibration efforts (Table 1). However, note that the number of large fires in FSim is controlled by the probability of ignition (which is based on daily ERC), as well as the opportunity for an ignition to grow large (based jointly on weather, landscape patterns of fuels and fire suppression). Thus, the number of large fires is not predetermined by the user, but is an outcome of other settings, including those chosen for fire suppression during calibration. We applied all settings from the calibrated run (Scenario 1) to the human-caused large-fire full-suppression run (except for ignition probability, which was in the latter case based on human-caused ignitions alone rather than ignitions from all causes as in the calibration run); this resulted in a number of large fires in the human-caused fires model run that was similar to, but slightly higher than in the observed record (6.1 versus 5.1). Lightning ignitions were more likely to grow large in FSim due to the suppression module being switched off, and an average of 38.6 large fires per year occurred. The number of large fires is thus a product of both the probability of ignition and the suppression rules.
In the observed record, 1.6% of ignitions grew to be large. This corresponds closely to initial attack success rates (meaning the proportion of fires that did not grow large) reported by the U.S. Forest Service nationally [79]. Of human-caused fires in the observed record, 1.2% grew to be large, while more than double that number, or 3.3%, of lightning fires grew to be large (Table 2). The greater proportion of large lightning fires may reflect the fact that they tended in this study area to be more remote (and thus more difficult to suppress), or may reflect a tendency to use less-than-full suppression of some lightning fires. We derived estimates of these proportions for the modeled fires, as well, and found large-fire rates for Scenario 1 (1.5%), and the human-caused ignitions (1.4%) were similar to the proportion in the observed record. However, for the lightning-caused fires (a run in which suppression was turned off), 27.4% of fires grew to be large. If we define very large fires as those greater than 2023.4 hectares (5000 acres), only 0.2% of fires in Scenario 1 grew to be very large, while 14% of fires in Scenario 2 met this criterion. Median fire sizes in the no-suppression lightning fire run were about 5.5 times larger than runs where suppression was activated (Table 1).
The size distributions of observed fires follow a power law (Figure 4) [90]. Similarly, fire sizes in FSim follow a power law distribution [64], probably due to power law distributions in the topographic and weather parameters that determine opportunities for fire growth (for example, long periods of hot, dry and windy weather are rare, but short periods are much more common). One defining parameter of a fire size distribution is its slope. The slope of the observed fires (slope = −1.59), modeled large fires under full suppression (Scenario 1, slope = −1.75) and modeled human-caused fires under full suppression (slope = −1.77) are quite similar in the range where the bins are well populated. The slope of the lightning fires, a run in which suppression was turned off, is flatter (slope = −1.04), meaning that more fires were classified into the larger size bins; an expected result since fire growth was not stymied by suppression in this run.
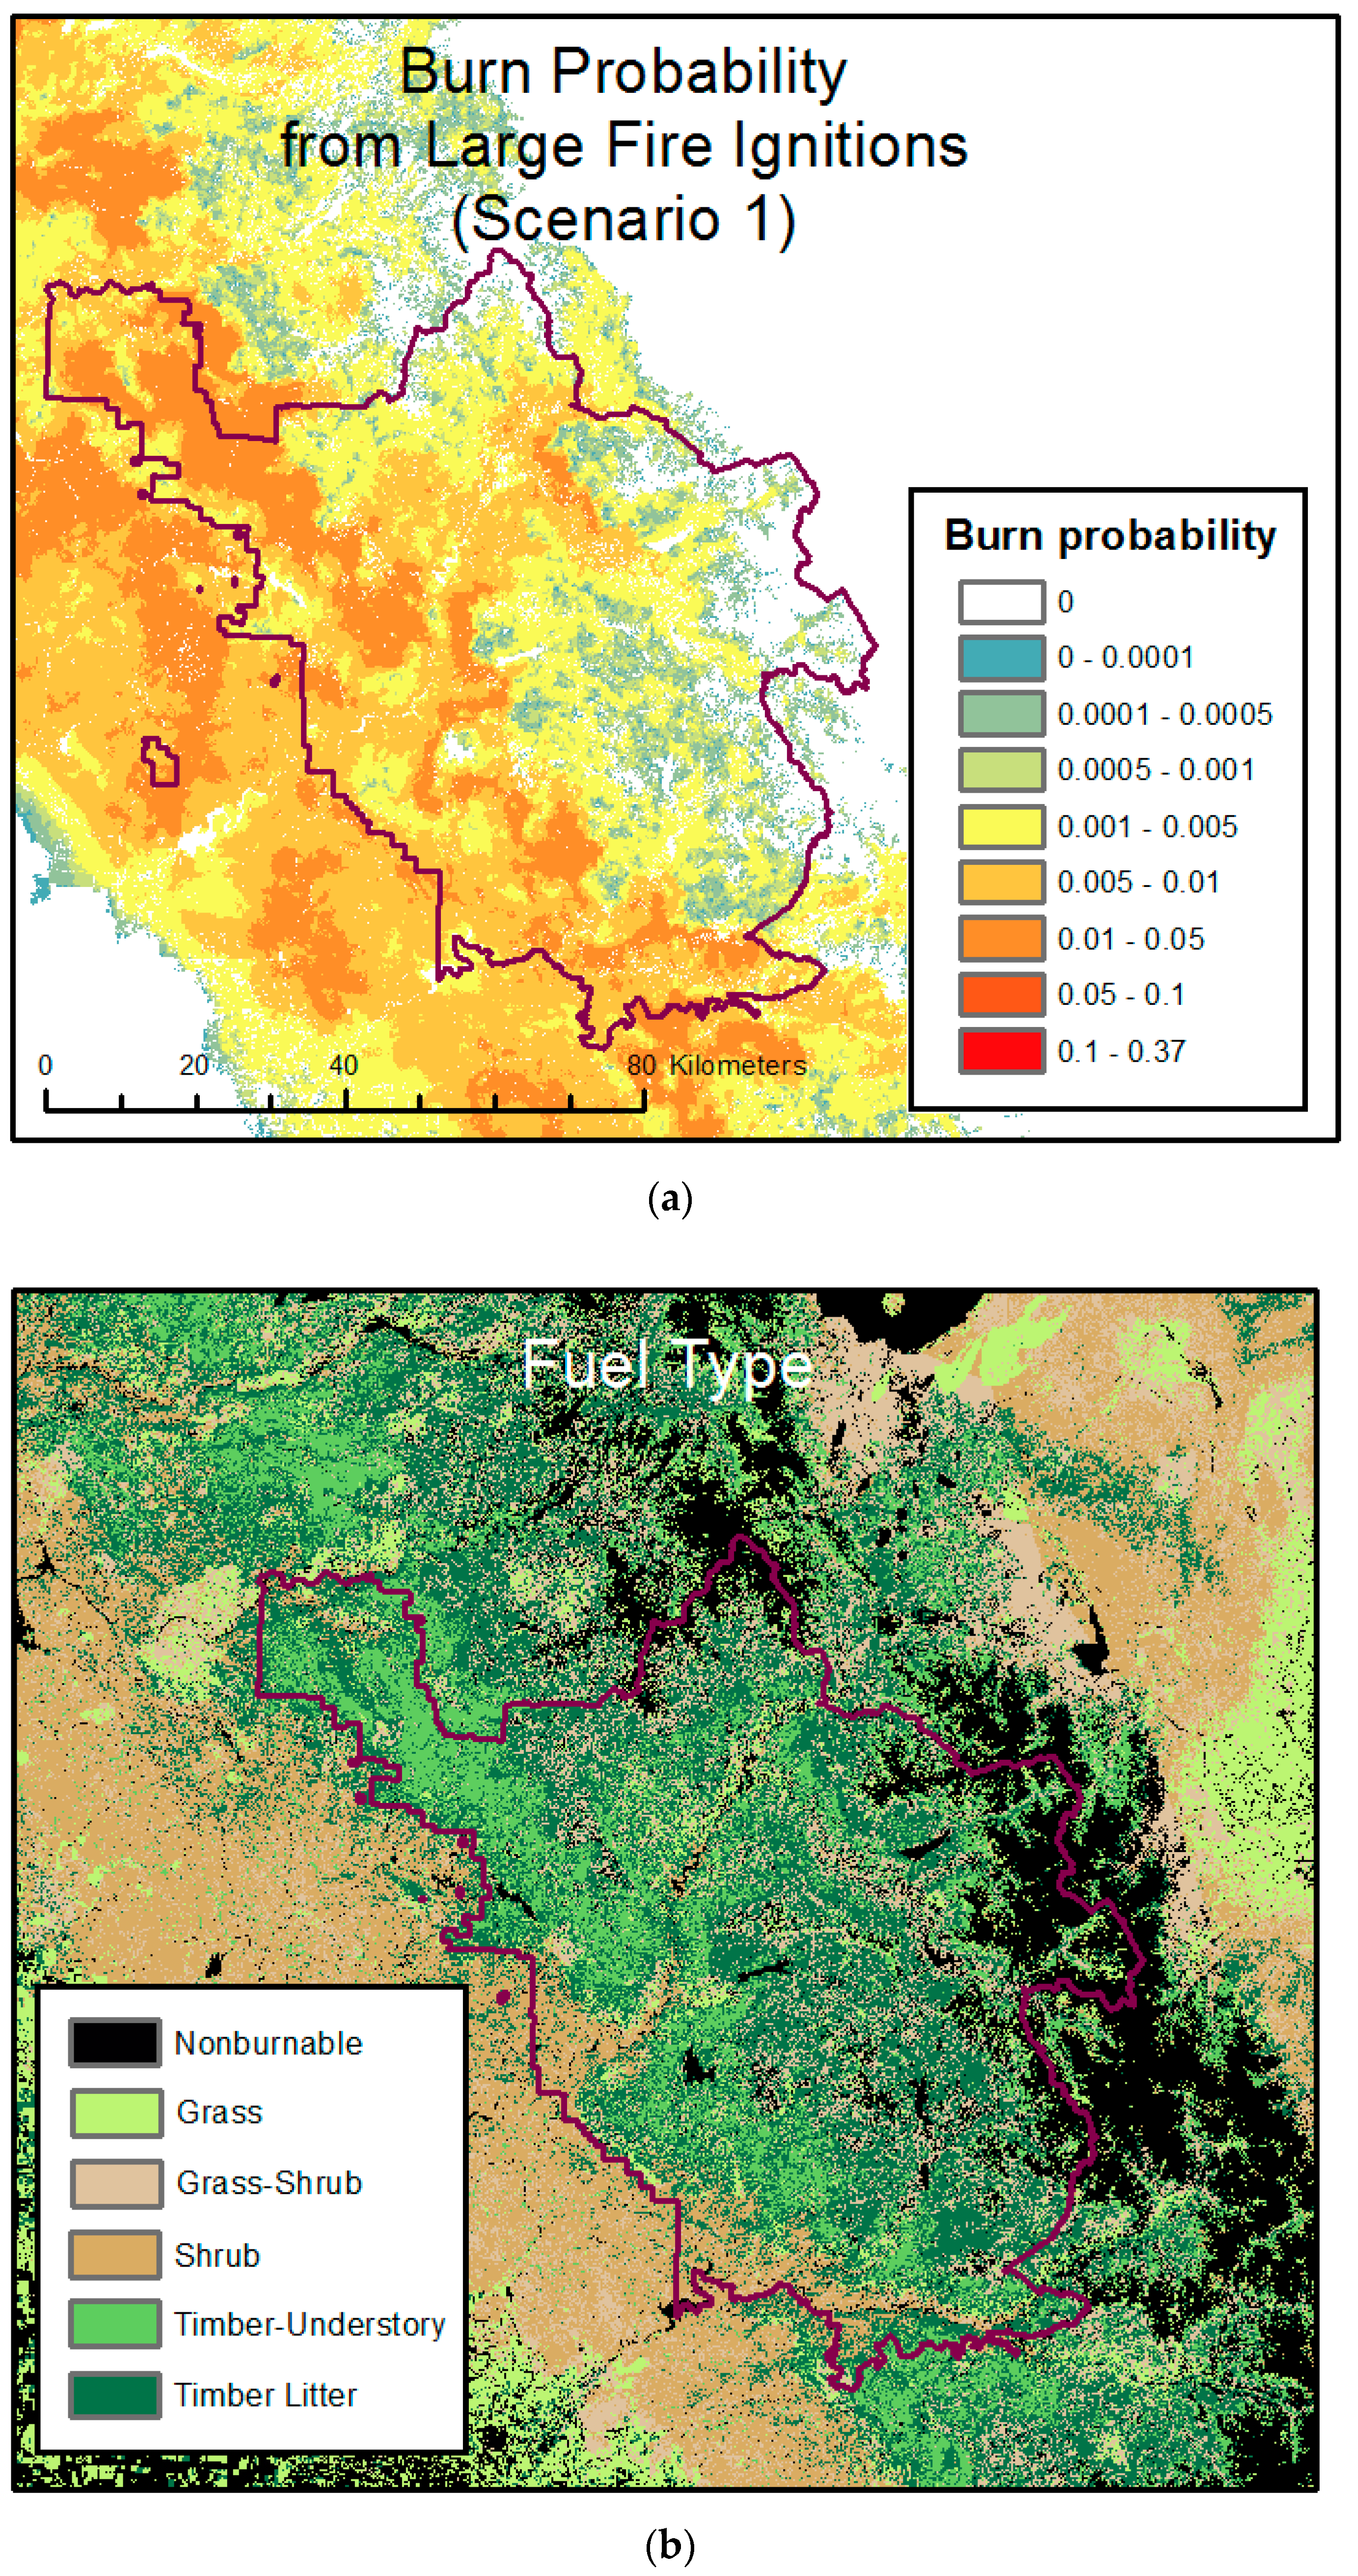
The mean annual burn probability (the average odds of a pixel burning) for the Sierra National Forest was 0.0048 in the business-as-usual scenario (Scenario 1), close to the observed burn probability of 0.0053 (Table 1). Burn probabilities were higher along the southwest portion of the study area and lower in the eastern portion of the study area (Figure 5a). This pattern was likely driven primarily by fuel type, with the shrub and timber-understory fuel types in the southwest portion of the study area generally having higher rates of spread and thus contributing to more rapid fire growth than the primarily timber litter fuel types in the eastern portion of the study area (Figure 5b). In the eastern part of the study area, fire spread was also checked by non-burnable areas where rocky sites occur in the Sierra Nevada Mountains.
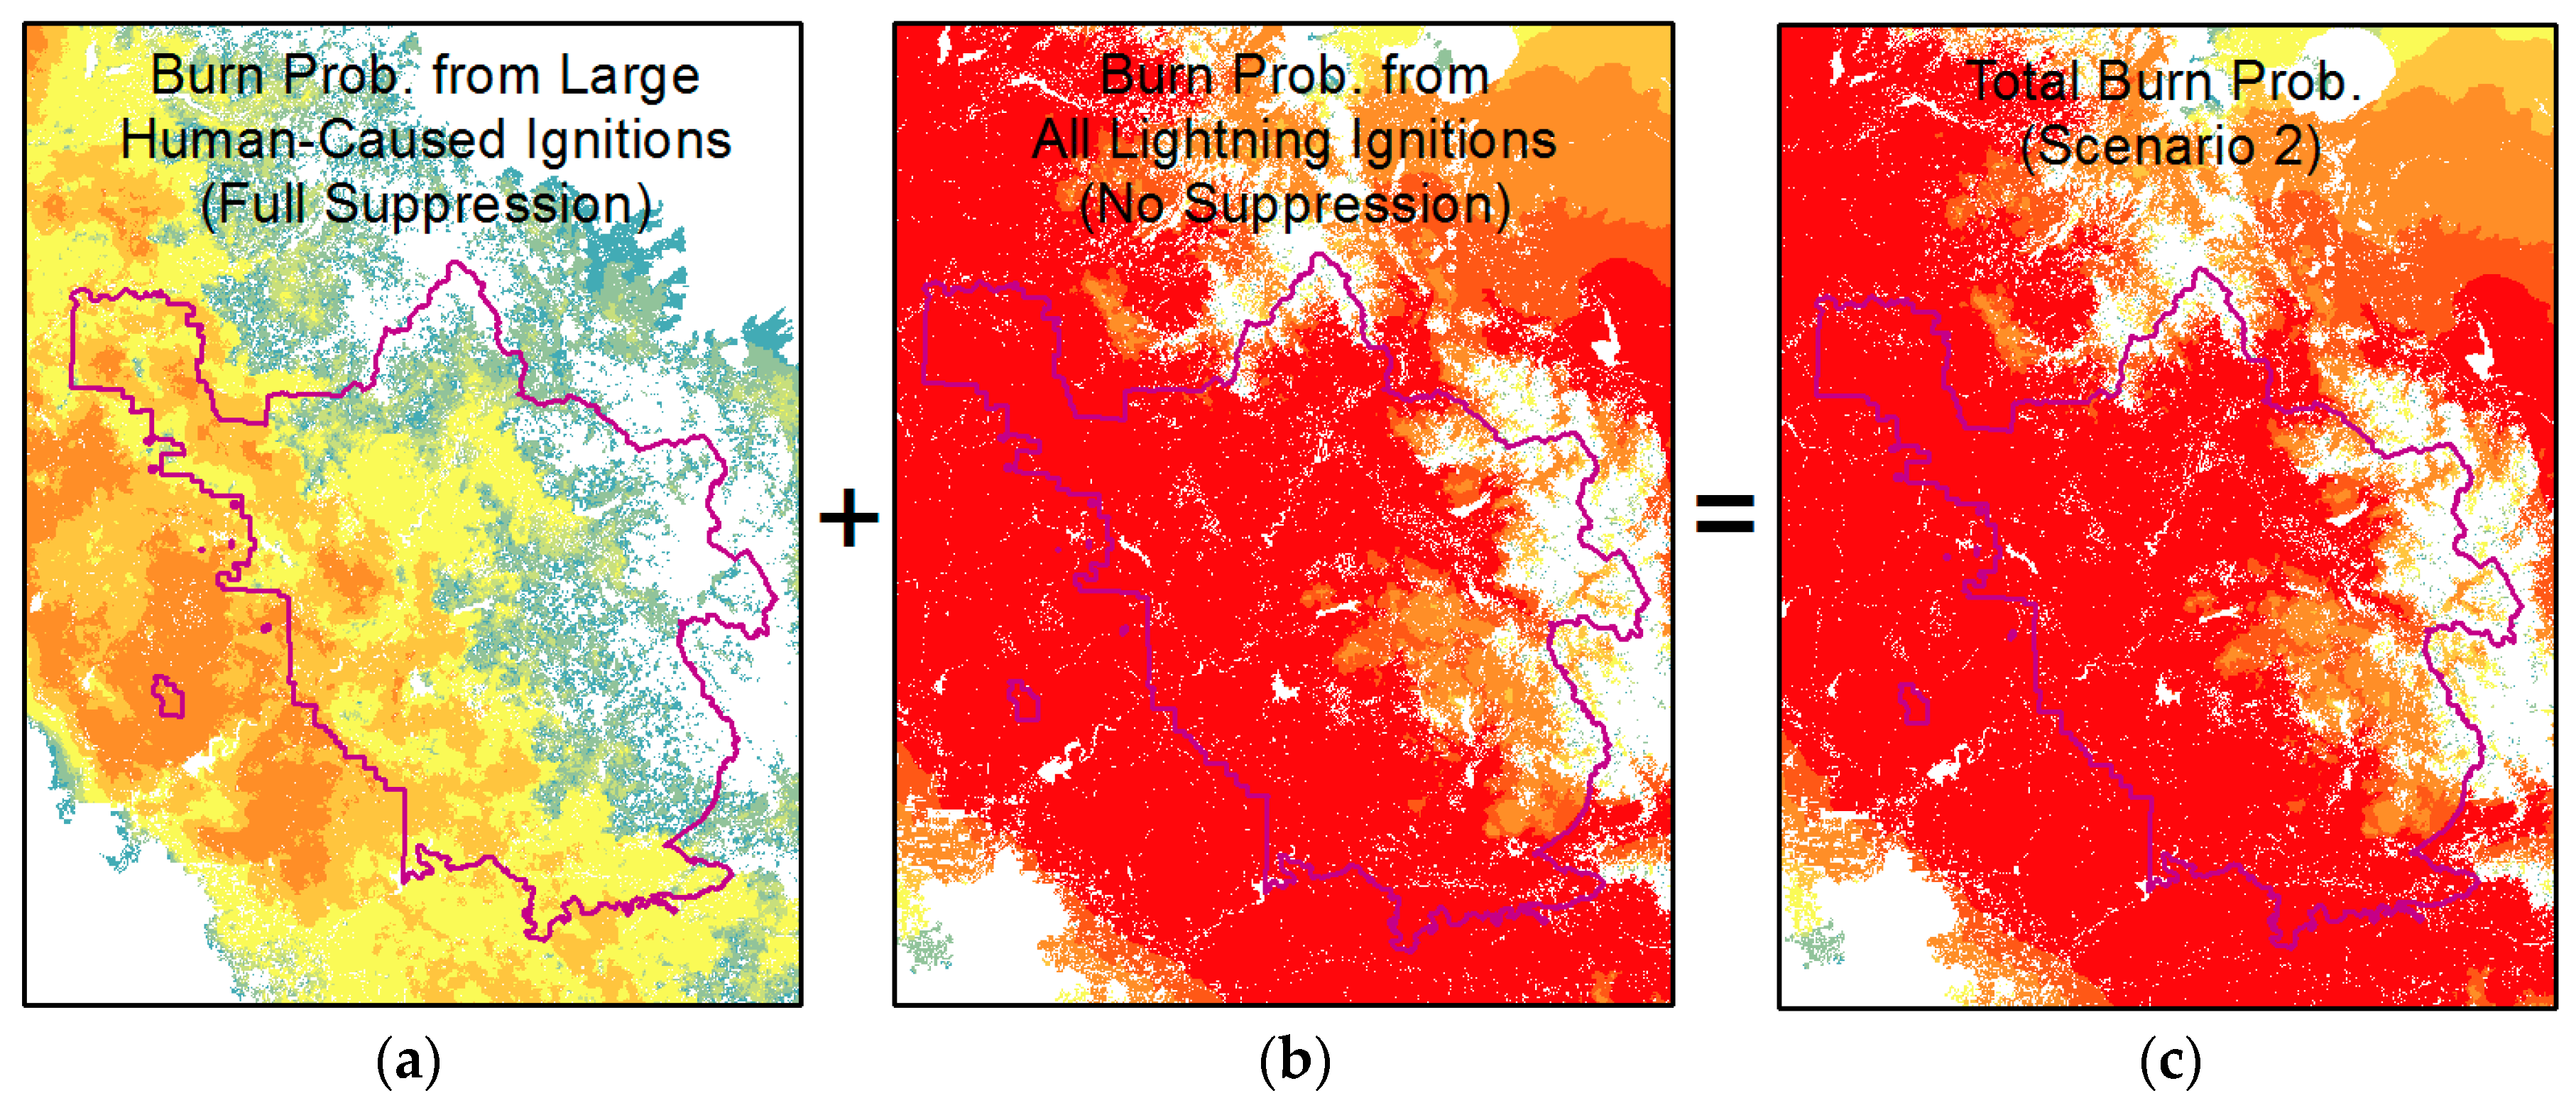
The pattern of burn probability was similar to that in Scenario 1 for the human-caused large fire run (a component of Scenario 2), since most large fires in the study area are human-caused (Figure 6a). However, the mean burn probability from this run was 0.0026, lower than Scenario 1 by almost half, as it did not include lightning ignitions (Table 2). The burn probability from all lightning ignitions (the other component of Scenario 2) was much higher than either of the two other runs, at 0.1741, due to the fact that lightning ignitions of all sizes were used to derive the daily probability of ignition and no ignitions were suppressed, resulting in approximately four times more large fires than in Scenario 1 and mean fire sizes that were approximately twelve times larger (Table 1). The human-caused and lightning-caused components were added to derive the total burn probability of 0.1751 under Scenario 2, about 36 times higher than in Scenario 1 (Table 1).

3.2. Feedback Analysis

Feedback rates (a term used here to describe the chance a fire will be limited by feedbacks due to recently-burned areas) give an indication of how temporal feedbacks in fire suppression strategies could affect area burned over time (Figure 7). We found that for Scenario 1, within a five-year period, in 7% of cases, at least one ignition would have fallen in an area that was non-burnable due to having been burned during the previous five years (which we classified as a Type 1 feedback), resulting in a mean reduction of 89 ha or 3% of burned area (Table 3). For Scenario 2, the Type 1 encounter rate was 91%, indicating that the increased burned area can be expected to form barriers to future fire ignition and spread in nine out of ten random five-year periods, producing a mean reduction of 67,163 ha or 64% of burned area. The effect of Type 2 feedbacks (under which we assumed an area could carry a spreading fire only once within five years, as well as that Type 1 feedbacks are also in play) was also powerful. Type 2 feedbacks occurred in 27% of five-year periods under Scenario 1 and in 94% of random draws for Scenario 2. Commensurately, average reductions in burned area were larger: 148 ha (5%) for Scenario 1 and 100,476 ha (81%) for Scenario 2.
If the duration over which an area is considered non-burnable is extended to ten years, the feedback effects strengthen in both frequency and magnitude. Type 1 feedbacks occurred in 12% of random ten-year draws for Scenario 1 and would produce an average acreage reduction of 174 ha or 7% of burned area (essentially twice the reduction expected if feedbacks last half as long). If Type 2 feedbacks are also in play, approximately 37% of cases would be affected, with a mean acreage reduction of 289 ha or 10% of burned area. These figures are again approximately double those for the five-year period. For Scenario 2, 94% of random ten-year draws had a Type 1 feedback, producing a mean acreage reduction of 83,540 ha or 78% of burned area. When Type 2 feedbacks are also included, 95% of cases were affected for a mean acreage reduction of 117,185 ha or 95% of burned area. Acreage reductions for Scenario 2 for an effective duration of ten years are less than double those of the five-year period, as the landscape is becoming saturated by burning at higher rates and the acreage reductions are slowing as they approach 100%.
Therefore, while burn probabilities might increase dramatically over the short term under Scenario 2, feedbacks can be expected to cause marked self-limitation in burned area and constrain burn probabilities and potential for large fires within a short timeframe.

4. Discussion

The primary contributions of this paper are to introduce and illustrate a proof-of-concept modeling approach for approximating alternative fire suppression strategies and to examine the extent to which feedbacks might produce self-limitation in burned area under different strategies. Relative to approaches that attempt to model the productivity or effectiveness of suppression actions directly, the proxy approach taken here has the advantage of being calibrated against observed fires, and we believe it is less subject to errors and assumptions resulting from knowledge gaps relating to the effectiveness of suppression actions. These knowledge gaps are particularly prominent for management of the larger, more complex, longer-duration fires common in the western U.S., where a broader mix of suppression strategies can be deployed and where substantial uncertainties remain. It is our hope that this modeling approach helps bridge gaps in knowledge and understanding of the consequences of changing fire management response.
The value of such a modeling approach also stems from helping address the growing biophysical need in the western U.S. and other locations for more fire on the landscape in order to reduce hazard and restore forest condition [16,18]. Prior to European settlement, both Native American and lightning fires contributed to frequent fires in this region [91]. Recent fire return intervals are well below historical values in this part of the Sierra Nevada as a result of fire suppression, including removal of Native American burning [91,92]. Forest structure has been affected by decades of fire suppression and selective harvest of large trees, resulting in higher tree densities and ladder fuels [91]. Hence, the current proportion of high severity fire as a result of wildfires may be higher than in the past [8]. However, some previous work indicates that fires managed for resource benefit in the Sierra Nevada are of lower severity than fires where full suppression is utilized and that fire severity patterns on resource benefit fires are within the natural range of variation [93]. Indeed, moderate rather than low severity fire may be needed to restore stand structure, with patches of high-severity fire needed to restore landscape heterogeneity [94,95]. In addition, strategically-placed fuel treatments have the potential to reduce risk to highly valued resources from future fires and could facilitate the return of fire on this landscape [96]. Whether fire managers are interested in utilizing alternative suppression approaches in pursuit of ecological goals, enhanced fire responder safety, exploring temporal feedbacks, or other concerns, we believe the general approach presented here could have broad global applicability. Certainly, the modeling approach could be tested and applied anywhere for which input data (landscape, weather, and fire occurrence) are available.
The foundation of our approach is to start with calibrated, peer-reviewed fire simulation models and couple their use with scenario analysis. We chose two simplified scenarios to evaluate here, as a starting point for examining the effect of fire suppression of the number and size of fires, burn probability and resulting encounter rates. A number of more nuanced response strategies can be investigated using this model output, including decisions about whether to suppress a fire based on factors such as its location, time of season or current weather. The results of these two fire management scenarios, chosen from nearly opposite ends of the fire management continuum, demonstrate that fire suppression strategies can have a large impact on the number of large fires, fire sizes, burned area and burn probability. Choosing a no-suppression strategy produced predictions of large increases in the number of large fires, their median size and the commensurate burn probability, indicating that there is potential to employ managed fires in restoration in the Sierra Nevada, but more research is likely needed in order to analyze resulting fire severity patterns. Considerable uncertainty exists in simulating such counterfactual strategies since there are few if any completely unsuppressed fires with which to compare our outputs. Future work could make important contributions to beginning to understand some of this uncertainty by varying model parameters (such as the number of days below 80th percentile ERC required to extinguish a fire). By engaging in this type of scenario planning, current simulation models could provide land managers with a set of possible fire outcomes. As this work is very computationally intensive due to both processing time and post-processing endeavors, however, it is beyond the scope of this proof-of-concept manuscript. Despite large uncertainties in the Scenario 2 outputs, we are confident in the qualitative nature of the outputs that indicate many more large fires and much higher burn probabilities due to the absence of suppression than in Scenario 1.
However, we found feedback loops will affect these factors over time. While fire management strategies that limit suppression may produce markedly higher burn probabilities over the short term, the larger number and size of burned areas in this type of scenario would (depending on severity and subsequent vegetation dynamics) likely form barriers to the ignition and spread of future fires, in essence acting as fuel breaks. The results presented in Table 3 may tell the most compelling story: near-term feedbacks may dramatically reduce annual area burned, with corresponding changes in landscape conditions and demand for suppression response. The encounter rates between burned areas and subsequent ignitions reported here are a first approximation in demonstrating the temporal dimension of alternative fire suppression strategies using our modeling framework. Compared to a full-suppression scenario, feedbacks in burned area were expected to result in larger and substantial limitations of ignitions and area burned in the scenario where lightning fires were not suppressed. Therefore, while burn probabilities would be elevated in the short term, feedbacks would be likely to limit future fires somewhat, an effect documented also in observed fires [88,89]. Capturing the full set of temporal feedbacks resulting from alternative fire suppression strategies remains a challenge. For instance, models that update the landscape file to reflect burned area and vegetation succession would be a powerful way to examine temporal feedbacks in future work, but come with additional computational challenges and numerous inherent uncertainties [40,97].
The use of modeling scenarios such as those presented here can help inform land management decisions. Our results provide further support for the potential for wildland fires to act as a fuel treatment, in order to reduce the potential for ignition and spread of future fires, especially where the landscape may benefit from fire, or where a burned area may serve as a barrier to protect highly valued resources such as municipal watersheds [34,88,89]. While this work demonstrates the potential to leverage managed lightning fires as a restoration tool, many questions remain about where and when such fires would be likely to meet ecological goals in terms of acreage burned, fire severity and effect on highly valued resources. Because stand structure in the U.S. West has changed as a result of fire suppression and timber harvest, restoration of stands via prescribed burning perhaps accompanied by mechanical fuel treatment where feasible may be warranted [96]; however, recent observations indicate that fire alone may be sufficient to restore stands to a desirable structure over the long term, though this may require more than one fire [91,95,98]. Fire severity in the Sierra Nevada is strongly influenced by relative humidity and time since fire, among other factors, suggesting that choices about when and where to utilize managed lightning fires may depend on both weather and location [99]. Previous work has provided a framework to evaluate the potential benefit and loss from the next fire [29]; the work presented here begins to incorporate the temporal dimension of feedbacks in burned area, translating to an enhanced ability to balance tradeoffs between short- and longer-term risks.
The framework presented here has the flexibility to evaluate any number of alternative fire management scenarios, ranging from no fire suppression to attempting suppression of all fires and a rich array of possibilities in between. These strategies can be evaluated in terms of fire behavior metrics including burn probability and an event set of fire perimeters, setting the stage for evaluating socioeconomic and ecological impacts. Next steps include integrating fire model outputs with additional data and models to estimate consequences to the wildland-urban interface, forest resources, and suppression budgets. Planned modeling work also includes merging response strategies with landscape fuel treatment strategies [30,96] to explore whether expanding the footprint of fuel treatments expands opportunities for more managed fire.
Although the scenarios we explored are broadly representative of the fire management continuum, they should not be taken as indicative of actual management policies or strategies that would necessarily be pursued by local managers. Obviously, factors like the location and susceptibility of highly valued resources and assets on the landscape will dictate where and under what conditions fire managers would realistically opt to let lightning-caused fires burn without suppression. This points to an opportunity for extending the work demonstrated here by integrating scenarios with spatial risk analyses, management objectives, and planning documents. A richer modeling approach could for instance explore not only stopping rules but also starting rules based on factors like seasonality and location, approximating the “go/no-go” decisions around initial response to ignitions. Analyses that explore the growth potential of unsuppressed fires igniting within designated wilderness boundaries provide a useful starting point [100,101], which could be augmented with geographically-determined perimeter trimming factors and other modeling approaches.
The current fire management situation in the U.S. (in which decades of forest management, timber harvest and fire suppression have contributed to greater vertical and horizontal continuity of fuels [102], increases in fire danger are producing longer fire seasons [1,103], and an average of 16 firefighters perish in the line of duty annually [104]) has in fact been well-recognized by scientists and land managers for several decades. To use the words of former Secretary of the Interior Bruce Babbitt in 1997, the situation may seem like an “unforeseen and unintended nightmare” [105]. However, as Babbitt suggested 20 years ago, the solution may be to restore the process of wildfire in many parts of the West, using “flame [to shape] … the structure of the forest”. A number of challenges exist, however, in doing so, including mitigating risks to the wildland-urban interface and other highly-valued resources. We present here a modeling methodology that can be leveraged in future work to aid in the estimation of the risks, potential costs and benefits (in both an ecological and monetary sense) of alternative fire suppression strategies at the landscape level.

5. Conclusions

Here, we demonstrate a modeling approach that can be used for evaluating the effect of alternative fire suppression strategies on the number of large fires, fire size distributions and annual burn probabilities. Results indicate that suppression strategies can have a large effect on all these variables. Moving away from a strategy of full fire suppression may greatly increase fire occurrence over the short term. However, increasing fire on the landscape will have feedback effects that may be substantial, as fires from previous years are likely to act as fuelbreaks and limit future fire spread.
Despite limitations in knowledge regarding fire suppression that provide challenges in modeling alternative fire suppression strategies, we present a methodology that allows a stochastic fire simulation model to be calibrated to observed fires, providing a statistical means to model fire suppression. This method can be used to simulate any number of alternative fire suppression strategies. In addition, our methodology provides necessary inputs for evaluating the risks, costs and benefits of alternative strategies in future work.

Acknowledgments

This work was supported by a Joint Fire Sciences Program grant.

Author Contributions

K.L.R. and M.P.T. conceived of and designed the experiments. K.L.R. performed the experiments. K.L.R., J.H.S. and J.W.G.-D. analyzed the data. K.L.R. and M.P.T. wrote the paper.

Conflicts of Interest

The authors declare no conflict of interest.

References

  1. Abatzoglou, J.T.; Williams, A.P. Impact of anthropogenic climate change on wildfire across western U.S. forests. Proc. Natl. Acad. Sci. USA 2016. [Google Scholar] [CrossRef] [PubMed]
  2. Stephens, S.; Agee, J.K.; Fule, P.Z.; North, M.; Romme, W.; Swetnam, T.; Turner, M.G. Managing forests and fire in changing climates. Science 2013, 342, 41–42. [Google Scholar] [CrossRef] [PubMed]
  3. Riley, K.L.; Loehman, R.A. Mid-21st-century climate changes increase predicted fire occurrence and fire season length, Northern Rocky Mountains, United States. Ecosphere 2016, 7, e01543. [Google Scholar] [CrossRef]
  4. Paveglio, T.B.; Prato, T.; Hardy, M. Simulating effects of land use policies on extent of the wildland urban interface and wildfire risk in Flathead County, Montana. J. Environ. Manag. 2013, 130, 20–31. [Google Scholar] [CrossRef] [PubMed]
  5. Calkin, D.E.; Gebert, K.M.; Jones, J.G.; Neilson, R.P. Forest Service large fire area burned and suppression expenditure trends, 1970–2002. J. For. 2005, 103, 179–183. [Google Scholar]
  6. Calkin, D.E.; Cohen, J.D.; Finney, M.A.; Thompson, M.P. How risk management can prevent future wildfire disasters in the wildland-urban interface. Proc. Natl. Acad. Sci. USA 2014, 111, 746–751. [Google Scholar] [CrossRef] [PubMed]
  7. Chiono, L.A.; Fry, D.L.; Collins, B.M.; Chatfield, A.H.; Stephens, S.L. Landscape-scale fuel treatment and wildfire impacts on carbon stocks and fire hazard in California spotted owl habitat. Ecosphere 2017, 8, e01648. [Google Scholar] [CrossRef]
  8. Miller, J.D.; Safford, H.D. Corroborating evidence of a pre-Euro-American low- to moderate-severity fire regime in yellow pine-mixed conifer forests of the Sierra Nevada, California, USA. Fire Ecol. 2017, 13, 58–90. [Google Scholar] [CrossRef]
  9. Weaver, H. Fire as an ecological and silvicultural factor in the ponderosa-pine region of the pacific slope. J. For. 1943, 41, 7–15. [Google Scholar]
  10. Weaver, H. Fire—Nature’s thinning agent in ponderosa pine stands. J. For. 1947, 45, 437–444. [Google Scholar]
  11. Weaver, H. Fire as an enemy, friend, and tool in forest management. J. For. 1955, 53, 499–504. [Google Scholar]
  12. Arno, S.F.; Brown, J.K. Overcoming the paradox in managing wildland fire. West. Wildlands 1991, 17, 40–46. [Google Scholar]
  13. Calkin, D.E.; Thompson, M.P.; Finney, M.A. Negative consequences of positive feedbacks in U.S. wildfire management. For. Ecosyst. 2015, 2, 1–10. [Google Scholar] [CrossRef]
  14. Olson, R.L.; Bengston, D.N.; DeVaney, L.A.; Thompson, T.A. Wildland Fire Management Futures: Insights from a Foresight Panel; General Technical Report NRS-152; U.S. Department of Agriculture, Forest Service, Northern Research Station: Newtown Square, PA, USA, 2015.
  15. Smith, A.M.S.; Kolden, C.A.; Paveglio, T.B.; Cochrane, M.A.; Bowman, D.M.J.S.; Moritz, M.A.; Kliskey, A.D.; Alessa, L.; Hudak, A.T.; Hoffman, C.M.; et al. The science of firescapes: Achieving fire-resilient communities. BioScience 2016, 66, 130–146. [Google Scholar] [CrossRef]
  16. North, M.; Stephens, S.; Collins, B.; Agee, J.; Aplet, G.; Franklin, J.; Fulé, P. Reform forest fire management. Science 2015, 349, 1280–1281. [Google Scholar] [CrossRef] [PubMed]
  17. Moritz, M.A.; Batllori, E.; Bradstock, R.A.; Gill, A.M.; Handmer, J.; Hessburg, P.F.; Leonard, J.; McCaffrey, S.; Odion, D.C.; Schoennagel, T. Learning to coexist with wildfire. Nature 2014, 515, 58–66. [Google Scholar] [CrossRef] [PubMed]
  18. North, M.; Collins, B.M.; Stephens, S. Using fire to increase the scale, benefits, and future maintenance of fuels treatments. J. For. 2012, 110, 392–401. [Google Scholar] [CrossRef]
  19. Schweizer, D.W.; Cisneros, R. Forest fire policy: Change conventional thinking of smoke management to prioritize long-term air quality and public health. Air Qual. Atmos. Health 2016. [Google Scholar] [CrossRef]
  20. Vaillant, N.M.; Fites-Kaufman, J.; Reimer, A.L.; Noonan-Wright, E.K.; Dailey, S.N. Effect of fuel treatment and fuels and potential fire behavior in California, USA, National Forests. Fire Ecol. 2009, 5, 14–29. [Google Scholar] [CrossRef]
  21. Barnett, K.; Parks, S.A.; Miller, C.; Naughton, H.T. Beyond fuel treatment effectiveness: Characterizing interactions between fire and treatments in the U.S. Forests 2016, 7, 237. [Google Scholar] [CrossRef]
  22. North, M.; Brough, A.; Long, J.; Collins, B.; Bowden, P.; Yasuda, D.; Miller, J.; Sugihara, N. Constraints on mechanized treatment significantly limit mechanical fuels reduction extent in the Sierra Nevada. J. For. 2015, 113, 40–48. [Google Scholar] [CrossRef]
  23. Collins, B.M.; Stephens, S.L.; Moghaddas, J.J.; Battles, J. Challenges and Approaches in Planning Fuel Treatments across Fire-Excluded Forested Landscapes. J. For. 2010, 108, 24–31. [Google Scholar]
  24. Pyne, S.J. Between Two Fires: A Fire History of Contemporary America; University of Arizona Press: Tucson, AZ, USA, 2015. [Google Scholar]
  25. Ager, A.A.; Vaillant, N.M.; McMahan, A. Restoration of fire in managed forests: A model to prioritize landscapes and analyze tradeoffs. Ecosphere 2013, 4, 1–19. [Google Scholar] [CrossRef]
  26. Ager, A.A.; Day, M.A.; Finney, M.A.; Vance-Borland, K.; Vaillant, N.M. Analyzing the transmission of wildfire exposure on a fire-prone landscape in Oregon, USA. For. Ecol. Manag. 2014, 334, 377–390. [Google Scholar] [CrossRef]
  27. Ager, A.A.; Day, M.A.; Short, K.C.; Evers, C.R. Assessing the impacts of federal forest planning on wildfire risk mitigation in the Pacific Northwest, USA. Landsc. Urban Plan. 2016, 147, 1–17. [Google Scholar] [CrossRef]
  28. Haas, J.R.; Calkin, D.E.; Thompson, M.P. Wildfire risk transmission in the Colorado Front Range, USA. Risk Anal. 2015, 35, 226–240. [Google Scholar] [CrossRef] [PubMed]
  29. Scott, J.H.; Thompson, M.P.; Calkin, D.E. A Wildfire Risk Assessment Framework for Land and Resource Management; General Technical Report RMRS-GTR-315; U.S. Department of Agriculture, Forest Service, Rocky Mountain Research Station: Newtown Square, PA, USA, 2013.
  30. Scott, J.H.; Thompson, M.P.; Gilbertson-Day, J.W. Examining alternative fuel management strategies and the relative contribution of National Forest System land to wildfire risk to adjacent homes—A pilot assessment on the Sierra National Forest, California, USA. For. Ecol. Manag. 2016, 362, 29–37. [Google Scholar] [CrossRef]
  31. Thompson, M.P.; Scott, J.; Helmbrecht, D.; Calkin, D.E. Integrated wildfire risk assessment: Framework development and application on the Lewis and Clark National Forest in Montana, USA. Integr. Environ. Assess. Manag. 2013, 9, 329–342. [Google Scholar] [CrossRef] [PubMed]
  32. Thompson, M.P.; MacGregor, D.G.; Calkin, D.E. Risk Management: Core Principles and Practices, and Their Relevance to Wildland Fire; General Technical Report RMRS-GTR-350; U.S. Department of Agriculture, Forest Service, Rocky Mountain Research Station: Fort Collins, CO, USA, 2016.
  33. Meyer, M.D.; Roberts, S.L.; Wills, R.; Brooks, M.; Winford, E.M. Principles of effective USA federal fire management plans. Fire Ecol. 2015, 11, 59–83. [Google Scholar] [CrossRef]
  34. Thompson, M.P.; Bowden, P.; Brough, A.; Scott, J.H.; Gilbertson-Day, J.; Taylor, A.; Anderson, J.; Haas, J.R. Application of Wildfire Risk Assessment Results to Wildfire Response Planning in the Southern Sierra Nevada, California, USA. Forests 2016, 7, 64. [Google Scholar] [CrossRef]
  35. O’Connor, C.D.; Thompson, M.P.; Rodríguez y Silva, F. Getting Ahead of the Wildfire Problem: Quantifying and Mapping Management Challenges and Opportunities. GeoSciences 2016, 6, 35. [Google Scholar] [CrossRef]
  36. Rodríguez y Silva, F.; Martínez, J.R.M.; González-Cabán, A. A methodology for determining operational priorities for prevention and suppression of wildland fires. Int. J. Wildland Fire 2014, 23, 544–554. [Google Scholar] [CrossRef]
  37. Houtman, R.M.; Montgomery, C.A.; Gagnon, A.R.; Calkin, D.E.; Dietterich, T.G.; McGregor, S.; Crowley, M. Allowing a wildfire to burn: Estimating the effect on future fire suppression costs. Int. J. Wildland Fire 2013, 22, 871–882. [Google Scholar] [CrossRef]
  38. Duff, T.J.; Tolhurst, K.G. Operational wildfire suppression modelling: A review evaluating development, state of the art and future directions. Int. J. Wildland Fire 2015, 24, 735–748. [Google Scholar] [CrossRef]
  39. Gebert, K.M.; Calkin, D.E.; Yoder, J. Estimating suppression expenditures for individual large wildland fires. West. J. Appl. For. 2007, 22, 188–196. [Google Scholar]
  40. Riley, K.L.; Thompson, M.P. Uncertainty in modeling wildland fire. In Uncertainty in Natural Hazards: Modeling and Decision Support; Riley, K.L., Thompson, M.P., Webley, P.W., Eds.; Wiley and American Geophysical Union Books: New York City, NY, USA, 2017; pp. 193–213. [Google Scholar]
  41. National Cohesive Wildland Fire Management Strategy. Available online: https://www.forestsandrangelands.gov/strategy/thestrategy.shtml (accessed on 19 October 2017).
  42. Petrovic, N.; Carlson, J. A decision-making framework for wildfire suppression. Int. J. Wildland Fire 2012, 21, 927–937. [Google Scholar] [CrossRef]
  43. Brotons, L.; Aquilué, N.; de Cáceres, M.; Fortin, M.-J.; Fall, A. How Fire History, Fire Suppression Practices and Climate Change Affect Wildfire Regimes in Mediterranean Landscapes. PLoS ONE 2013, 8, e62392. [Google Scholar] [CrossRef] [PubMed] [Green Version]
  44. Calkin, D.E.; Venn, T.J.; Wibbenmeyer, M.; Thompson, M.P. Estimating U.S. federal wildland fire managers’ preferences toward competing strategic suppression objectives. Int. J. Wildland Fire 2013, 22, 212–222. [Google Scholar] [CrossRef]
  45. Calkin, D.E.; Stonesifer, C.S.; Thompson, M.P.; McHugh, C.W. Large airtanker use and outcomes in suppressing wildland fires in the United States. Int. J. Wildland Fire 2014, 23, 259–271. [Google Scholar] [CrossRef]
  46. Hand, M.S.; Wibbenmeyer, M.J.; Calkin, D.E.; Thompson, M.P. Risk preferences, probability weighting, and strategy tradeoffs in wildfire management. Risk Anal. 2015, 35, 1876–1891. [Google Scholar] [CrossRef] [PubMed]
  47. Hand, M.S.; Katuwal, H.; Calkin, D.E.; Thompson, M.P. The influence of incident management teams on the deployment of wildfire suppression resources. Int. J. Wildland Fire 2017, 26, 615–629. [Google Scholar] [CrossRef]
  48. Holmes, T.P.; Calkin, D.E. Econometric analysis of fire suppression production functions for large wildland fires. Int. J. Wildland Fire 2013, 22, 246–255. [Google Scholar] [CrossRef]
  49. Katuwal, H.; Calkin, D.E.; Hand, M.S. Production and efficiency of large wildland fire suppression effort: A stochastic frontier analysis. J. Environ. Manag. 2016, 166, 227–236. [Google Scholar] [CrossRef] [PubMed]
  50. Stonesifer, C.S.; Calkin, D.; Thompson, M.P.; Stockmann, K.D. Fighting fire in the heat of the day: An analysis of operational and environmental conditions of use for large airtankers in United States fire suppression. Int. J. Wildland Fire 2016, 25, 520–533. [Google Scholar] [CrossRef]
  51. Thompson, M.P.; Calkin, D.E.; Herynk, J.; McHugh, C.W.; Short, K.C. Airtankers and wildfire management in the U.S. Forest Service: Examining data availability and exploring usage and cost trends. Int. J. Wildland Fire 2013, 22, 223–233. [Google Scholar] [CrossRef]
  52. Thompson, M.P. Social, Institutional, and Psychological Factors Affecting Wildfire Incident Decision Making. Soc. Nat. Resour. 2014, 27, 636–644. [Google Scholar] [CrossRef]
  53. Thompson, M.P.; Freeborn, P.; Rieck, J.D.; Calkin, D.E.; Gilbertson-Day, J.W.; Cochrane, M.A.; Hand, M.S. Quantifying the influence of previously burned areas on suppression effectiveness and avoided exposure: A case study of the Las Conchas Fire. Int. J. Wildland Fire 2016, 25, 167–181. [Google Scholar] [CrossRef]
  54. Wibbenmeyer, M.J.; Hand, M.S.; Calkin, D.E.; Venn, T.J.; Thompson, M.P. Risk preferences in strategic wildfire decision making: A choice experiment with U.S. Risk Anal. 2013, 33, 1021–1037. [Google Scholar] [CrossRef] [PubMed]
  55. Wilson, R.S.; Winter, P.L.; Maguire, L.A.; Ascher, T. Managing wildfire events: Risk-Based decision making among a group of federal fire managers. Risk Anal. 2011, 31, 805–818. [Google Scholar] [CrossRef] [PubMed]
  56. Gebert, K.M.; Black, A.E. Effect of suppression strategies on federal wildland fire expenditures. J. For. 2012, 110, 65–73. [Google Scholar] [CrossRef]
  57. Martell, D.L.; Sun, H. The impact of fire suppression, vegetation, and weather on the area burned by lightning-caused forest fires in Ontario. Can. J. For. Res. 2008, 38, 1547–1563. [Google Scholar] [CrossRef]
  58. Thompson, M.P.; Silva, F.R.; Calkin, D.E.; Hand, M.S. A review of challenges to determining and demonstrating efficiency of large fire management. Int. J. Wildland Fire 2017, 26, 562–573. [Google Scholar] [CrossRef]
  59. Finney, M.A.; Grenfell, I.C.; McHugh, C.W. Modeling containment of large wildfires using generalized linear mixed-model analysis. For. Sci. 2009, 55, 249–255. [Google Scholar]
  60. LANDFIRE. Existing Vegetation Type Layer, LANDFIRE 1.1.0. U.S. Department of Agriculture, Forest Service and U.S. Department of the Interior, U.S. Geologic Survey. 2008. Available online: http://www.landfire.gov/NationalProductDescriptions21.php (accessed on 10 March 2015).
  61. LANDFIRE. Fire regime group layer, LANDFIRE 1.1.0. U.S. Department of Agriculture, Forest Service and U.S. Department of the Interior, U.S. Geologic Survey. 2008. Available online: http://www.landfire.gov/NationalProductDescriptions12.php (accessed on 10 June 2015).
  62. Monitoring Trends in Burn Severity. National Burned Area Boundaries Dataset. 2015. Available online: http://www.mtbs.gov/nationalregional/intro.html (accessed on 18 March 2016).
  63. Finney, M.A.; U.S. Forest Service: Missoula, MT, USA. Personal Communication, 2016.
  64. Finney, M.A.; McHugh, C.W.; Grenfell, I.C.; Riley, K.L.; Short, K.C. A simulation of probabilistic wildfire risk components for the continental United States. Stoch. Environ. Res. Risk Assess. 2011, 25, 973–1000. [Google Scholar] [CrossRef]
  65. Haas, J.R.; Calkin, D.E.; Thompson, M.P. A national approach for integrating wildfire simulation modeling into Wildland Urban Interface risk assessments within the United States. Landsc. Urban Plan. 2013, 119, 44–53. [Google Scholar] [CrossRef]
  66. Calkin, D.E.; Ager, A.A.; Thompson, M.P.; Finney, M.A.; Lee, D.C.; Quigley, T.M.; McHugh, C.W.; Riley, K.L.; Gilbertson-Day, J.M. A Comparative Risk Assessment Framework for Wildland Fire Management: The 2010 Cohesive Strategy Science Report; General Technical Report RMRS-GTR-262; USDA Forest Service, Rocky Mountain Research Station: Fort Collins, CO, USA, 2011.
  67. Andrews, P.L.; Loftsgaarden, D.O.; Bradshaw, L.S. Evaluation of fire danger rating indexes using logistic regression and percentile analysis. Int. J. Wildland Fire 2003, 12, 213–226. [Google Scholar] [CrossRef]
  68. Finney, M.A. Fire growth using minimum travel time methods. Can. J. For. Res. 2002, 32, 1420–1424. [Google Scholar] [CrossRef]
  69. Finney, M.A.; U.S. Forest Service: Missoula, MT, USA. Personal Communication, 2014.
  70. Grenfell, I.C.; Finney, M.A.; Jolly, W.M. Simulating spatial and temporally related fire weather. In Proceedings of the VI International Conference on Forest Fire Research, Coimbra, Portugal, 15–18 November 2010; Viegas, D., Ed.; University of Coimbra: Coimbra, Portugal, 2010. [Google Scholar]
  71. Fosberg, M.A.; Deeming, J.E. Derivation of the One-and Ten-Hour Timelag Fuel Moisture Calculations for Fire-Danger Rating; U.S. Department of Agriculture, Forest Service, Rocky Mountain Forest and Range Experiment Station: Fort Collins, CO, USA, 1971.
  72. Andrews, P.L. BEHAVE: Fire Behavior Prediction and Fuel Modeling System-BURN Subsystem, Part 1; General Technical Report INT-194; USDA Forest Service, Intermountain Forest and Range Experiment Station: Ogden, UT, USA, 1986.
  73. Deeming, J.E.; Burgan, R.E.; Cohen, J.D. The 1978 National Fire-Danger Rating System: Technical Documentation; U.S. Department of Agriculture, Forest Service, Intermountain Forest and Range Experiment Station: Ogden, UT, USA, 1984.
  74. Jolly, W.M.; U.S. Forest Service: Missoula, MT, USA. Personal Communication, 2014.
  75. Riley, K.L.; Abatzoglou, J.T.; Grenfell, I.C.; Klene, A.E.; Heinsch, F.A. The relationship of large fire occurrence with drought and fire danger indices in the western USA, 1984–2008: The role of temporal scale. Int. J. Wildland Fire 2013, 22, 894–909. [Google Scholar] [CrossRef]
  76. LANDFIRE. Homepage of the LANDFIRE Project, U.S. Department of Agriculture, Forest Service and U.S. Department of the Interior, U.S. Geologic Survey. Available online: http://www.landfire.gov/index.php (accessed on 10 March 2015).
  77. Scott, J.H.; Burgan, R.E. Standard Fire Behavior Fuel Models: A Comprehensive Set for Use with Rothermel’s Surface Fire Spread Model; General Technical Report RMRS-GTR-153; USDA Forest Service, Rocky Mountain Research Station: Fort Collins, CO, USA, 2005.
  78. Scott, J.H.; Thompson, M.P.; Gilbertson-Day, J.W. Exploring how alternative mapping approaches influence fireshed assessment and human community exposure to wildfire. GeoJournal 2015, 82, 201–215. [Google Scholar] [CrossRef]
  79. Short, K.C.; Grenfell, I.C.; Calkin, D.E.; Thompson, M.P. The need to rethink initial attack success as a metric for fire management. Int. J. Wildland Fire 2017, in press. [Google Scholar]
  80. Short, K.C. A spatial database of wildfires in the United States, 1992–2011. Earth Syst. Sci. Data 2014, 6, 1–27. [Google Scholar] [CrossRef]
  81. Scott, J.H.; Reinhardt, E.D. Assessing Crown Fire Potential by Linking Models of Surface and Crown Fire Behavior; Research Paper RMRS-RP-29; USDA Forest Service Rocky Mountain Research Station: Fort Collins, CO, USA, 2001.
  82. Grenfell, I.C.; Short, K.C.; Riley, K.L.; U.S. Forest Service: Missoula, MT, USA. Personal Communication, 2016.
  83. Rothermel, R.C. A Mathematical Model for Predicting Fire Spread in Wildland Fuels; Research Paper INT-115; USDA Forest Service Intermountain Forest and Range Experiment Station: Ogden, UT, USA, 1972.
  84. Albini, F.A. Estimating Wildfire Behavior and Effects; General Technical Report INT-30; USDA Forest Service Intermountain Forest and Range Experiment Station: Ogden, UT, USA, 1976.
  85. Wilson, R.A. Reexamination of Rothermel’s Fire Spread Equations in No-Wind and No-Slope Conditions; Research Paper INT-434; USDA Forest Service Intermountain Research Station: Ogden, UT, USA, 1990.
  86. Scott, J.; Pyrologix LLC: Missoula, MT, USA. Personal Communication, 2016.
  87. Weglarczyk, S.; Strupczewski, W.G.; Singh, V.P. Three-parameter discontinuous distributions for hydrological samples with zero values. Hydrol. Process. 2005, 19, 2899–2914. [Google Scholar] [CrossRef]
  88. Parks, S.A.; Miller, C.; Holsinger, L.M.; Baggett, S.; Bird, B.J. Wildland fire limits subsequent fire occurrence. Int. J. Wildland Fire 2016, 25, 182–190. [Google Scholar] [CrossRef]
  89. Parks, S.A.; Holsinger, L.M.; Miller, C.; Nelson, C.R. Wildland fire as a self-regulating mechanism: The role of previous burns and weather in limiting fire progression. Ecol. Appl. 2015, 25, 1478–1492. [Google Scholar] [CrossRef] [PubMed]
  90. Malamud, B.D.; Turcotte, D.L. Self-organized criticality applied to natural hazards. Nat. Hazards 1999, 20, 93–116. [Google Scholar] [CrossRef]
  91. McKelvey, K.S.; Skinner, C.N.; Chang, C.; Et-man, D.C.; Husari, S.J.; Parsons, D.J.; van Wagtendonk, J.W.; Weatherspoon, C.P. An overview of fire in the Sierra Nevada. In Sierra Nevada Ecosystem Project: Final Report to Congress, Assessments and Scientific Basis for Management Options; University of California, Centers for Water and Wildland Resources: Davis, CA, USA, 1996; pp. 1033–1040. [Google Scholar]
  92. Caprio, A.C.; Swetnam, T.W. Historic fire regimes along an elevational gradient on the west slope of the Sierra Nevada, California. In Proceedings of the Symposium on Fire in Wilderness and Park Management: Past Lessons and Future Opportunities, Missoula, MT, USA, 30 March–1 April 1993; Brown, J.K., Mutch, R.W., Spoon, C.W., Wakimoto, R.H., Eds.; USDA Forest Service, Intermountain Research Station: Ogden, UT, USA, 1995. [Google Scholar]
  93. Meyer, M.D. Forest fire severity patterns of resource objective wildfires in the southern Sierra Nevada. J. For. 2015, 113, 49–56. [Google Scholar] [CrossRef]
  94. Beaty, R.M.; Taylor, A.H. Fire history and the structure and dynamics of a mixed conifer forest landscape in the northern Sierra Nevada, Lake Tahoe Basin, California, USA. For. Ecol. Manag. 2008, 255, 707–719. [Google Scholar] [CrossRef]
  95. Collins, B.M.; Everett, R.G.; Stephens, S.L. Impacts of fire exclusion and recent managed fire on forest structure in old growth Sierra Nevada mixed-conifer forests. Ecosphere 2011, 2. [Google Scholar] [CrossRef]
  96. Thompson, M.P.; Riley, K.L.; Loeffler, D.; Haas, J.R. Modeling fuel treatment leverage: Encounter rates, risk reduction, and suppression cost impacts. Forests 2017, 8, 469. [Google Scholar] [CrossRef]
  97. Spies, T.A.; White, E.; Ager, A.; Kline, J.D.; Bolte, J.P.; Platt, E.K.; Olsen, K.A.; Pabst, R.J.; Barros, A.M.G.; Bailey, J.D.; et al. Using an agent-based model to examine forest management outcomes in a fire-prone landscape in Oregon, USA. Ecol. Soc. 2017, 22, 25. [Google Scholar] [CrossRef]
  98. Larsen, A.J.; Belote, T.R.; Cansler, C.A.; Parks, S.A.; Dietz, M.S. Latent resilience in ponderosa pine forest: Effects of resumed frequent fire. Ecol. Appl. 2013, 23, 1243–1249. [Google Scholar] [CrossRef]
  99. Collins, B.M.; Kelly, M.; van Wagtendonk, J.W.; Stephens, S.L. Spatial patterns of large natural fires in Sierra Nevada wilderness areas. Landsc. Ecol. 2007, 22, 545–557. [Google Scholar] [CrossRef]
  100. Barnett, K.; Miller, C.; Venn, T.J. Using Risk Analysis to Reveal Opportunities for the Management of Unplanned Ignitions in Wilderness. J. For. 2016, 114, 610–618. [Google Scholar] [CrossRef]
  101. Scott, J.H.; Helmbrecht, D.; Parks, S.; Miller, C. Quantifying the threat of unsuppressed wildfires reaching the adjacent wildland-urban interface on the Bridger-Teton National Forest, Wyoming, USA. Fire Ecol. 2012, 8, 125–142. [Google Scholar] [CrossRef]
  102. Naficy, C.; Sala, A.; Keeling, E.G.; Graham, J.; DeLuca, T.H. Interactive effects of historical logging and fire exclusion on ponderosa pine forest structure in the northern Rockies. Ecol. Appl. 2010, 20, 1851–1864. [Google Scholar] [CrossRef] [PubMed]
  103. Jolly, W.M.; Cochrane, M.A.; Freeborn, P.H.; Holden, Z.A.; Brown, T.J.; Williamson, G.J.; Bowman, D.M. Climate-induced variations in global wildfire danger from 1979 to 2013. Nat. Commun. 2015, 6, 1–11. [Google Scholar] [CrossRef] [PubMed]
  104. National Interagency Fire Center. Wildland Fire Fatalities by Year. Available online: https://www.nifc.gov/safety/safety_documents/Fatalities-by-Year.pdf (accessed on 30 October 2016).
  105. Babbitt, B. A Coordinated Campaign: Fight Fire with Fire; Remarks at Boise State University: Boise, ID, USA, 1997. [Google Scholar]
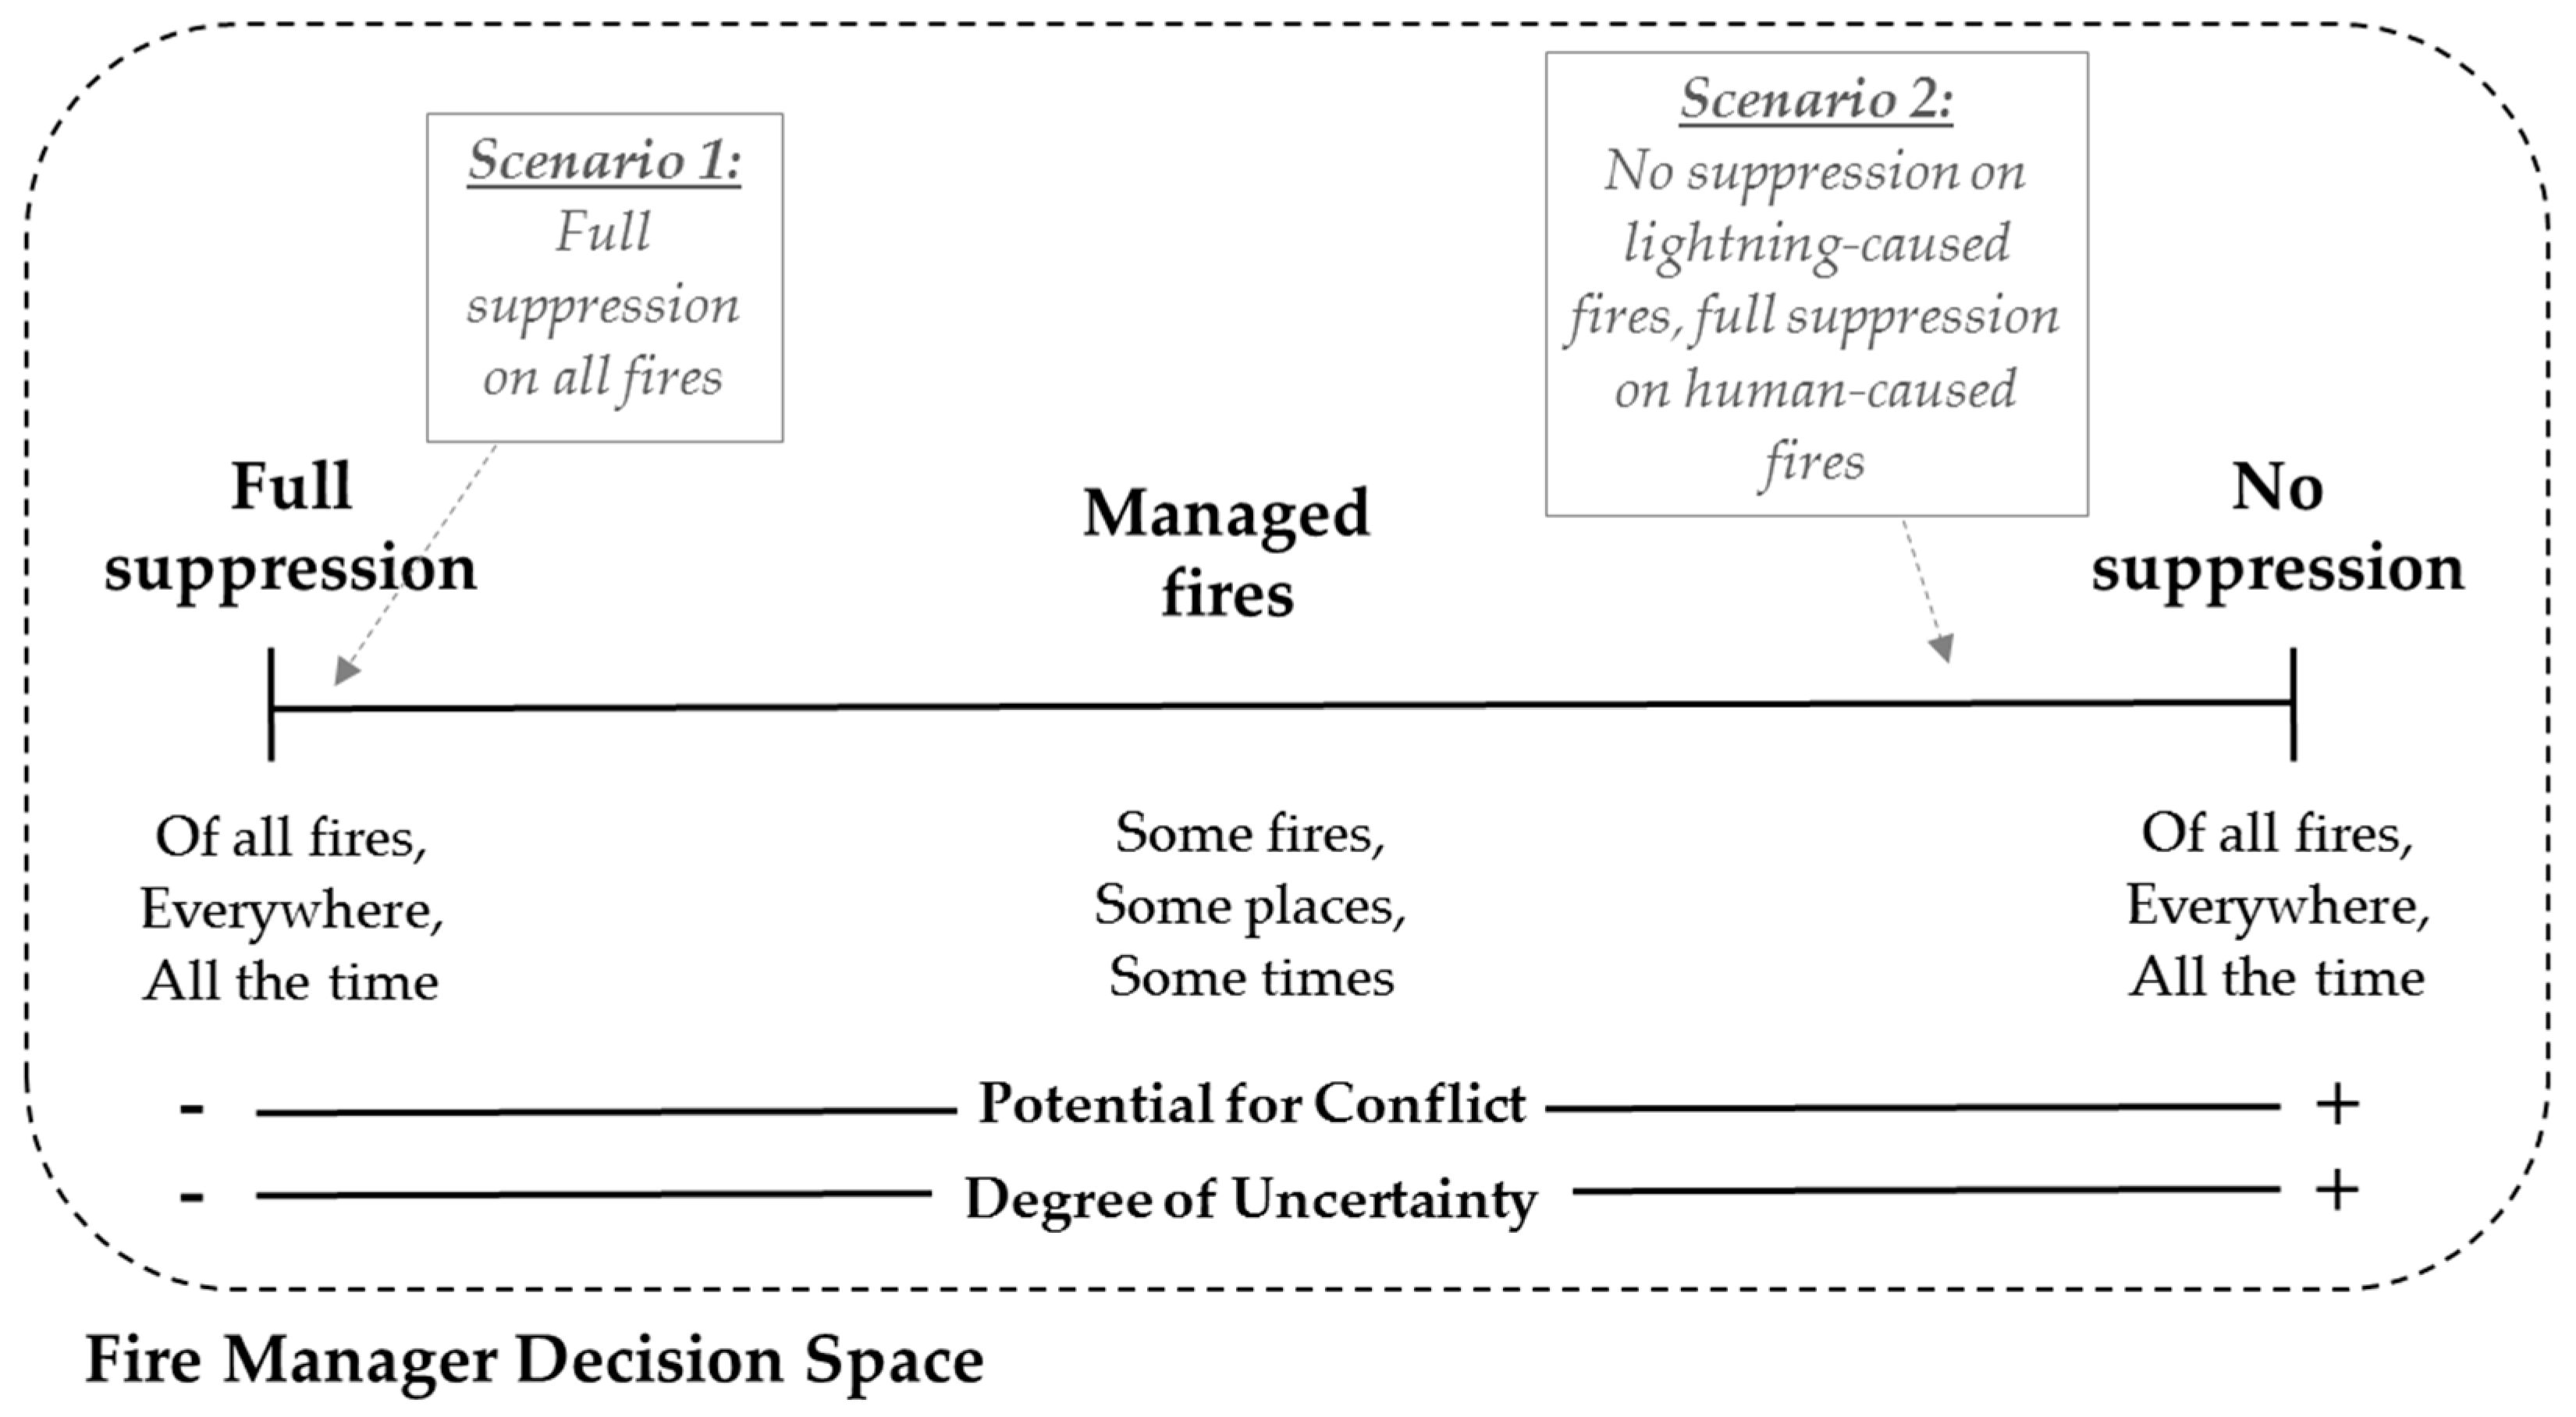
Figure 1. The fire management continuum (a simplified and stylized version of that presented in Thompson et al., 2016 [34]), highlighting the location of the two modeling scenarios.
Resources 07 00004 g001
Figure 2. The study area. FSim was run with ignitions occurring inside the black polygon (the Fire Occurrence Area (FOA)). The landscape file (lcp) extent is identical to the boundaries of this figure, allowing fires to burn out of the FOA and into the surrounding landscape. N.F. = National Forest, N.P. = National Park, and RAWS = Remote Automated Weather Station.
Resources 07 00004 g002
Figure 3. Probability of ignition given Energy Release Component (ERC) for large fires, all lightning fires and large human-caused fires. The vertical distance between the red “large fires” curve, and the black “large human-caused fires” curve represents the probability of ignition of large lightning-caused fires.
Resources 07 00004 g003
Figure 4. Fire size distributions for recent observed fires, modeled fires with large fire ignitions under full suppression (Scenario 1), modeled fires with large human ignitions under full suppression (a component of Scenario 2) and modeled fires with all lightning ignitions and no suppression (also a component of Scenario 2). Slopes of regression lines were −1.59 for observed fires, −1.75 for modeled fires in Scenario 1, −1.77 for human-caused fires with full suppression and −1.04 for modeled lightning fires with no suppression.
Resources 07 00004 g004
Figure 5. (a) The annualized burn probability from large fires with full suppression (Scenario 1 outputs). Burn probabilities were affected by fuel type (b), which influences fire spread rates. Note that the burn probabilities are displayed on a logarithmic scale, so that warmer colors correspond to order-of-magnitude higher burn probabilities.
Resources 07 00004 g005
Figure 6. Annual burn probability resulting from: (a) human-caused large fire ignitions; (b) all lightning ignitions; and (c) their added result, the output from Scenario 2. The burn probability scale is identical to that in Figure 5.
Resources 07 00004 g006
Figure 7. An illustration of the two types of feedbacks. In this example, we assume that burned areas prevent the ignition and spread of future large fires for a duration of five years. We show a set of ignition locations and corresponding fire perimeters for six randomly selected model years from Scenario 2. Each of the fire perimeters from the previous five years is displayed with a different color of grey, while current-year ignitions are shown in dark orange and blue. Under Type 1 assumptions, five of the nine fires from the current year would not have ignited because they fell atop an area burned during the previous five years (blue ignitions); the four fires that fell outside of recently-burned areas (dark orange) would have been able to ignite and spread (their corresponding perimeters are displayed in transparent orange). Under Type 2 assumptions, the areas where the current year (orange) perimeters overlap with a fire perimeter from the previous five years (grey) would not have occurred, as the previously-burned areas would remain non-burnable for five years. In this particular case, if there were no feedbacks in effect, the total area burned by large fires in the Sierra Nevada National Forest during the current year would have been 14,969 hectares. Under Type 1 assumptions, the area would have been reduced to 4597 hectares (69% reduction). Under Type 1 and 2 assumptions, the area would have been further reduced to 2793 hectares (81% reduction).
Resources 07 00004 g007
Table 1. Results of FSim runs, in terms of metrics used in calibration. Large fires are those that are greater than or equal to 100 ha. All modeled figures reflect outputs once overburn has been removed (see Section 2.4).
MetricObserved, All CausesObserved, Human-Caused FiresObserved, Lightning FiresScenario 1Modeled, Human-Caused Large FiresModeled, All Lightning FiresScenario 2
Number of large fires9.15.14.18.46.134.138.6
Median large-fire size (ha)30925943239541522451719
Mean large-fire size (ha)1372163210471301140115,22013,561
Mean annual area burned by large fires igniting in the Sierra National Forest (ha)12,4728234423810,9288546519,002523,455
Mean burn probability for Sierra National Forest0.00530.00360.00180.00480.00260.17410.1751
Table 2. Annualized numbers of large fires (≥100 ha) in the observed record and model runs. Numbers of small fires (<100 ha) in the observed record were used to infer the number of small fires that would have occurred in simulation runs if ignition below the 80th percentile ERC were allowed.
MetricObserved, All CausesObserved, Human-Caused FiresObserved, Lightning FiresModeled, Large Fires (Scenario 1, Overburn Removed)Modeled, Human-Caused Large Fires (Scenario 2)Modeled, All Lightning Fires (Scenario 2)
Number of large fires/year9.15.14.18.46.134.1
Total number of fires556.4431.8124.5556.4431.8124.5
Percent which are large fires1.6%1.2%3.3%1.5%1.4%27.4%
Table 3. Effect of feedbacks on burned area during five- and ten-year periods. Type 1 feedbacks are those where a fire could not ignite because it fell on a pixel burned during the previous five years. Type 2 feedbacks incorporate the effect of Type 1 feedbacks plus the assumption that an area could not carry a spreading fire more than once during a five- or ten-year period. The two negative numbers are a result of rounding error in area estimates. NB = Non-Burnable duration. * Note that proportions could not be calculated when the area burned was zero, resulting in NA values (for the four scenarios, these were respectively number of NAs = 2725, 2750, 468, 465).
Feedback TypeMetricSummary StatisticScenario 1Scenario 2
NB = 5 YearsNB = 10 YearsNB = 5 YearsNB = 10 Years
Without feedbacksarea burned (ha)Min.0000
1st Q.0062876833
Median57152939,15341,793
Mean24572367119,663122,686
3rd Q.24662378162,439164,937
Max.78,40278,4023,271,6113,271,611
Type 1% of cases affected 7129194
avoided area burned (ha)Median0022,18832,487
Mean8917467,16383,540
avoided area burned (proportion) *Min.0000
1st Q.004566
Median007183
Mean376478
3rd Q.009096
95th Perc.2057100100
Max.100100100100
Type 2% of cases affected 27379495
avoided area burned (ha)Median0030,34539,892
Mean148289100,476117,185
avoided area burned (proportion) *Min.−10−700
1st Q.007296
Median009399
Mean5108195
3rd Q.18100100
95th Perc.3465100100
Max.100100100100