Abstract
Regional planning approaches to mining infrastructure aim to reduce the conflict associated with mining operations and existing land uses, such as urban areas and biodiversity conservation, as well as the cumulative impacts that occur offsite. In this paper, we describe a method for conducting Geographical Information System (GIS) least-cost path and least-cost corridor analysis for linear mining infrastructure, such as roads. Least-cost path analysis identifies the optimal pathways between two locations as a function of the cost of traveling through different land use/cover types. In a case study from South-East Sulawesi, Indonesia, we identify potential linear networks for road infrastructure connecting mines, smelters, and ports. The method used interview data from government officials to characterise their orientation (perceived importance and positive/negative attitude) toward the social and environmental factors associated with mining infrastructure. A cost-surface was constructed by integrating spatial layers representing the social and environmental factors to identify areas that should be avoided and areas that were compatible with linear infrastructure using the least-cost path analysis. We compared infrastructure scenario outputs from local and national government officials by the degree of spatial overlap and found broad spatial agreement for infrastructure corridors. We conclude by discussing this approach in relation to the wider social-ecological and mine planning literature and how quantitative approaches can reduce the conflict associated with infrastructure planning.
1. Introduction
An important aim of regional planning approaches for mining is to reduce the conflict associated with minerals/energy extraction and existing land uses such as forestry, agriculture, and biodiversity conservation, whilst addressing the operational needs of mining. Achieving a balanced approach to planning requires existing stakeholder preferences for specific land uses to be incorporated. Approaches to regional land use planning commonly utilise Geographic Information Systems (GIS) to combine spatial data, characterising the suitability of current and potential future development [1,2,3,4]. While suitability mapping has been a core research and operational activity within geographic information sciences for many decades [5], the integration of spatially explicit socioeconomic data, characterising land use values and stakeholder preferences, with ecological data is a growing area of new research [6,7,8,9].
Industrial-scale mining projects require much infrastructure planning, and “resource corridors” of development have been highlighted as a result of such projects [10]. The scale of the planning for such projects can have a transformative impact on development beyond just the mining itself, as demonstrated by notable development projects, particularly in Africa [11]. An important consideration for developing a mine or multiple mines in a region is to optimally plan for linear mining infrastructure including roads, rails, and power lines linking mines to electricity generators, processing (e.g., smelters), and transport facilities (e.g., ports).
For linear infrastructure, least-cost path analysis has been used in GISs for planning a range of infrastructure, including power lines [12,13], pipelines [14], transit corridors [15,16], haulage roads [17,18], and recreational trails [19]. Least-cost path analysis identifies the optimal pathways between two locations as a property of the cost of traveling through different locations within an area. In a GIS, costs are represented by a raster “cost-surface” (gridded spatial data). For example, train tracks need to be on relatively flat surfaces and thus least-cost path analysis identifies a pathway that minimises the number of grid cells with steep gradients. Least-cost methods can also be used to identify least-cost ‘corridors’ which represent the accumulated costs of movement between locations rather than a single pathway [20]. The cost surface for least-cost path and corridor analysis can be a product of all the social, environmental, economic, and engineering criteria that affect routing, wherein pathways are optimised to avoid negative social and environmental outcomes and enhance economic and engineering outcomes.
There are numerous methods for mapping spatially referenced social data in order to characterise stakeholder interests for a particular land use preference [8]. These range from observed preferences derived from land use models [21] and hedonic cost models [22], to self-reported preferences identified by social surveys using methods such as public participatory GIS [7], and finally to implicitly integrating social values using interactive GIS software [23]. For regional planning using least-cost path analysis, multi-criteria analysis methods are commonly used, in which stakeholder representatives or experts weight spatial datasets based on their land use preferences, e.g., [12,15]. In this study we combine social survey methods to weight spatial data to identify land use preferences spatially.
The objective of this paper is to describe a method for optimally planning linear infrastructure for mining regions that accounts for environmental and social factors. We describe a method using a combination of structured interviews with stakeholders to first identify important environmental and social factors. Then we used social survey methods to identify weightings for a number of spatial data inputs (e.g., landuse and road layers) used to represent these factors. These spatial layers were then used to construct cost-surfaces in order for the least-cost path analysis to identify infrastructure pathways and corridors. We use a case study in South East Sulawesi, Indonesia to demonstrate the application of the method, contrasting local government (regional and provincial) with national government land use preferences. We also assess pathways based on identifying the best engineering solution, which aims to identify the flattest and straightest pathways. We conclude by discussing the results in the context of planning in South East Sulawesi and how quantitative approaches can reduce the conflict associated with infrastructure planning.
2. Methods
2.1. Study Area
South Konawe Regency is located within South East Sulawesi Province. The regency is relatively new, having separated from its original regency of Konawe in 2003. The regency has an area of 451,420 ha and a population of 275,234 [24]. There are 22 districts and 343 villages, with Andoolo being the capital city [25]. The region includes 124,600 ha of protected areas covering 28% of the region’s total area. The island of Sulawesi includes a number of endemic and near-endemic flora and fauna species [26].
The main economic activities in the region are subsistence agriculture (cassavas, corn, rice paddy fields, bananas, etc.) and small to medium scale farming or plantations (such as cocoa, coconuts, and cashew nuts). The region experienced a mining boom in the period of 2011 to 2013; however, mine production has reduced since the Indonesian Government introduced mineral processing and refining policies in early 2014. The region is expected to still accommodate small and medium scale mines. During the course of this research, several nickel smelters were being constructed. Existing mineral infrastructure in the region tends to be scattered within and outside company lease areas with poor regulatory standards.
2.2. Least-Cost Paths Modelling of Infrastructure Networks
We used least-cost paths and graph theory for modelling the optimal route for infrastructure at the regional scale. Using this method, the landscape is simplified as nodes that represent the start and end points for least-cost paths (e.g., Figure 1). The start and end points for our study were existing and future mines and processing or transport facilities (Figure 2). These end points were identified through discussions with local and national government representatives. A least-cost path is calculated using a raster cost-surface representing the orientation of stakeholders to infrastructure with existing land uses; the orientation describes whether the stakeholders consider a land use incompatible (negative orientation) or compatible with a specific land use. Pathways between the start and end points which have the lowest accumulated cost are the least-cost path.
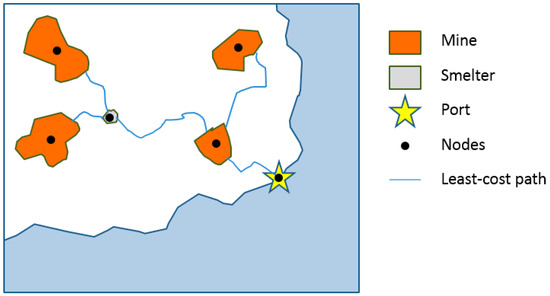
Figure 1.
Using least-cost paths and graph theory, a landscape is simplified as start and end points for least-cost paths. The start and end points are mines and processing or transport facilities.
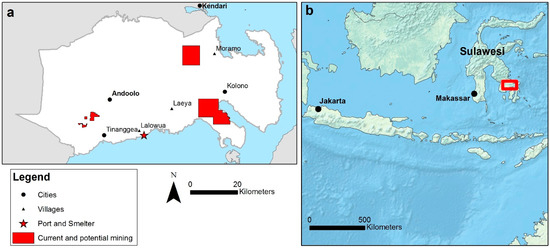
Figure 2.
(a) Current and potential mining locations (based on mine lease areas) and port and potential smelting facilities used as nodes to be linked by infrastructure; (b) Island of Sulawesi, Indonesia, with the study area in outlined in red (spatial data from http://www.naturalearthdata.com).
Where multiple nodes exist, multiple pathways can be identified to construct a network of pathways; an infrastructure network. We identified all the least-cost links between the nodes in the landscape that did not go through an existing node. As well as identifying a single least-cost path (e.g., Figure 1), we also identified least-cost corridors based on a cost-weighted distance threshold. The cost-weighted distance threshold calculates corridor widths not only on Euclidean distances, but on the accumulated costs calculated with the resistance surface (see 20 for more information). Connectivity modelling was conducted using the Linkage Mapper software package [20], and the GIS processing was conducted with ArcGIS 10.2 [27].
The cost-surface was a product of all the social, environmental, economic, and engineering criteria that affect routing. In our study, a literature review and structured interviews were used to identify five key environmental and social factors (Table 1). These factors were considered as an orientation for or against a specific kind of infrastructure development. The five major factors were divided into multiple sub-factors, and, for each sub-factor, the available spatial data was used to construct the cost-surface.

Table 1.
Factors and subfactors used in the analysis, along with the average questionnaire responses for national and local government groups based on the Likert scale from 1 to 5. The column “Spatial Data Present” describes whether spatial data was available to represent a specific sub-factor. “Orientation” describes whether the social or ecological sub-factor was compatible or incompatible within mining toad infrastructure.
During fieldwork in October 2014 and March 2015, a questionnaire was used to determine the average infrastructure orientation for each of the sub-factors for the local and national stakeholder groups. Each factor was scaled from 1 to 5, where 1 is “not important at all”; 3 is “neutral”; and 5 is “very important”. This data represents a subset of 37 interviews/social surveys across multiple stakeholder groups (National Government, Provincial Government, Regency Government, community representatives, and companies). In this study, we focus on the comparison between the national government group (n = 6) and a local government group, which comprises both the provincial and regency government (n = 23). The relative difference in the sample size of the groups is related to the size of the organisations and the number of individuals that were available for the interviews.
The infrastructure orientation for each sub-factor was then considered as either positive or negative to reflect whether the stakeholders thought that the land use associated with a specific sub-factor was compatible with infrastructure or in conflict. The orientation proportion converted the average questionnaire response, based on the Likert scale, to values from −1 to +1, where −1 represents average responses that were all “not important at all” with a Likert score of 1, +1 represents the responses that were all “very important” with a Likert score of 5, and 0 represents a “neutral” Likert score of 3 (Equation (1)). The sign for the orientation proportion was then converted based on whether the orientation to infrastructure was based on compatibility with infrastructure or conflict. For example, if the compatibility was negative (i.e., the protected areas were deemed incompatible with infrastructure), positive values were converted to negative values.
We then identified the best available spatial data that could be used to represent each of these factors (Figure 3). In some cases, data were not available to represent each of the sub-factors, so we then calculated the cost for each spatial layer as a function of the total number of spatial layers available per factor (Equation (2)). For example, the factor “B. Water habitat and resources” had two spatial layers, and thus infrastructure orientation values were divided by 2. This approach was used so that the factors that had multiple sub-factors with available spatial layers were as equally weighted in the cost surface as factors with very few sub-factors e.g., “B. Water habitat and resources” has 3 subfactors versus “D. Industrial activities”, which has 5.
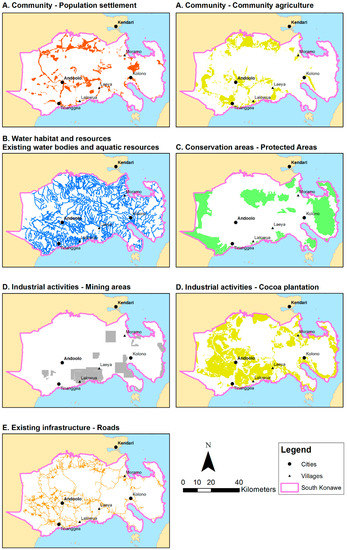
Figure 3.
Maps of the sub-factors used to create a cost-surface based on Geographic Information Systems (GIS) spatial data. Each subfactor (A–E) is represented by one or more spatial dataset (see Table 1).
A topographical dataset was used to derive a map of the terrain slope across the region, derived from a Digital Elevation Model (DEM). The figure slope was classified into the following categories based on suitability classes identified by the Indonesian transportation department categories, and the costs were derived through discussions with a consultancy firm with experiencing in deriving construction costs:
| <3° Suitable | no cost |
| 3°–25° No suitable | double cost |
| >25° Very unsuitable | five times the cost |
Along with the sub-factor spatial data (Figure 3), we then tested three different combinations of resistance surfaces; (1) topography only, (2) topography and social values combined and equally weighted, and (3) social values only (Figure 4). The processing was conducted using a cell size of 100 m. This cell size represents an optimum pixel size for the spatial data input layers and also the appropriate physical size of the infrastructure tested. We rescaled all pixel values in the social data to match the topography data, whereby the maximum resistance was 5 times (Equation (3)).
where max’ is the new maximum, min’ is the new minimum, min is the original minimum, max is the original maximum, and value is the original value.
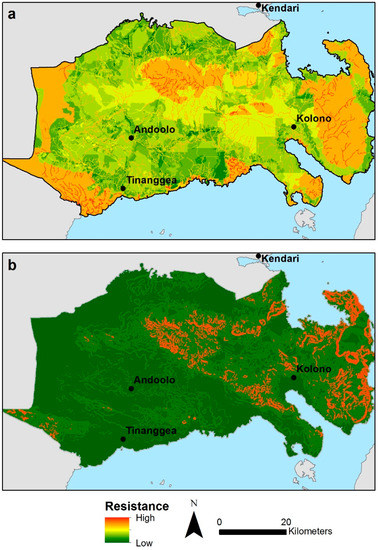
Figure 4.
Example of the cost-surface produced through (a) combining all the weighted GIS layers representing each of the sub-factors where spatial data was available for local regions and (b) using only topography where high resistance areas have higher slope values.
Infrastructure connectivity was modelled using the Linkage Mapper software [20] for identifying least-cost paths and corridors. The least-cost analysis was based on the cumulative cost in relation to land cover resistance. The process of producing the cost-surface was automated using the Python programming language, utilising the ArcGIS 10.2 Python libraries [27] (see https://github.com/AlexLechner/Infrastructure-network-processing-tool for that latest version).
We mapped the least-cost paths and least cost corridors. These least-cost corridors were thresholded at two corridor widths based on the cost-weighted distances of 50,000 m and 100,000 m, rather than simple Euclidian distances. Linkage Mapper calculates the least-cost corridors by combining multiple cost-weighted distance corridors between each of the nodes and normalising the cost-weighted distances by the least-cost pathway distances software [20].
The least-cost corridors produced for the two distance thresholds were then overlayed on the level of agreement between the two stakeholder groups (national and local government), and three different resistance surfaces (social, social + topography, and topography only) were calculated. This provides a measure of the spatial differences between the least-cost solutions identified.
3. Results
The least-cost path analysis identified pathways that connected all the nodes (mines, processing facilities, and ports) in the region (Figure 5). The analysis showed differences in pathways identified by local versus national government groups. The least-cost corridor analysis, which also describes less than optimal pathways (e.g., the high cost-weighted distance in Figure 5), had wider corridors for the national government group than the local government group, indicating more options for infrastructure corridors.
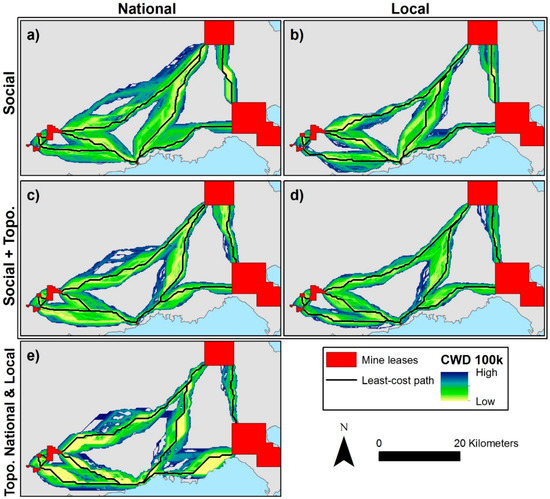
Figure 5.
Infrastructure corridors identified with least-cost path and corridor analysis for national and local groups (a–d); (a,b) Pathways and corridors identified where the resistance surface is based only on social values; (c,d) Pathways and corridors identified where the resistance surface is based on a combination of topography and social values; (e) Pathways and corridors identified only where the resistance surface is based on topography. Corridor width is based on a cost weighted distance (CWD) threshold of 100,000 m. Additional analysis based on the cost-weighted distance of 50,000 m is not shown, but is analysed in Table 2.
Figure 6 highlights specific characteristics of the cost-weighted distance corridors that are useful for planning infrastructure corridors. In some cases, there are alternative pathways for routing (Figure 6a), which are separated by high resistance topographical and social values. In other cases, the cost-weighted corridor is wide and the cost-weighted distance values are relatively homogenous, indicating multiple options for routing that are equally as feasible (Figure 6b). In these areas, the resistance surface is likely to be relatively homogenous. In other cases, the cost-weighted corridor widths are narrow, indicating fewer options for routing (Figure 6c).
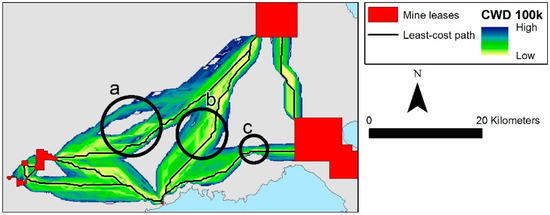
Figure 6.
Infrastructure corridors identified with the least-cost path and corridor analysis for the National Government group where the resistance surface is based only on social values. (a) Example of where alternative pathways may exist; (b) Example of where the corridor is wide and thus there are many options for routing infrastructure; (c) Example of a narrow corridor where there are fewer options for routing infrastructure.
A comparison of the agreement between national and local government groups, with and without topography, and topography alone revealed wide agreement for 50,000 m and 100,000 m cost-weighted distances (Table 2). However, the average overlap between the different layers was 67% for the 50,000 m cost-weighted distance versus 79% for the 100,000 m cost-weighted distance. The infrastructure corridors based on national government social values and topographic layers combined had the highest overlap, on average, with other corridors created using other resistance surfaces. The infrastructure corridors based on local government social values had, on average, the lowest overlap with other corridors created using other resistance surfaces.

Table 2.
Percentage of overlap between the least-cost corridors identified using a range of resistance surfaces. For example, 51% of the total area of the corridor based on topography (Topo.) is overlapped with the national government group’s social values (Nat. Social) corridor for a cost-weighted distance (CWD) threshold of 50,000 m, and 47% of the total area of the national government group’s social values (Nat. Social) corridor is overlapped with the corridor based on topography (Topo.).
4. Discussions
The method described in this chapter represents a systematic quantitative evidence-based approach for evaluating the optimal locations for building linear transportation infrastructure. Our least-cost path and corridor modelling method emphasises the linkages between natural and human systems across disciplines using an integrated systems based approach. Such an approach can be included as one of the decision support tools for land use planning in mining regions. Using a participatory approach, through multiple iterations of the model, the accuracy of the least-cost outputs and how well they reflect stakeholder preferences can be improved.
4.1. Contrasting Local Versus National-Scale Planning
The application of the method needs to take into account the type and administrative level of the government stakeholders whose input is sought for the least-cost path analysis, particularly with regard to the preferences that may be expressed for land use. As in many countries where some degree of political power has been devolved to local governments, there is often a challenge in aligning national and sub-national interests in Indonesia. The results of our analysis show that there is broad spatial overlap between corridors identified by the local and national government. In these areas of overlap, planning approaches within the context of regulation could be applied to identify the routing of infrastructure. Infrastructure planning, and economic development planning more broadly, must conform to the spatial plans that exist at national, provincial, and district/city levels. Under Indonesia’s most recent spatial planning law (Law 26/2007) and associated regulations, spatial planning has a hierarchical structure. At the highest level there is a national spatial plan, followed by plans at provincial and district/city levels. The most detailed spatial plans are those developed at the district/city level. These spatial plans must conform to the provincial plan, which, in turn, must conform to the national spatial plan [28].
An important function of local government in Indonesia is to promote and plan for economic development. Since decentralization began in 1999 [29], local governments are under greater pressure to finance local development and public services, so immediate developmental needs may take precedence over environmental issues. Local governments may prioritise activities that promise to bring development and revenue raising opportunities. These priorities are reflected in the questionnaire results (Table 2), in which local government participants have higher average responses than national government participants for sub-factors that are more important for local development such as community agriculture, palm oil, cocoa plantation, fishing zones, etc. Meanwhile national government participants had higher average responses for more macro-level concerns such as protected areas and biological diversity related to national policies, which are often driven by international conventions such as the Convention on Biological Diversity.
The reality is that the government stakeholders involved in planning at different administrative levels often have different preferences with regard to the ‘costs’ of planning infrastructure through a given landscape. These preferences often result in local level planning that does not align with the higher spatial plans and may result in development that conflicts with the outcomes desired by higher-level government stakeholders at the national and provincial levels. Further, even at the same administrative level (e.g., regency level), stakeholders from different ministries (e.g., forestry and mines) will likely have different preferences when it comes to planning infrastructure, not to mention different or conflicting data. These preferences are shown in the outputs of our analysis (e.g., Figure 5 and Table 1 and Table 2). Finding ways to reach consensus on land use among these different government stakeholders is beyond the scope of this paper; however, as we have described elsewhere [30], participatory planning in multi-stakeholder infrastructure planning forums is one way in which the alignment of preferences can be obtained.
4.2. Social-Ecological Analysis in the Context of Mine Planning
There has been a growing body of literature on the integration of social and environmental indicators, within the rubric of ‘socio-ecological systems’, and applying them to community-based planning [31]. As our case analysis has shown, mining presents a particularly salient example of a development activity that necessitates a confluence of ecological and social criteria for effective regional planning. Furthermore, the maps generated by using our methodology can have a cognitive impact on community deliberation. Cartographic tools such as GIS have much potential to harmonize social and ecological factors in an accessible way for community deliberations around projects. Scenarios can be visualized to facilitate community consultation programs around mining corridors, whose full impacts are too complex to digest through narrative data. The value of this methodology for integrating social and environmental factors in crafting routes that have maximum social acceptance has been demonstrated.
Similar to many developing countries, Indonesia is located within a unique political and social environment, where an infrastructure deficit provides an opportunity to develop suitable regional plans with benefits for the wider community while meeting the objectives required by mining companies for mineral processing, transport, and export. This is explored by Weng et al. [11] in their discussion of the potential risks and opportunities faced by underdeveloped regions undergoing rapid expansion through mining. For example, the development of mine-related growth corridors in sub-Saharan Africa has the potential to benefit mining companies while also creating agricultural development through increased access to markets and providing local jobs in the construction phase. However, there is a strong need for governance, policy, and spatial planning to progress in accordance with mine-related development in order to ensure that social, economic, and environmental outcomes are met [11].
Least-cost path analysis has been used to improve planning processes; however, the majority of examples focus on either reducing the environmental impacts or the economic costs of infrastructure, such as power lines [12,13] and transit corridors [15], for urban planning. However, there are few examples of such analyses in regional mine planning, and there is great potential for utilising such tools to address some of the social and environmental issues associated with poorly planned infrastructure [11,32].
A key challenge for our analysis is combining social values with the engineering costs associated with topography. While the engineering costs can be identified in explicit monetary terms, social values are generally normative. When combining these two separate types of preferences, quantitative methods require some sort of common currency, such as in this study where we need to identify a raster ‘cost’. The creation of a common currency is a challenge that we did not explicitly address in this study and is an even greater challenge than the modelling itself.
4.3. Limitations and Future Work
The outputs described in this paper provide a statistic illustration of the optimal pathways for planning infrastructure. Our method and its informative graphical outputs is best suited to a deliberative planning approach, in which the outputs would be further refined through engaging with the local community and government stakeholders in a workshop environment. In practice, regional planning should involve a greater sample size to ensure the legitimacy, transparency, and representation of all key stakeholders. However, the trends reflected in the quantitative data showing stakeholder orientation to infrastructure were confirmed by the structured interviews. One of the difficulties with our approach is the need to map the sub-factors without existing data (Table 1), while improving the positional and thematic accuracy of existing spatial data within areas that have least-cost corridors through discussion with the local community. Increasing stakeholder input with greater sample sizes and including local community input, rather than just that of the local and national government, will also ensure that all the critical social and environmental issues are recognised. For example, some areas may have a high value to local communities that are unknown at government levels (e.g., of spiritual significance etc.) and could be mapped using public participatory GIS methods [7,33]. All of the above issues, associated with how well the spatial data reflect the sub-factors, may need to be addressed as spatial uncertainty is particularly problematic when combining, rescaling, and conducting spatially explicit modelling [34,35,36]. However, outputs based on least-cost corridors, rather than pathways, provide an indication of where spatial uncertainty may have the greatest impacts, which is likely to be where there are few options for infrastructure corridors (i.e., narrow corridors), and small errors in the spatial data can have a large impact. As well as addressing the concerns described above, future research could also include ways of applying the modelling methods in a more dynamic and responsive manner better suited to a workshop environment so that participants could immediately see and respond to the results of their chosen weightings of social and ecological values.
5. Conclusions
Regional planning approaches to mining are critical for addressing the cumulative impacts that occur offsite from the mining operations and which are associated with supporting infrastructure. This study provides a demonstration of the capability of GIS with least-cost path analysis and social survey methods to identify the infrastructure corridors that have the least impact on social and environmental values. Transparent evidence-based quantitative approaches supported by deliberative participatory approaches have the potential to reduce the conflict associated with the different land use preferences and values held by stakeholders. This tool has the potential for use and refinement in more effective multiple criteria decision-making by communities as well as government planning authorities. Thus infrastructure development in contentious resource use projects in developing democracies, such as Indonesia, has greater prospects for informed consensus through the application of these techniques.
Acknowledgments
This work was supported by the Indonesia Infrastructure Initiative (IndII) through its Australia Indonesia Infrastructure Research Award in 2014–2015. We would like to thank Miming Miharja, Heru Purboyo, Lusi Suwandi, Azis Syafruddin, and other research team members from the Institut Teknologi Bandung (ITB) for their contribution to the overall research activities. We also would like to acknowledge the support received from the South East Sulawesi Provincial Government in providing the GIS datasets for this research. Finally, we would like to thank Ian Bell from Financial-Architects Asia Pty Ltd. for providing assistance in identifying the engineering costs.
Author Contributions
All authors contributed to the conception and design of the analysis; A.L. lead the paper writing and analysis; P.M. and S.R. analyzed the spatial data; B.D. and A.S. conducted the social surveys; M.S. assisted with the spatial data and scenarios; and G.B., S.A., and P.R contributed to the writing of the paper.
Conflicts of Interest
The authors declare no conflict of interest. The founding sponsors had no role in the design of the study; in the collection, analysis, or interpretation of data; in the writing of the manuscript; and in the decision to publish the results.
References
- Ives, C.D.; Biggs, D.; Hardy, M.J.; Lechner, A.M.; Wolnicki, M.; Raymond, C.M. Using social data in strategic environmental assessment to conserve biodiversity. Land Use Policy 2015, 47, 332–341. [Google Scholar] [CrossRef]
- Bryan, B.A.; Crossman, N.D.; King, D.; Meyer, W.S. Landscape futures analysis: Assessing the impacts of environmental targets under alternative spatial policy options and future scenarios. Environ. Model. Softw. 2011, 26, 83–91. [Google Scholar] [CrossRef]
- Brown, G.; Raymond, C.M. Methods for identifying land use conflict potential using participatory mapping. Landsc. Urban Plan. 2014, 122, 196–208. [Google Scholar] [CrossRef]
- Lechner, A.M.; Mcintyre, N.; Bulovic, N.; Kujala, H.; Whitehead, A.; Webster, A.; Wintle, B.; Rifkin, W.; Scott, M.H.; Kujala, A.; et al. A GIS Tool for Land and Water Use Planning in Mining Regions. In Proceedings of the 21st International Congress on Modelling and Simulation (MODSIM2015), Broadbeach, Queensland, Australia, 29 November–4 December 2015; pp. 1359–1365.
- Longley, P.A.; Goodchild, M.; Maguire, D.J.; Rhind, D.W. Geographic Information Systems and Science, 3rd ed.; Wiley & Sons: Hobeken, NJ, USA, 2011. [Google Scholar]
- Goodchild, M.F.; Anselin, L.; Appelbaum, R.P.; Harthorn, B.H. Toward Spatially Integrated Social Science. Int. Reg. Sci. Rev. 2000, 23, 139–159. [Google Scholar] [CrossRef]
- Brown, G. Public participation GIS (PPGIS) for regional and environmental planning: Reflections on a decade of empirical research. URISA J. 2012, 24, 7–18. [Google Scholar]
- Lechner, A.M.; Raymond, C.M.; Adams, V.M.; Polyakov, M.; Gordon, A.; Rhodes, J.R.; Mills, M.; Stein, A.; Ives, C.D.; Lefroy, E.C. Characterizing spatial uncertainty when integrating social data in conservation planning. Conserv. Biol. 2014, 28, 1497–1511. [Google Scholar] [CrossRef] [PubMed]
- Lechner, A.M.; Brown, G.; Raymond, C.M. Modeling the impact of future development and public conservation orientation on landscape connectivity for conservation planning. Landsc. Ecol. 2015, 30, 699–713. [Google Scholar] [CrossRef]
- Mtegha, H.; Leeuw, P.; Naicker, S.; Molepo, M. Resources Corridors: Experiences, Economics and Engagement; A Typology of Sub-Saharan; Extractive Industries SourceBook: Johannesburg, South Africa, 2012. [Google Scholar]
- Weng, L.; Boedhihartono, A.K.; Dirks, P.H.G.M.; Dixon, J.; Lubis, M.I.; Sayer, J.A. Mineral industries, growth corridors and agricultural development in Africa. Glob. Food Secur. 2013, 2, 195–202. [Google Scholar] [CrossRef]
- Bagli, S.; Geneletti, D.; Orsi, F. Routeing of power lines through least-cost path analysis and multicriteria evaluation to minimise environmental impacts. Environ. Impact Assess. Rev. 2011, 31, 234–239. [Google Scholar] [CrossRef]
- Grassi, S.; Friedli, R.; Grangier, M.; Raubal, M. A GIS-Based Process for Calculating Visibility Impact from Buildings During Transmission Line Routing. In Connecting a Digital Europe Through Location and Place, 383 Lecture Notes in Geoinformation and Cartography; Huerta, J., Schade, S., Granell, C., Eds.; Springer International Publishing: Cham, Switzerland, 2014; pp. 383–402. [Google Scholar]
- Feldman, S.C.; Pelletier, R.E.; Walser, E.; Smoot, J.C.; Ahl, D. A Prototype for Pipeline Routing Using Remotely-Sensed Data and Geographic Information-System Analysis. Remote Sens. Environ. 1995, 53, 123–131. [Google Scholar] [CrossRef]
- Gahlot, V.; Swami, B.L.; Parida, M.; Kalla, P. User oriented planning of bus rapid transit corridor in GIS environment. Int. J. Sustain. Built Environ. 2012, 1, 102–109. [Google Scholar] [CrossRef]
- Atkinson, D.M.; Deadman, P.; Dudycha, D.; Traynor, S. Multi-criteria evaluation and least cost path analysis for an arctic all-weather road. Appl. Geogr. 2005, 25, 287–307. [Google Scholar] [CrossRef]
- Choi, Y.; Park, H.-D.; Sunwoo, C.; Clarke, K.C. Multi-criteria evaluation and least-cost path analysis for optimal haulage routing of dump trucks in large scale open-pit mines. Int. J. Geogr. Inf. Sci. 2009, 23, 1541–1567. [Google Scholar] [CrossRef]
- Choi, Y.; Nieto, A. Optimal haulage routing of off-road dump trucks in construction and mining sites using Google Earth and a modified least-cost path algorithm. Autom. Constr. 2011, 20, 982–997. [Google Scholar] [CrossRef]
- Sitzia, T.; Rizzi, A.; Cattaneo, D.; Semenzato, P. Designing recreational trails in a forest dune habitat using least-cost path analysis at the resolution of visitor sight distance. Urban For. Urban Green. 2014, 13, 861–868. [Google Scholar] [CrossRef]
- McRae, B.H.; Kavanagh, D.M. Linkage Mapper Connectivity Analysis Software, Linkage Mapper: Seattle, WA, USA, 2011.
- Goldberg, C.S.; Pocewicz, A.; Nielsen-Pincus, M.; Waits, L.P.; Morgan, P.; Force, J.E.; Vierling, L.A. Predictions of ecological and social impacts of alternative residential development policies to inform decision making in a rural landscape. Conserv. Lett. 2011, 4, 423–432. [Google Scholar] [CrossRef]
- Polyakov, M.; Pannell, D.J.; Pandit, R.; Tapsuwan, S.; Park, G. Valuing Environmental Assets on Rural Lifestyle Properties. Agric. Resour. Econ. Rev. 2013, 42, 159–175. [Google Scholar] [CrossRef]
- Lesslie, R. Mapping Our Priorities—Innovation in Spatial Decision Support. In Innovation for 21st Century Conservation; Figgis, P., Fitzsimon, J., Irving, J., Eds.; Australian Committee for IUCN Inc.: Sydney, Australia, 2012; pp. 156–163. [Google Scholar]
- Bkpm Statistik Penduduk Menurut Jenis Kelamin. Available online: http://regionalinvestment.bkpm.go.id/newsipid/demografipendudukjkel.php?ia=7408&is=37 (accessed on 20 April 2015).
- BPK RI Profil Kabupaten Konawe Selatan. Available online: http://kendari.bpk.go.id/?page_id=391 (accessed on 20 April 2015).
- Morrison, J. Indonesia: Island of Sulawesi. Available online: www.worldwildlife.org/ecoregions/aa0123 (accessed on 29 November 2016).
- Environmental Systems Research Institute. ArcGIS Desktop: Release 10.2; Environmental Systems Research Institute: Redlands, CA, USA, 2012. [Google Scholar]
- Heri, S. Spatial Planning Support System for an Integrated Approach to Disaster Risk Reduction. Ph.D. Thesis, University of Melbourne, Melbourne, Australia, 2012. [Google Scholar]
- USAID. The Role of Local Governments in Promoting Decentralized Economic Governance in Indonesia; Local Governance Support Program; USAID: Washington, DC, USA, 2009.
- Devi, B.; Schleger, A.; Lechner, A.; Rogers, P.; Ali, S.; Rachmat, S. Socio-Ecological Tools in the Development of Mineral Infrastructure in Indonesia; The University of Queensland: Brisbane, Australia, 2015. [Google Scholar]
- Dukes, E.F.; Firehock, K.E.; Birkhoff, J.E. Community-Based Collaboration: Bridging Socio-Ecological Research and Practice; University of Virginia Press: Charlottesville, VA, USA, 2011. [Google Scholar]
- Cane, I.; Schleger, A.; Ali, S.; Kemp, D.; McIntyre, N.; McKenna, P.; Lechner, A.; Dalaibuyan, B.; Lahiri-Dutt, K.; Bulovic, N. Responsible Mining in Mongolia: Enhancing Positive Engagement; Sustainable Minerals Institute: Brisbane, Australia, 2015. [Google Scholar]
- Brown, G.; Fagerholm, N. Empirical PPGIS/PGIS mapping of ecosystem services: A review and evaluation. Ecosyst. Serv. 2015, 13, 119–133. [Google Scholar] [CrossRef]
- Lechner, A.M.; Langford, W.T.; Bekessy, S.A.; Jones, S.D. Are landscape ecologists addressing uncertainty in their remote sensing data? Landsc. Ecol. 2012, 27, 1249–1261. [Google Scholar] [CrossRef]
- Gotway, C.A.; Young, L.J. Combining Incompatible Spatial Data. J. Am. Stat. Assoc. 2002, 97, 632–648. [Google Scholar] [CrossRef]
- Comber, A.; Fisher, P.; Wadsworth, R. You know what land cover is but does anyone else? An investigation into semantic and ontological confusion. Int. J. Remote Sens. 2005, 26, 223–228. [Google Scholar] [CrossRef]
© 2017 by the authors. Licensee MDPI, Basel, Switzerland. This article is an open access article distributed under the terms and conditions of the Creative Commons Attribution (CC BY) license ( http://creativecommons.org/licenses/by/4.0/).