Article

Decreasing Ore Grades in Global Metallic Mining: A Theoretical Issue or a Global Reality?

1
Research Centre for Energy Resources and Consumption (CIRCE)—Universidad de Zaragoza, CIRCE Building—Campus Río Ebro, Mariano Esquillor Gómez, 15, 50018 Zaragoza, Spain
2
Environmental Engineering, Department of Civil Engineering, Monash University, Wellington Rd, Clayton VIC 3800, Australia
*
Author to whom correspondence should be addressed.
Resources 2016, 5(4), 36; https://doi.org/10.3390/resources5040036
Submission received: 29 September 2016 / Revised: 21 October 2016 / Accepted: 27 October 2016 / Published: 7 November 2016

Abstract

:
Mining industry requires high amounts of energy to extract and process resources, including a variety of concentration and refining processes. Using energy consumption information, different sustainability issues can be addressed, such as the relationship with ore grade over the years, energy variations in electricity or fossil fuel use. A rigorous analysis and understanding of the energy intensity use in mining is the first step towards a more sustainable mining industry and, globally, better resource management. Numerous studies have focused on the energy consumption of mining projects, with analysis carried out primarily in one single country or one single region. This paper quantifies, on a global level, the relationship between ore grade and energy intensity. With the case of copper, the study has shown that the average copper ore grade is decreasing over time, while the energy consumption and the total material production in the mine increases. Analyzing only copper mines, the average ore grade has decreased approximately by 25% in just ten years. In that same period, the total energy consumption has increased at a higher rate than production (46% energy increase over 30% production increase).

1. Introduction

Demand for the main metals that modern society needs to produce goods has increased dramatically over the past few decades, thereby increasing the extraction to meet this demand. Between 1998 and 2014, world material extraction of the main commodities increased by a factor of 1.7 [1,2], a very significant number if we compare it to the 8-factor increase observed by Krausmann et al. [3] from 1900 to 2005. For instance, in the past 10 years, approximately one quarter of the total historic mine production of copper was produced, showing that global copper production has doubled every 25 years since data started being recorded [4]. Meeting the increasing demands for metals makes the mining industry one of the most energy-intensive industrial sectors. According to the International Energy Agency, between 8% and 10% of the world total energy consumption is dedicated to the extraction of materials that the society demands, and that number does not take into account metallurgical processes, transport and other mining-related activities [5].
Whilst some studies show that the ore grade is decreasing over time [6,7,8,9], other studies state that the declining ore grades must neither be interpreted as a sign of depletion nor as an indicator of resource availability [10,11]. This is because changes in ore grade can be attributed to other factors such as innovation and improvements in extractive technologies, extending the life of older mines over finding new ones, among others [12]. Moreover, there is evidence that for most metals, as ore grades decline, the deposit size grows faster than the very decline in ore grade—meaning greater contained metals (e.g., uranium [8]; nickel [13]; zinc [14]). This is why a deeper quantitative analysis is crucial to better understand the relationship between ore grade changes and energy intensity in mines.
Therefore, this paper presents a study at the world level of the most important mines that extract economically relevant minerals, such as gold, lead, zinc and copper, using information from several mining companies distributed in different countries. With data regarding ore mined and milled, ore grade evolution and energy use over the last decades, the energy intensity use has been analyzed, as well as the possible links between those factors.

2. Availability and Mineral Processing

In this section the different stages of the extraction and processing of the main commodities analyzed in this paper (copper, zinc and gold) are going to be described. Only the in-mine processes are considered, namely beneficiation, concentration and smelting, excluding the smelting and refining processes that takes place outside the mine and mining facilities.

2.1. Copper

Demand for copper has increased dramatically over the last few decades. From 1991 to 2015, the world total extraction has doubled, going from 9.3 million to 18.7 million tonnes. Available data suggest that the world copper reserves are 720 million tonnes and the identified resources approximately 2.1 billion tonnes [15] while other studies state that the ultimately recoverable reserves could be 2.8 billion tonnes [16]. At present, the global average copper ore grades for copper mines is approximately 0.62% of Cu content [17] and this number is expected to decrease as mines with higher ore grades become exhausted [17,18,19]. Starting from this information, the concern over the future availability of copper is on the rise, and several studies have focused on estimating the global copper peak production using Hubbert’s model, which has been estimated to be between 8 and 40 years from now [16,20,21,22,23,24].
Copper is currently mined using both underground and open cut methods and there are basically two main processing routes, depending on the type of ore present, sulfides or oxides. After ore sorting and grinding, used in both types of ore, the main technique used for concentration of sulfide ores is froth flotation followed by smelting and refining (pyrometallurgical process) while in the case of oxide ores (and some low grade sulfide ores) a heap leaching process is combined with solvent extraction and electrowinning (SX-EW) (hydrometallurgical process) [25].
In the pyrometallurgical process, the ore is mined, concentrated, smelted and refined. The sulfides are separated from the gangue material using flotation to form a concentrate containing 25% to 35% of copper [26]. During smelting, the concentrate is fed to a smelter, along with oxygen and a reductant such as coking coal, where sulfides are oxidized producing a blister of 97%–99% of molten metallic copper that is later purified by electrolytic purification to pure copper [27]. From the 1980s a new technology emerged, commonly known as the heap leach–solvent extraction/electrowinning process (HL-SX/EW), although only 10% of the primary production comes from this hydrometallurgical route [28]. This process operates at ambient temperatures and the copper is dissolved to produce a copper sulphate solution through heap leaching, after which the copper is recovered through SX-EW to produce pure copper cathode.

2.2. Lead-Zinc

Lead and zinc appear almost always associated in mineral deposits, so mines that produce zinc also produce smaller amounts of lead and vice versa. In 2015, 4.7 million tonnes of lead were produced at world level along with 13.4 million tonnes of zinc [15]. According to the United States Geological Survey, there are 89 million tonnes of reserves and more than 2 billion tonnes of resources for the case of lead and 200 million tonnes of reserves and 1.9 billion tonnes of identified resources for the case of zinc. Meanwhile, other studies estimate that the extractable reserves are 2.3 and 2.6 billion tonnes for lead and zinc respectively [22]. Although there are no data available on global average mined ore grades for zinc mines, the average ore grade in the mine (xm) estimated by Cox and Singer [29] is 6.05% Pb + Zn. There are also complementary studies regarding the ore grade of specific countries [30]. Using the available information on reserves and resources, the peak production year has been estimated for both metals, namely 2018 for lead and 2030 for zinc [31].
Lead and zinc ores are mined mostly by underground operations as the most common form of mineralization are veins where an association of different minerals can be found. In general, lead and zinc ores are processed with differential froth flotation to produce separate lead and zinc concentrates, with lead concentrates (usually ~50%–70% lead) then smelted using pyrometallurgy and zinc concentrates (usually ~50% zinc) are most commonly refined using hydrometallurgy, although some 15%–20% of world zinc production is derived through pyrometallurgical techniques [32]. The energy requirements for the primary production of lead are between 10 and 20 GJ/t and between 24 and 48 GJ/t for the case of zinc [33,34].

2.3. Gold

The gold production in 2015 was 3000 tonnes, with China, Australia and Russia being the main producers with production amounts of 490, 300 and 242 tonnes, respectively [15]. According to that same report, there are 56,000 tonnes of world gold reserves, while other authors state that the amount of recoverable reserves is 135,000 tonnes [31]. The production peak for gold using Hubbert’s diagram, where neither recycling nor trade are taking into account, is situated around 2010–2015, while using a full dynamic simulation model that incorporates recycling among other factors, the gold mines become exhausted after 2030 [31,35].
As gold usually appears in very low concentrations in mineral deposits, it is usually measured in grams per tonne, and the average ore grade can vary significantly from one mine to another. Usually open cut mines have lower grades, around 1 to 4 g/t, while underground mines can reach up to 8 to 10 g/t [36]. Mudd [6] estimated the average ore grade for Canada, Australia and South Africa as 7.15, 2.65 and 9.83 g/t respectively.
Gold mining takes place both in surface, such as open cut or placer mining, and underground. Currently there are several processes to extract gold, with gravity concentration, flotation, pyrometallurgy and hydrometallurgy (cyanidation) the main processes. Still some small mines in third world countries use amalgamation with mercury due to its simplicity, but as it is a very toxic process and has inferior performance, it is not widely used anymore [37]. At the world level, cyanidation is the standard method used for recovering most of the gold extracted today, including agitated tank leaching, heap leaching and carbon adsorption recovery (carbon-in-pulp, carbon-in-leach, carbon-in-column) [32].

3. Methodology and Data Sources

Many mining companies have started to report annually their sustainability and social performance along with their financial results. These reports vary substantially from one company to another but they can be used as an approach to have real information on their performance. Using the reported data it is possible to analyze links between different factors, such as energy consumption, ore grade, mineral production, greenhouse gas emissions, and solid wastes, among others.
A preliminary analysis of several mines and companies has been accomplished to select the ones that provide both consistent and disaggregated information related to energy use on a site by site basis, leading to a total of 38 mines chosen for subsequent analyses. Data have been sourced from numerous companies’ reports, including financial, annual, quarterly and sustainable reports. Years available for each of the mining companies analyzed are shown in the following list:
  • Anglo American (AA). Sustainability Reports; Anglo American PLC: London, UK, 2002–2014.
  • Antofagasta Minerals. Annual Reports, Sustainability Report; Antofagasta Minerals: Santiago, Chile, 2005–2014.
  • Barrick. Sustainability Reports; Barrick: Toronto, ON, Canada, 2006–2012.
  • BHP Billiton (BHPB). Annual Reports, Sustainability Reports; BHP Billiton (BHPB): Melbourne, Australia, 2005–2014.
  • CODELCO. Sustainability Reports; CODELCO: Santiago, Chile, 2000–2014.
  • First Quantum Minerals. Annual Reports, Sustainability Reports; First Quantum Minerals: Toronto, ON, Canada, 2009–2013.
  • Gold Fields Limited. Sustainability Reports; Gold Fields Limited: Johannesburg, South Africa, 2006–2013.
  • Río Tinto. Sustainability Reports; Río Tinto: London, UK, 2000–2007.
  • Lundin Mining. Financial Reports, Sustainability Reports; Lundin Mining: Toronto, ON, Canada, 2007–2014.
  • Milpo. Annual Reports, Sustainability Reports; Milpo: Lima, Peru, 2008–2013.
  • MMG Limited. Financial Reports, Sustainability Reports; MMG Limited: Southbank, Australia, 2009–2014.
  • Newcrest Mining Limited. Annual Reports, Sustainability Reports; Newcrest Mining Limited: Melbourne, Australia, 2006–2014.
  • OZ minerals (OZM). Financial Reports, Sustainability Reports; OZ minerals (OZM): Melbourne, Australia, 2008–2014.
  • Xstrata—Glencore. Annual Reports, Sustainability Reports; Xstrata—Glencore: London, UK, 2001–2014.
Using the information available on the reports of the aforementioned companies, the following data have been compiled when possible for each year and for each individual mine:
  • Ore milled
  • Contained mineral or metal production
  • Average ore grade
  • Electricity and diesel use
  • Waste rock
The quality and consistency of the reports varied significantly between companies and even between different years in the same company. Some of the companies, but still a little portion of the total, have already adopted the Global Reporting Initiative (GRI) protocol, a coalition of the United Nations, industry, government and civil society groups [38]. The aim of this initiative is to provide guidelines to achieve uniform and consistent reports on sustainability performance for different sectors, including mining and metals [39]. The main drawback is that these reports only require general data regarding different social, economic and environmental aspects. For instance, a company that has several mines in operation can provide only aggregated data for the energy consumed within all the owned mines, fulfilling the requirements of the GRI but at the same time making the data of little value to analyze with respect to ore grades, project configuration and other key factors which are known to affect energy intensity. Hence, the extent of quality of data can vary considerably, discrepancies and between different reports have been corrected when possible, but due to the specific mines chosen and the consistency of their reporting, there is expected to be only a minor degree of uncertainty in the data collected herein.

4. Energy Intensity Factors
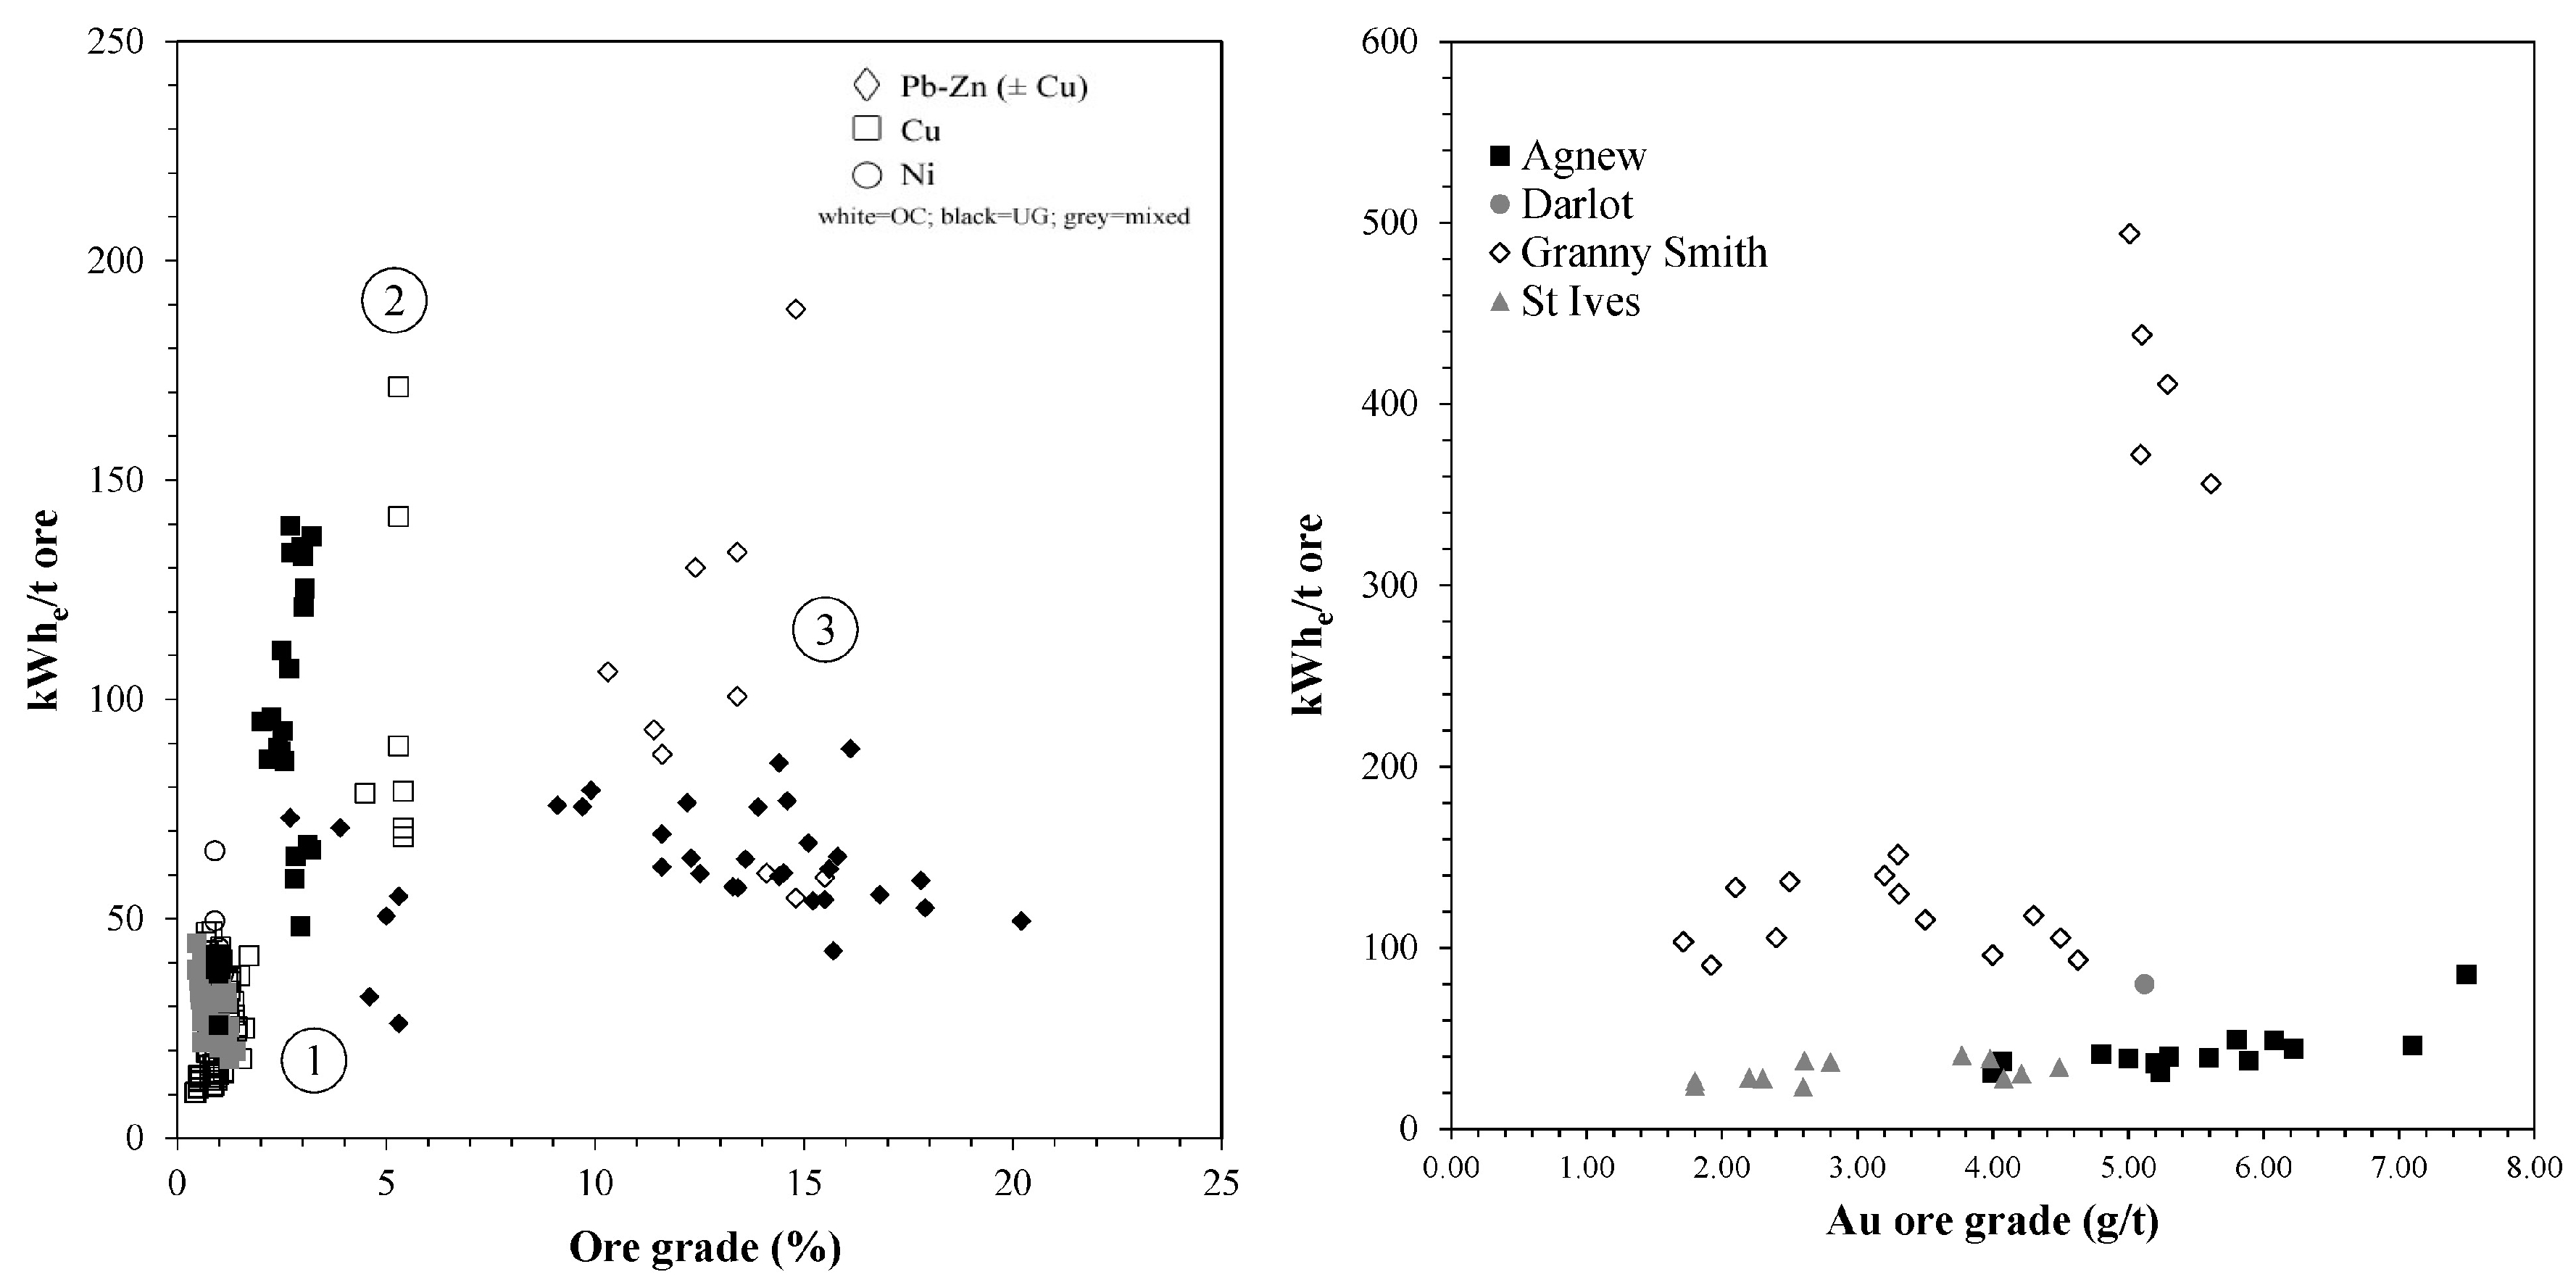
The main data and results for the selected mines, with information of the main metal extracted, mine type and process can be found in Table 1. Each mine site has been categorized based on the metals extracted and the major mining and extraction methods used, separating between underground (UG), open cut (OC) and OC + UG mines. The main methods differentiated in the mining process are mine (M), concentration (C), smelting (S), refining (R) and leaching (L). Additionally, the production of the main metal (in bold in the table) has been included for 2013 when possible.
The main focus of this study has been obtaining information of energy consumption as a function of ore grade, as well as to have a better knowledge of energy intensity use in mining. For this task, the following substances have been included in this study: gold, silver, copper, lead, zinc and nickel. As countries such as Chile, Australia and Peru have been incorporated in the study, approximately between 30% and 40% of the global copper production is being taken into account, as well as half of the Australian gold production.
With the information available, different energy intensity factors have been defined as follows:
(a)
Electricity use (kWh per tonne of total ore mined) as a function of ore grade
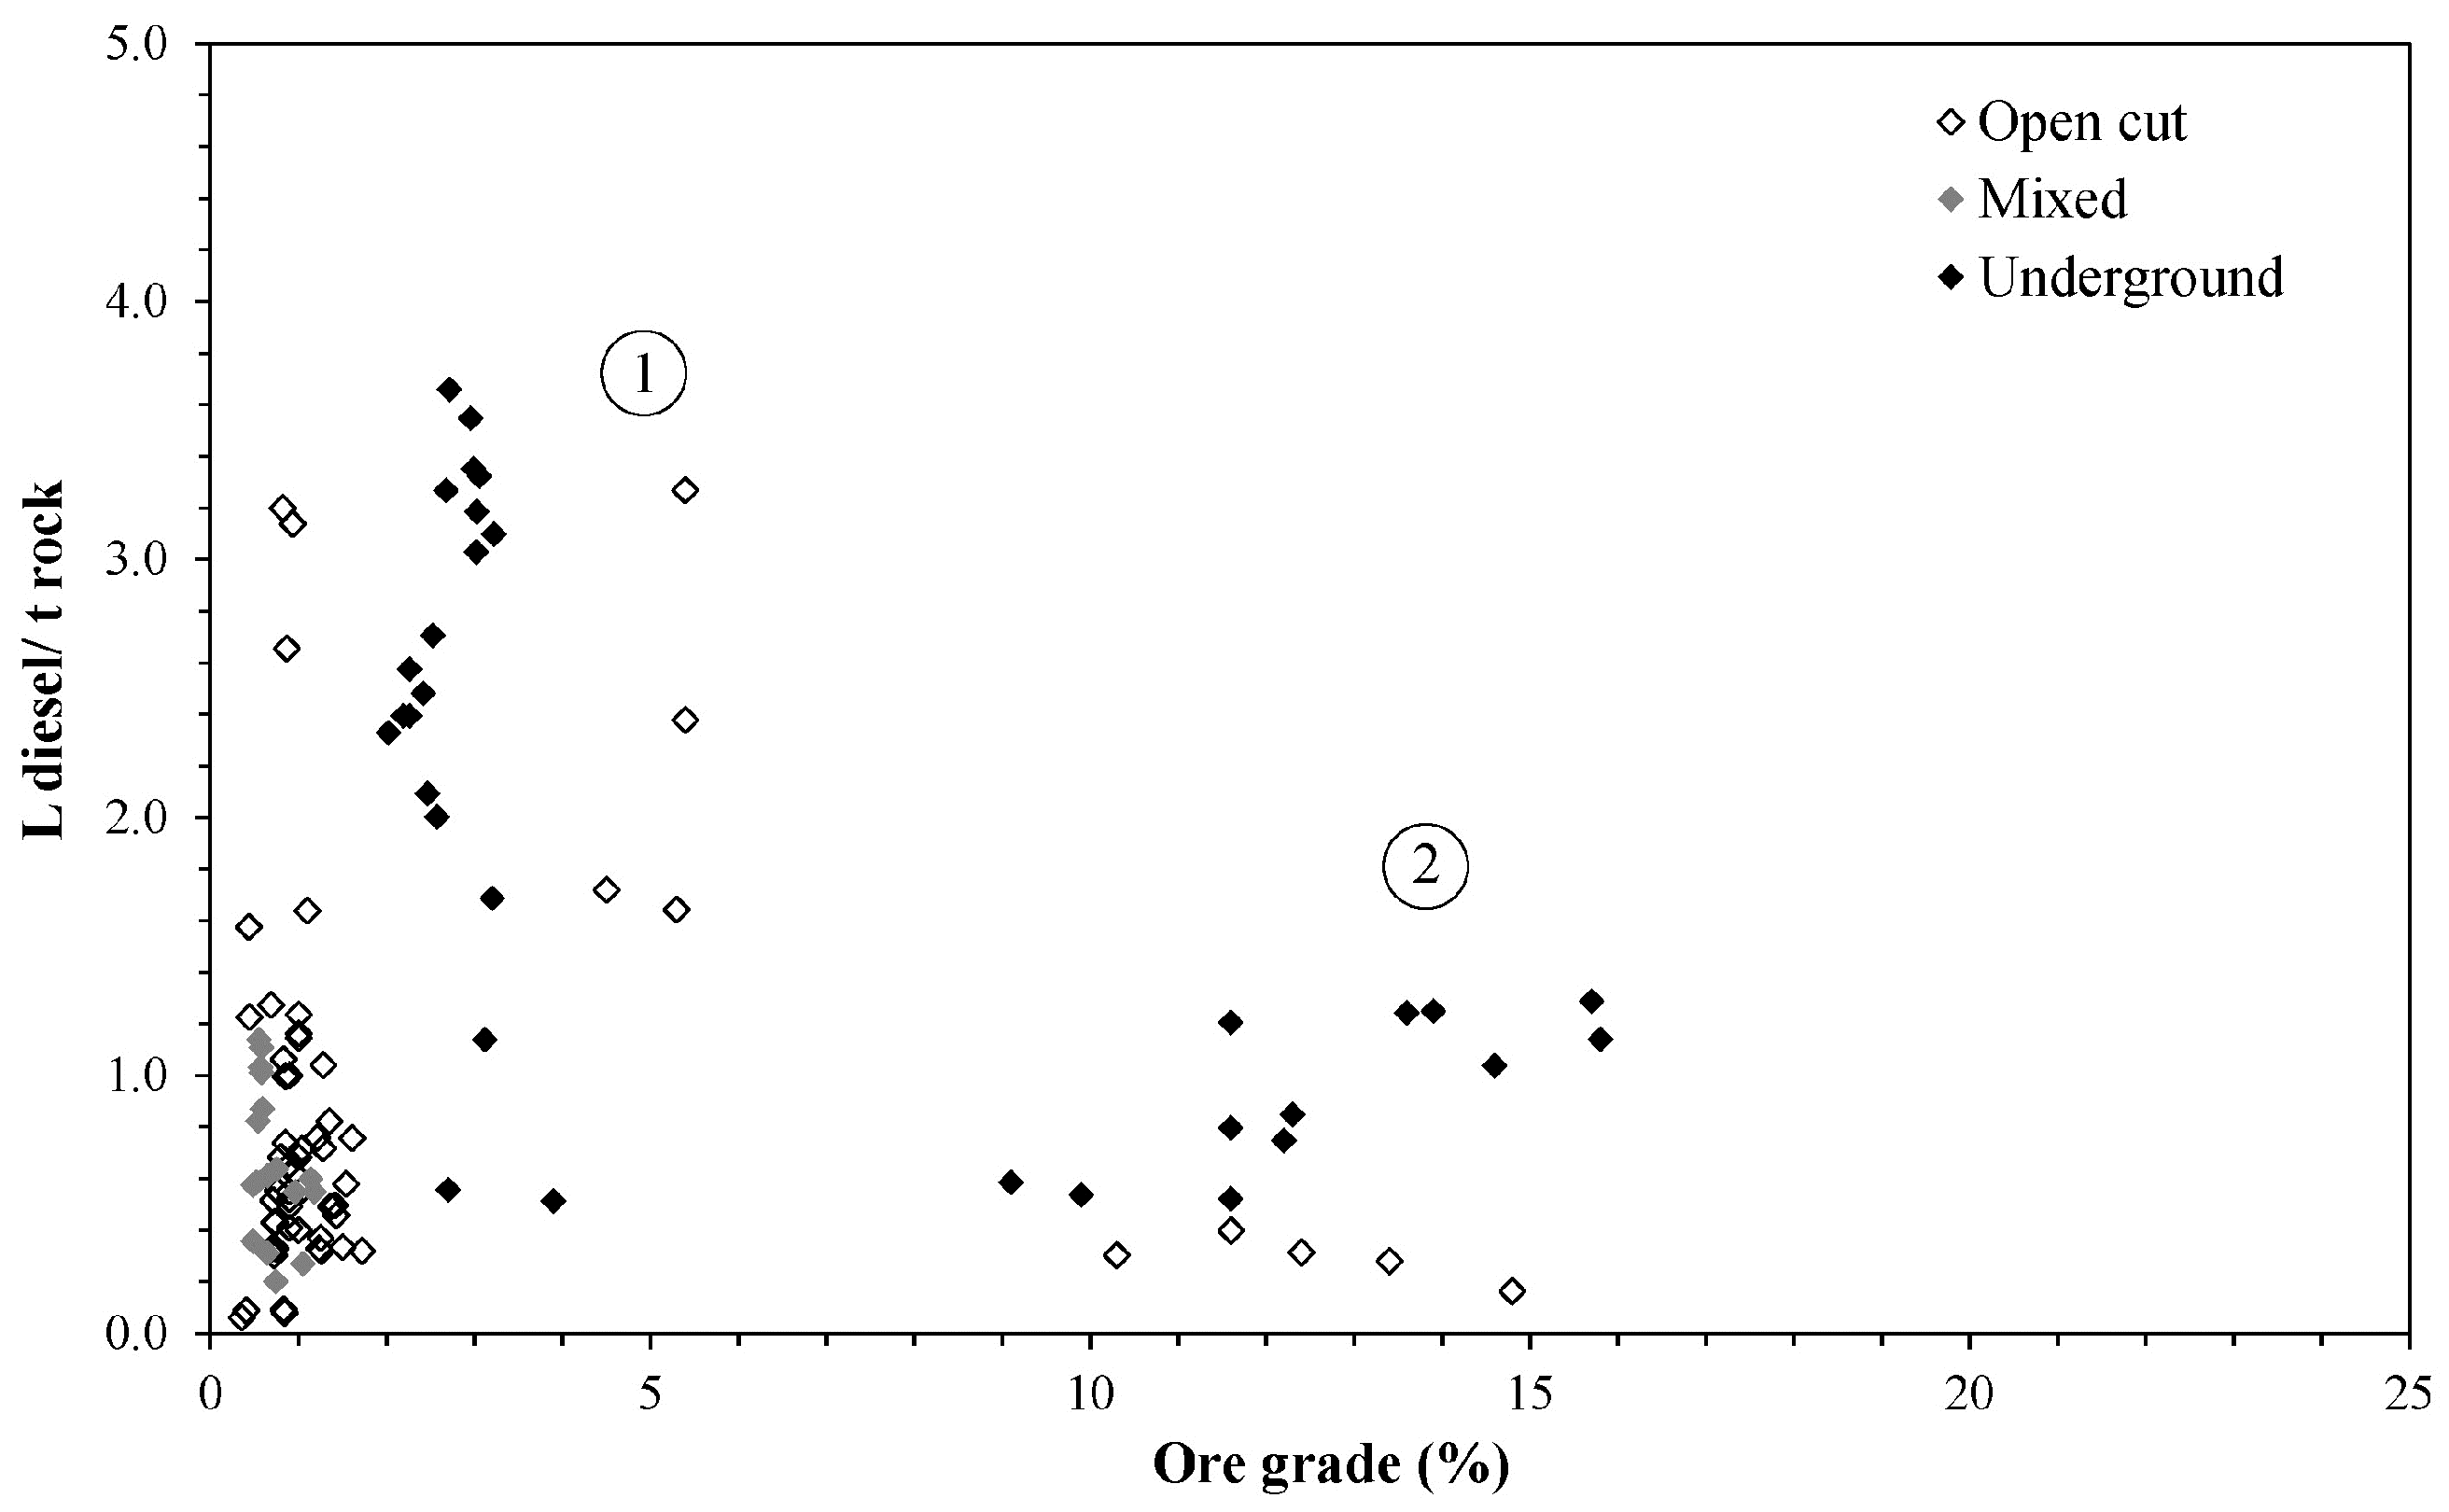
(b)
Litres of diesel per tonne of rock (including waste rock and ore) as a function of ore grade (note that underground rarely report waste rock extracted)
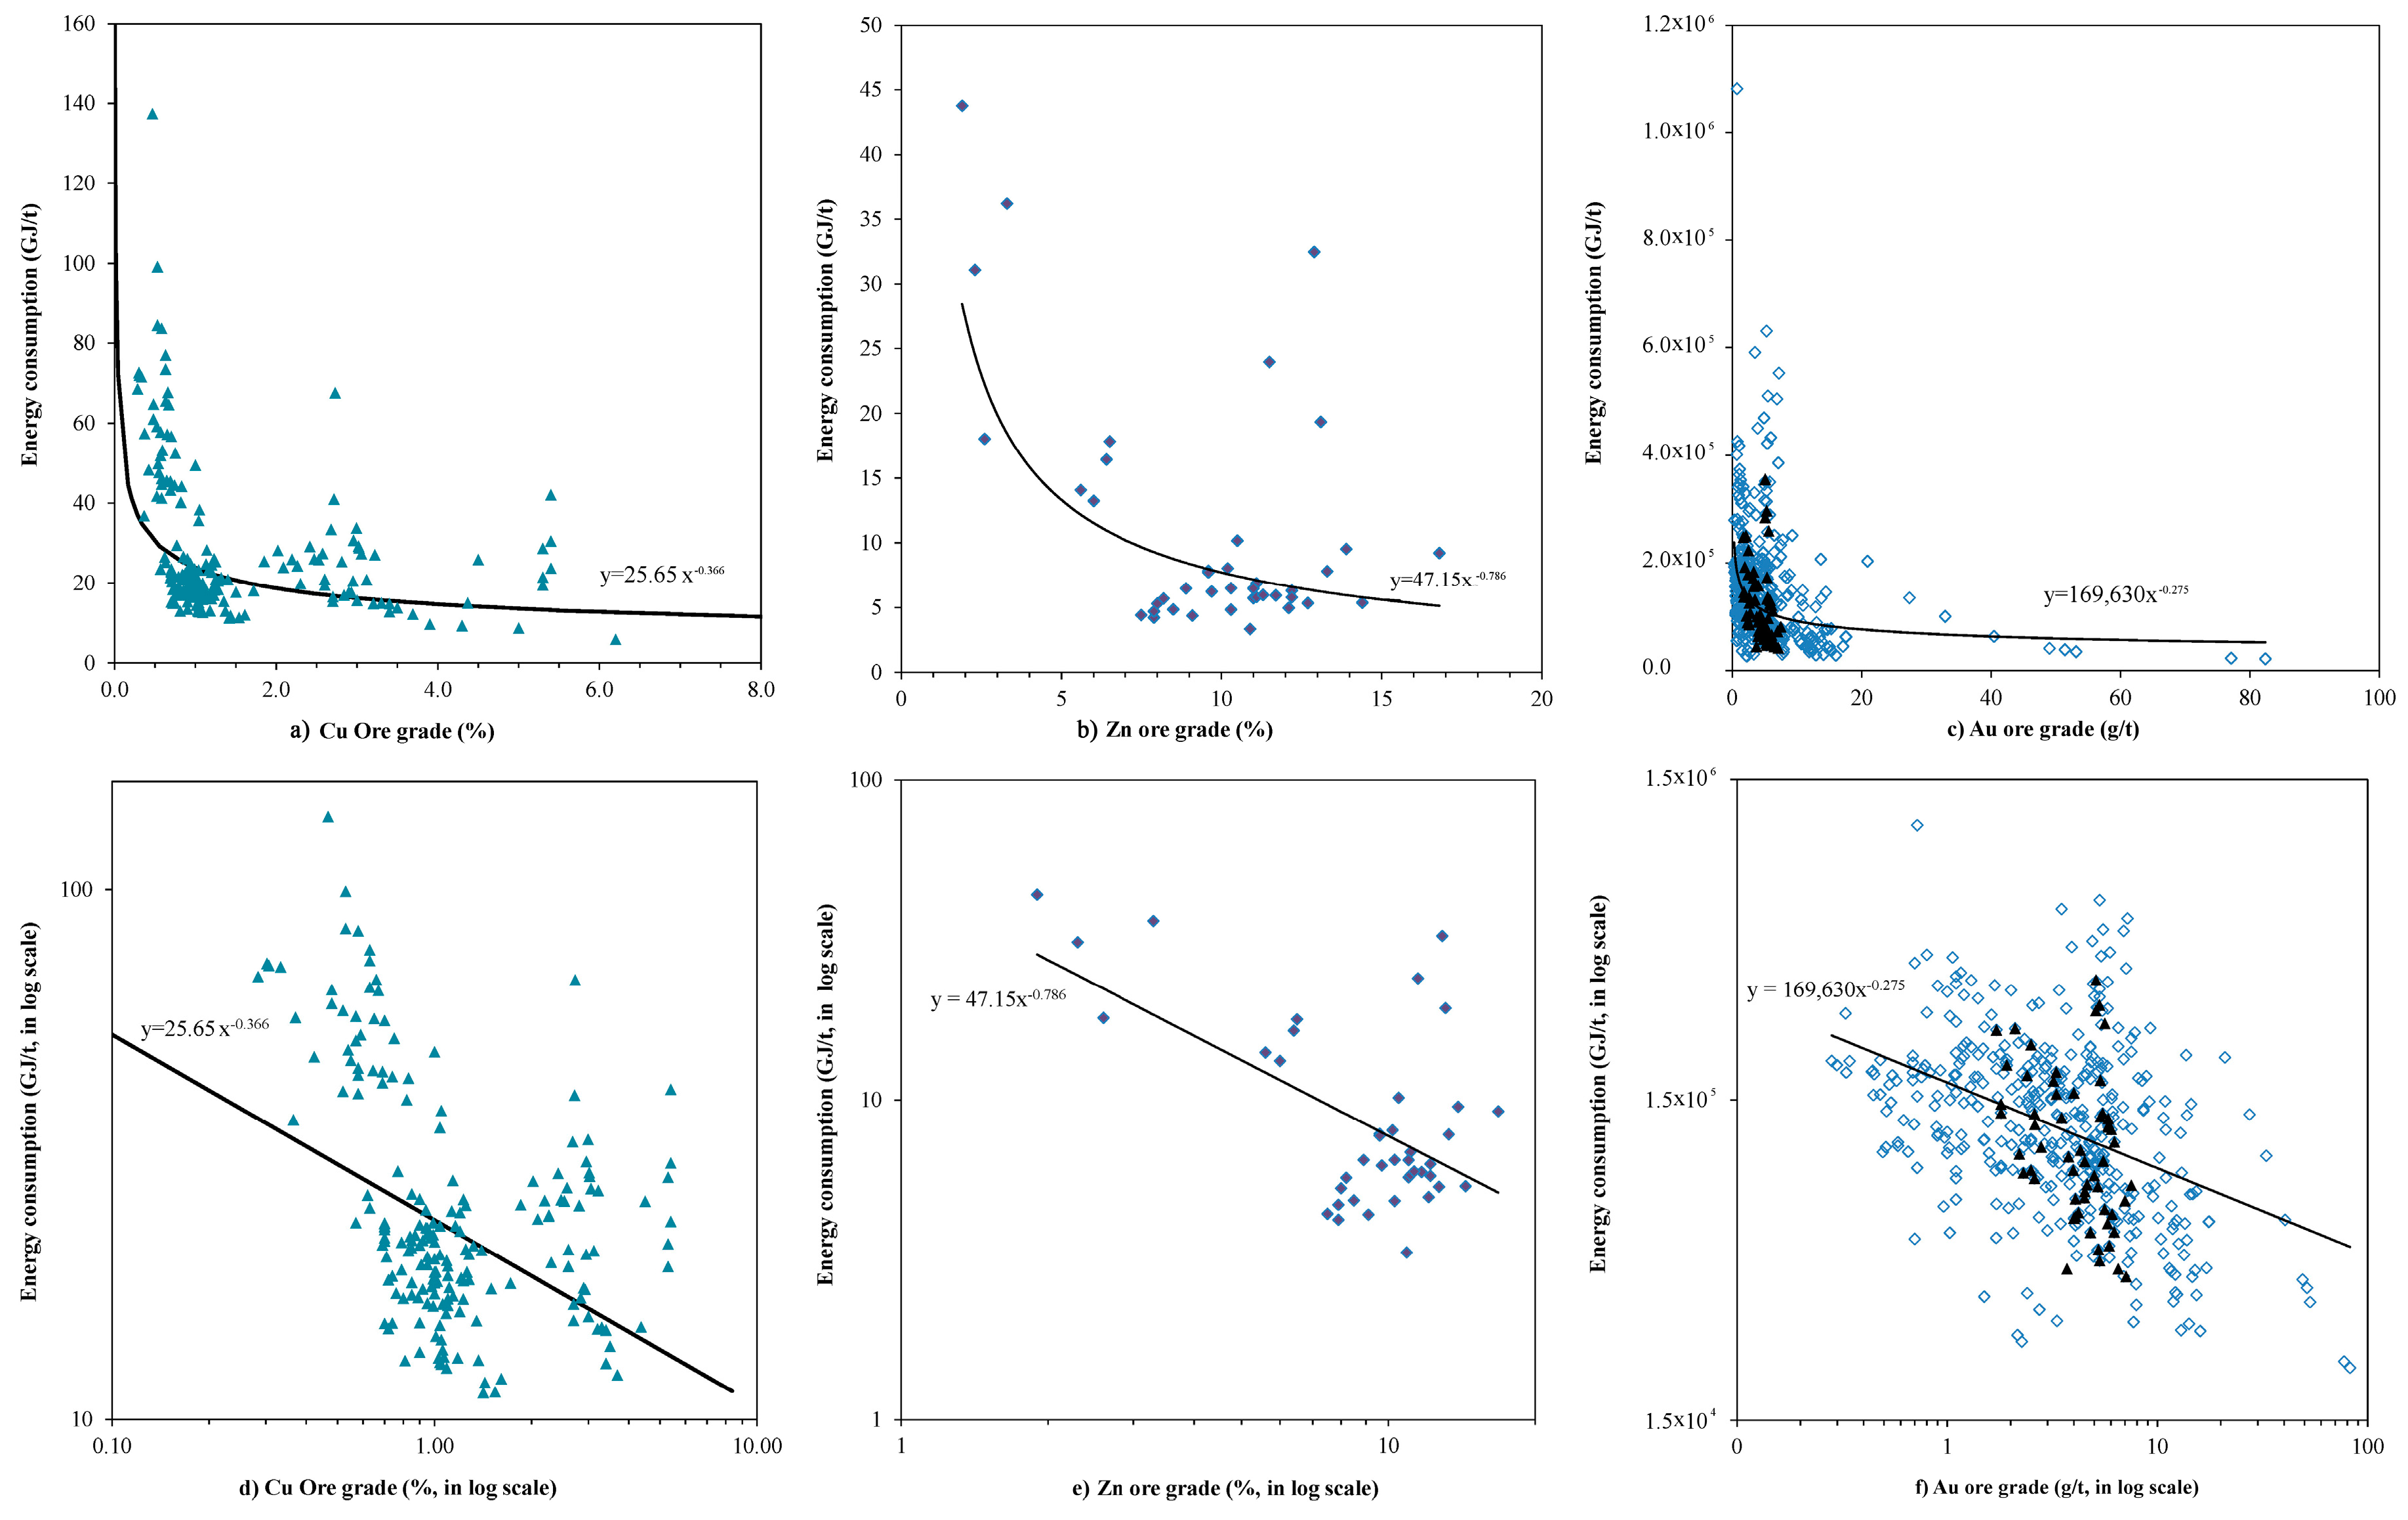
(c)
Total energy consumption (GJ per tonne metal), excluding explosives forces.
For the first two cases, the average data for each mine have been included in the table, as well as the standard deviation and the number of data points available. These data only include information regarding energy consumption inside each mining facility. As for total energy consumption, explosive forces, essential for blasting, have not been included. This is because, even if some mines reported the consumption of ANFO (Ammonium Nitrate-Fuel Oil) its chemical exergy is very low compared to the total energy consumption (less than 0.1% in those mines where information was available). Therefore it can be considered almost negligible.
The electricity intensity use, kWh/t ore as a function of the ore grade, for all the commodities is represented in Figure 1. In the left diagram, there are two series of data sets, as the copper mines usually have lower average ore grades than the lead-zinc mines. There seems to be a link between the amount of electricity used per tonne of ore mined in open cut and underground mines, as the latter increases when the ore grade decreases. In the case of mines that have both open cut and underground facilities, represented in grey in the figure, the data are quite clustered in the lower part of the diagram, and this decreasing tendency is not clear. However, this could be easily explained by the way each mine reports their data as data from underground and open cut mines are reported together and both have very different electricity requirements. Usually, considering the extraction process, underground mines are more intensive in electricity than open cut mines because of mine depth and ventilation [40]. Still, open cut mines have also a considerable amount of electricity demand and it has not been possible to assess the percentages that correspond to each facility in these set of data. Regarding electricity use and type of process configuration, the dependency is not very clear when analyzing the data but there are many other factors that could be influencing this, from each individual process to the equipment used. For instance, in the case of Sepon mine (Laos), the electricity consumption per tonne of ore is very high, and in 2014 more than 20% of the total energy used by the mining company was consumed at this facility (MMG Limited). Sepon mine has unusual extraction and processing methods, as after the ore is extracted, crushed and milled, the ore is directly leached without undergoing any concentration process.
As for electricity intensity use in gold mines (right diagram), only information related to a selected group of Australian gold mines is represented with the average ore grade measured in grams per tonne. Data seem quite dispersed when observing only the ore grade variations but the electricity requirements remains approximately within the same levels, between 25 and 150 kWh/t ore. There is an exception with the Granny Smith mine, as in 2007 the mine changed from an open cut mine only to an underground mine only, the energy use being higher in the latter case. The open cut mine had requirements of 116 kWh/t ore while the underground mine has requirements of 414 kWh/t ore as average, almost four times higher.
Another factor that can be analyzed is the influence of the mining process and configuration in the electricity use per tonne of ore mined. Mines that extract lead and zinc usually have an MC configuration (mine + concentrator). The majority of copper mines also have MC configurations, very few have a smelter and even fewer have MCSR, while a modest number also include an HL-SX/EW circuit. There is only one mine that has an ML configuration (mine + leaching), Sepon (Laos), and as this mining process is quite particular the data regarding electricity use are very different. Regarding gold mines, they all have an MCL configuration (mine + concentrator + leaching).
Diesel intensity use, in liters of diesel per tonne of rock mined, is represented in Figure 2 as a function of the ore grade. Usually diesel is used in mines for transport and machinery and sometimes for electricity production. In the case of diesel used for transport there are two main distinctions, diesel used for transport inside the mine and diesel used for transport outside the mine, although the reports rarely differentiate between each different use in the mine. This could become significantly relevant in the case of older mines, as trucks have to go deeper and further.
In this case, the information of copper, lead, zinc and nickel mines is represented distinguishing between open cut, underground mixed mines (mines that have both open cut and underground facilities). As the mining reports vary considerably regarding this issue, it has not been possible to obtain as many values as for electricity intensity use, but it can still be used to get an overall picture of the diesel consumption in these mines.
Concerning the ore grade and the diesel consumption, it seems that the ore grade has a certain influence on the diesel consumption, although there is not a clear relationship between these two factors in the case of the selected period and mines. Again there is a cluster of data corresponding to the copper mixed mines in the lower part of the diagram, represented in grey, but this could be explained by the way each mine reports the information on diesel use.
Figure 3 shows the trends of total energy consumption as a function of the ore grade, along with the concentration energy (in GJ/t), for the different mines and commodities (Figure 3a: copper, Figure 3b: zinc, Figure 3c: gold); for clarification purposes, these figures are also represented in log-log scale (Figure 3d–f). New data from the gold mines as well as data from previous papers [41] are presented in Figure 3c. It can be observed that the general trend is that the energy consumption increases when the ore grade decreases. Using this information, the average total energy consumption to extract each commodity can be calculated, being 28.2 GJ/t, 11.03 GJ/t and 145,888 GJ/t for copper, zinc and gold respectively.
The above observed trends are a reflection of the Second Law of Thermodynamics, which states that any activity performed implies the destruction of resources—degradation might be controlled and slowed down, but it cannot be avoided in the long run [28]. When the ore grade decreases in the mine, the energy required for metal extraction increases. For this reason mines with higher ore grades are exploited first, leaving the remainder for the future, hoping that technological improvements will offset those costs. But even if technology improves, the exponential character of the Second Law that can be observed in the figure clearly shows that when the ore grade approaches crustal abundance, the energy needed is exponentially higher. Thus, technology can improve extraction but cannot reduce the minimum energy required for the mining process as the minerals become dispersed.

5. Ore Grade and Energy Consumption

One straightforward piece of information that can be obtained with the data of average ore grade reported by the mining companies is the variation of ore grade over time. In the case of the gold mines analyzed, the average ore grade is 5.26 g/t. In the case of the zinc and lead-zinc mines analyzed, the average zinc ore grade is 9.6% and the average lead ore grade is 3.4%. These mines produced more than 1 million tonnes in 2009, which corresponded to approximately 16% of the total zinc world production that same year [42].
A more exhaustive analysis has been carried out in the case of copper mines as there is more reliable and representative information available (Figure 4). A total of 25 copper mines have been included in the analysis from different countries. According to Cox and Singer [29], the average copper ore grade in the mine (xm) was 1.67% around 1990 and in the case of the 25 copper mines analyzed, the average ore grade is 1.48%. These selected mines produced more than 5 million tons in 2009, which corresponded to 32% of the total world production that same year [42].
In general, a decrease of ore grades can be discerned, whether the mine has a high initial copper ore grade, such as Neves-Corvo (Portugal) or Mount Isa (Australia), or a lower copper ore grade, such as Aguablanca (Spain), Telfer (Australia) or El Tesoro (Chile). For example, El Soldado copper mine (Chile) had an average oxide ore grade in 2003 of 1.7% and in 2012 the average ore grade was only 0.46%. As an average, the combined weighted decrease of the copper ore grade in all the mines analyzed was approximately 25% from 2003 to 2013.
Another interesting conclusion that can be drawn observing the data compiled for this study is that the total copper produced in mines with higher ore grades, such as Sepon (Laos), Osborne (Australia) or Mount Isa (Australia), is much lower when compared to low ore grade mines, such as Bingham Canyon (United States), Chuquicamata or Escondida (Chile).
Besides, the total energy consumption as a function of the total mineral produced has been analyzed for all the analyzed Chilean copper mines to observe the relationship between declining ore grades, energy and production over the years, as more historical and accurate data was available (Figure 5).
It remains clear that the total energy consumed in the copper mining projects included in this study as well as the tonnes of copper produced increases over time. In the case of total energy consumption, there is a 46% increase from 2003 to 2013. Additionally, there is a 30% increase of copper produced. Although there is a relationship between increases in production and increases in energy consumption, in this case the first factor increases more acutely than the latter. This general increase is distinctly linked to the exponential extraction that can be observed at a global level, as more energy is needed to produce the minerals to meet society’s demands. Additionally, the decrease in ore grades observed before for those same mines also entails an increase in energy consumption, as more gangue mineral has to be removed from the ore to produce the same amount of concentrate. In the specific case of the mines analyzed, it has not been possible to compile enough information on waste rock and tailings, so the information is representative enough. However, for instance, in the case of copper, there is a clear tendency between decrease of ore grade and increase in waste rock [43]. Therefore the three factors analyzed in this paper, energy consumption, ore grade and production, are closely linked and strongly influence each other.

6. Conclusions

This paper examined the energy intensity in world copper, gold and lead-zinc mines as well as the changes in the energy consumption as a function of the ore grade in the last decade. Several papers have already discussed this issue in specific regions or during the 20th century, and this approach represents an update in a period of time where there has been an explosive growth in demand, especially driven by the demand of developing countries in Asia. The results show that ore grade is gradually decreasing for the selected mines, while production and energy consumption is increasing. This tendency has been proven for the case of copper, as more accurate information was available regarding energy use and ore grade. Therefore, decreasing ore grades is no longer a theoretical issue but a global reality in the case of mines in operation, caused by the increasing demand of raw materials.
Yet it is important to point out that information regarding ore grade in mines that are still not in operation or not even discovered is lacking. Indeed, as high ore grade mines get gradually exhausted other mines are put into operation to cover increasing material demands. The exploration of new deposits is very influenced by commodity prices, which have suffered continuous changes over time, and have even begun to decrease in some cases. Even if new mines with higher ore grades could open in the short term to replace the ones that are exhausted, new factors come into play. Such is the case of environmental restrictions of different countries where deposits are known to exist, which makes extraction non-profitable under those restrictive conditions. Other factors could be related to the availability of energy sources and water limitations. Additionally, development of new technologies and processes could also influence the amount of energy and resources that are needed to produce the commodities.
That said, it is a fact that the current pattern of extraction and its increasing energy consumption puts great pressure on the environment, generating larger amounts of waste rock, greenhouse gas emissions, water demands and social costs. Continuing this trend implies two broad options. One is to open new mines with likely lower ore grades but higher environmental impacts and/or stronger regulatory restrictions. The second one is continuing the exploitation of older mines for which permits are already acquired, but with escalating energy and environmental costs.
As mining is still going to be one of the main ways to meet the world’s resource requirements, along with recycling, more comprehensive studies should be carried out considering the scarcity of raw materials in the accounting system to improve resource management and to promote the sustainable use of natural resources.

Acknowledgments

This paper has been carried out under the framework of the ENE2014-59933-R project, financed by the Spanish Ministry of Economy and Competitiveness and MEDEAS (Guiding European Policy toward a low-carbon economy: Modelling Energy system Development under Environmental and Socioeconomic constrains), Grant Agreement number 691287, financed by the European Commission within the context of the H2020 programme. In-kind support from Monash University, Australia, for an extended research visit in mid-2015 is also acknowledged.

Author Contributions

This paper was elaborated with information gathered by Guiomar Calvo during a PhD research stay at Monash University (Australia), under the supervision of Gavin Mudd. The PhD thesis of Guimar Calvo was supervised by Alicia Valero and Antonio Valero (Universidad de Zaragoza, Spain). All the authors have contributed to the writing and revision process of the paper.

Conflicts of Interest

The authors declare no conflicts of interest.

References

  1. Kippenberger, C. Materials Flow and Energy Required for the Production of Selected Mineral Commodities—Summary and Conclusions (Geologisches Jahrbuch); Schweizerbart: Stuttgart, Germany, 2001. [Google Scholar]
  2. USGS. Mineral Commodity Summaries 2015; United States Geological Service: San Antonio, TX, USA, 2015.
  3. Krausmann, F.; Gingrich, S.; Eisenmenger, N.; Erb, K.; Haberl, H.; Fischer-Kowalski, M. Growth in global materials use, GDP and population during the 20th century. Ecol. Econ. 2009, 68, 2696–2705. [Google Scholar] [CrossRef]
  4. Meinert, L.; Robinson, G.; Nassar, N. Mineral Resources: Reserves, Peak Production and the Future. Resources 2016, 5, 14. [Google Scholar] [CrossRef]
  5. International Energy Agency. International Energy Outlook; International Energy Agency: Paris, France, 2016. [Google Scholar]
  6. Mudd, G. Global trends in gold mining: Towards quantifying environmental and resource sustainability. Resour. Policy 2007, 32, 42–56. [Google Scholar] [CrossRef]
  7. Mudd, G. Key trends in the resource sustainability of platinum group elements. Ore Geol. Rev. 2012, 46, 106–117. [Google Scholar] [CrossRef]
  8. Mudd, G. The future of Yellowcake: A global assessment of uranium resources and mining. Sci. Total Environ. 2014, 472, 590–607. [Google Scholar] [CrossRef]
  9. Northey, S.; Mohr, S.; Mudd, G.; Weng, Z.; Giurco, D. Modelling future copper ore grade decline based on a detailed assessment of copper resources and mining. Resour. Conserv. Recycl. 2014, 83, 190–201. [Google Scholar] [CrossRef]
  10. Drielsma, J.A.; Allington, R.; Brady, T.; Guinée, J.; Hammarstrom, J.; Hummen, T.; Russell-Vaccari, A.; Schneider, L.; Sonnemann, G.; Weihed, P. Abiotic raw-materials in life cycle impact assessments: An emerging consensus across disciplines. Resources 2016, 5, 12. [Google Scholar] [CrossRef]
  11. Drielsma, J.A.; Russell-Vaccari, A.; Drnek, T.; Brady, T.; Weihed, P.; Mistry, M.; Simbor, L.P. Mineral resources in life cycle impact assessment—Defining the path forward. Int. J. Life Cycle Assess. 2015, 21, 85–105. [Google Scholar] [CrossRef]
  12. West, J. Decreasing Metal Ore Grades: Are They Really Being Driven by the Depletion of High-Grade Deposits? J. Ind. Ecol. 2011, 15, 165–168. [Google Scholar] [CrossRef]
  13. Mudd, G.M.; Jowitt, S.M. A detailed assessment of global nickel resource trends and endowments. Econ. Geol. 2014, 109, 1813–1841. [Google Scholar] [CrossRef]
  14. Swart, P.; Dewulf, J. Quantifying the impacts of primary metal resource use in life cycle assessment based on recent mining data. Resour. Conserv. Recycl. 2013, 73, 180–187. [Google Scholar] [CrossRef]
  15. USGS. Mineral Commodity Summaries 2016; United States Geological Service: San Antonio, TX, USA, 2016.
  16. Sverdrup, H.; Ragnarsdottir, K.V.; Koca, D. On modelling the global copper mining rates, market supply, copper price and the end of copper reserves. Resour. Conserv. Recycl. 2014, 87, 158–174. [Google Scholar] [CrossRef]
  17. Mudd, G.; Weng, Z. Base Metals. In Materials for a Sustainable Future; Letcher, T.M., Scott, J.L., Eds.; Royal Society of Chemistry: London, UK, 2012. [Google Scholar]
  18. Mudd, G. The Ultimate Sustainability of Mining. Linking Key Mega-Trends with 21st Century Challenges. In Proceedings of the Sustainable Mining Conference, Kalgoorlie, WA, USA, 17–19 August 2010.
  19. Mudd, G.; Weng, Z.; Jowitt, S. A Detailed Assessment of Global Cu Resource Trends and Endowments. Econ. Geol. 2013, 108, 1163–1183. [Google Scholar] [CrossRef]
  20. Gordon, R.B.; Bertram, M.; Graedel, T. Metal stocks and sustainability. Proc. Natl. Acad. Soc. USA 2006, 103, 1209–1214. [Google Scholar] [CrossRef]
  21. Valero, A.; Valero, A. Physical geonomics: Combining the exergy and Hubbert peak analysis for predicting mineral resources depletion. Resour. Conserv. Recycl. 2010, 54, 1074–1083. [Google Scholar] [CrossRef]
  22. Sverdrup, H.U.; Ragnarsdottir, K.; Koca, D. An assessment of metal supply sustainability as an input to policy: Security of supply extraction rates, stocks-in-use, recycling, and risk of scarcity. J. Clean. Prod. 2015, 140, 359–372. [Google Scholar] [CrossRef]
  23. Laherrère, J.H. Copper peak. The oildrum Europe 2010, 6307, 1–27. [Google Scholar]
  24. Valero, A.; Valero, A. A prediction of the exergy loss of the world’s mineral reserves in the 21st century. Energy 2011, 36, 1848–1854. [Google Scholar] [CrossRef]
  25. Ayres, R.U.; Ayres, L.W.; Rade, I. The Life Cycle of Copper, Its Co-Products and Byproducts; Technical Report; International Institute for Environment and Development (IIED): London, UK, 2002. [Google Scholar]
  26. Ullmann, F.; Gerhartz, V. Ullmann’s Encyclopedia of Industrial Chemistry; John Wiley and Sons: Hoboken, Belgium, 2002. [Google Scholar]
  27. Schlesinger, M.; King, M.; Sole, K.; Davenport, W. Extractive Metallurgy of Copper; Elsevier: Amsterdam, The Netherlands, 2011. [Google Scholar]
  28. Valero, A.; Valero, A. Thanatia: The Destiny of the Earth’s Mineral Resources: A Thermodynamic Cradle-to-Cradle Assessment; World Scientific Publishing Company: Singapore, 2014. [Google Scholar]
  29. Cox, D.P.; Singer, D.A. (Eds.) Mineral Deposit Models; US Geological Survey: Lawrence, KA, USA, 1992.
  30. Mudd, G.M. Historical trends in base metal mining: Backcasting to understand the sustainability of mining. In Proceedings of the 48th Annual Conference on Metallurgists, Canadian Metallurgical Society, Sudbury, ON, Canada, 23–26 August 2009.
  31. Sverdrup, H.U.; Ragnarsdottir, K.V. Natural resources in a planetary perspective. Geochem. Perspect. 2014, 3, 129–341. [Google Scholar] [CrossRef]
  32. U.S. Department of Energy. Energy and Environmental Profile of the U.S. Mining Industry; U.S. Department of Energy: Washington, DC, USA, 2002.
  33. Norgate, T.E.; Jahanshashi, S.; Rankin, W. Assessing the environmental impact of metal production processes. J. Clean. Prod. 2007, 15, 838–848. [Google Scholar] [CrossRef]
  34. Grimes, S.; Jonaldson, J.; Cebrian Gomez, C. Report on the Environmental Benefits of Recycling; Tech. Report; Centre for Sustainable Production & Resource Efficiency (CSPRE), Imperial College London, Commissioned by the Bureau of International Recycling: London, UK, 2008. [Google Scholar]
  35. Sverdrup, H.; Koca, D.; Granath, C. Modeling the gold market, explaining the past and assessing the physical and economical sustainability of future scenarios. In Proceedings of the 30th International Conference of the System Dynamics Society, University of St. Gallen, St. Gallen, Switzerland, 22–26 July 2012; Husemann, E., Lane, D., Eds.; pp. 4002–4023.
  36. World Gold Council. Available online: http://www.gold.org/ (accessed on 30 10 2016).
  37. Veiga, M.M.; Angeloci, G.; Hitch, M.; Colon Velasquez-Lopez, P. Processing centres in artisanal gold mining. J. Clean. Prod. 2014, 64, 535–544. [Google Scholar] [CrossRef]
  38. Global Reporting Initiative (GRI). Sustainability Reporting Guidelines; Global Reporting Initiative (GRI): Amsterdam, The Netherlands, 2006. [Google Scholar]
  39. Global Reporting Initiative (GRI). Sustainability Reporting Guidelines & Mining and Metals Sector Supplement; Global Reporting Initiative (GRI): Amsterdam, The Netherlands, 2011. [Google Scholar]
  40. Northey, S.; Haque, N.; Mudd, G. Using sustainability reporting to assess the environmental footprint of copper mining. J. Clean. Prod. 2013, 40, 118–128. [Google Scholar] [CrossRef]
  41. Domínguez, A.; Valero, A. Global gold mining: Is technological learning overcoming the decline in ore grades? J. Environ. Acc. Manag. 2013, 1, 85–101. [Google Scholar] [CrossRef]
  42. USGS. Mineral Commodity Summaries 2010; United States Geological Service: San Antonio, TX, USA, 2010.
  43. Mudd, G.M. The Sustainability of Mining in Australia: Key Production Trends and Their Environmental Implications for the Future; Research Report No RR5; Department of Civil Engineering, Monash University and Mineral Policy Institute: Melbourne, Australia, 2009. [Google Scholar]
Figure 1. Electricity use (in kWh per tonne of ore) as a function of ore grade; each data point represents a year of production of a mine site. Code = 1: copper ore mines (both underground and open cut facilities, in grey); 2: copper mines; 3: zinc mines.
Resources 05 00036 g001
Figure 2. Diesel intensity (in L diesel/t rock) as a function of ore grade for each metal (in %) by mine type; each data point represents a year of production of a mine site. Code = 1: copper mines; 2: zinc mines.
Resources 05 00036 g002
Figure 3. Energy requirements (in GJ/t) for copper, zinc and gold production as a function of the ore grade.
Resources 05 00036 g003
Figure 4. Evolution of copper ore grade for selected mines over the years. For explicative purposes, the combined weighted average ore grade has been represented as well.
Resources 05 00036 g004
Figure 5. Total energy (GJ) and tonnes of copper produced for all the Chilean mines.
Resources 05 00036 g005
Table 1. Average energy intensity use for selected mines. Mine type: OC—open cut; UG—Underground. Process: M—Mine, C—Concentrator, S—Smelter, R—Refinery, L—Leaching. For kWh/t ore and L diesel/t rock the average number is provided as well as the standard deviation, the number in brackets represents the number of data points for each mine.
MineCompanyMain MetalsMine TypeMine Process2013 Production of Main Metal (t)Average kWh/t OreAverage L Diesel/t RockPeriod Reported
Australia
Granny SmithGoldfieldsAuOC + UGMCL7185 (kg)199 ± 141 (18)2.5 ± 1.9 (18)1989–2013
AgnewGoldfieldsAuOC + UGMCL6718 (kg)43 ± 14 (14)0.6 ± 0.4 (5)1991–2009
St IvesGoldfieldsAuOC + UGMCL12,533 (kg)31 ± 6 (14)1.5 ± 0.6 (6)1991–2009
DarlotGoldfieldsAuUGMCL2482 (kg)80 (1)-1993–2007
Cadia ValleyNewcrest MiningCu-AuOCMS56,971 (2)53 ± 4 (6)-2004–2009
Ernest HenryGlencoreCu-AuOCMC35,562 (2)49 ± 7 (6)-1998–2007
Mount Isa (Cu)GlencoreCu-AgUGMCS142,705 (1)81 ± 34 (6)1.1 (1)2005–2012
OsborneBarrickCu-AuOC + UGMC41,270 (2)---
Prominent HillOZ MineralsCu-AgOCMC73,36264 ± 25 (6)0.5 ± 0.2 (6)2009–2014
Olympic DamBHP BillitonCu-U-Ag-AuUGMCSRL166,200107 ± 23 (17)2.8 ± 0.6 (17)1991–2014
TelferNewcrest MiningCu-AuOC + UGMC32,906 (2)124 ± 13-2005–2009
CanningtonBHP BillitonPb-AgUGMC210,815 (3)---
McArthur RiverGlencoreZn-Pb-AgOC + UGMC203,30060 ± 5 (5)-2006–2010
CenturyMMGZn-Pb-AgOCMC488,233120 ± 35 (7)-2009–2014
Golden GroveMMGZn-Cu-Ag-AuUGMC23,61955 ± 7 (7)-2009–2014
RoseberyMMGZn-Pb-Cu-Ag-AuUGMC88,36962 ± 12 (7)-2009–2014
Chile
Mantos BlancosAngloAmericanCuOCMCSL54,60015 ± 3 (10)-2002–2014
El SoldadoAngloAmericanCuOC + UGMCL51,50028 ± 7 (11)0.4 ± 0.2 (4)2002–2014
MantoverdeAngloAmericanCuOCML56,80012 ± 2 (11)0.7 ± 0.8 (4)2002–2014
El TesoroAntofagasta MineralsCuOCMCL102,60031 ± 7 (7)0.3 ± 0.1 (5)2007–2014
MichillaAntofagasta MineralsCuOC + UGMCL38,30034 ± 2 (5)0.5 ± 0.2 (4)2007–2014
EscondidaBHP BillitonCuOCMCL1,193,68031 ± 13 (12)0.7 ± 0.3 (12)2001–2014
Radomiro TomicCODELOCLCuOCMCL379,58913 ± 1 (3)1.5 (1)2011–2013
CollahuasiAngloAmerican and GlencoreCu-MoOCMCL444,50920 ± 1 (10)1.4 ± 1.1 (10)2002–2014
Los PelambresAntofagasta MineralsCu-MoOCMCL405,30027 ± 10 (8)0.4 ± 0.1 (8)2007–2014
ChuquicamataCODELCOCu-MoOCMCSL339,01246 ± 1 (3)1.2 ± 0.2 (2)2000–2013
Los BroncesAngloAmericanCu-MoOCMCSL416,30020 ± 8 (11)0.9 ± 0.6 (7)2002–2014
División AndinaCODELCOCu-Mo-AgOC + UGMC236,71525 ± 3 (12)1.9 ± 2.2 (9)2001–2013
SalvadorCODELCOCu-Mo-Ag-AuOC + UGMSCL54,24234 ± 6 (12)0.8 ± 0.3 (9)2001–2013
El TenienteCODELCOCu-Mo-Ag-AuUGMCS450,39039 ± 4 (12)-2001–2013
Laos
SeponMMGCu-AuOCML90,030100 ± 40 (7)2.3 ± 0.8 (4)2008–2014
Peru
El PorvenirMilpoZn-Pb-CuUGMC117,62853 ± 3 (2)-2008–2013
Cerro LindoMilpoZn-Pb-CuUGMC278,23429 ± 4 (2)-2008–2013
AntaminaBHP Billiton, Glencore, TeckZn-Cu-Mo (Ag,Pb)OCMCL73,913 (1)
Portugal
Neves-CorvoLundin MiningZn-Cu-Pb-AgUGMC53,38571 ± 6 (7)0.6 ± 0.1 (6)2007–2014
Spain
AguablancaLunding MiningNi-CuOCMC624244 ± 12 (7)0.5 ± 0.1 (5)2007–2014
Sweden
ZinkgruvanLundin MiningZn-Pb-Cu-AgUGMC71,36675 ± 7 (6)1.0 ± 1.0 (6)2007–2014
United States
Bingham CanyonRio TintoCu-AuOCMCSR212,200 (3)112 ± 7 (5)-2003–2007
(1) Data corresponds to 2012 production; (2) data corresponds to 2009 production; (3) data corresponds to 2007 production.

