1. Introduction
Mineral resource depletion and mineral capital management are critical issues that need to be addressed objectively and efficiently on an international scale across disciplines and professions. According to Krausmann
et al. [
1] the global total of material extraction has multiplied eightfold since the beginning of the 20th century. The highest increase corresponds to construction minerals and ore/industrial minerals, which grew by a factor of 34 and 27, respectively. In the European Union, domestic material consumption (DMC) is the main flow indicator within material flow accounting (MFA), a system which quantifies extractive activities in tonnes [
2]. DMC measures the annual amount of raw materials extracted nationally, plus imports minus exports. A related concept is domestic extraction which considers the annual amount of raw materials (except water and air), extracted on a national level. The ratio between domestic extraction (DE) and DMC may be used to indicate national dependence on mineral extraction and trade, hence why Weisz
et al. [
3] refer to it as a “domestic resource dependency” ratio. One way to complement this ratio is through exergy replacement costs (ERC) [
4].
ERC quantitatively evaluate the effort, or useful energy, needed to re-concentrate extracted mineral wealth with current best available technology. ERC depend on the mineral’s composition, a deposit’s average ore grade and the energy intensity of the mining and beneficiation process. Consequently, scarcer minerals, such as gold or mercury, carry more weight in this non-conventional accounting process, than the common minerals of, say, limestone or phosphate rock. This is useful because mass, the predominate measure of resource extraction, and used in the DMC, does not take quality into consideration and is thus not robust enough to properly assess the loss of mineral capital. The quality of a mineral deposit is a key consideration when it comes to evaluating sustainable development, specifically in terms of mineral scarcity and criticality. Quality and not just quantity measurements, translate into a more reliable set of results from which national and international policymakers can improve sustainable assessments and make informed decisions. These themes are currently under discussion and of foremost importance in various States [
5,
6,
7].
2. Methodology
Using a thermoeconomic approach, via the unit exergy and more specifically ERC, the authors undertake a comparative case study between an exporting (Colombia) and importing (Spain) country to assess the effect trade has on their respective mineral capital. Exergy, and specifically, its application in the novel thermoeconomic branch of Physical Geonomics, first introduced by Valero [
8], is one method that can, through its objective measure of quality, permit a more rigorous data analysis of mineral depletion. Exergy has been traditionally used to quantitatively measure any energy, such as heat, in terms of its pure forms (mechanical work or electricity) and may be used as an efficiency gauge which states the maximum amount of work that can be obtained when a system is brought to equilibrium with the surrounding environment. This is because, from a physical perspective, and according to the Second Law of Thermodynamics, energy is always conserved at the expense of exergy, which is always destroyed, unless the process is 100 percent reversible. In the same way, exergy can be used to assess the quality of material flows such as mineral resources [
9,
10].
The mineral capital assessment is accomplished through ERC, on the basis that the greater the difference between the concentration of a randomly dispersed mineral in the Earth’s crust (x
c) to that in an accumulation that could be mined (x
m), the greater the exergy registered. This in turn explains why the exergy (and energy) consumed in mining increases exponentially, tending towards infinity, as concentration and particle size decreases. The key to making an exergy analysis suitable for any abiotic resource evaluation—that of minerals as well as water—is the appropriateness of the chosen reference point. Reference baselines that could be used include the conventional Reference Environment [
11] or the commercially dead planet, Thanatia [
12]. The former is commonly used to assess the chemical exergy of elements. However, it is rejected in this instance because it does not consider the exergy required to recuperate minerals in terms of their crustal concentration. The baseline reference employed in this paper is that of Thanatia because it can be used to give an estimate of the Earth’s current level of degradation, since it includes a list of minerals with their respective concentrations in the crust [
13,
14]. The latter constitutes the lower ore grade limit. Taking this into account, the concentration exergy of each mineral can be calculated as follows (Equation (1)):
where
xi is the concentration of substance
i,
R is the gas constant (8.314 J/molK) and
T0 is the reference temperature (298.15 K). Note, this formula is only valid for ideal gas mixtures and when no chemical cohesion among the substances exists. It is valid for solid mixtures.
The difference obtained between the concentration exergies of a mineral concentration in a mineral deposit (x
m) and that of average concentration in the Earth’s crust,
i.e., Thanatia (x
c) is the minimum amount of energy that Nature had to spend to concentrate the minerals in a deposit (Equation (2)).
The exergy replacement costs (
b*) are calculated as follows (Equation (3)):
where
k is a dimensionless variable that represents the unit exergy cost of a mineral, defined as the ratio between the energy invested in the real obtaining process for mining and concentrating the mineral, and the minimum theoretical energy required if the process from the ore to the final product was reversible. Therefore,
k is a measure of the irreversibility of man-made processes and amplifies maximum exergy by a factor of ten to several thousand times, depending on the commodity analyzed.
Another way to understand the relevance of mineral capital losses, caused by domestic extraction, is to convert exergy replacement costs into money, through current energy prices. Together with the DMC ratio, of Equation (4), the impact that economic costs associated with mineral depletion may have on GDP and sustainable development can be assessed.
Note that Equation (4) can be calculated in terms of mass or exergy units, and DE can be replaced with import or export flows to evaluate their respective ratios.
The monetary cost of reversing the extractive process using current energy quantities and prices, can be represented in Equation (5):
where,
p corresponds to the national or world market price of the total amount of energy, from a given source (coal, oil, gas, electricity), required to reverse the mining and beneficiation process and effectively place a mineral back into its original deposit, using current best available technology.
In the case of fossil fuels, economic costs can be directly calculated using their corresponding market prices of the year under consideration. The prices used are the price per barrel in the case of oil, the UK Heren NBP Index price for natural gas and the Northwest Europe marker price for coal [
15,
16]. For non-fuel minerals the authors considered a range. The lower boundary is calculated assuming that coal is used to re-concentrate mineral capital. The upper boundary calculates with electricity. Electricity prices were obtained from the national statistics services of both respective countries.
The minerals considered are presented in
Table 1. The detailed methodology for obtaining the non-fuel mineral data, included in this table, is described in [
17]. In the case of fossil fuels, since once they are consumed and burned they cannot be replaced, their exergy content corresponds to their high heating values [
18].
Table 1.
Exergy replacement costs of the minerals considered in this study [
17]).
Table 1.
Exergy replacement costs of the minerals considered in this study [17]).
| Substance | Mineral Ore | Exergy Replacement Costs (GJ/ton) | Minerals Analysed for Colombia | Minerals Analysed for Spain |
|---|
| Non fuels |
| Aluminium | Gibbsite | 627.3 | | X |
| Antimony | Stibnite | 474.5 | | X |
| Arsenic | Arsenopyrite | 399.8 | | X |
| Bismuth | Bismuthinite | 489.2 | | X |
| Cadmium | Greenockite | 5898.4 | | X |
| Chromium | Chromite | 4.5 | | X |
| Cobalt | Linaeite | 10871.9 | | X |
| Copper | Chalcopyrite | 110.4 | X | X |
| Fluorspar | Fluorite | 182.7 | | X |
| Gold | Native gold | 583668.4 | X | X |
| Gypsum | Gypsum | 15.4 | | X |
| Iron ore | Hematite | 17.8 | X | X |
| Lead | Galena | 36.6 | | X |
| Limestone | Calcite | 2.6 | X | X |
| Lithium | Li in brines | 545.8 | | X |
| Manganese | Pyrolusite | 15.6 | | X |
| Mercury | Cinnabar | 28,298.0 | | X |
| Molybdenum | Molybdenite | 907.9 | | X |
| Nickel | Pentlandite | 761.0 | X | X |
| Phosphate rock | Fluorapatite | 0.4 | | X |
| Potassium | Sylvite | 1224.2 | | X |
| Silicon | Quartz | 0.7 | | X |
| Silver | Argentite | 7371.4 | X | X |
| Sodium | Halite | 44.1 | | X |
| Tin | Cassiterite | 426.4 | | X |
| Titanium | Ilmenite | 4.5 | | X |
| Uranium | Uraninite | 901.4 | | X |
| Wolfram | Scheelite | 7429.3 | | X |
| Zinc | Sphalerite | 24.8 | | X |
| Zirconium | Zircon | 654.4 | | X |
| Fossil fuels |
| Coal | | 24.3–31.6 | X | X |
| Natural Gas | | 39.4 | X | X |
| Oil | | 44.0–46.3 | X | X |
Data categories include the following: mineral capital loss includes extraction, imports, exports and recycling for 2011, as a common reference year [
19,
20].
Colombian data is taken predominately from the Colombian Mining Information System (SIMCO) and Ministry of Mines and Energy (Ministerio de Minas y Energía). Copper recycling was taken from the National Register for the Generation of Hazardous Waste (Registro Nacional de Generadores de Residuos Peligrosos). For Spain, the data comes from the Ministry of Industry, Energy and Tourism of Spain (Ministerio de Industria, Energía y Turismo) and Spanish Statistical Office (Instituto Nacional de Estadística) The import/export information was taken from the Chamber of Commerce (Cámara de Comercio). Spanish mineral recycling rates were obtained from a report published by the United Nations Environment Programme [
21]. United States Geological Survey (U.S.G.S.) statistics were used as supplementary information for both Colombia and Spain [
22,
23].
The input and output flows were represented in a Sankey diagram to support visual understanding. Note, even though recycling can be considered both an input and an output, such flows, in this case, were considered only as an output, given that the analysis is carried out for a single year and subsequently it is not logical to assume that the amount recycled in that year was produced that same year.
4. Comparative Case Studies: Colombia and Spain
Colombia is investigated due to the national and global developments occurring in its extractive industry and its desire to export. Mining and hydrocarbons form an important part of the drive for development, evidenced by the government’s vision to become a mining nation by 2019 [
29]. Spain was selected following a general analysis of European Union mineral trade, where it was shown be an average and representative importing and consuming Member State [
30].
4.1. Analysis in Unit Tonnes
4.1.1. Colombia
As seen in
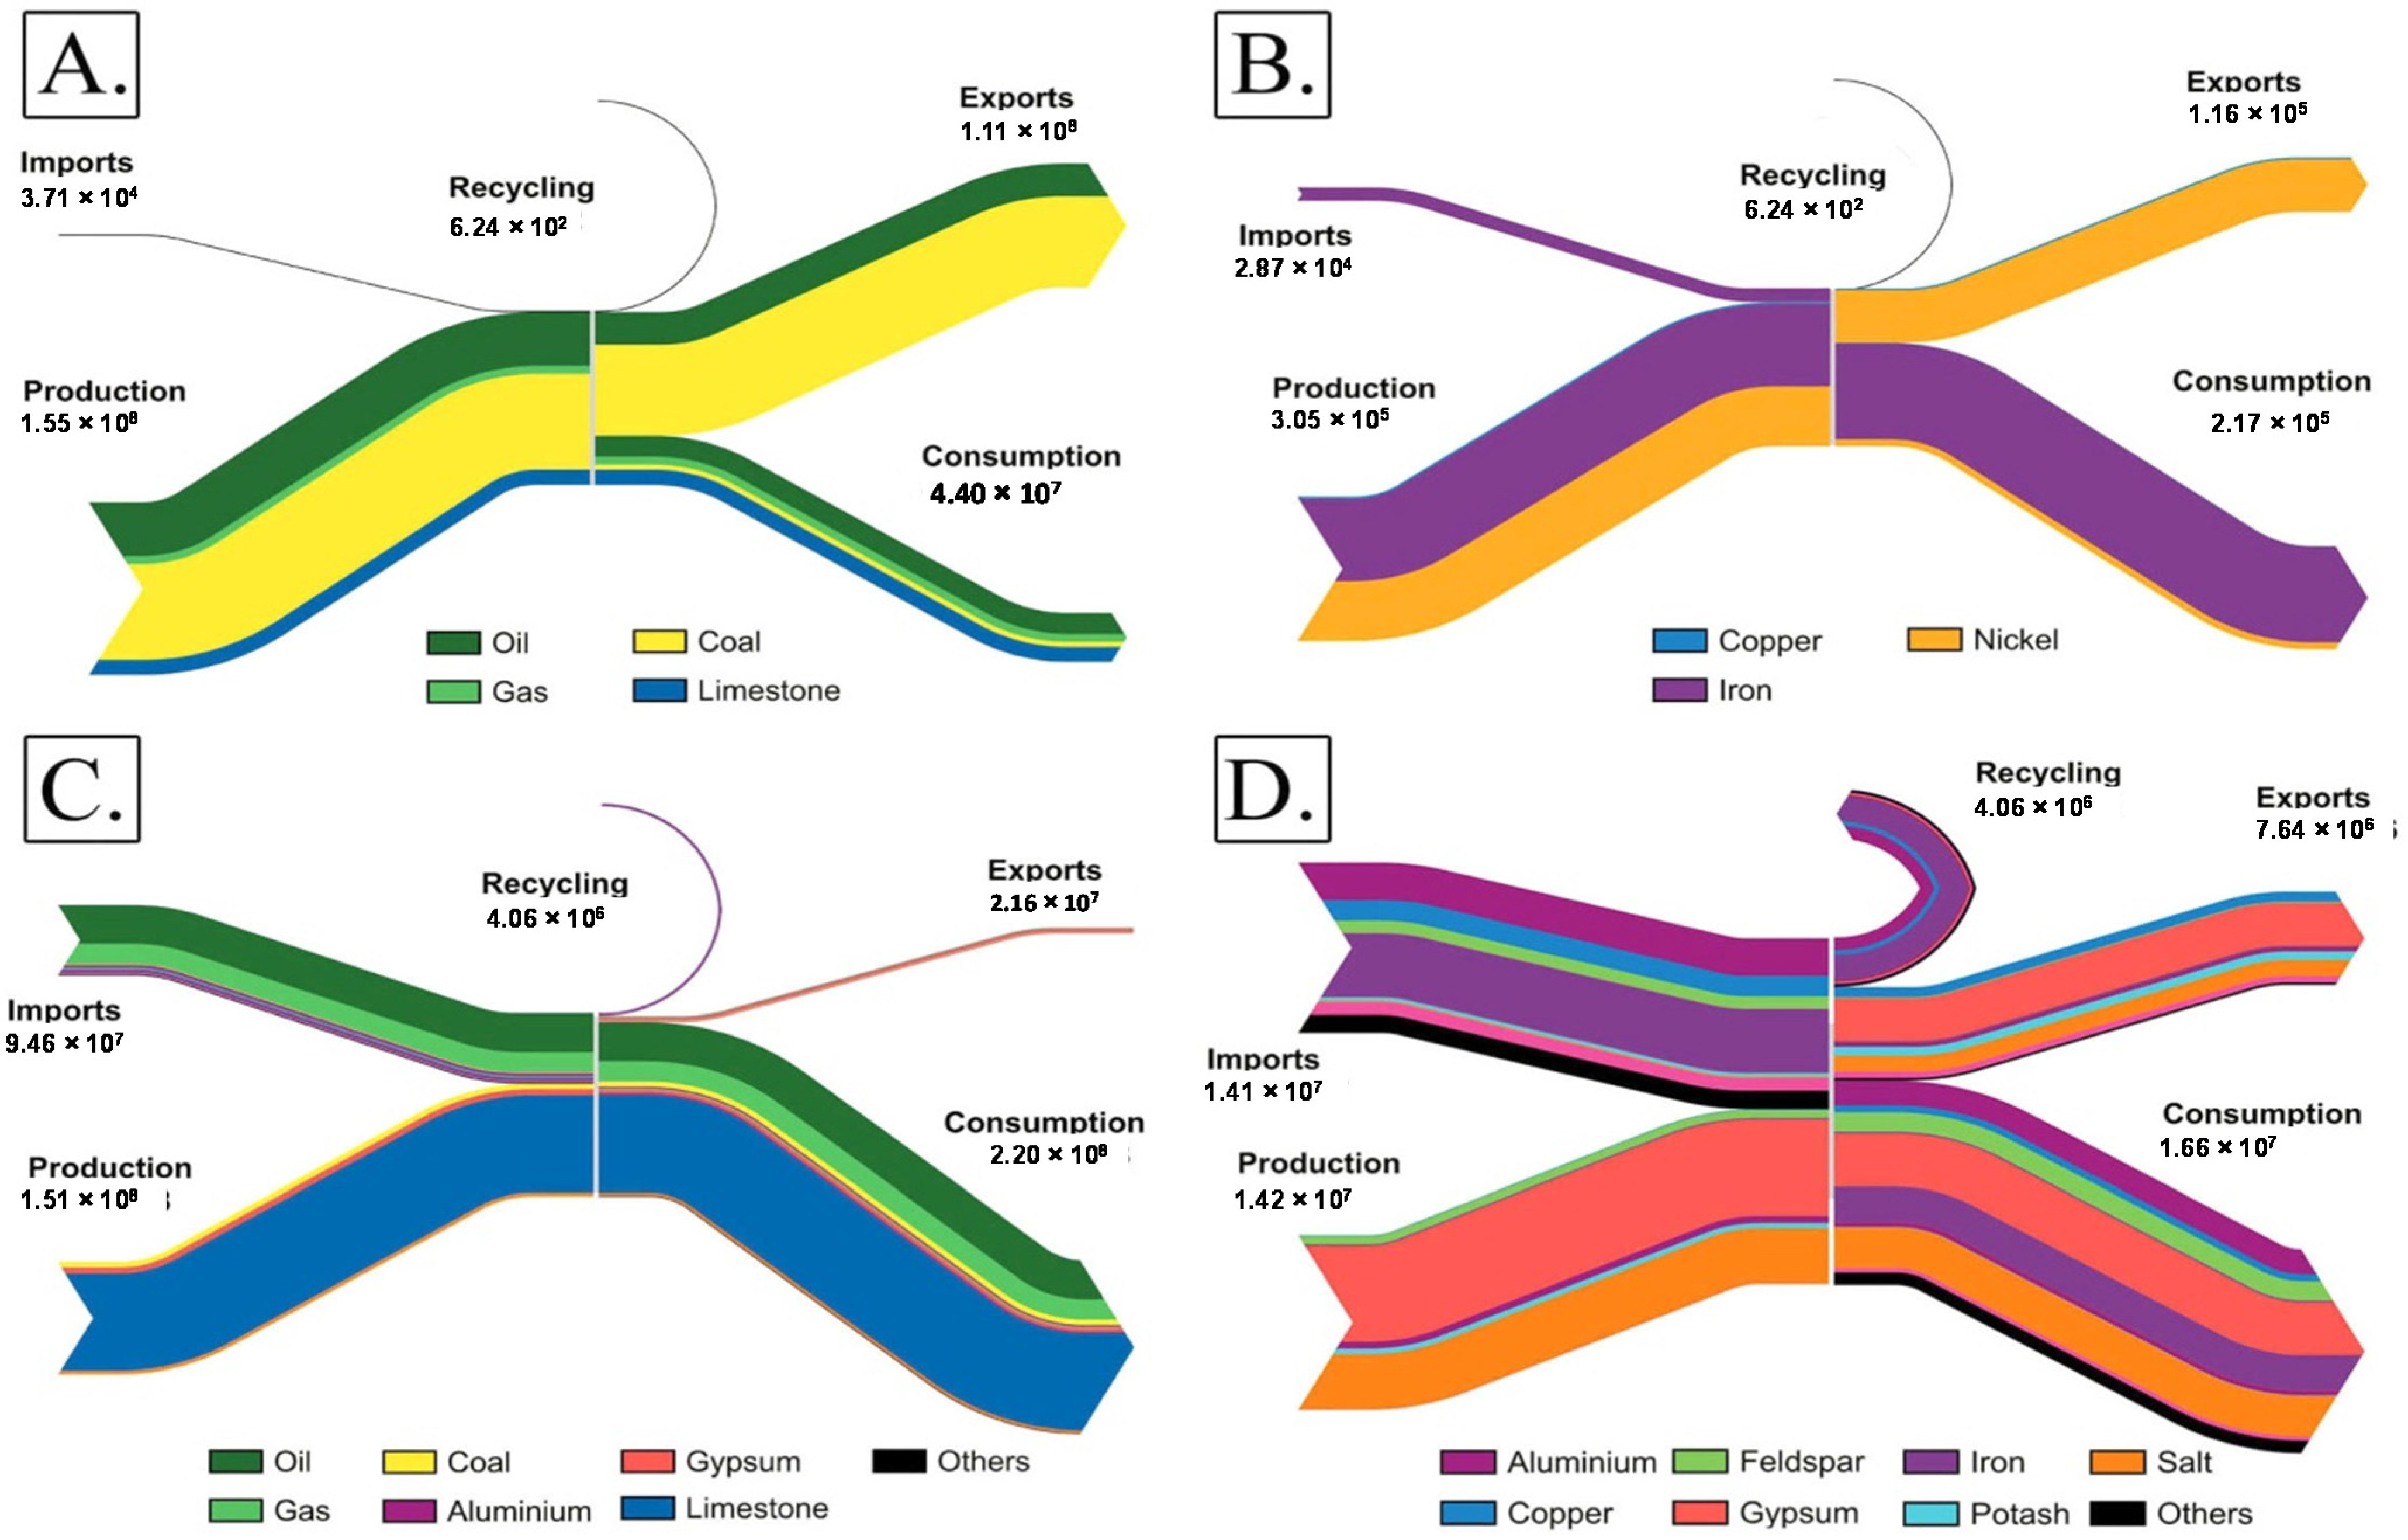
Figure 1A, Colombian production and export predominate over imports, recycling and consumption. Fossil fuel extraction represents 91.2% of the total. Limestone is the second most extracted mineral, accounting for 8.6%, and contributing, albeit in small quantities, to the export market. The remainder (0.2%) corresponds to iron, nickel, copper, gold, silver and PGM (platinum group metals). Fossil fuel imports represent less than 0.01% of the total mineral balance whilst the contribution of recycling is almost negligible.
Figure 1B is obtained upon removing both fossil fuels and limestone data from
Figure 1A. It is subsequently much easier to see that there is an appreciable consumption of iron and that nickel is the most important exported metallic mineral. Even when fossil fuels and limestone are removed from the Sankey diagram, copper, gold, PGM and silver production is still not large enough to register.
4.1.2. Spain
Figure 1C is the graphical representation of the Spanish mineral balance. Limestone predominates over the rest of the materials, representing 86%, in mass terms, of the total fuel and non-fuel mineral production. Imports represent 19.3% of the global mineral balance, and correspond to that of oil, natural gas and aluminium. Recycling and exports do not play a significant role, accounting for only 2.6% between them. If, as before with Colombia, data related to fossil fuels and limestone is removed from
Figure 1C, to create
Figure 1D, gypsum, salt, potash and feldspar were the most extracted substances in 2011. Gypsum remains one of the most extracted and exported substances in the country, although a little more than half of the production is consumed domestically. Metals, such as aluminium, iron, copper and zinc, are imported.
Figure 1.
Sankey diagrams representing mineral balance for the year 2011 expressed in tonnes. (A) Colombian mineral balance; (B) Colombian mineral balance without fossil fuels and limestone; (C) Spanish mineral balance; (D) Spanish mineral balance without fossil fuels and limestone.
Figure 1.
Sankey diagrams representing mineral balance for the year 2011 expressed in tonnes. (A) Colombian mineral balance; (B) Colombian mineral balance without fossil fuels and limestone; (C) Spanish mineral balance; (D) Spanish mineral balance without fossil fuels and limestone.
4.2. Comparative Analysis in Exergy Replacement Costs
4.2.1. Colombia
If the 2011 mineral balance is represented, not in mass, but instead in ERC terms (
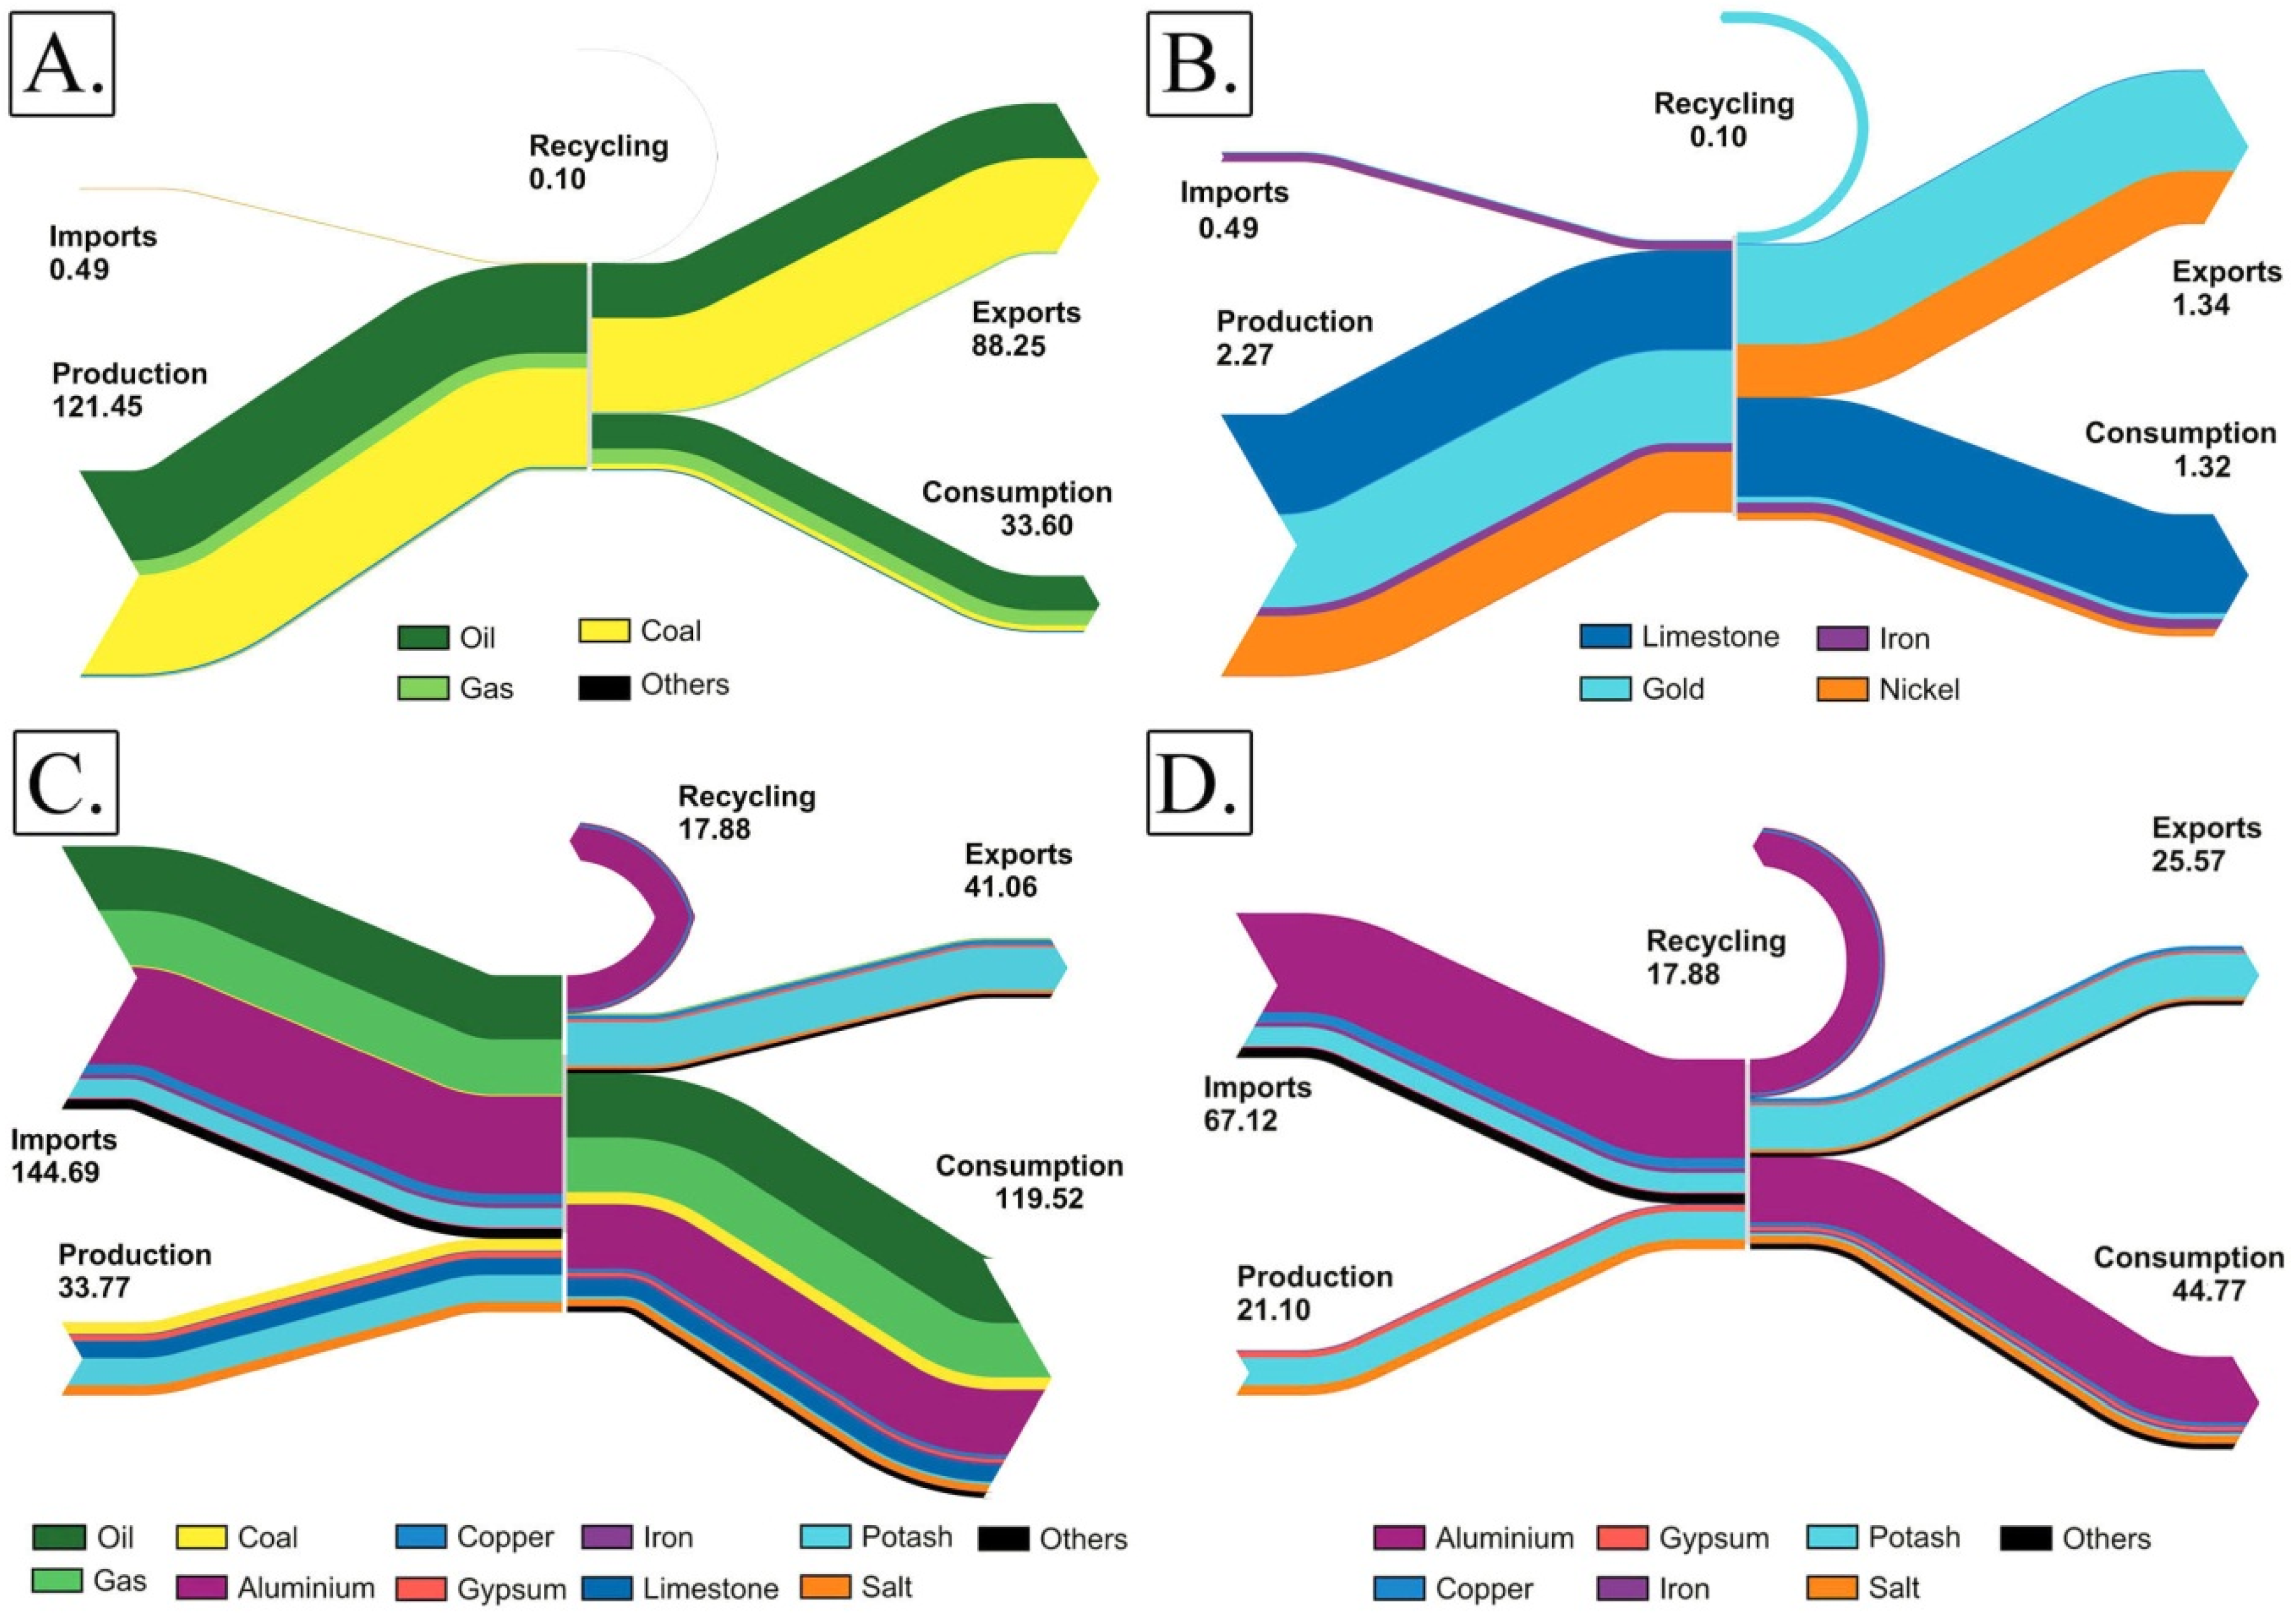
Figure 2A), oil and coal remain the most important Colombian commodities. Oil extraction, measured in percentage mass represents 31.1% of the total. This percentage increases to 43.3%, if oil extraction is measured using exergy replacement costs. The same thing happens for gas extraction (going from 4.6% to 7.2%), and coal extraction changes too (going from 55.4% to 47.6%). Exports, for their part, correspond to 73% of all mineral resources mined nationally.
Figure 2.
Sankey diagrams representing mineral balance for 2011 expressed in exergy replacement costs. (A) Colombian mineral balance; (B) Colombian mineral balance without fossil fuels; (C) Spanish mineral balance; (D) Spanish mineral balance without fossil fuels and limestone.
Figure 2.
Sankey diagrams representing mineral balance for 2011 expressed in exergy replacement costs. (A) Colombian mineral balance; (B) Colombian mineral balance without fossil fuels; (C) Spanish mineral balance; (D) Spanish mineral balance without fossil fuels and limestone.
If fossil fuel data are discarded from the Sankey diagram (to create
Figure 2B), the iron or nickel that played an important role in unit mass, become less relevant when considered in exergy replacement terms. Gold, almost exclusively extracted for the export market, occupies a much more significant position. Its mass is almost negligible, but its exergy replacement cost constitutes 35.3% of the total, as it requires more energy intensive processes, and thus is more difficult, to concentrate (or re-concentrate) than say limestone, iron or copper. Comparing the average energy intensity of copper and gold, in the former it is 22.2 GJ per tonne, and, in the case of gold, it is 143 GJ per kilo [
31,
32]. The importance of limestone extraction thus decreases. It contributed to 97.7% of the non-fuel mineral mass balance but only 37.8% of the exergy replacement costs. This is caused by the predominance of fossil fuel extraction and export, which masks the relevance of other minerals. If fossil fuel data are removed from the Colombian mineral balance, 0.21% of the total comes from imports, when expressed in tonnes, and 17.58 % when presented as exergy replacement costs. Iron is the most imported metal.
4.2.2. Spain
The significance of both oil and gas imports is identical, whether expressed as exergy replacement costs (
Figure 2C) or mass (
Figure 1C). The most striking variation corresponds to limestone. Limestone extraction measured 86% of the total domestic extraction in mass units but decreases to 23% when using exergy replacement costs. Exports correspond to 23% of the total output minerals. Potash, gypsum and salt (halite) are the most exported commodities.
Aluminium, which has the highest level of import and consumption of any metal in Spain, experiences a notable difference. In terms of percentage in tonnes, it contributed little. Represented through exergy replacement costs, however, and aluminium accounts for 32% of the total import. If, as before, fossil fuels and limestone data are removed from the scenario (
Figure 2D), the role of potash and halite in national production and export becomes more apparent.
A summary of the percentage total in mass terms and in exergy replacement costs of production, imports, exports, recycling and consumption for both countries can be found in the
Table 2.
Table 2.
Percentages for production, imports, exports, recycling and consumption. 2011 data expressed in mass terms and in exergy replacement costs for Colombia and Spain.
Table 2.
Percentages for production, imports, exports, recycling and consumption. 2011 data expressed in mass terms and in exergy replacement costs for Colombia and Spain.
| Balance Stage | Flow | Colombia (mass) | Colombia (ERC) | Spain (mass) | Spain (ERC) |
|---|
| Inputs | Production | 99.98 | 99.60 | 61.42 | 18.92 |
| Imports | 0.02 | 0.40 | 35.58 | 81.08 |
| Outputs | Exports | 71.57 | 72.37 | 8.80 | 23.01 |
| Recycling | <0.01 | 0.08 | 1.65 | 10.02 |
| Consumption (P+I-E-R) | 28.42 | 27.55 | 89.54 | 66.97 |
In both countries, mineral recycling is extremely low, accounting for less than 0.01% and 1.65% in Colombia and Spain respectively in mass terms. Comparing the mineral balance in mass terms, one can see that the Colombian economy is one of export (71.57%). In 2011, 3.9% of its total exports went to Spain. In the period January to December, Spanish imports of Colombian minerals increased by 204.4%, mainly due to fuels and their derived products [
33]. In fact, Spain depends almost entirely on imported fossil fuel supply and almost everything that is imported or Spanish produced is consumed within the country’s borders.
On comparing the values in mass and exergy replacement costs terms, it becomes clear that Colombian net values remain within the same magnitude. For Spain, the difference between mass and exergy replacement percentages are noticeable, since Spanish mineral imports consist essentially of those minerals that require highly energy intensive processes to re-concentrate them from a dispersed state (i.e., Thanatia) back into the original natural deposit (i.e., the condition of mineral’s existence before having been mined).
4.3. Domestic Mineral Resource Dependency Ratio
For Colombia, the domestic mineral resource dependency ratio (DE/DMC), in the case of non-fuel minerals, is greater than one, indicating that the country is self-sufficient for the minerals analysed, as evidenced by
Figure 1A and
Figure 2A. In the case of I/DMC, Colombia depends on an external supply of iron, which is subtly identified by the value of exergy replacement costs. For E/DMC, as stated before, gold and nickel were the main minerals exported, and this higher quality, as opposed to quantity, is the main characteristic reflected in these results.
In the case of Colombian fossil fuels, the DE/DMC ratio, when mass is used, is high. This is because, and as aforementioned, Colombia is an exporting country—around 78% of the fossil fuels extracted in 2011 were sent abroad. The DE/DMC ratio decreases by approximately 20% when expressed in exergy replacement costs. As shown in
Figure 1A, coal has a significant role in Colombian exports and since all types of coal have lower high heating values than either oil or natural gas, the total exergy value is lower than when expressed in mass terms.
Since the order of magnitude is noticeable, and in an effort to maintain representativeness in the results, the data for non-fuel minerals and fuel minerals has been kept separate, as shown in
Table 3.
Table 3.
Ratios between domestic extraction and domestic material consumption (DE/DMC), imports to DMC (I/DMC) and exports to DMC (E/DMC) for Colombia and Spain for the year 2011. Data are expressed in mass terms and in exergy replacement costs.
Table 3.
Ratios between domestic extraction and domestic material consumption (DE/DMC), imports to DMC (I/DMC) and exports to DMC (E/DMC) for Colombia and Spain for the year 2011. Data are expressed in mass terms and in exergy replacement costs.
| Country | Minerals Analysed | DE/DMC | I/DMC | E/DMC |
|---|
| Mass | Exergy | Mass | Exergy | Mass | Exergy |
|---|
| Colombia | Non-fuel minerals | 1.40 | 2.14 | 0.00 | 0.02 | 0.01 | 1.26 |
| Fossil fuels | 4.63 | 3.69 | 0.00 | 0.00 | 3.63 | 2.69 |
| Spain | Non-fuel minerals | 0.97 | 0.45 | 0.10 | 1.32 | 0.05 | 0.54 |
| Fossil fuels | 0.08 | 0.07 | 0.93 | 1.13 | 0.16 | 0.20 |
As for Spain, and in the case of non-fuel minerals, when domestic mineral resource dependency is considered in mass terms, it appears not to depend highly on import (0.97; with one or higher indicative of a low domestic mineral resource dependency). However, this value reflects the fact that imported non-fuel minerals are masked, in mass terms, by the sizable quantity of construction minerals (in terms of tonnes) that Spanish industry provides for its own market demand. Spanish limestone and gypsum, for example, account for 96.5% of the total.
When domestic mineral resource dependency is calculated using ERC, DE/DMC ratio drops by slightly less than half (0.45). This, along with the elevated value of the I/DMC ratio in exergy terms, indicates that Spain relies on scarcer mineral imports, such as those of aluminium, copper or iron. These minerals have higher exergy replacement costs.
For the export dependency ratio (E/DMC), the most significant 2011 mineral export, in terms of tonnes, was potash. Given its elevated exergy replacement cost, its role becomes more noticeable when considered in exergy rather than mass units.
Since Spanish domestic extraction of fossil fuels is almost negligible, the DE/DMC ratio confirms that Spain depends strongly on external sources, which is also demonstrated by the high I/DMC ratio.
On further analysis, Colombian coal export dependency could present a problem should the market turn to cleaner fuels. Precious metal demand places great pressure on existing reserves and could create future development issues. For Spain, the ERC show a high import dependency on scarcer minerals. The country should either increment domestic production for these minerals or reduce/adapt the activities that require an intensive use of rarer elements.
4.4. Economic Analysis for Colombian and Spanish Mineral Balance
According to
Table 4 and
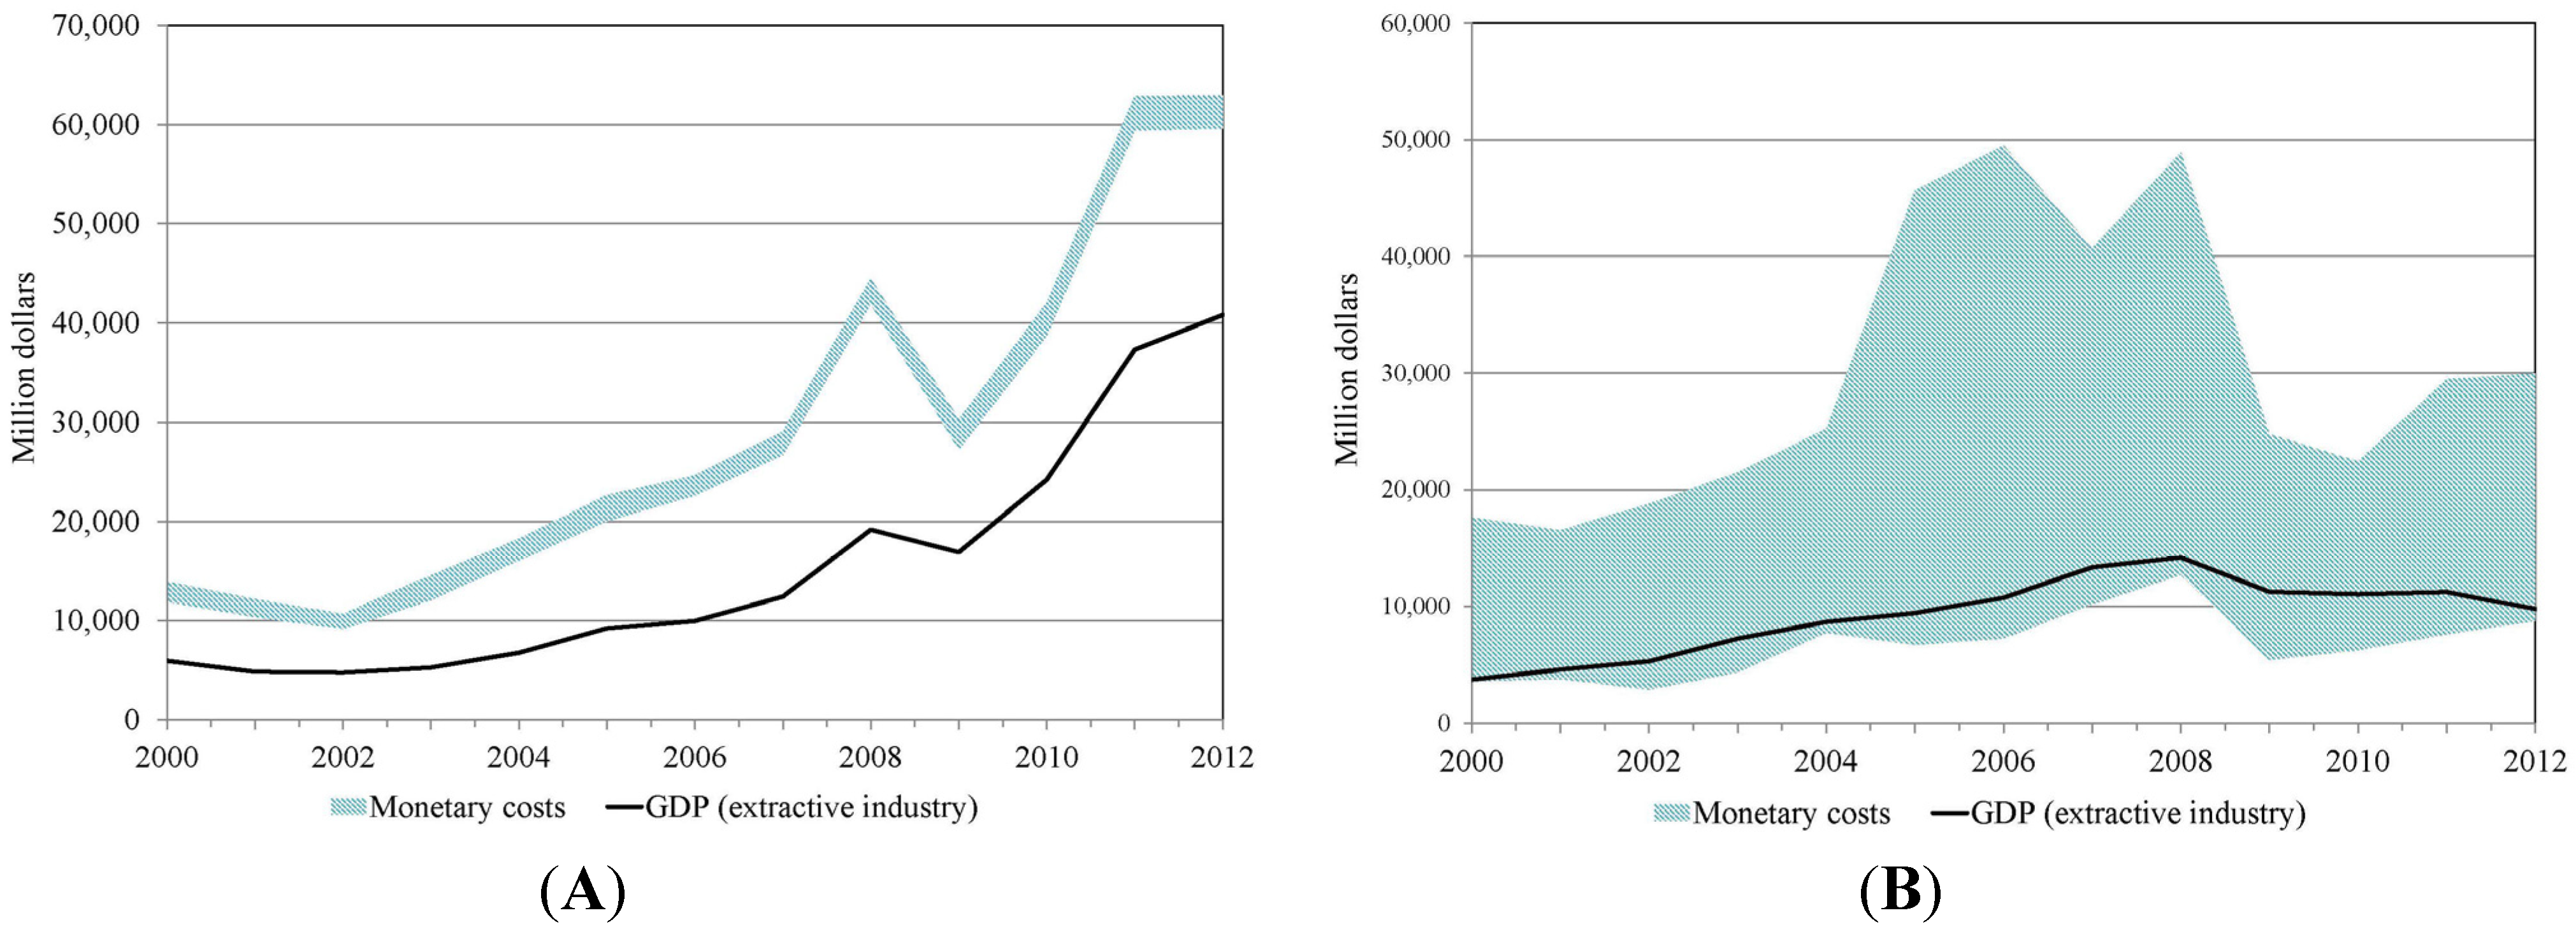
Figure 3, if Colombia was charged with having to re-concentrate those minerals that it had extracted in 2011, the GDP of $38 billion (USD, 2011 price) generated by its extractive industries would not cover the ERC monetary equivalent of approximately $56–59 billion (USD), regardless of the energy source used.
Table 4.
Monetary costs associated to the mineral extraction in Colombia and Spain for 2011.
Table 4.
Monetary costs associated to the mineral extraction in Colombia and Spain for 2011.
| Parameter | Colombia | Spain |
|---|
| Exergy (total, Mtoe) | 121.45 | 33.77 |
| Monetary costs (billion $) | Lower boundary | 55.94 | 7.63 |
| Upper boundary | 59.40 | 29.48 |
| % GDP | Lower boundary | 16.67% | 0.52% |
| Upper boundary | 17.69% | 2.02% |
Figure 3.
Monetary equivalent of ERC and GDP generated by the extractive sector for Colombia (A) and Spain (B) from 2000 to 2012.
Figure 3.
Monetary equivalent of ERC and GDP generated by the extractive sector for Colombia (A) and Spain (B) from 2000 to 2012.
For Spain, the contribution of the extractive industry was approximately $11.2 billion (USD). This is substantially less than the theoretical amount required to re-concentrate the extracted assets, upon considering the upper boundary. This issue appeared in 2009, as studied by Valero
et al. [
34] who discovered that, on average, prices were 39 times lower than what they needed to be in order to reflect the loss of mineral capital, calculated via exergy replacement costs.
5. Conclusions
A DMC analysis, with exergy replacement costs, makes it possible to evaluate not only the quantity but the quality of international flows transferred between nations. This allows for a more complete picture of mineral dependency and sustainable development.
The economic analysis indicates that Colombia would have lost a monetary equivalent of $56 to $59 billion (USD), if it had to re-concentrate its mineral deposits using energy derived from either coal or electricity, a figure higher than the Colombian mining sector’s contribution of $38 billion (USD). Spain’s alleged losses would be considerably lower than Colombia’s but still between $7 and $29 billion (USD). That said, given the Spanish reliance on imports, most of the country’s ERC would be allocated to Colombia and the other trade partners, which supply the mineral demand beyond Spain’s own domestic production capabilities.
If exergy replacement costs are considered, the theoretical figures presented in this paper can link market prices to values that more readily correlate to physical costs. Currently, the fact that the true cost of mineral resource extraction is not considered in ERC terms means that current rates of extraction at 2011 prices are not sustainable.


