Concept Paper

The Influence of Diesel Fuel Subsidies and Taxes on the Potential for Solar-Powered Hybrid Systems in Africa

Reiner Lemoine Institute, Ostendstraße 25, Berlin 12459, Germany
*
Author to whom correspondence should be addressed.
These authors contributed equally to this work.
Resources 2015, 4(3), 673-691; https://doi.org/10.3390/resources4030673
Submission received: 6 June 2015 / Accepted: 24 August 2015 / Published: 31 August 2015
(This article belongs to the Special Issue Alternative Energy Sources in Developing and Developed Regions)

Abstract

:
Many people in African countries lack access to sufficient electricity supply due to missing infrastructure of the centralized conventional power generation system. In order to provide electricity to a wider part of the population, it is necessary to exploit the vast renewable resources in African countries. Therefore, this paper scrutinizes the economic advantages of photovoltaic-based hybrid systems over fossil fuel-based power generation. A simulation model is applied in order to calculate the cost advantage of hybrid systems compared to diesel-only systems for the entire continent on a long term basis by applying two scenarios: one based on world market diesel prices and the other one based on national diesel prices. The results indicate that average power generation costs per country can be reduced by up to 0.11 €/kWh considering world market diesel prices and by up to 0.48 €/kWh considering national diesel prices. Furthermore, the effect of diesel fuel subsidies and taxes on the renewable energy potential and the respective savings are examined. These findings may ameliorate the policy development according to fossil fuel subsidies and taxes and demonstrate the advantages of decentralized renewable hybrid systems especially in rural areas of Africa.

1. Introduction

The African energy sector faces outstandingly high power generation costs [1]. The intensive use of oil-based power generation, such as diesel generators, is one of the reasons. Apart from being one of the most expensive means to generate electricity, production costs are highly unpredictable due to rapidly-fluctuating fuel prices. Most African countries, therefore, spend significant parts of their GDP on subsidizing electricity prices and fossil fuel prices in order to enable access to electricity to a wider part of the population [2]. Nevertheless, more than 590 million people find themselves without electricity access; its provision consequently remains a major challenge [3] (Figure 1).
Figure 1. Access to electricity indicated in percent of the population [4,5,6]. The majority of countries in sub-Saharan Africa are characterized by low access to electricity.
Resources 04 00673 g001
For the large number of people living in places without grid connection or where an extension of the transmission grid is not feasible or planned in near future, the conventional approach to provide electricity is the usage of decentralized diesel generators. Yet, this reinforces the dependency on fossil fuels and forces governments to spend scarce budgets for pre-tax and post-tax fuel or electricity subsidies. With the rising price competitiveness of renewable energy (RE) technologies, decentralized renewable off-grid solutions present a viable alternative, especially in rural areas [7]. In particular, hybrid systems consisting of photovoltaic (PV) modules, battery storage, and back-up diesel generators are of great interest, since they make use of the high solar power potential in Africa [8] and can be integrated into the preexisting infrastructure of small diesel grids [9]. Until now, only few studies were carried out addressing this issue [10,11]. Ahlborg and Hammar [10] identified drivers and barriers for off-grid electrification in Tanzania and Mozambique. They found that among the main barriers are lack of private investment, subsidies favoring fossil technologies, and low income of rural households. Szabó et al. [11] found that in 2011 decentralized PV electricity was at the margin to become cost competitive with diesel and even grid power supply.
However, for a broader integration of renewable energies fossil fuel subsidies are obstructive. As high upfront payments are necessary for renewable technologies, hybrid systems cannot compete with conventional systems under subsidized fuel prices on a short-term basis. Furthermore, a recent study from the International Monetary Fund demonstrated that in sub-Saharan countries petroleum products profit from the highest subsidies compared to other fossil fuels, although a removal of this subsides would lead to fiscal, environmental and welfare gains [12]. Generating knowledge in these areas will, therefore, ameliorate the policy development and demonstrate the advantages of decentralized renewable hybrid systems, especially for rural areas of Africa. The presented study is based on a conference paper contributed to the AfricaPVSEC 2014.

2. Materials and Methods

The purpose of this study is to quantify the techno-economic potential for decentralized PV power for the African continent by comparing the power generation costs of decentralized diesel-based systems to PV-based hybrid systems. Due to the generic character of this study decentralized power generation is assumed for each location in Africa. Certainly, this is partly not reflecting the reality as a central power generation infrastructure is in place in many countries and centralized power generation presents the most-cost effective electrification and energy supply option in many areas [11]. Nevertheless, the African continent is predestined for studying the potential for decentralized power generation with renewable energies as literally “thousands” of diesel-based mini-grids are in place with largely high power generation costs [13,14]. Furthermore, the low developed central power infrastructure, vast distances, and sparse population are decreasing the cost-effectiveness of central power generation systems and favor small decentralized energy systems. Furthermore, decentralized renewable systems can largely contribute to rural electrification. The International Energy Agency (IEA) assumes that, globally, new electrification has to be provided by 40% through decentralized mini-grids till 2030 [15].

2.1. Applied Scenarios

Two scenarios were applied for this study (Table 1): Scenario I is based on the world market diesel price and Scenario II on respective national diesel prices. The scenarios were chosen in order to study the distorting effect fuel taxes and subsidies have on the economic feasibility of a PV-based hybrid system. Naturally, high fuel subsidies pushing local diesel prices down well below the world market level render the renewable system unprofitable for the end user. On the other hand, seen from the national economy standpoint, it is very reasonable to export oil (or import less oil) for the world market price instead of paying for the subsidies. Fuel taxes are reflected as well in Scenario II showing the influence on the diesel systems and the increased competitiveness of PV-hybrid systems compared to higher fuel prices.
Table 1. Scenarios applied.
ScenarioCharacteristics of scenario
Scenario IWorld market base price of 0.58 €/L are applied for all countries in order to derive the theoretical market potential for solar powered hybrid systems.
Scenario IINational retail prices are applied in order to study the impact of diesel fuel taxes and subsidies.

2.2. Spatial Analysis

As a first step, spatial analyses were conducted in order to define reference points necessary for deriving site-specific input parameters in a later step. Therefore, a raster grid was created which covers the entire African continent by applying geospatial software. This raster grid is composed of more than 12,000 pixels, with a pixel size of 0.45° × 0.45°. Each pixel’s centroid was used as single reference point for the latter analysis, reflecting the site-specific solar irradiation and diesel costs. In order to assess the specific potential for PV power generation at each of the considered locations values for global horizontal irradiation (GHI) were obtained from global datasets comprised of historical GHI data provided by NASA [16]. The conversion from GHI into PV yield is based on a model developed by Huld et al. [17] and considers crystalline silicon photovoltaic modules. Parameters affecting module performance are temperature and irradiation. Furthermore, it is assumed that modules are optimally tilted. A degradation rate of 0.3% per year is applied and an additional reduction of the generated power of 3% is assumed reflecting negative impacts e.g. clouding and pollution. Combining the aforementioned models leads to an individual PV yield in hourly time steps for each of the reference points. Local diesel costs were assessed deriving the necessary travel time to reach each reference point from a dataset provided by the European Commission [18]. The time value is converted into a cost value according to an adjusted formula of Szabo et al. [11]. Finally, a database was established comprised of the reference points and filled with the site-specific input parameters per reference point.

2.3. Energy System Modelling

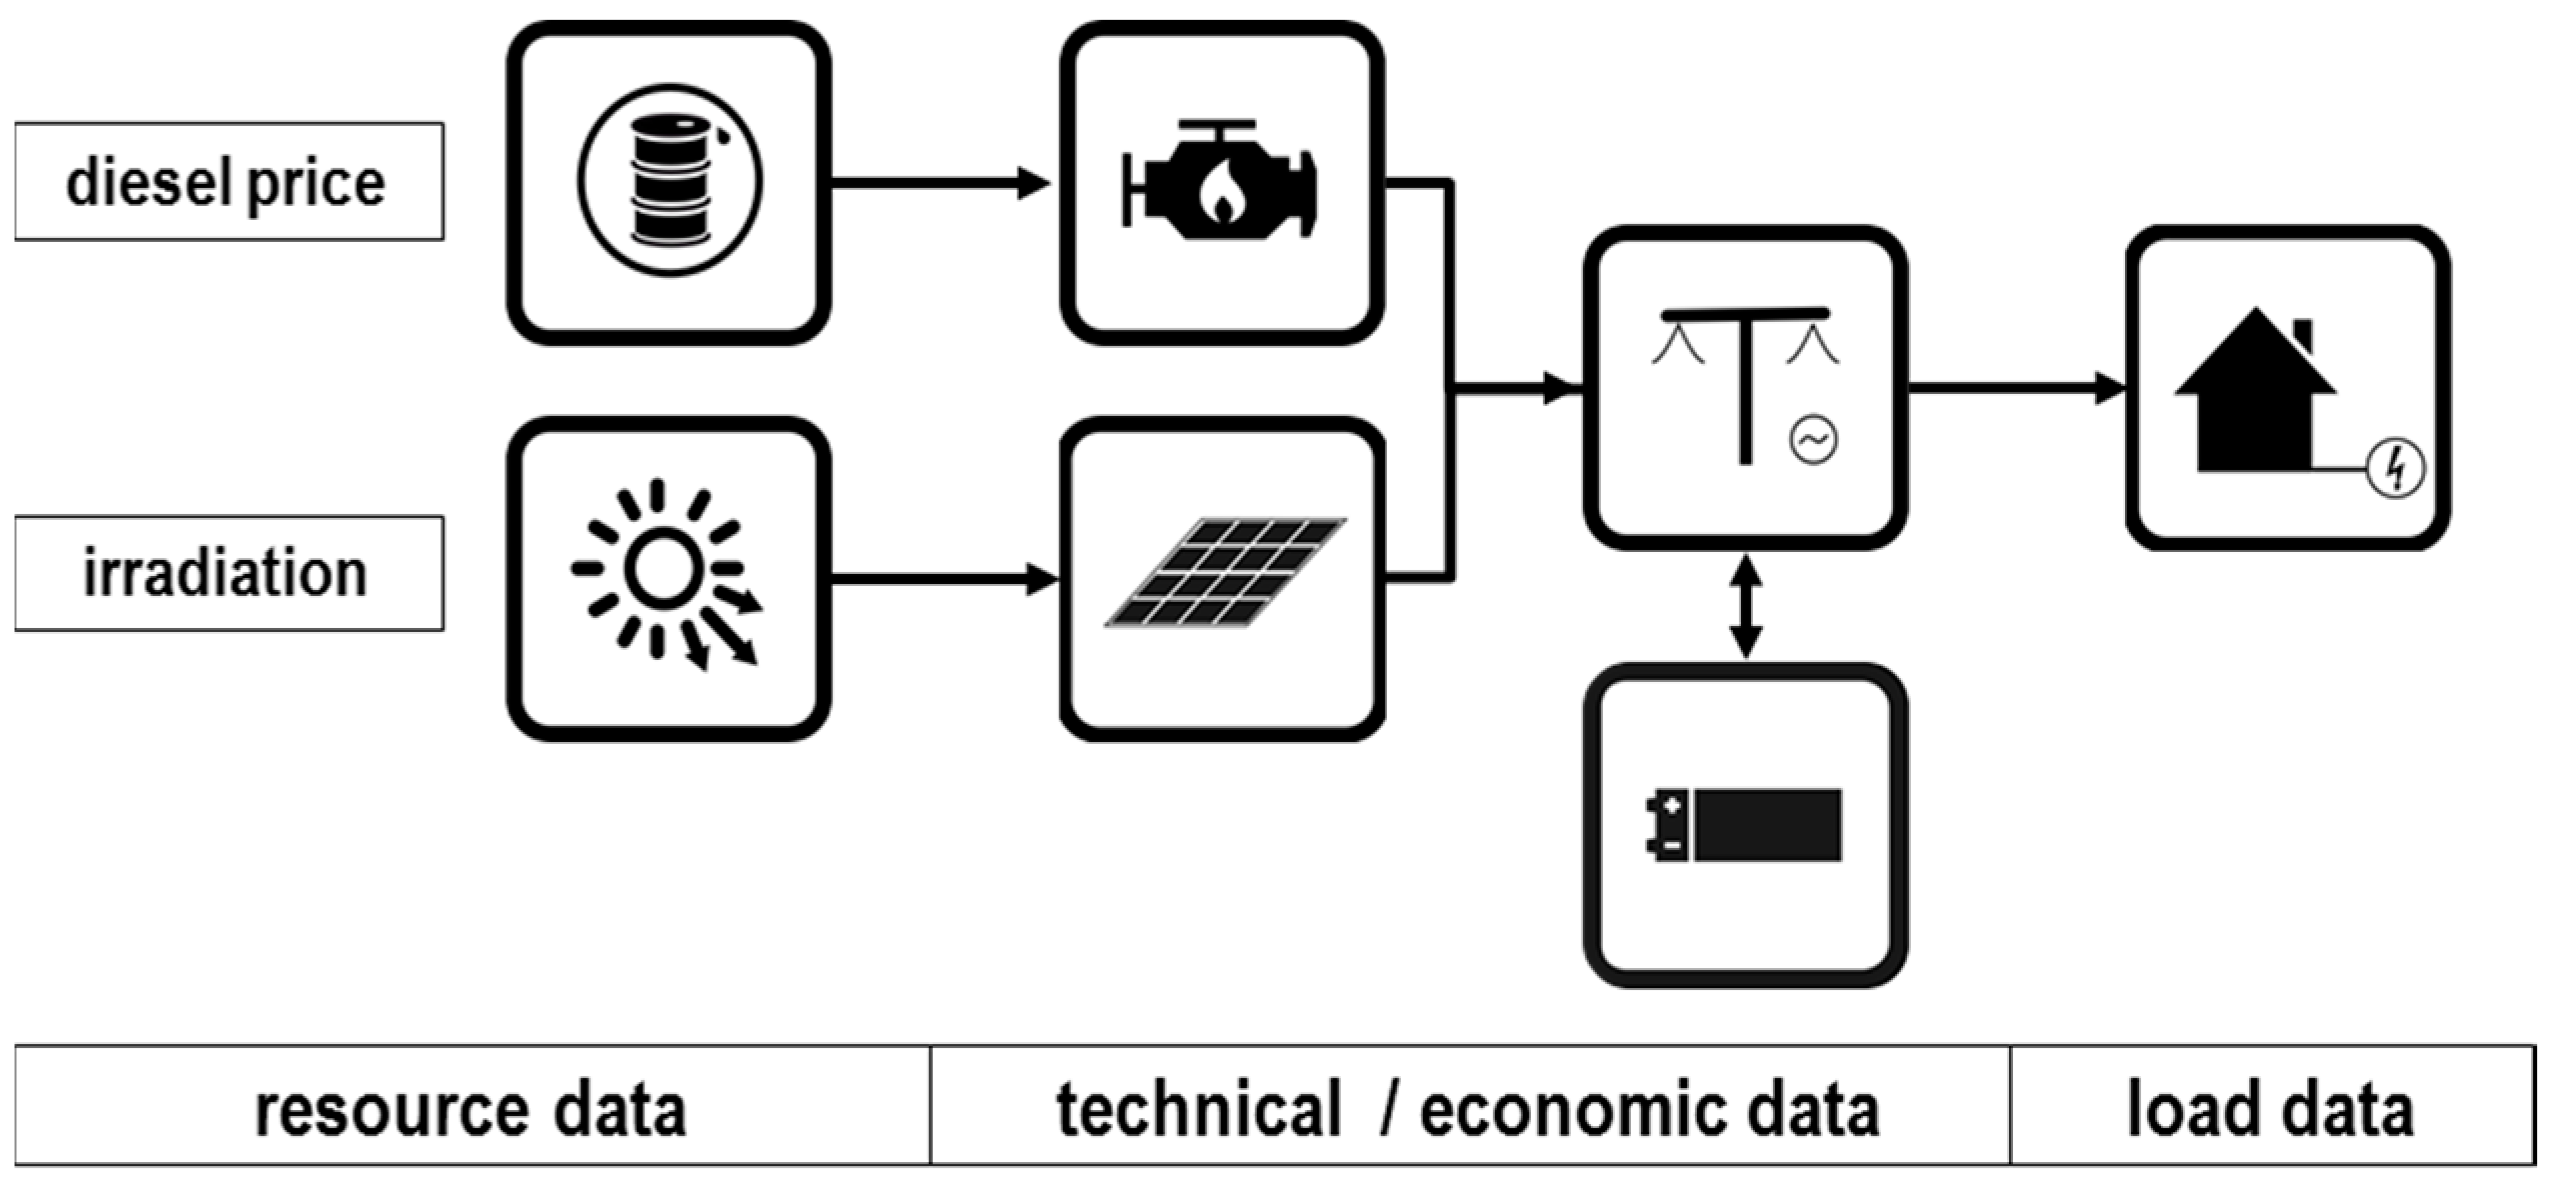
Secondly, an energy system modelling tool developed at the RLI was applied in order to study the economic feasibility of decentralized PV systems compared to diesel systems. The general approach of the model and relevant results have been published in [19]. This model is able to simulate an energy system in hourly time steps over one reference year regarding the fossil and solar resources, as well as technical, economic, and load data to define the most economical configuration of RE-based hybrid systems. It describes energy flows between system components and their resulting costs (Figure 2).
Within the energy simulation model capital and operational expenditures for each component, as well as local fuel costs, are considered. Diesel generator capital expenditures were set to zero, assuming that the diesel power generation infrastructure is already in place. The cost data form the baseline for calculating the system’s overall levelized cost of electricity (LCOE) [20] (Equations (1) and (2)) for one reference year. The results provide the cost-optimized system configurations for a project period of 20 years.
L C O E = C a p e x * C R F ( W A C C , N ) + O p e x + C o s t s f u e l * F u e l E l c o n s u m e d
Equation (1): Levelized cost of electricity (LCOE) for power systems. Abbreviations stand for: Capital expenditures (Capex); capital recovery factor (CRF); weighted average cost of capital (WACC); project lifetime (N); operation and maintenance expenditures per year (Opex); cost of diesel per liter ( C o s t s f u e l ); consumed diesel per year (Fuel), consumed electricity per year ( E l c o n s u m e d ).
C R F ( W A C C , N ) = W A C C * ( 1 + W A C C ) N ( 1 + W A C C ) N 1
Equation (2): Capital recovery factor (CRF). CRF is set according to weighted average cost of capital (WACC) and project lifetime (N).
Figure 2. Renewable-based hybrid energy system. Diesel generator, PV module, battery storage, and load are the considered parts. Arrows indicate direction of power flows and resources.
Resources 04 00673 g002
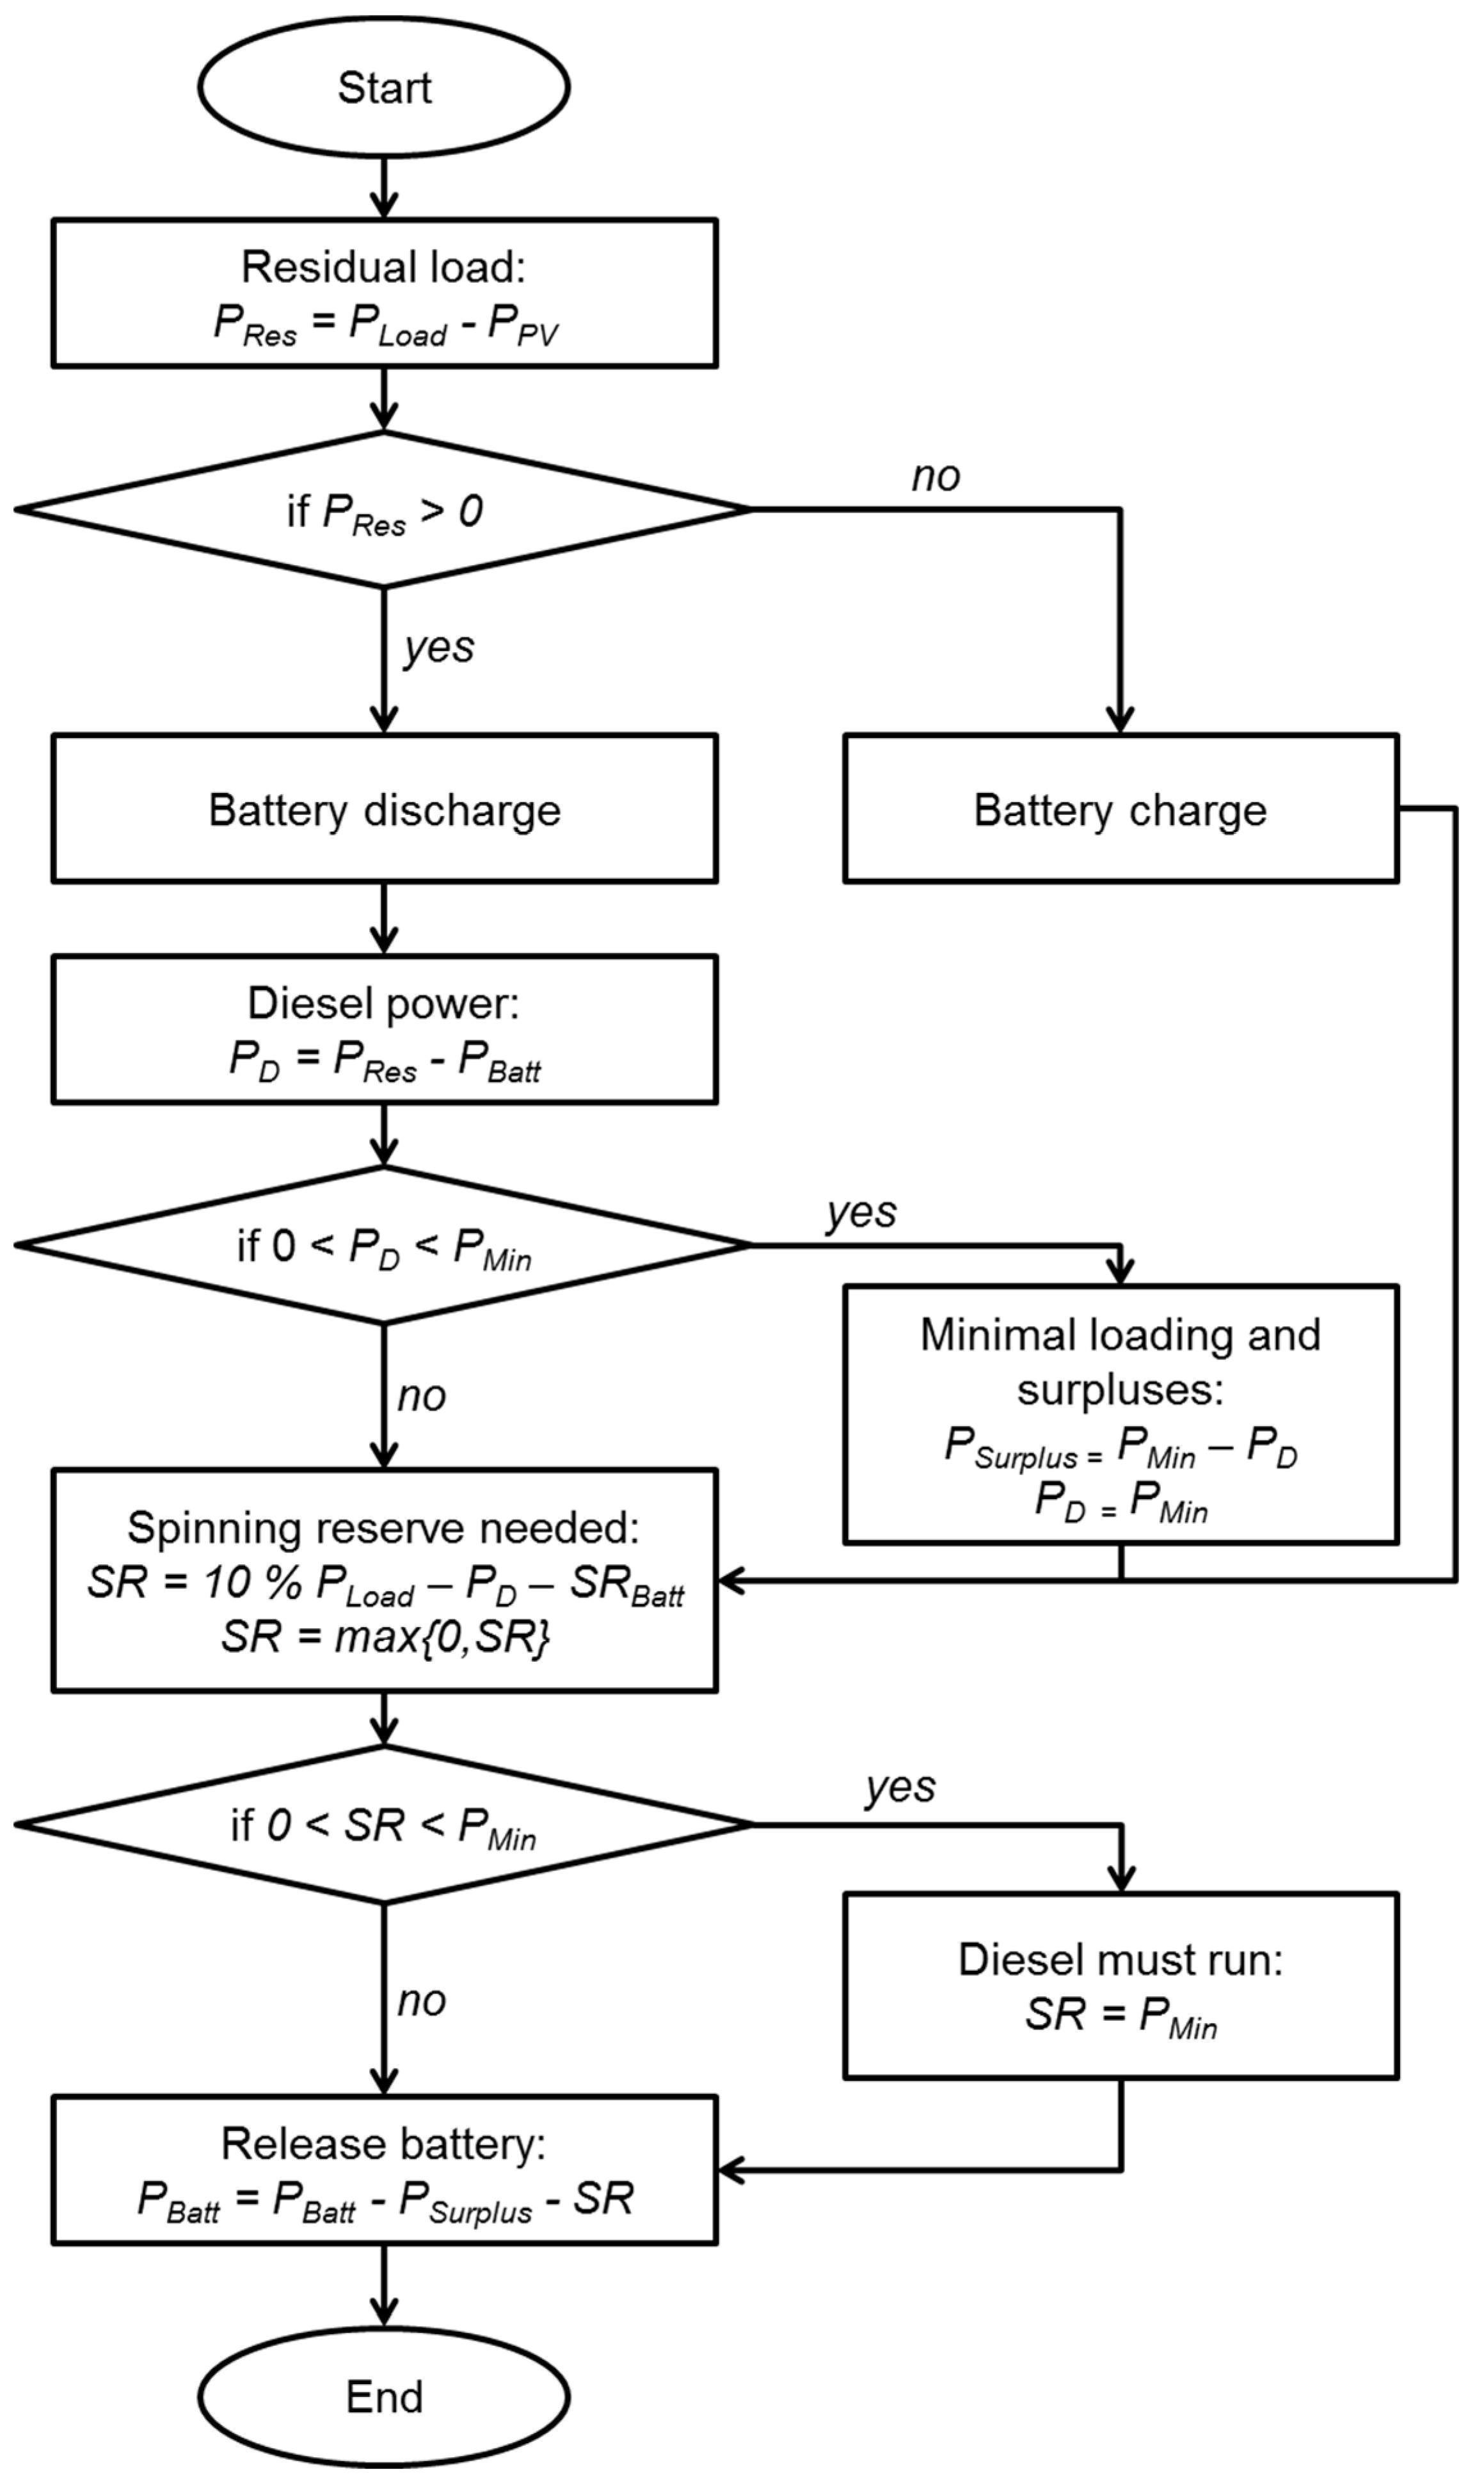
Two energy supply options are considered: a diesel system consisting of diesel generators only and a hybrid system consisting of crystalline-silicon PV modules, lead-acid battery storage systems, and a diesel generator (Figure 2). For diesel generators no capital expenditures are applied as we assume that diesel generators are already in place and are extended by renewable energies. The configuration of the components in the hybrid system is optimized in order to minimize the LCOE. For every time step of the simulated period the load has to be fully covered. In a first step, renewables feed into the network. Two cases may then occur: either a power surplus exists, which can be stored by the battery or a lack of power has to be filled first by a battery discharge and/or by diesel power. A spinning reserve of 10% of the current load has to be provided in every time step. This spinning reserve can be seen as the needed amount of grid-forming devices within the system to meet all stability criteria (e.g., frequency stabilization, voltage stabilization, short circuit power). The spinning reserve can either be supplied by the battery, if its state of charge is sufficient, or by the diesel generator, in order to guarantee the stability of the system. If not enough spinning reserve is provided, additional power has to be generated by the generator leading to power surpluses. Additionally, due to maintenance reasons, diesel generators have a minimal loading which is reflected in the model as a minimal operation of 20% of the maximal load of the entire year which can also lead to power surpluses. In a last step, generated power surpluses may release the discharge or even charge the battery, respectively (Figure 3).
Figure 3. Dispatch strategy applied in the energy system modelling tool.
Resources 04 00673 g003
The simulation model was fed with the site-specific input parameters derived from the spatial analysis supplemented by the general input parameters for each reference point (Table 2). Resource data are comprised by the diesel base price, diesel transport costs, diesel price increase, and PV yield. For assessing the local diesel price transport costs, as defined in the spatial analysis, were added to the average diesel world market price of 2013 of 0.58 €/L [21] in Scenario I, or the respective national diesel prices [22,23] in Scenario II (Table A1). On the national basis, diesel fuel costs were researched individually and, in some cases, it was necessary to estimate diesel fuel costs as no reliable sources were available. Generally, national diesel costs refer to retail prices rather than to pump prices for diesel. An annual diesel price increase of 3% is applied and, for the simulation model, the average diesel costs over the project period of 20 years were used. Finally, the PV yield as described in the spatial analysis was applied.
All technologies (PV power plant, diesel generator, and battery system) are characterized by CAPEX, OPEX, life time, and conversion efficiency. The OPEX are reflected as a percentage of the CAPEX for PV and as fixed values per kWh for diesel generator and battery system. The battery system is, furthermore, described by its round cycle efficiency and maximal depth of discharge. For this study the technological parameters of lead-acid batteries were applied [24].
Table 2. Simulation input parameters.
Input parameterParameter value
Resource data
Diesel base priceScenario I: 0.58 €/L world market base price
Scenario II: according to national retail price
Diesel transport costsTransportation costs according to [8,16]
Diesel price increase3% annual increase
PV yieldVaries according to geographic location (in kWh/kWp/a) [12,13]
Technical data
Diesel generator efficiency30%
Battery round cycle efficiency85%
Battery max. depth of discharge50%
Battery life time10 years
Battery C-rate1:6 kW/kWh
Economic data
CAPEX diesel generator0 €/kW
OPEX diesel generator—variable0.01 €/kWh
CAPEX PV1,600 €/kWp
OPEX PV—fixed2% of Capex/year
CAPEX battery350 €/kWh
OPEX battery—fixed10 €/kWh/year
Project duration20 years
WACC10%
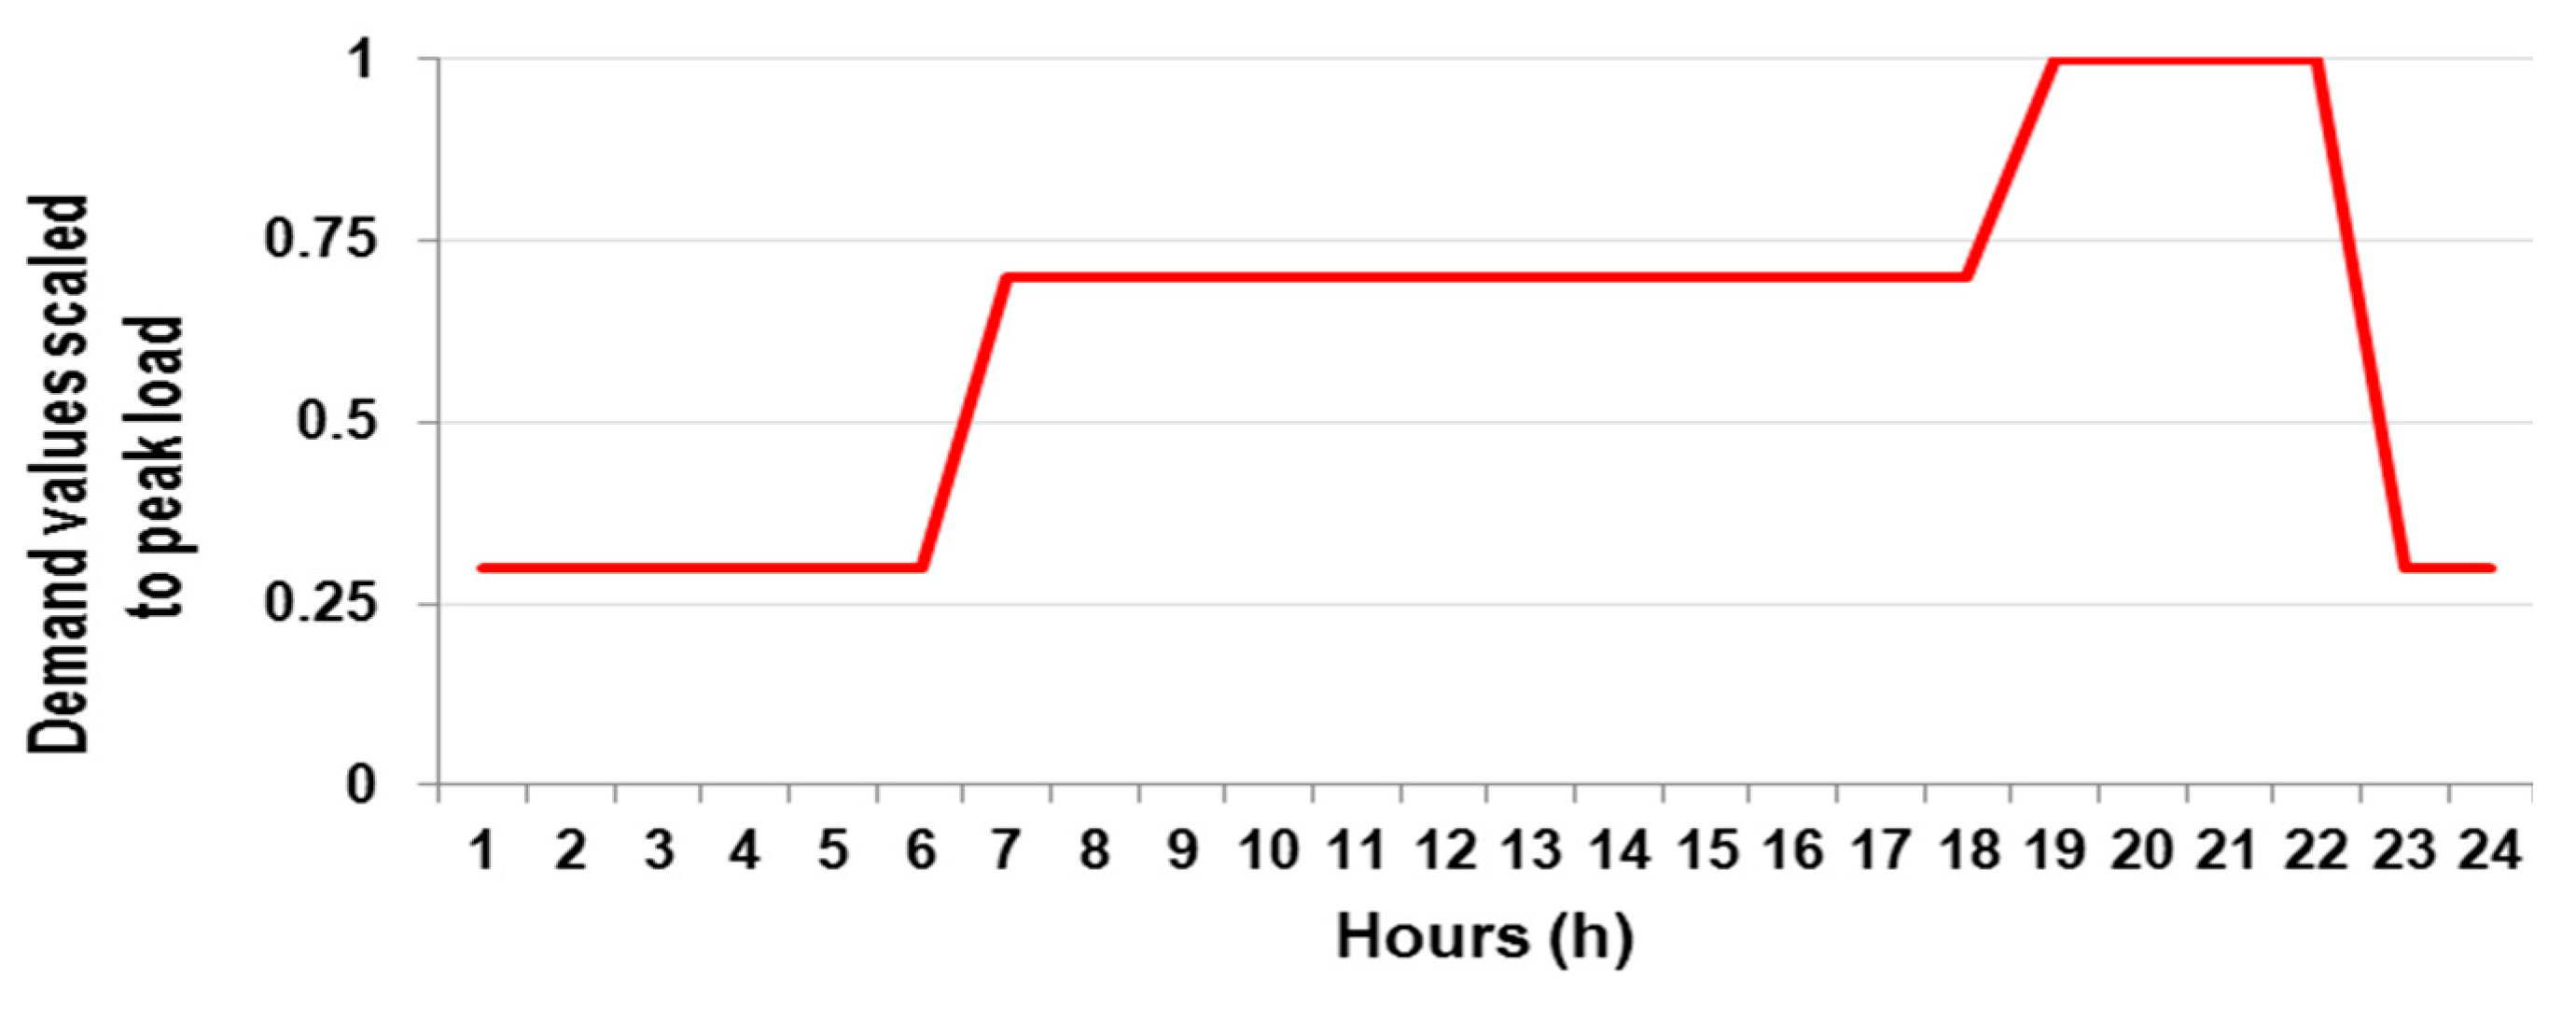
A typical load curve was assumed for all locations in order to estimate the energy demand (Figure 4). The selected load curve shows a maximum load more than three times higher than the minimum load, including a significant peak load in the evening hours. This load curve was derived from a real load curve of a Tanzanian village and reflects the energy demand profile of a typical rural settlement, the focus object of the analysis [25]. The load curve reflects the primary use of electricity for lighting purposes and small residential appliances. This daily load curve was converted to a yearly load curve by repeating it 365 times.
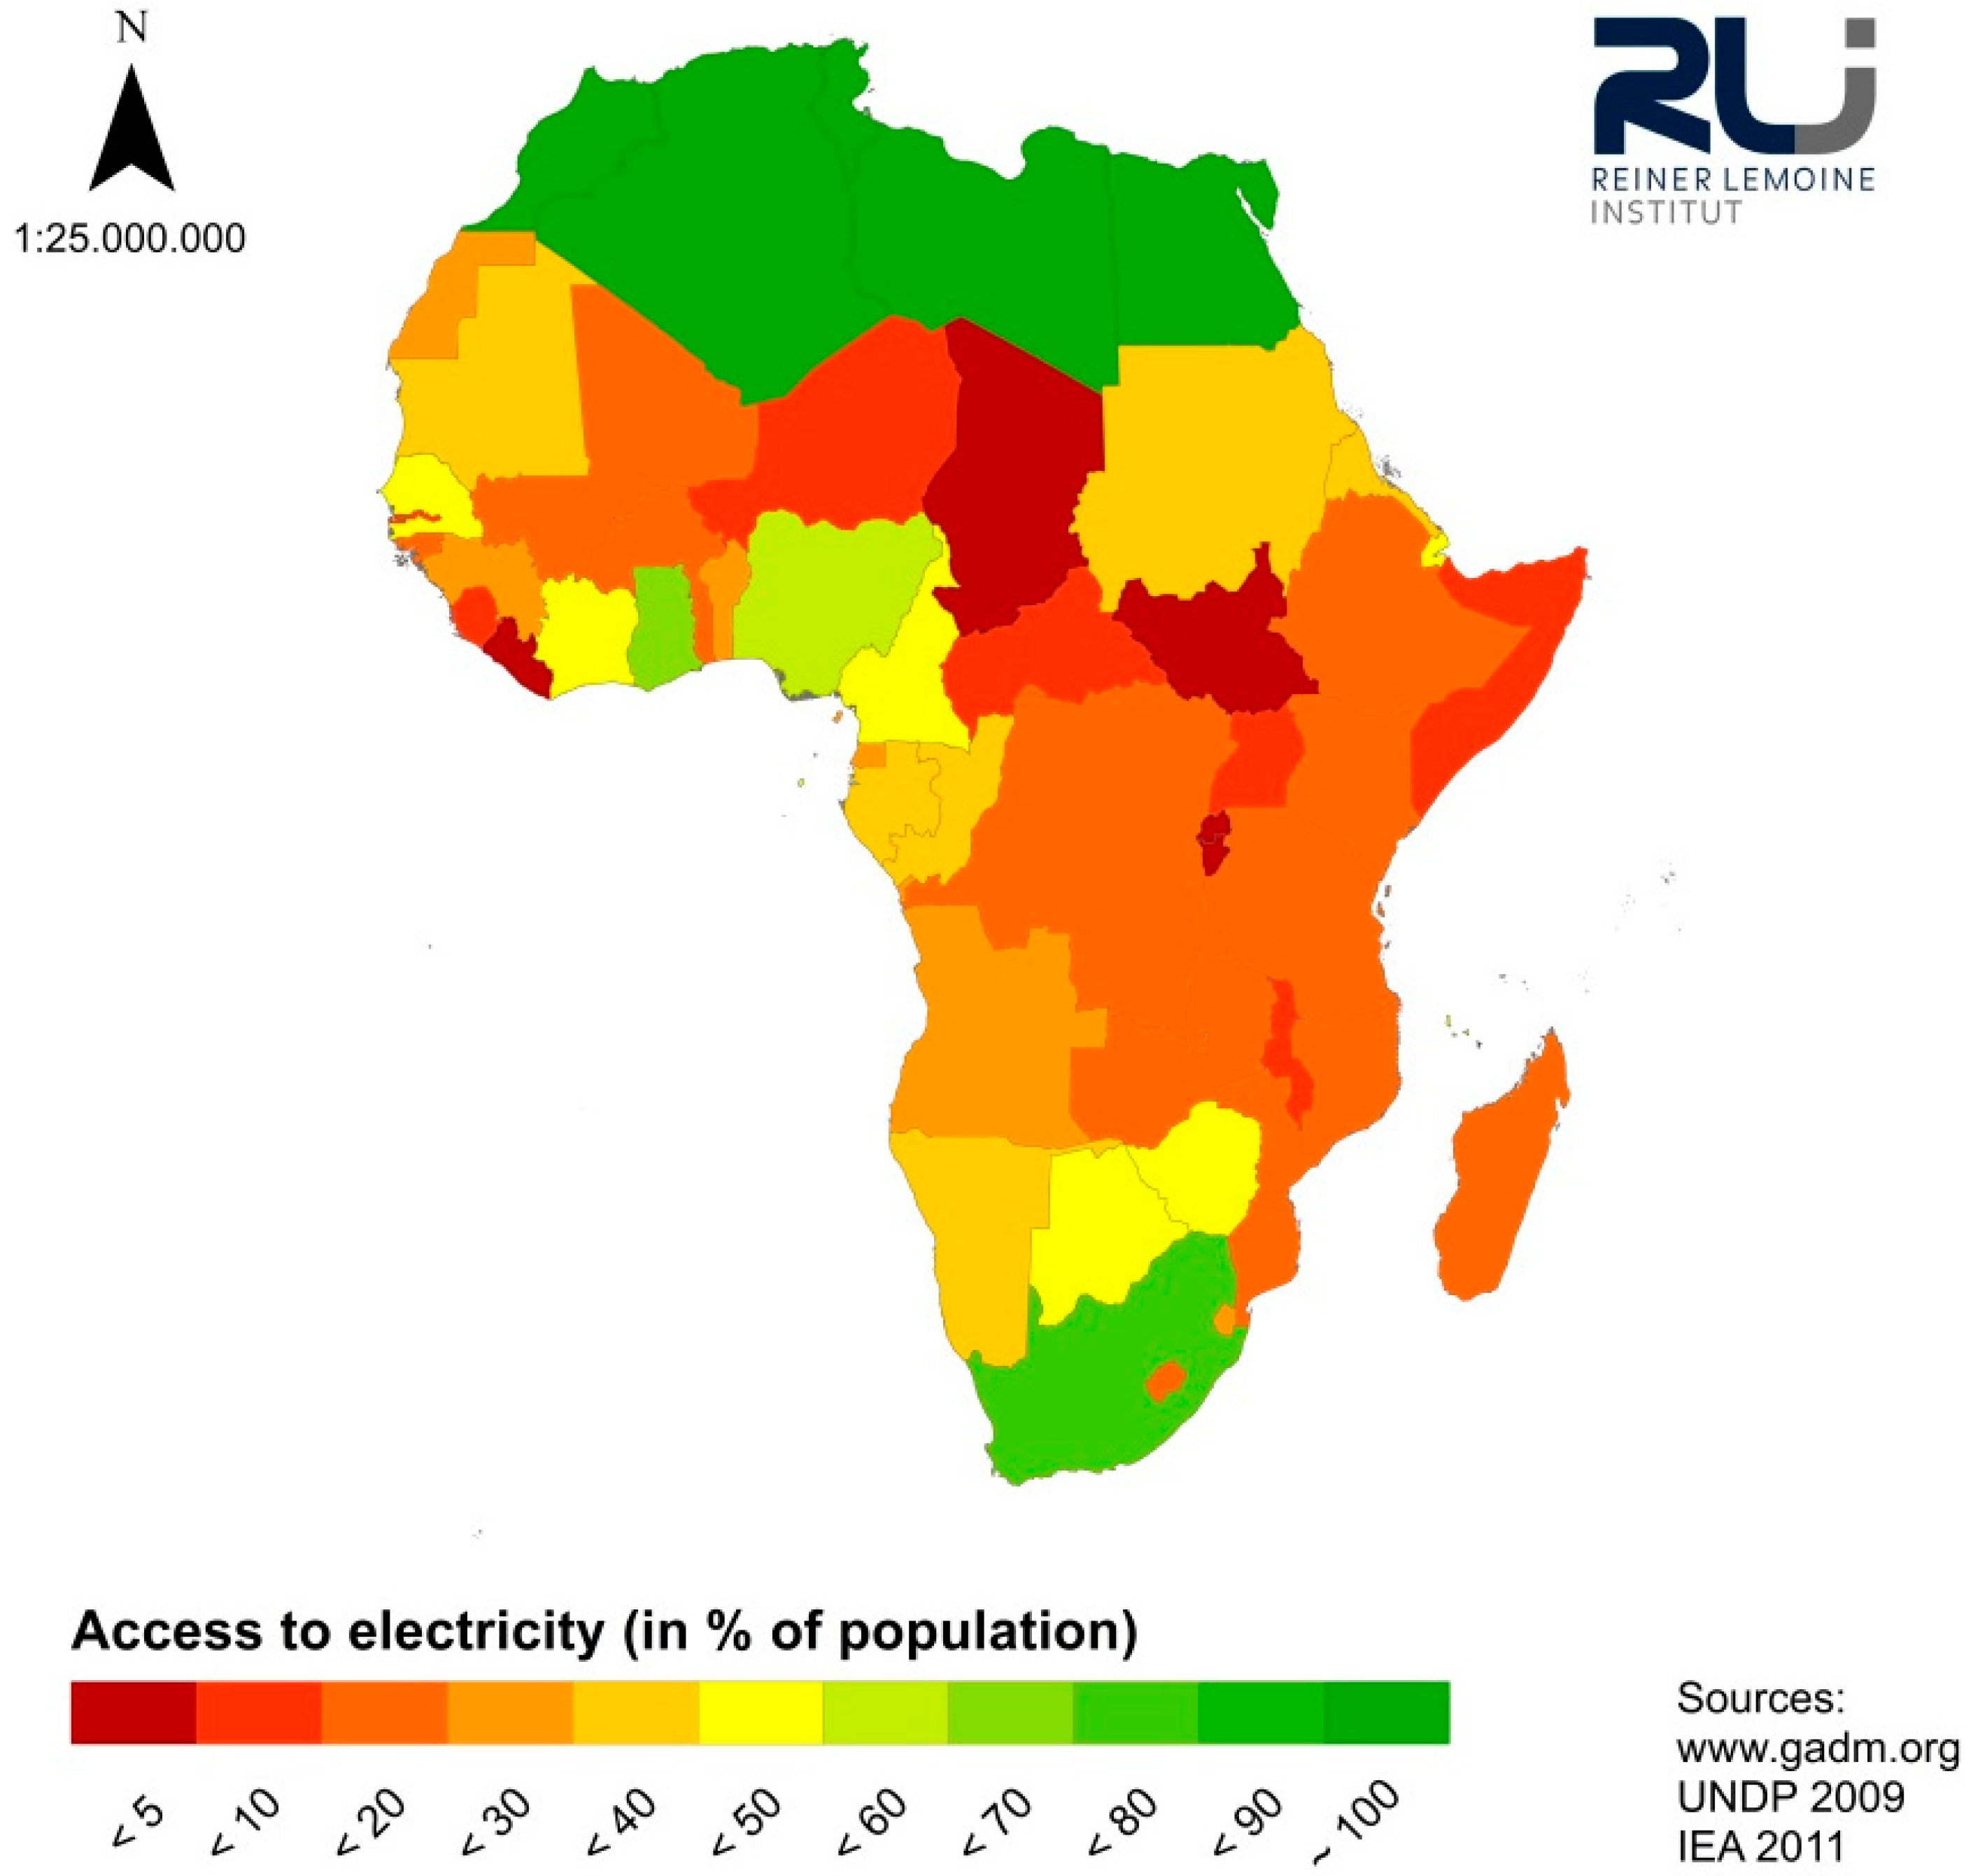
Figure 4. Typical load curve of a rural village [25]. This daily load curve was converted to a yearly load curve by repeating it 365 times.
Resources 04 00673 g004

3. Results of Spatial Analysis and Energy System Simulation

The results reveal a high potential for decentralized PV power in both scenarios. If world market diesel prices of 0.58 €/L [21] are assumed as base prices (Scenario I), the RE-based hybrid system outperforms the diesel-only system nearly all over the African continent (Figure 5). Only locations which are easily accessible or show below average global horizontal irradiation bear little potential for LCOE reduction through the implementation of PV-battery-diesel systems. In contrast, remote areas with high global horizontal irradiation (prime example Sahara) show a very high potential. The maximum LCOE reductions stand at 0.43 €/kWh.
Figure 5. Cost difference of a hybrid system compared to the diesel-only system in €/kWh. The figure reflects the results for Scenario I assuming world market diesel prices. Regions colored in green indicate high potential cost advantages of renewable hybrid systems.
Resources 04 00673 g005
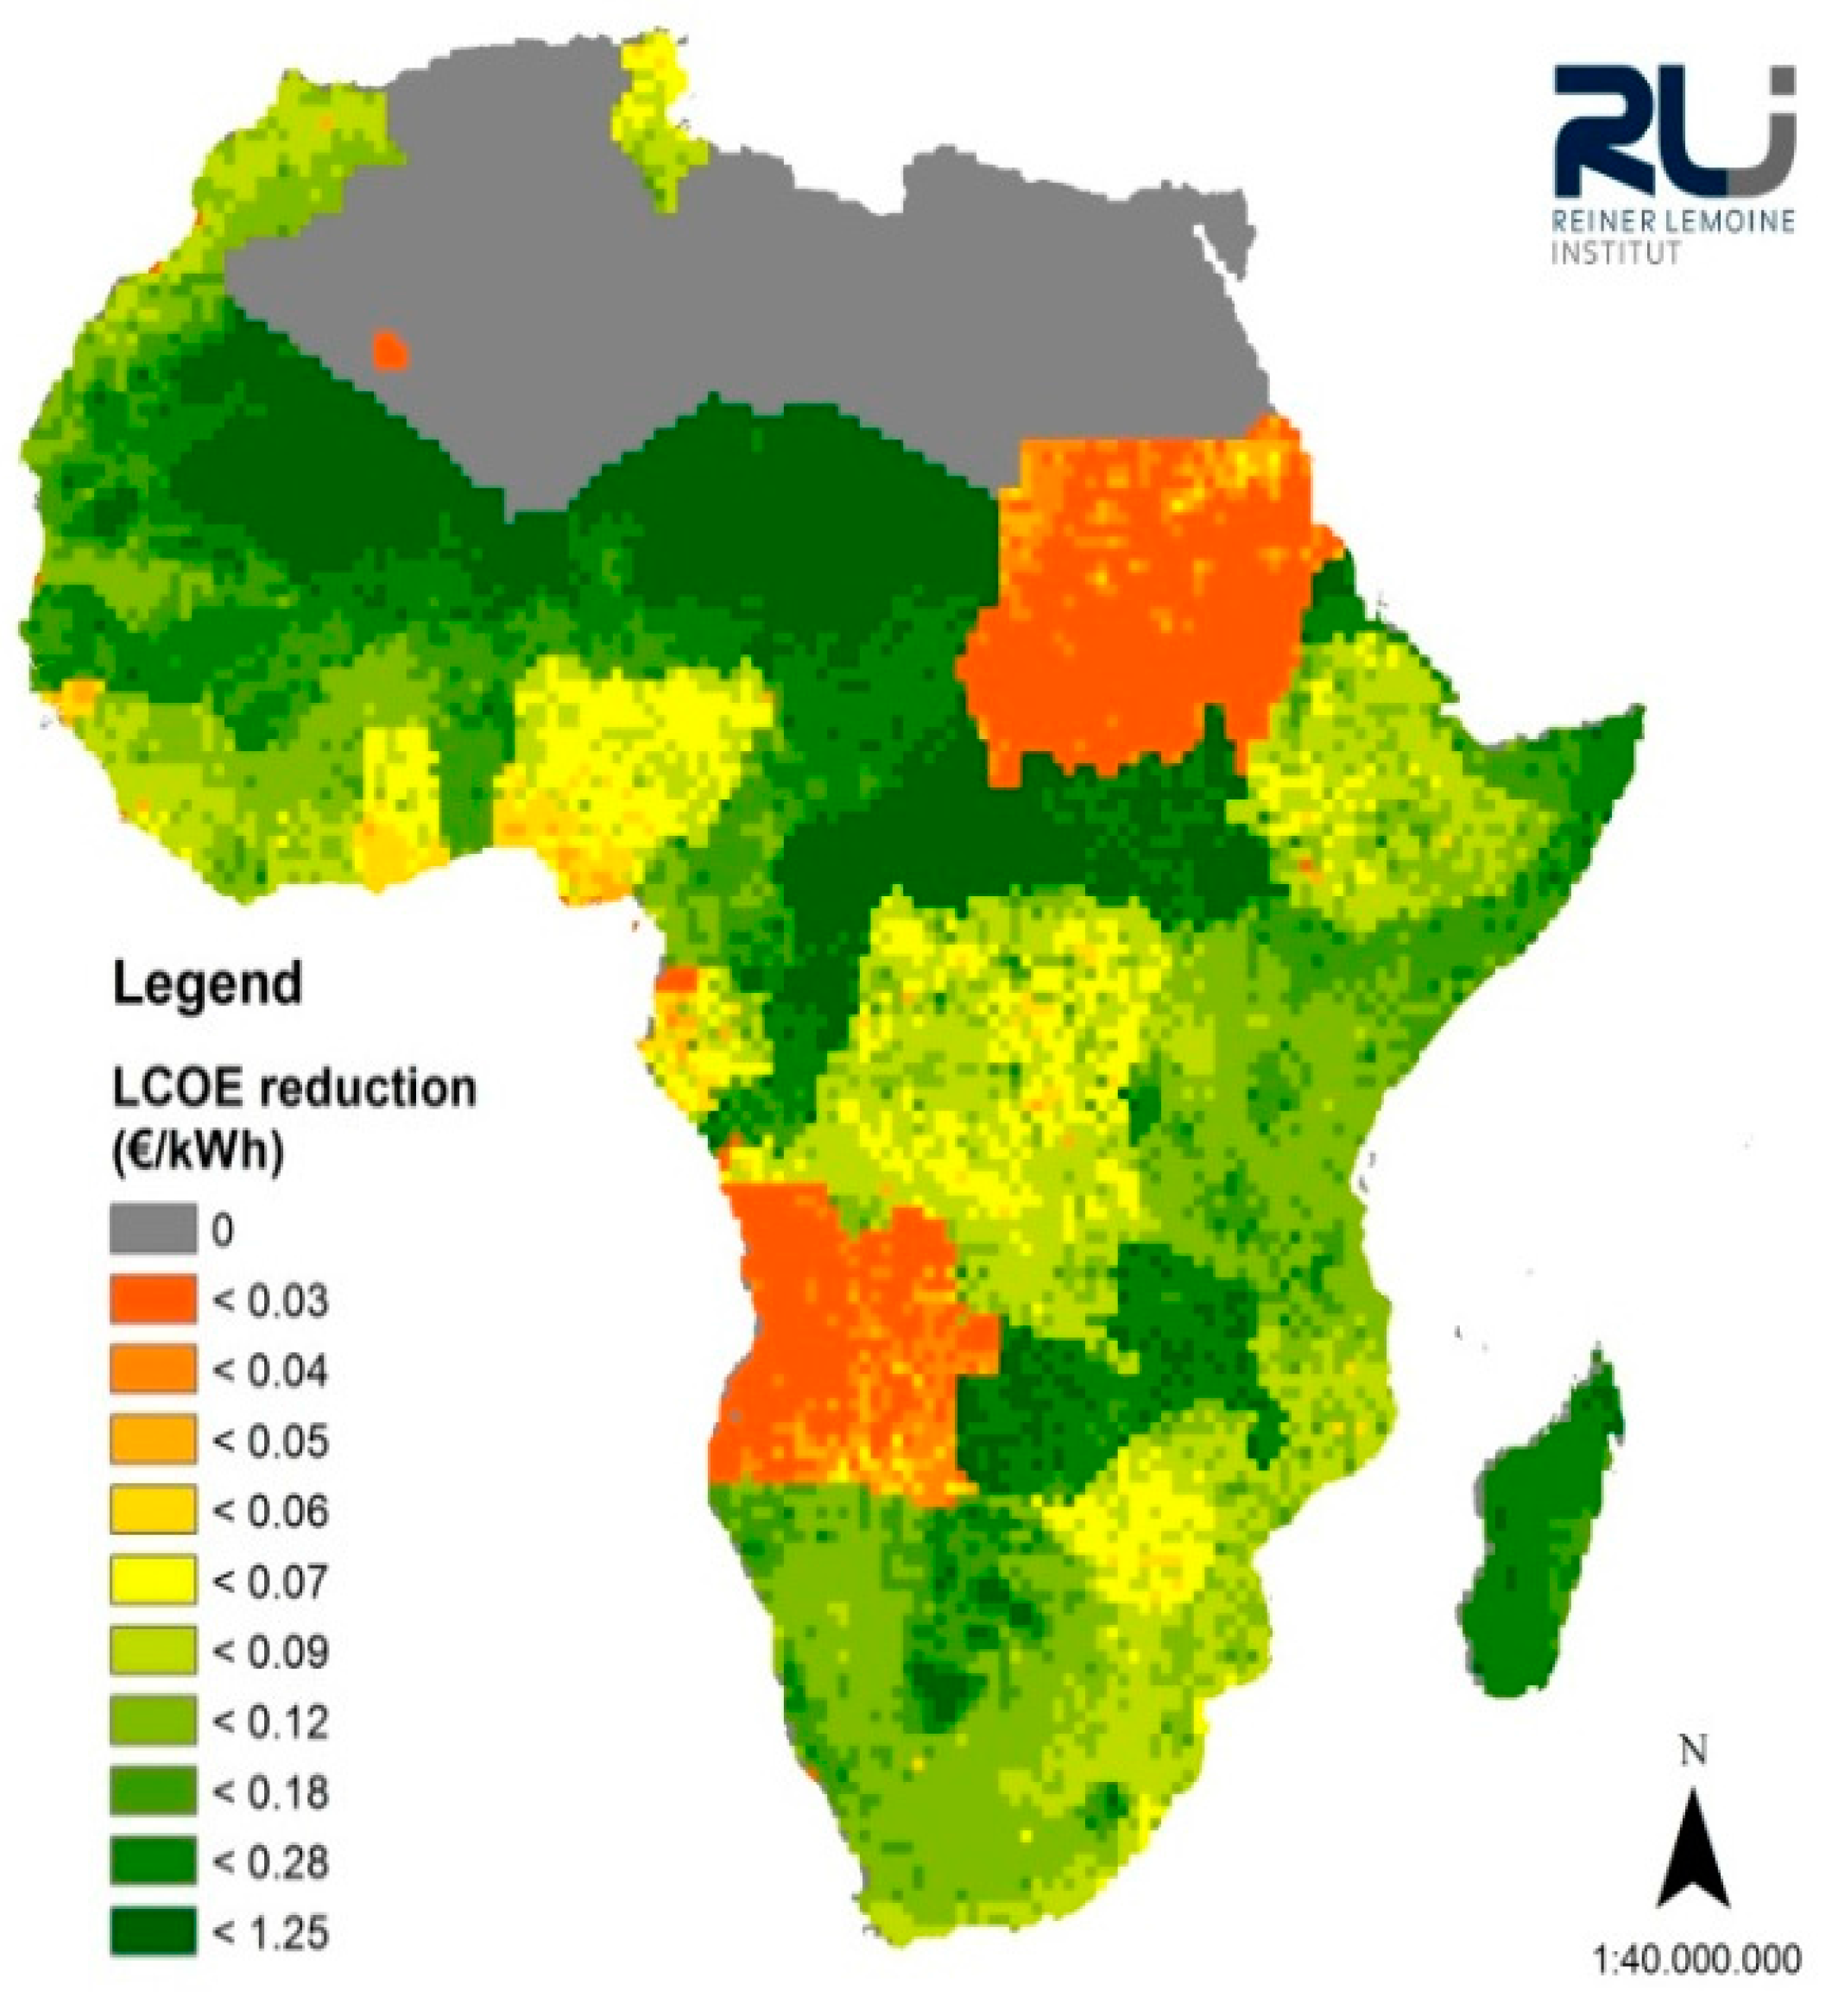
Scenario II, in which national diesel fuel retail prices were assumed as base prices [22,23], outlines the influence of national fuel taxes and subsidies on the potential for decentralized PV power (Figure 6). LCOE reductions increase significantly in countries with high national diesel prices (e.g., Central African Republic, Chad, Zambia), demonstrating peak LCOE reductions of approx. 1.24 €/kWh. In contrast, countries with high subsidies, such as Algeria, Libya, and Egypt, achieve almost no LCOE reductions at all. The same effect is observed less distinctively in countries such as Angola or Sudan. A study by Szabó et al. (2013) compared diesel to PV costs and shows similar results [26]. Nearly the same geographical area where solar PV is favored is identified in our work. One difference is that we find that PV is competitive in large parts of Angola, Nigeria, and Sudan. Furthermore, we find a lower LCOE reduction potential of 1.25 €/kWh compared to 2.5 €/kWh.
Figure 6. Cost difference of a hybrid system compared to the diesel-only system in €/kWh. The figure reflects the results for Scenario II assuming national diesel prices. Regions colored in green indicate very high potential cost advantages of renewable hybrid systems.
Resources 04 00673 g006
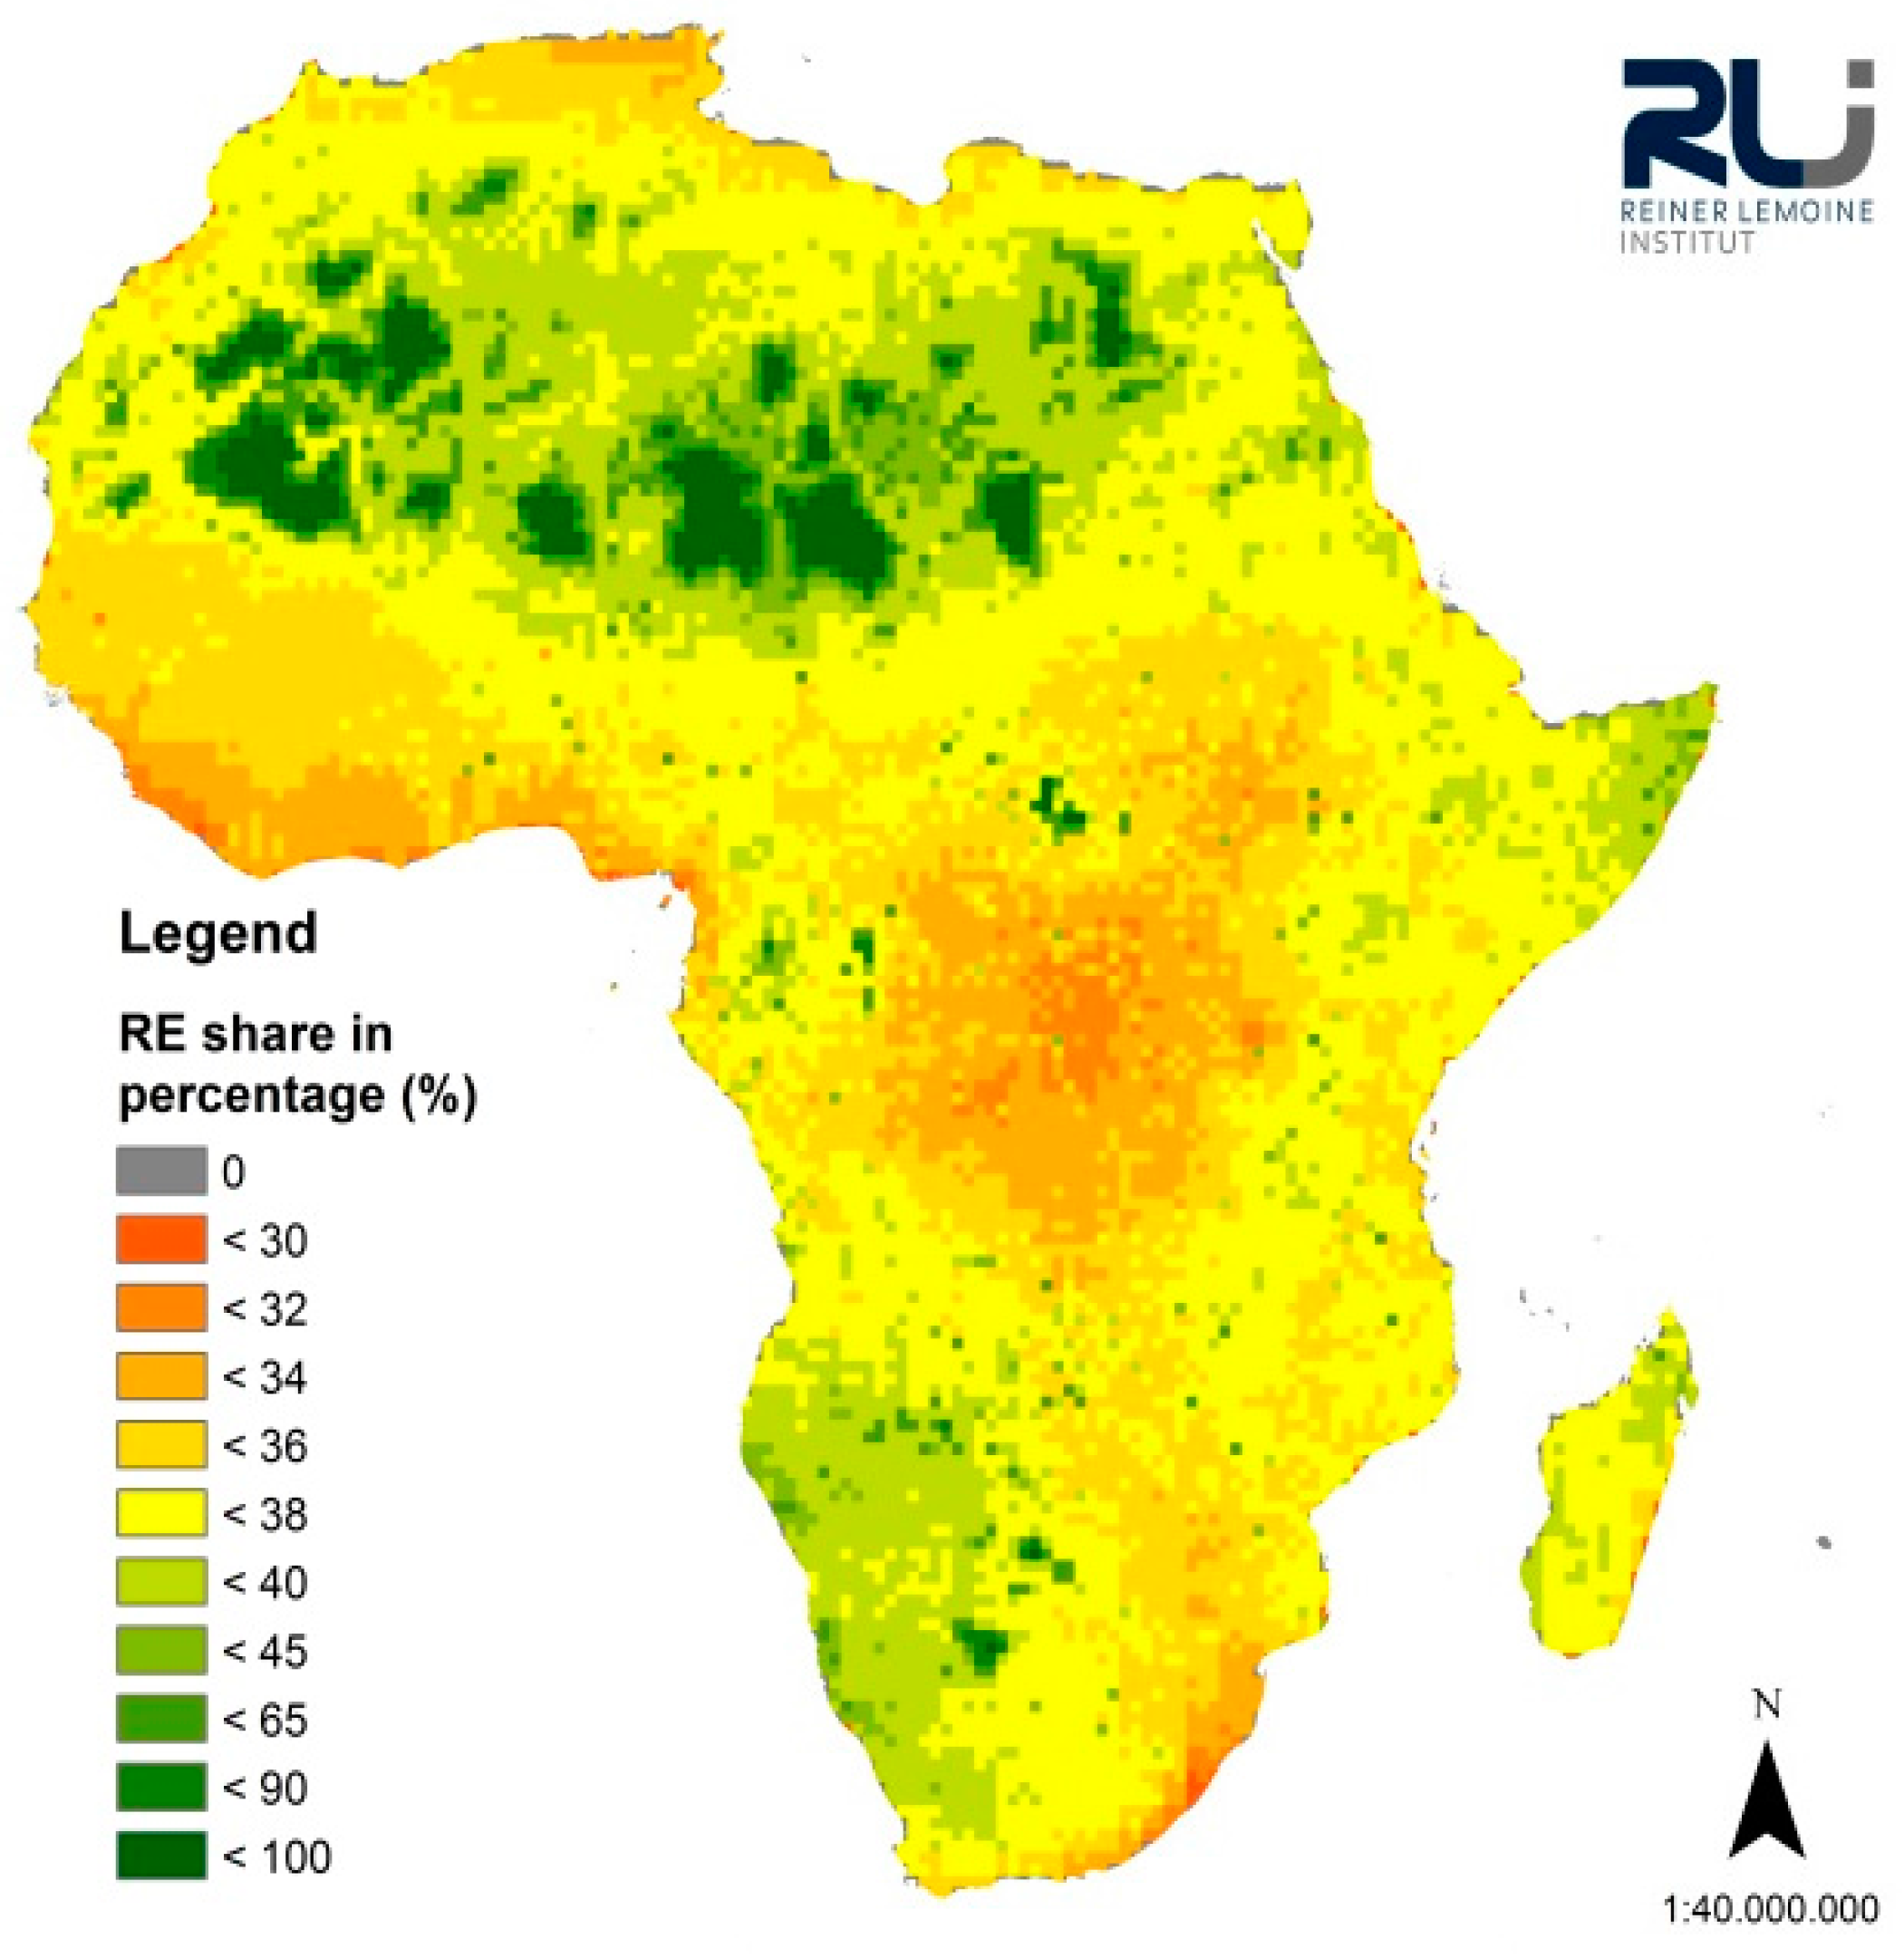
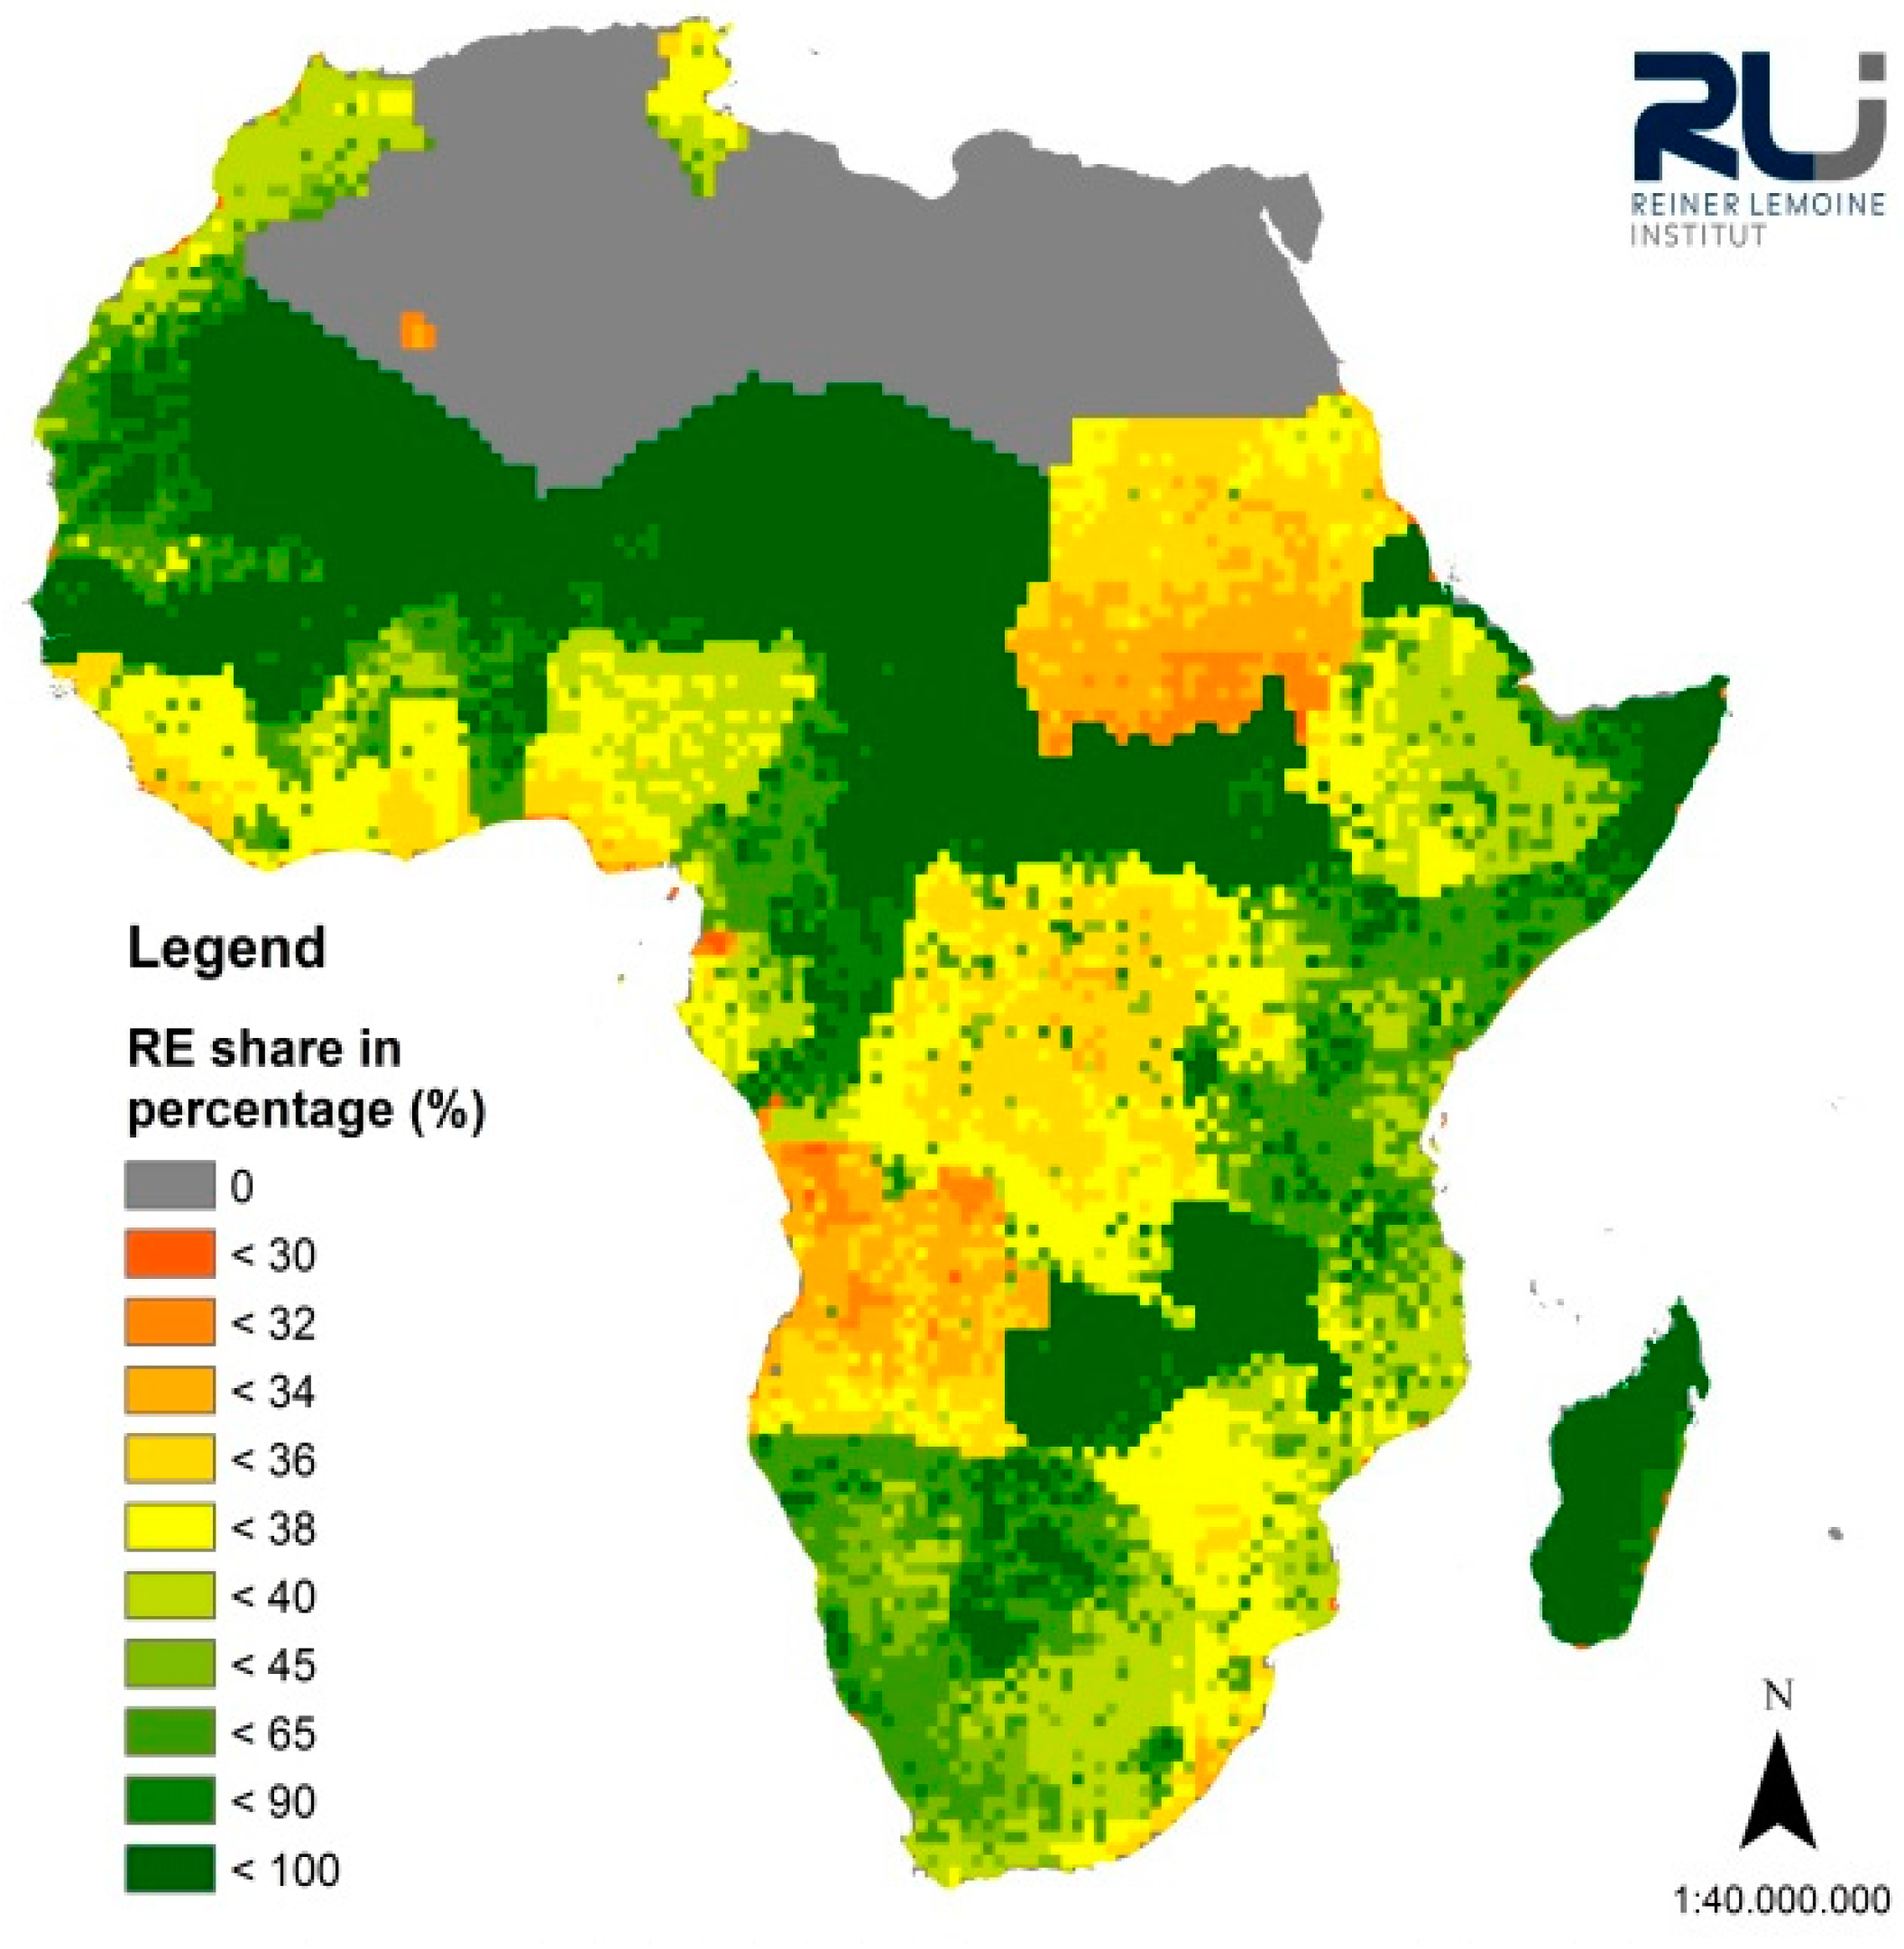
When assuming world market diesel prices, the RE share in the majority of hybrid system covers a range of 35% to 40% (Figure 7). Nevertheless, higher RE shares of more than 90% are possible in very remote areas where transport costs increase fuel costs above a critical cost level. In Scenario II three types of energy systems are observed (Figure 8): systems with no RE shares in countries with subsidized diesel prices, energy systems with RE shares of 35% to 40% in countries with diesel prices within world market diesel price range, and systems with high shares of above 90% in countries where the diesel price exceeds a critical price level due to taxes.
The above-stated findings are confirmed when looking at the five highest ranked countries in terms of LCOE reduction for both scenarios (Table 3 and Table 4). More country-specific results are provided in Table A2 and Table A3. Average RE shares in the hybrid system for the top five5 countries in Scenario I do not exceed 55%, whereas the average RE share lays above 90% for Scenario II. In summary, RE-based hybrid systems can significantly decrease power generation costs in the considered top five countries. Thus, the results demonstrate the specific regions in Africa that are most suitable for further implementation of renewable-based hybrid systems.
Figure 7. Share of RE power in hybrid system from high proportions of RE power in green colors to low proportions of PV power in red colors. The figure shows the results for Scenario I assuming world market diesel prices.
Resources 04 00673 g007
Figure 8. Share of RE power in hybrid system from high proportions of RE power in green colors to low proportions of PV power in red colors for both scenarios. The figure shows the results for Scenario II assuming national diesel prices.
Resources 04 00673 g008
Table 3. Top five countries in world market diesel price Scenario I, ranked according to highest LCOE savings. (10/90) indicate the respective percentiles.
CountryLCOE savings (avg.) (€/kWh)LCOE savings (10/90) (€/kWh)PV power / peak load (avg.) (kWp/kW)RE share (avg.) (%)
Niger0.110.05/0.261.9454.7
Mauritania0.100.05/0.211.9048.5
Chad0.080.05/0.161.6345.5
Mali0.080.05/0.141.6443.8
Algeria0.070.07/0.141.5141.5
Table 4. Top five countries in national diesel price scenario II, ranked according to highest LCOE savings. (10/90) indicate the respective percentiles.
CountryLCOE savings (avg.) (€/kWh)LCOE savings (10/90) (€/kWh)PV power / peak load (avg.) (kWp/kW)RE share (avg.) (%)
CAF*0.480.34/0.724.3493.0
Chad0.390.21/0.563.6995.1
Niger0.380.16/0.743.5294.3
Mali0.340.17/0.553.8494.0
South Sudan0.330.26/0.454.2292.3
Note: *Central African Republic

4. Sensitivity Analysis

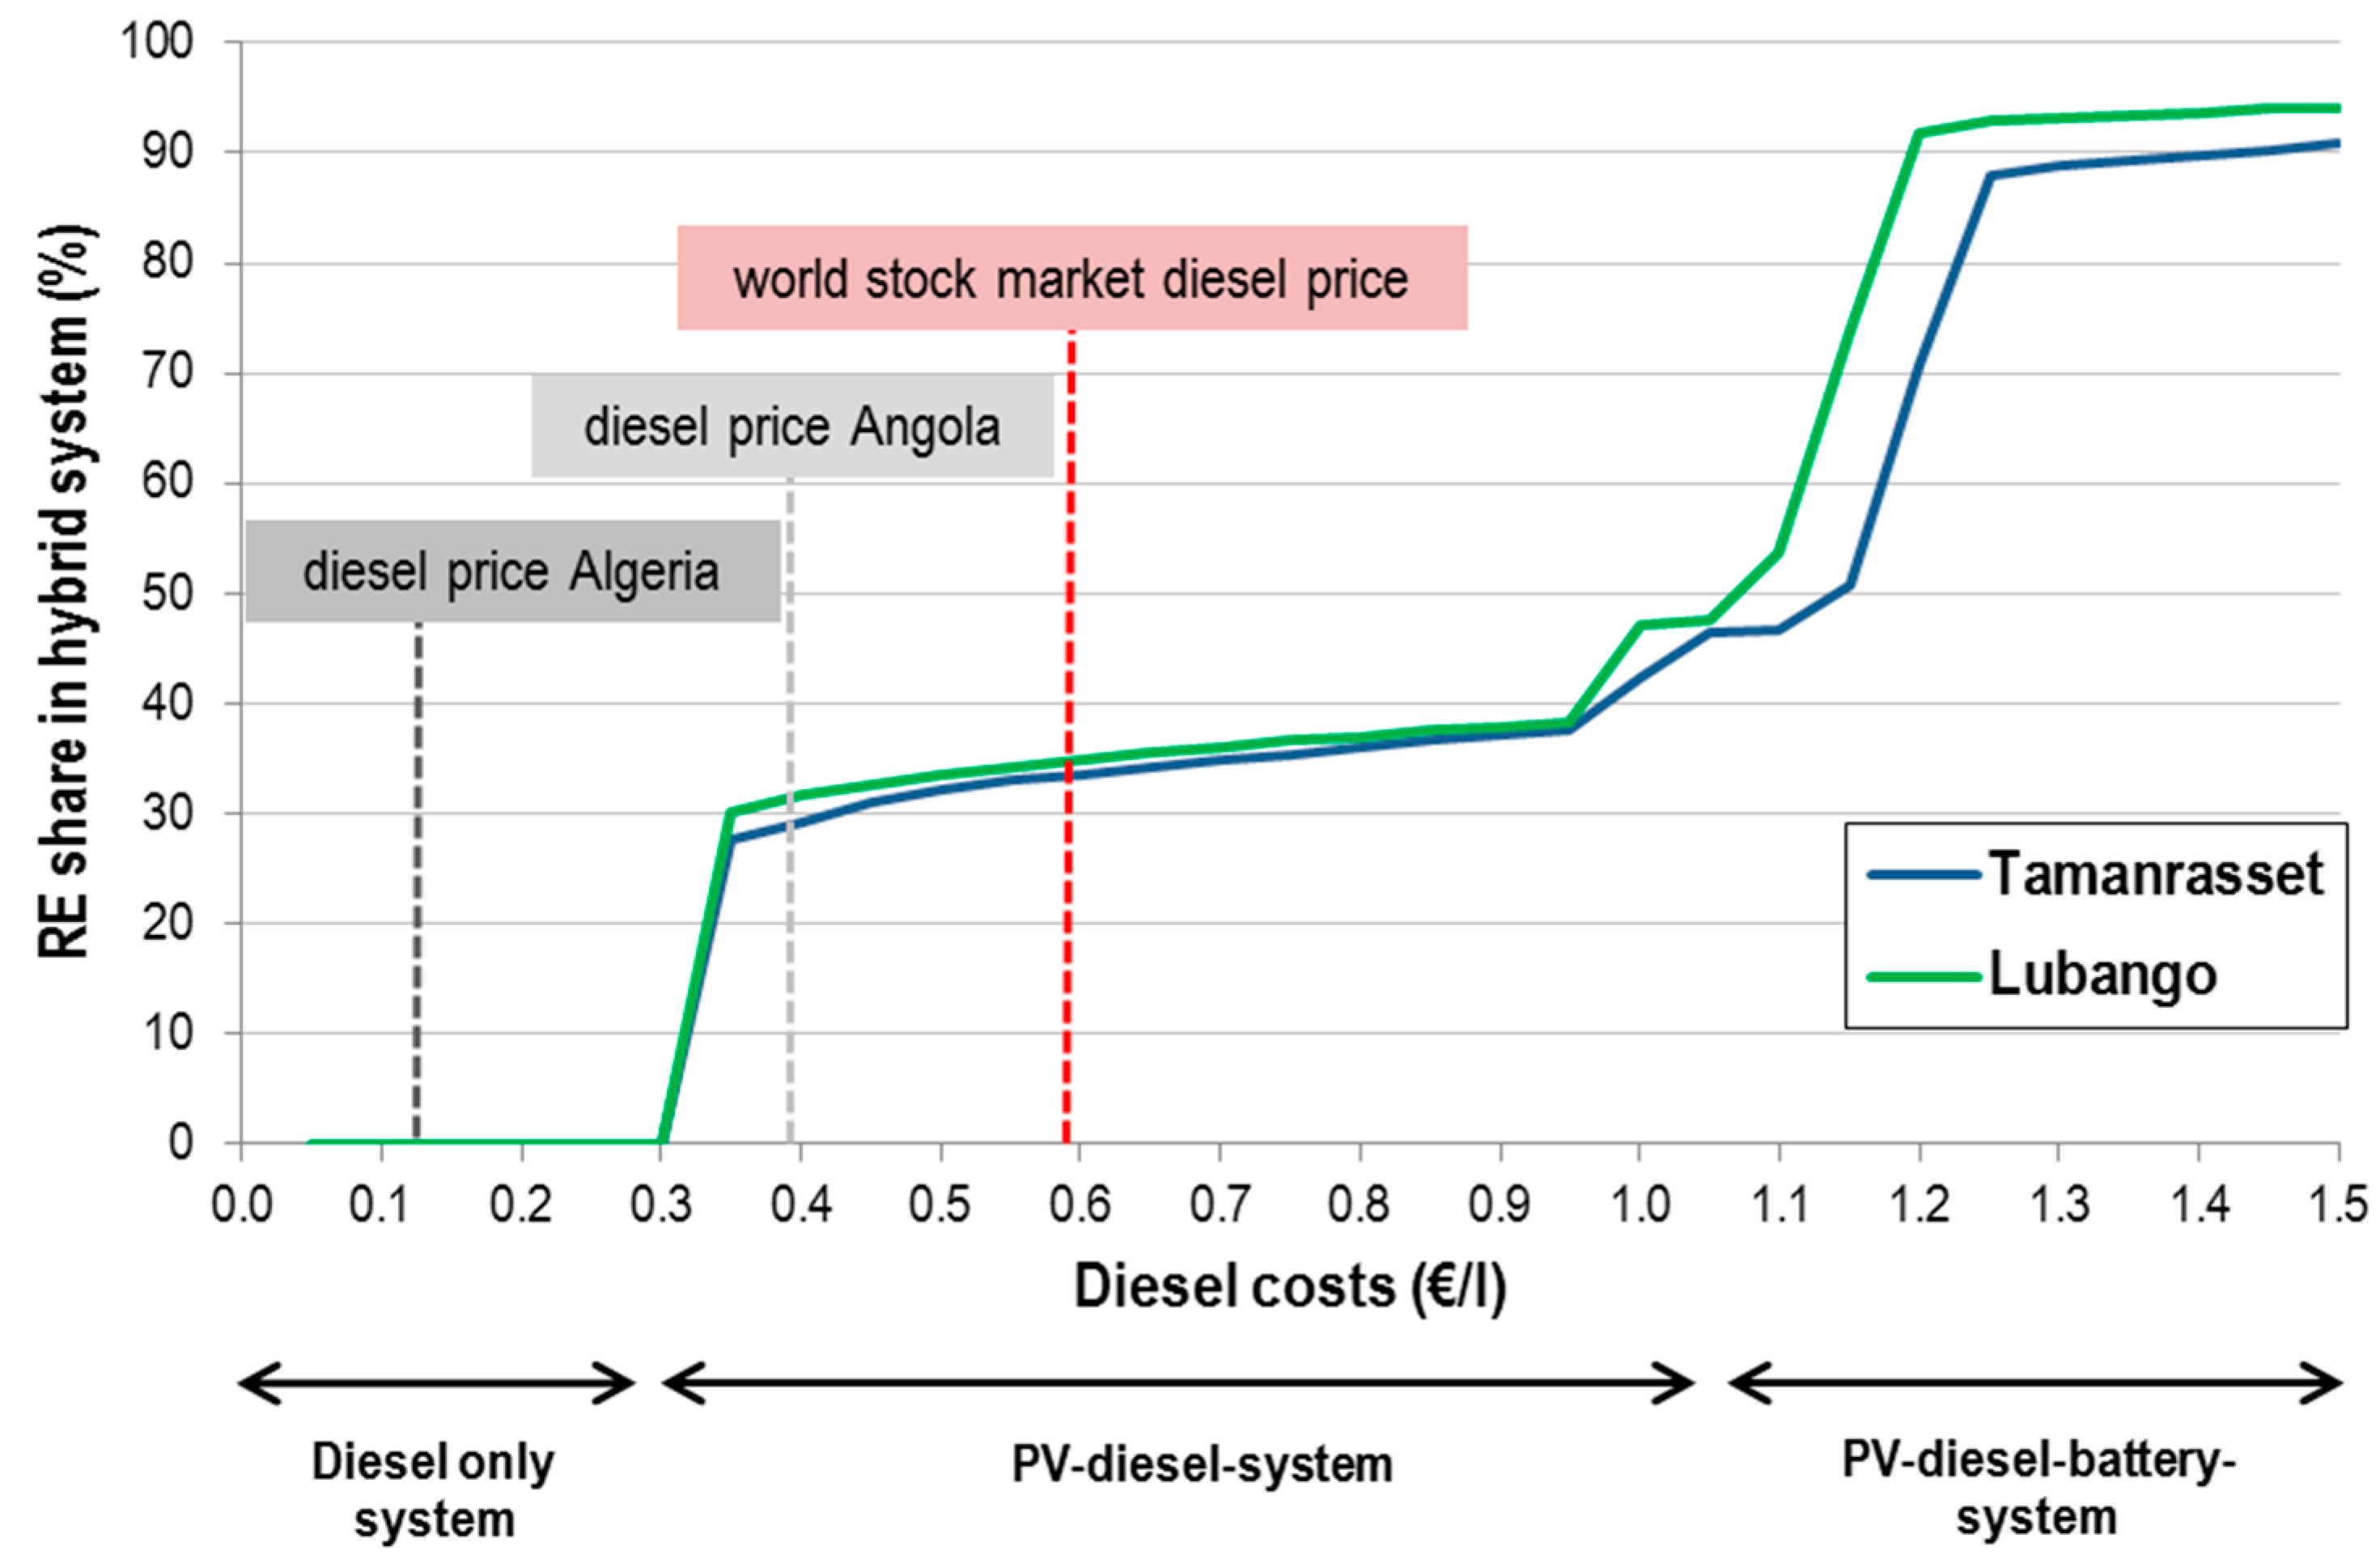
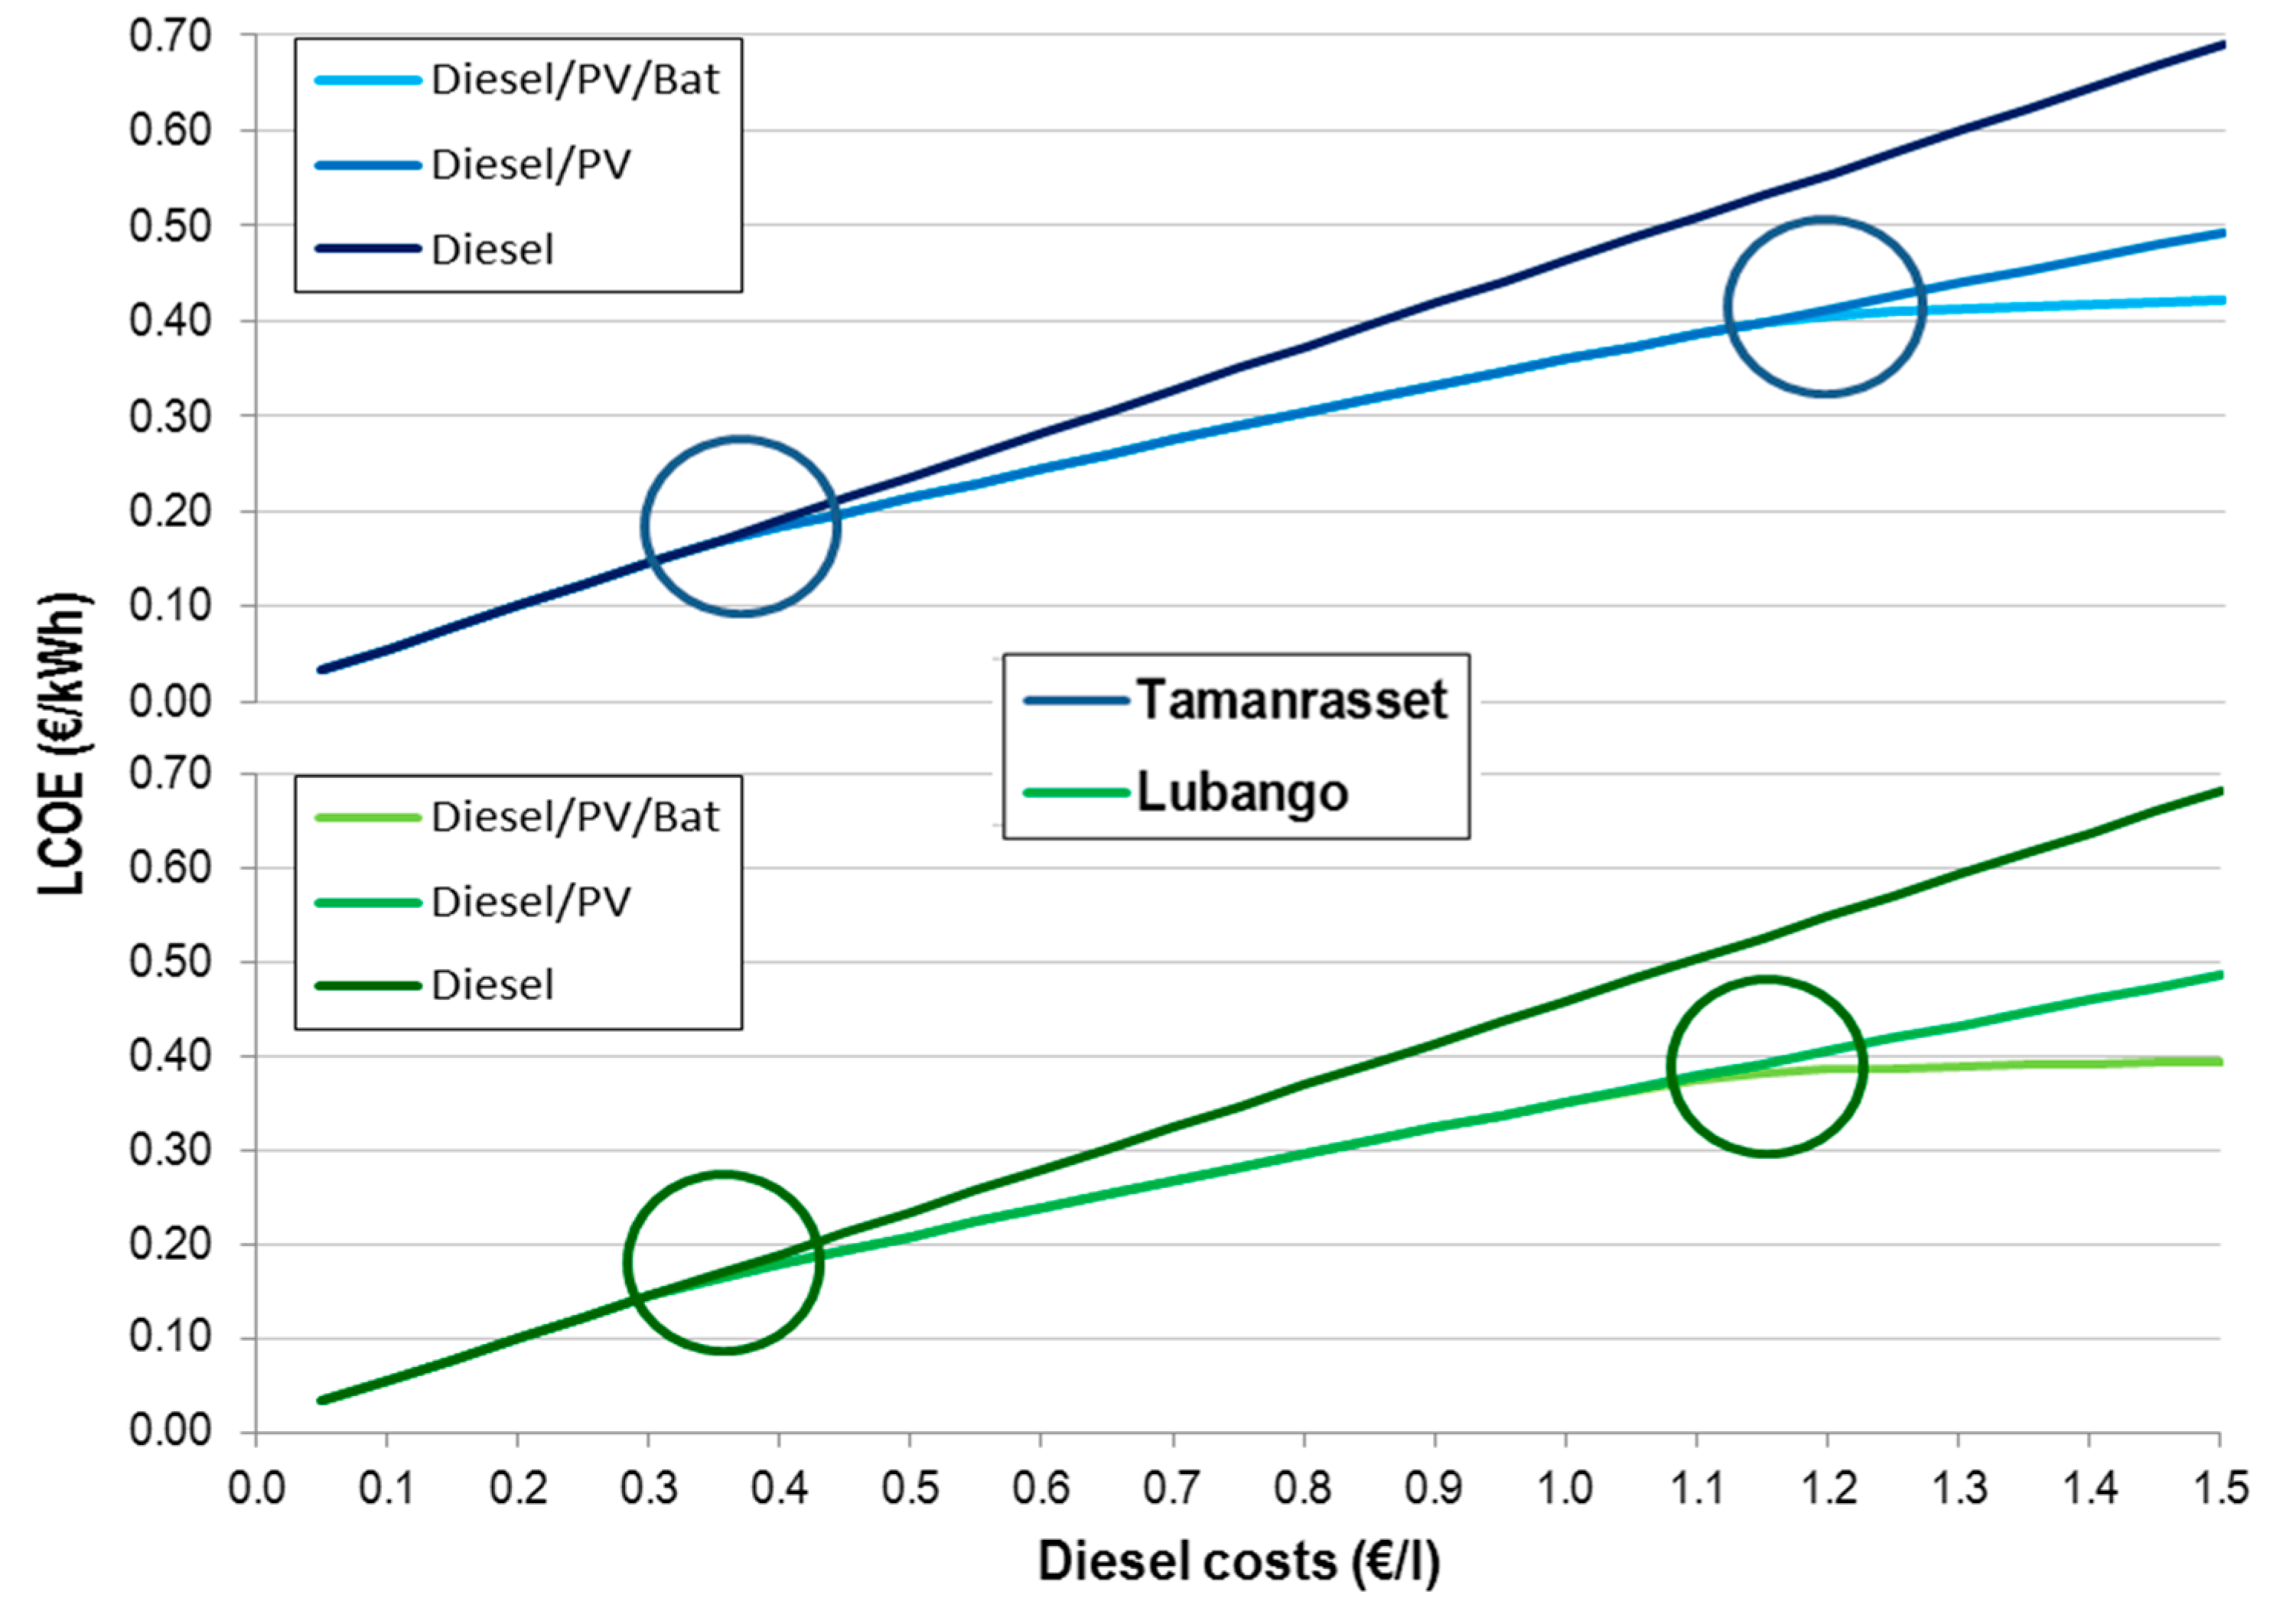
A sensitivity analysis was conducted to investigate the critical price level of diesel fuel costs for implementing PV. Two locations are selected for the example, Tamanrasset (Algeria) and Lubango (Angola). Both locations are chosen because the RE share in the optimal system differs distinctly between the two scenarios for these locations (∆ = 40%), since high diesel subsidies are in place in both countries. Within the analysis the diesel fuel price was increased in 5 ct€/L steps from 0.05 €/L to 1.50 €/L and its impact on the PV share and LCOE reduction for the optimized hybrid systems was analyzed. The results show the impact of fossil fuel price changes in steps of 5 ct€/L on the optimal hybrid system and the corresponding RE share (Figure 9) and LCOE (Figure 10). Both locations are characterized by high average annual irradiation (1900 kWh/m2/a for Tamanrasset, 1965 kWh/m2/a for Lubango) and relative proximity to the next city (91 min for Tamanrasset, 56 min for Lubango) and, hence, low diesel transport costs.
Three distinct sectors are visible: below about 0.30 €/L the diesel-only system is the most economical way of producing electricity. Between 0.30 €/L and 1.15 €/L the PV-diesel-system is more cost-effective than diesel alone. These findings correspond to a study conducted for a remote location in Algeria where a diesel threshold of 0.34 €/L was identified for implementation of a PV-diesel plant. [27]. The maximal RE-share that can be reached in such a system is limited to below 50%, since the load at night necessarily has to be satisfied by the diesel generator. Finally, with costs above 1.15 € for a liter of diesel PV plus batteries become cost competitive and maximal RE-shares well above 90% are possible since the battery allows a shift to energy produced by PV during daytime into the evening hours with maximum demand. The transitions from sector to sector are governed not by the diesel price alone but rather by the relative costs for diesel compared to PV and batteries. Consequently, further cost reductions that can be expected, especially in the storage sector, will shift the critical diesel price levels to lower values.
Figure 9. Influence of diesel price increase on RE share (%) on the optimal hybrid system configuration and performance.
Resources 04 00673 g009
Figure 10. Influence of diesel price increase on LCOE (€/kWh) and the savings potential of the optimal hybrid system (with and without batteries) with respect to the pure diesel system. Circles indicate the transition points where PV and batteries become cost-competitive.
Resources 04 00673 g010
For the cost parameters assumed in this study we compare the results of the sensitivity analysis to the findings for the two diesel price scenarios. For Tamanrasset (Algeria) the subsidies are so high and the resulting local diesel price so low that the diesel-only system is, in fact, the favorable means of producing electricity. This is a clear example where fossil fuel subsidies are a main obstacle for the proliferation of renewable energies. For Lubango (Angola) the subsidies are not as dominant and introducing PV to the system does generate cost advantages. However, these advantages are reduced by the subsidies lowering the attractiveness of implementing PV.
The price difference between the national diesel prices and the world market price reflects the high opportunity costs which are currently lost due to fuel subsidization. However, even a diesel price at world market levels of around 0.60 €/L does not enable high shares of RE power, since PV-diesel systems without battery are the most cost effective systems for these price levels. This will change only if the costs for batteries can be significantly reduced in the future or diesel prices increase on world market level. In opposition to the subsidies, the taxes on fossil fuels favor the deployment of renewable systems and even make systems with RE shares higher than 90% economically viable. The range of RE shares underlines the influence of governments by setting subsidy or tax levels of fossil fuels.

5. Discussion and Conclusions

Several key findings can be derived from focusing on the effect of diesel costs on PV-based hybrid systems. In order to enable hybrid systems with high RE shares, diesel fuel costs must surpass a threshold of 1.15 €/L under fixed PV Capex of 1600 €/kW and battery CAPEX of 350 €/kWh. High diesel fuel costs allow for the implementation of batteries which shift solar power towards the evening hours and facilitate the supply of the evening demand peak with RE power. In other words, the substitution of significant amounts of diesel power generation and, thus, fuel savings results in a high LCOE reduction for high fuel prices.
Under the chosen conditions, hybrid systems comprised of only PV modules and a diesel generator with RE shares of around 40% displayed the most cost effective energy system option within the wide range of diesel prices of 0.30 €/L to 1.10 €/L. Hybrid systems cannot compete with diesel-only systems below this range. However, considering current world market diesel prices of 0.58 €/L, which are most likely to increase in the future, diesel prices of 0.30 €/L are only possible with fuel subsidization. These subsidies reflect a strong economic burden for the countries, either by direct payments for diesel-importing countries or by the occurring opportunity costs for diesel-exporting countries. In a following study, the influence of PV CAPEX, battery CAPEX, and changes in WACC on LCOE should be studied aside from changes in diesel fuel costs. This would allow for incorporating the dynamic cost developments of renewable technologies and would enable to characterize the costs thresholds more in detail. With decreasing PV and battery CAPEX it is expected that the diesel fuel price threshold will further decrease.
In a further study it is necessary to compare the economic feasibility of hybrid systems with grid power supply and power grid extension. The costs for grid extension could be incorporated into a least-cost optimization model taking key criteria such as grid extension costs, geographical barriers, and energy demand into account.
The study showed that hybridization of diesel-based off-grid systems with PV and storage systems can lead to a significant electricity cost reduction. Especially when considering Figure 1 and Figure 6, it becomes clear that solar-based hybrid systems can contribute to the further facilitation of electricity access in countries with very low access rates to electric energy. Politicians should use subsidies and taxes to direct the implementation of decentralized systems towards cost-effective and environmental friendly PV-hybrid systems.

Acknowledgments

We thank Robert Seguin and Christian Breyer for their contributions during the conception of this work. In addition we thank Claus Beneking for supporting this research project and the Reiner Lemoine-Foundation for partly financing this work.

Author Contributions

Hendrik Huyskens and Philipp Blechinger developed the energy system model. Catherina Cader and Paul Bertheau conducted the spatial analysis necessary for this work. All authors gave support in the interpretation of the results and the preparation of the manuscript. Paul Bertheau wrote the paper.

Conflicts of Interest

The authors declare no conflict of interest.

Appendixes

Table A1. National diesel prices (€/L) used as input values for the corresponding country in the simulation.
CountryDiesel price (€/L)CountryDiesel price (€/L)
Algeria0.12Malawi1.32
Angola0.39Mali1.16
Benin1.12Mauritania0.92
Botswana0.90Morocco0.82
Burkina Faso0.92Mozambique0.80
Burundi1.32Namibia0.80
Cameroon1.01Niger1.07
Cent. Afr. Rep.1.57Nigeria0.71
Chad1.21Rep. of Congo1.18
Côte d'Ivoire0.93Rwanda1.10
Dem. Rep. Congo0.78São Tomé and Príncipe0.66
Djibouti0.99Senegal1.19
Egypt0.12Sierra Leone0.87
Eq. Guinea0.39Somalia0.99
Eritrea1.25South Africa0.82
Ethiopia0.72South Sudan1.44
Gabon0.66Sudan0.39
Gambia1.19Swaziland1.01
Ghana0.73Tanzania0.92
Guinea0.88Togo1.09
Guinea-Bissau0.61Tunisia0.76
Kenya0.89Uganda0.90
Lesotho0.99Western Sahara0.82
Liberia0.89Zambia1.19
Libya0.07Zimbabwe0.71
Madagascar1.18
Table A2. Results for all considered countries world market scenario—Scenario I.
CountryLCOE savings (avg.) (€/kWh)PV power / peak load (avg.) (kWp/kW)RE share (avg.) (%)
Algeria0.081.5141.5
Angola0.061.4537.8
Benin0.051.3735.8
Botswana0.071.4740.5
Burkina Faso0.051.3235.9
Burundi0.041.3533.9
Cameroon0.051.4636.2
Cent. Afr. Rep.0.061.5037.6
Chad0.091.6445.5
Côte d'Ivoire0.041.3833.7
Dem. Rep. Congo0.041.4033.7
Djibouti0.051.30 37.3
Egypt0.071.4241.2
Equatorial Guinea0.041.5434.5
Eritrea0.061.2936.9
Ethiopia0.061.3537.0
Gabon0.061.7637.8
Gambia0.051.3035.1
Ghana0.041.3734.3
Guinea0.041.3234.4
Guinea-Bissau0.051.3134.6
Kenya0.061.3536.9
Lesotho0.061.3336.7
Liberia0.041.4132.5
Libya0.071.4039.6
Madagascar0.051.3237.6
Malawi0.051.3036.3
Mali0.081.6543.8
Mauritania0.101.9048.5
Morocco0.051.2936.8
Mozambique0.051.3536.3
Namibia0.071.3639.2
Niger0.121.9554.7
Nigeria0.041.3636.2
Republic of Congo0.061.7238.0
Rwanda0.031.3533.6
Sao Tome and Principe0.041.3134.4
Senegal0.041.2934.9
Sierra Leone0.031.3532.4
Somalia0.061.3938.3
South Africa0.051.2736.3
South Sudan0.051.3634.8
Sudan0.061.2837.0
Swaziland0.041.2733.3
Tanzania0.051.3436.3
Togo0.041.3935.4
Tunisia0.041.3435.3
Uganda0.041.3435.1
Western Sahara0.071.3937.9
Zambia0.061.3336.8
Zimbabwe0.051.2935.7
Table A3. Results for all considered countries national diesel price scenario—Scenario II.
CountryLCOE savings (avg.) (€/kWh)PV power / peak load (avg.) (kWp/kW)RE share (avg.) (%)
Algeria0.000.010.2
Angola0.031.1933.9
Benin0.173.3677.8
Botswana0.182.7069.1
Burkina Faso0.112.0149.0
Burundi0.224.2790.7
Cameroon0.142.6958.9
Cent. Afr. Rep.0.484.3493.0
Chad0.393.6995.1
Côte d'Ivoire0.101.9141.3
Dem. Rep. Congo0.081.6937.7
Djibouti0.142.7371.0
Egypt0.000.000.0
Equatorial Guinea0.011.2129.1
Eritrea0.273.7595.5
Ethiopia0.091.5740.7
Gabon0.071.9941.0
Gambia0.203.9492.5
Ghana0.061.5336.4
Guinea0.091.6338.6
Guinea-Bissau0.051.3435.0
Kenya0.122.2054.4
Lesotho0.172.9171.8
Liberia0.091.8338.0
Libya0.000.000.0
Madagascar0.223.5591.5
Malawi0.273.7892.8
Mali0.353.8494.0
Mauritania0.273.3780.9
Morocco0.091.5540.7
Mozambique0.091.6240.4
Namibia0.121.9352.1
Niger0.393.5294.3
Nigeria0.071.4937.9
Republic of Congo0.274.3384.6
Rwanda0.132.5053.3
Sao Tome and Principe0.051.4035.7
Senegal0.193.9191.9
Sierra Leone0.081.6536.3
Somalia0.173.0878.4
South Africa0.091.5941.4
South Sudan0.344.2392.3
Sudan0.021.1234.3
Swaziland0.111.9744.7
Tanzania0.122.0951.3
Togo0.142.7862.3
Tunisia0.081.5638.2
Uganda0.101.7842.5
Western Sahara0.132.2456.3
Zambia0.263.7192.7
Zimbabwe0.071.4037.2

References

  1. The High Cost of Electricity Generation in Africa. African Development Bank Group. Available online: http://www.afdb.org/en/blogs/afdb-championing-inclusive-growth-across-africa/post/the-high-cost-of-electricity-generation-in-africa-11496/ (accessed on 20 February 2015).
  2. Energy Subsidy Reform in Sub-Saharan Africa: Experiences and Lessons. International Monetary Fund. Available online: https://www.imf.org/external/pubs/ft/dp/2013/afr1302.pdf (accessed on 25 August 2015).
  3. Doll, C.N.; Pachauri, S. Estimating rural populations without access to electricity in developing countries through night-time light satellite imagery. Energy Policy 2010, 38, 5661–5670. [Google Scholar] [CrossRef]
  4. Global Administrative Areas. Available online: http://www.gadm.org/ (accessed on 27 August 2015).
  5. Energy Access in Developing Countries. United Nations Development Programme (UNDP). 2009. Available online: http://www.undp.org/content/undp/en/home/librarypage/environment-energy/sustainable_energy/energy-access-in-developing-countries.html (accessed on 27 August 2015).
  6. World Energy Outlook 2010. International Energy Agency (IEA). Available online: http://www.worldenergyoutlook.org/publications/weo-2011/ (accessed on 27 August 2015).
  7. Chaurey, A.; Kandpal, T.C. Assessment and evaluation of PV based decentralized rural electrification: An overview. Renew. Sustain. Energy Rev. 2010, 14, 2266–2278. [Google Scholar] [CrossRef]
  8. Cader, C.; Hlusiak, M.; Breyer, C. High-resolution global cost advantages of stand-alone small-scale hybrid PV-Battery-Diesel Systems. In Proceedings of the 2nd International Conference on Micro Perspectives for Decentralized Energy Supply, Berlin, Germany, 28 February–1 March 2013.
  9. Bertheau, P.; Cader, C.; Müller, H.; Blechinger, P.; Seguin, R.; Breyer, C. Energy Storage Potential for Solar Based Hybridization of Off-Grid Diesel Power Plants in Tanzania. Energy Procedia 2014, 46, 287–293. [Google Scholar] [CrossRef]
  10. Ahlborg, H.; Hammar, L. Drivers and barriers to rural electrification in Tanzania and Mozambique-Grid-extension, off-grid, and renewable energy technologies. Renew. Energy 2014, 61, 117–124. [Google Scholar] [CrossRef]
  11. Szabó, S.; Bódis, K.; Huld, T.; Moner-Girona, M. Energy solutions in rural Africa: Mapping electrification costs of distributed solar and diesel generation versus grid extension. Environ. Res. Lett. 2011, 6. [Google Scholar] [CrossRef]
  12. How Large Are Global Energy Subsidies? International Monetary Fund. Available online: https://www.imf.org/external/pubs/ft/wp/2015/wp15105.pdf (accessed on 25 August 2015).
  13. Mini-Grid Policy Toolkit. European Union Energy Initiative Partnership Dialogue Facility (EUEI PDF). Available online: http://minigridpolicytoolkit.euei-pdf.org/downloads (accessed on 12 May 2015).
  14. Off-Grid Renewable Energy Systems: Status and Methodological Issues. International Renewable Energy Agency (IRENA) (2015). Available online: http://www.irena.org/DocumentDownloads/Publications/IRENA_Off-grid_Renewable_Systems_WP_2015.pdf (accessed on 12 May 2015).
  15. World Energy Outlook 2010. International Energy Agency (IEA). Available online: http://www.worldenergyoutlook.org/media/weo2010.pdf (accessed on 12 May 2015).
  16. Stackhouse, P.W.; Whitlock, C.H. Surface meteorology and Solar Energy (SSE) release 6.0, NASA SSE 6.0. Earth Science Enterprise Program, National Aeronautic and Space Administration (NASA): Langley, VA, USA, 2008. Available online: http://eosweb.larc.nasa.gov/sse/ (accessed on 20 February 2015). [Google Scholar]
  17. Huld, T.; Šúri, M.; Dunlop, E.D. Geographical variation of the conversion efficiency of crystalline silicon photovoltaic modules in Europe. Prog. Photovolt. Res. Appl. 2008, 16, 595–607. [Google Scholar] [CrossRef]
  18. Nelson, A. Travel time to major cities: A global map of Accessibility. In Proceedings of the Global Environment Monitoring Unit-Joint Research Centre of the European Commission, Ispra, Italy, 2008; Available online: http://forobs.jrc.ec.europa.eu/products/gam/ (accessed on 25 August 2015).
  19. Huyskens, H.; Blechinger, P. Techno-economic optimization of a hybrid mini-grid using a one-minute time step approach. In Proceedings of the 7th International Conference on PV-Hybrids and Mini-Grids, Bad Hersfeld, Germany, 10–11 April 2014.
  20. A Manual for the Economic Evaluation of Energy Efficiency and Renewable Energy Technologies. National Renewable Energy Laboratory (NREL). Available online: http://www.nrel.gov/docs/legosti/old/5173.pdf (accessed on 25 August 2015).
  21. Energy Information Administration, New York Harbor Ultra-Low Sulfur No. 2 Diesel spot price. Available online: http://tonto.eia.gov/dnav/pet/hist/LeafHandler.ashx?n=PET&s=EER_EPD2DXL0_PF4_Y35NY_DPG&f=D (accessed on 20 February 2015).
  22. Petrol prices MyTravelCost.com. Overview on diesel retail prices. Available online: http://www.mytravelcost.com/petrol-prices/ (accessed on 20 February 2014).
  23. Pump price for diesel fuel. Available online: http://data.worldbank.org/indicator/EP.PMP.DESL.CD (accessed on 20 February 2015).
  24. Jülch, V.; Telsnig, T.; Schulz, M.; Hartmann, N. A holistic comparative analysis of different storage systems using levelized cost of storage and life cycle indicators. In Proceedings of the 9th International Renewable Energy Storage Conference, Düsseldorf, Germany, 9–11 March 2015; pp. 18–28.
  25. Blennow, H. Method for Rural Load Estimations—A Case Study in Tanzania. Master’s Thesis, Lund Institute of Technology, Lund, Sweden, 1 July 2004. [Google Scholar]
  26. Szabo, S.; Bodis, K.; Huld, T.; Moner-Girona, M. Sustainable energy planning: Leapfrogging the energy poverty gap in Africa. Renew. Sustain. Energy Rev. 2013, 28, 500–509. [Google Scholar] [CrossRef]
  27. Khelif, A.; Talha, A.; Belhamel, M.; Hadj Arab, A. Feasibility study of hybrid Diesel–PV power plants in the southern of Algeria: Case study on AFRA power plant. Int. J. Electr. Power Energy Syst. 2012, 43, 546–553. [Google Scholar] [CrossRef]