Abstract
The aim of this paper is to examine if the surplus of wind energy could be added to electricity-to-heat conversion systems when there is increased congestion in the grid or when there is wind power curtailment. In this way, the produced power can be utilized for contributing to the local district heating (DH) system needs. After examining scenarios, optimized energy distribution is recommended. A case study near Kozani, Greece with an onshore wind farm (WF) to be installed was thoroughly investigated exploring the options for increased wind energy integration analyzing thermal utilization possibilities based on the local DH needs. A wind resource assessment for the area was done, which optimizes the WF planning and links the DH system with the operation of the WF. The utilization rate between the electric and the DH grid was examined in order to describe the optimal way of the energy to be distributed reassuring profitability for the power producer and robust energy management for the system. It was found that the curtailed wind energy can be locally utilized in a DH system, by covering part of the demand that the diesel-based peak load boiler system does currently.
1. Introduction
The old fashioned way that electricity grids are structured cannot comply with the continuously increasing needs in modern grids. A totally different approach and in depth research in smart grids is required, aiming ultimately at unifying the electricity to the district heating (DH) grid focusing on improving wind energy integration.
In the city of Kozani, the DH system has been fully operational since 1993 and the main idea was to use the excess heat from the operating power plants in the wider area. Public Power Corporation S.A. (PPC) lignite fired generation plants Agios Dimitrios III, IV, and V generate 95% of the yearly heat demand (with 70% of the heat load) and a peak load boiler plant produces remaining 5% (30% of the heat load) [1]. Agios Dimitrios plants III, IV, and V are installed at a distance of 17 km from the city of Kozani and therefore there was a need for significant construction works for the supply transmission pipelines. The hot water is sent through a pipe system to the consumer’s place and after utilization via return pipes back to the hot water generation unit [2].
The extensive use of renewables, such as biomass or geothermal systems, in DH systems has proven that there are not significant technical problems in achieving high penetration levels under commercial conditions. In general, DH systems can also provide demand response services that make it easier to integrate renewables into the local power system. Thermodynamically though, using electricity to produce heat is rather inefficient, but under some circumstances it can be a better economic option than wasting potential electricity from variable renewables, such as wind energy. At the same time, from an economic perspective, selling electricity at prices that thermal energy is offered is not highly profitable for the investor, however, such solutions in a competitive environment under liberated electricity, gas, and power markets with lower or even no feed-in-tariffs shall become imperative in increasing the project’s rate of return.
What is known for Greece, is that there are a lot of potential applications for wind farm (WF) installations (more than 30,000 MW) [3]. The promising feed-in-tariff scheme gave the opportunity to many investors and independent power producers to submit their applications to the Regulatory Authority for Energy (RAE) and they are currently waiting for approval. However, the Greek financial crisis has created a fragile investment environment in the country in moving decisively forward to investment. Nevertheless, as Greece geographically is located near to countries/areas with significant electricity requirements, as it is “standing” among Europe, Asia, and Africa, and taking into account the prevailing winds from side to side in the country, it could be examined what could have happened without this funding scheme for wind. How can part of the produced electricity be used differently and what could be the consequences to investors and end-users from this change. The basic idea of this paper is to examine different scenarios and how the surplus or curtailed energy from the Transmission System Operator (TSO) can be used from the DH system, providing demand response and integration services to the TSO (curtailed wind, is when wind power was available, but the system operator for various reasons did not accept the wind power to be dispatched). The basic concept is based on the decision that the peak load boiler system may initiate immediately when there is an overproduction of wind energy, and at the same time, the motor producing electricity at the peak load boiler, which is based on using light fuel oil, can be turned off and therefore save fuel.
2. Literature Review
Although there is a large body of literature on district heating and biomass or geothermal units, not much has been done so far on interaction between wind energy and DH grids. The fact that using electricity to produce heat is inefficient discourages researchers to study it as an alternative. However, the idea that curtailed wind power (surplus) can contribute towards that direction, or even can put the system into operational maintenance during summertime, offers another perspective to the whole concept.
Partly, this idea of increasing local renewable energy production in order to convert surplus electricity into thermal energy, was presented from Niemi et al. [4]. The analysis they did was based on multi-carrier urban energy systems. It was found that for the city of Helsinki wind power production could be increased by 40%–200% by adding the electricity-to-heat conversion option for using surplus wind energy into the heating network. Long et al. [5] tried to balance wind power variability using electric heat pumps and combined heat and power (CHP) units. Maegaard [6] presented the Danish example with increased integration of wind energy into the grid through the use of CHP facilities. Hong et al. [7] studied scenarios using EnergyPLAN on wind energy integration in parallel with the heat demand into the existing energy system of Jiangsu province, China. It was revealed that according to the needs of the province, the wind power production could range from 0% to 42% of the total energy demand. The EnergyPLAN model was also used in studies focused mainly in the Danish market aiming at maximizing renewables grid integration [8,9,10].
Fitzgerald et al. [11] tried to study how power system efficiency can be improved by integrating wind power through an intelligent electric water heating system.
In general, there are few studies that confront the issue, despite the fact that in many cases, and in a great number of countries, the profitability of wind farms without the support of a scheme based on subsidization is questionable. Therefore, for this reason there were few studies in the literature linking the need for wind energy for DH networks to achieving greater integration shares. This paper is a unique case study since it connects a DH system in the city of Kozani, Greece, a detailed wind resource analysis, an annual energy production (AEP) forecast, and the local WF applications.
3. Proposed Methodology
3.1. Site Experimental Results
Accurate wind resource measurements are essential in order to identify areas with significant wind speeds at exploitable levels. For the evaluation of the winds in Kozani area, Geographic Information Systems (GIS) tools, the Wind Atlas Analysis and Application Program (WAsP) [12], and WindRose [13] tools were used as wind data assessment tools, and a wind map was created representing the wind speed at a height of 80 m above ground level (m.a.g.l.) in the wider area of the installed mast. Based on the analysis of these results, the primal outcome is an initial assessment of the area under examination. Wind profile measurements were carried out for specific periods using a meteorological mast. A satellite map of the area, including the wind mast, the location of the plants contributing mostly to the DH system, and the city of Kozani is shown in Figure 1.
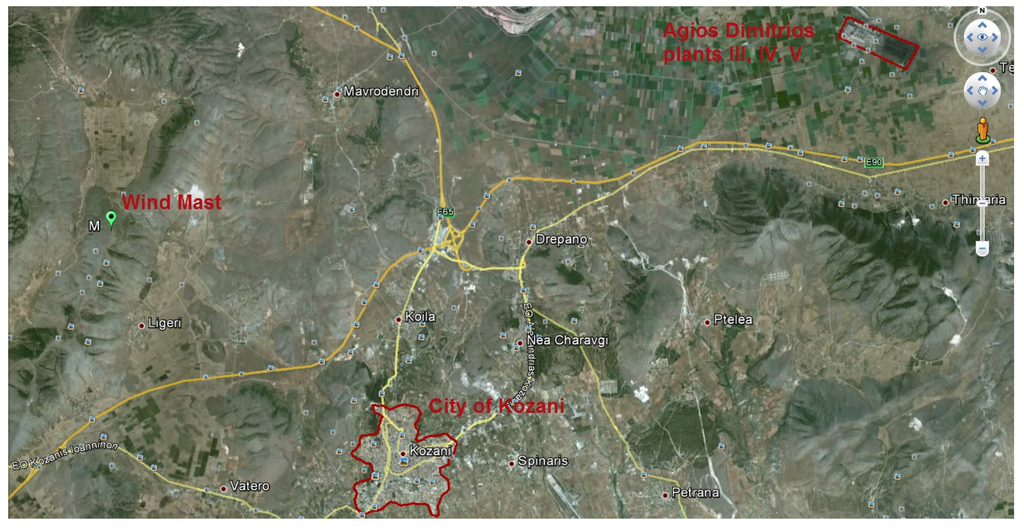
Figure 1.
A detailed satellite map of the area.
Mast coordinates, height in meters above ground level, period of measurement, average speed, and temperature are shown in Table 1.

Table 1.
Main measured characteristics of the wind mast.
| Latitude (°) | Longitude (°) | Mean Speed (m·s−1) | Period of Data Analysis | Height (m.a.g.l.) | Turbulence Intensity (T.I.) at 10m. |
|---|---|---|---|---|---|
| 40°21'2" N | 21°42'23" E | 5.4 at 10 m | 17 December 2006 to 17 December 2007 | 1093 | 11.19% |
WindRose and WAsP tools were used for processing the experiments (yearly measurements) and generate estimates of speed/energy output. Vector Hellenic Wind Farms S.A. operates a certified wind measurements laboratory and the mast was under the laboratory’s supervision. It is noticeable just by reviewing the wind rose (Figure 2) that the main directions were NW, WNW, and NNW.
The wind was studied for one year from 17 December 2006 to 17 December 2007. A 10 m mast was installed made out of steel in tubular form, which was kept in vertical position using tense wires. Anemometers and vanes were placed at ten meters. A data logger connected to the available sensors on the mast stored and sent the data to Vector Hellenic Wind Farms S.A. laboratory. The uncertainty of the measured wind speed for the mast was calculated using WindRose software and found to be quite high, at 0.187 m/s. The maximum 10-min average speed observed was 24.9 m/s and the maximum gust 33.9 m/s. The used data array was made up of the average (one value per second—600 values in 10 min) and maximum 10-min wind speed values in the site.
A preliminary statistical analysis of the measurements was useful for identifying the relationships among the examined variables. Weibull and Rayleigh probability density function analyses, which have an acceptable accuracy level of many wind resource studies in different locations [14,15,16,17,18,19], were used to identify the representation of the wind speed frequency curve. In Weibull distribution, the probability density function and the cumulative distribution indicate the variation in wind velocity. The probability density function fWei(v) is given from the following Equation:
where k is the (dimensionless) shape parameter showing how peaked the wind distribution is, and c is the windy (dimensionless) scale parameter. Using the Weibull probability plotting paper method, k and c are calculated. The distribution function is transformed into a linear pattern using logarithmic scale and since the wind velocity is equal or lower than v, there is:
If we plot the axes ln(v) for x and ln{−ln[1 − fWei(v)]} for y, then the Weibull distribution is a straight line, with a slope of k and intersection −k·lnc. The real values of k and c can be found by producing the regression equation for the plotted line. It is known that for most wind conditions, k ranges from 1.5 to 3, while c ranges from 3 to 8 [20]. The results from the data and the Weibull distribution shown in Table 2 and in Figure 3, the Weibull shape and scale, the data distribution, the mean wind speed and the Turbulence Intensity (T.I.) at 10 m/s are shown for each direction.
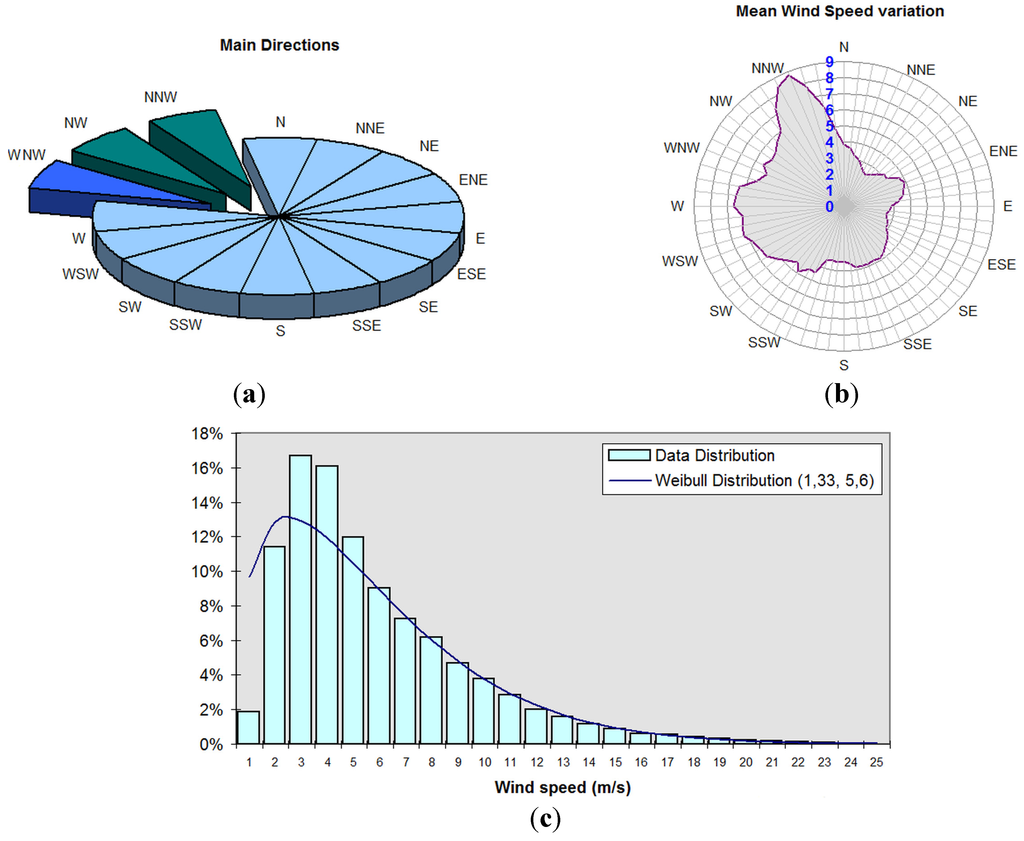
Figure 2.
(a) Wind rose of the mast of Kozani area; (b) data and (c) Weibull distribution.
Table 2.
Weibull distribution analysis of Kozani area mast.
| Direction | Angles (°) | Weibull Shape | Weibull Scale | Data Distrib | Mean Wind Speed (m/s) | T.I. at 10 m/s |
|---|---|---|---|---|---|---|
| NNE | 11.25–33.75 | 1.24 | 2.48 | 1.29% | 2.8 | 9.9 |
| NE | 33.75–56.25 | 1.16 | 2.47 | 1.24% | 2.8 | 11.2 |
| ENE | 56.25–78.75 | 1.9 | 4.29 | 2.41% | 3.7 | 12.3 |
| E | 78.75–101.25 | 1.39 | 2.82 | 2.27% | 3 | 13.3 |
| ESE | 101.25–123.75 | 1.4 | 2.55 | 3.18% | 2.8 | 15 |
| SE | 123.75–146.25 | 1.78 | 3.55 | 6.95% | 3.6 | 16.8 |
| SSE | 146.25–168.75 | 1.43 | 3.51 | 10.00% | 3.8 | 13 |
| S | 168.75–191.25 | 0.87 | 2.17 | 6.06% | 3.5 | 13.1 |
| SSW | 191.25–213.75 | 1.3 | 4.16 | 4.79% | 4.2 | 12.8 |
| SW | 213.75–236.25 | 1.26 | 4.95 | 5.48% | 4.9 | 12.6 |
| WSW | 236.25–258.75 | 1.64 | 6.65 | 5.34% | 5.9 | 13.2 |
| W | 258.75–281.25 | 1.69 | 7.23 | 4.09% | 6.4 | 11.4 |
| WNW | 281.25–303.75 | 1.58 | 5.68 | 11.61% | 5.2 | 11.3 |
| NW | 303.75–326.25 | 1.68 | 6.6 | 9.38% | 6 | 9.6 |
| NNW | 326.25–348.75 | 2.01 | 9.24 | 22.10% | 8.2 | 10.8 |
| N | 348.75–11.25 | 1.28 | 4.68 | 3.81% | 4.6 | 11.2 |
3.2. Wind Resource Analysis and Planning
The total number of valid data used was 52,345 (missing data 0.7%) and the included number of calm measurements (<2 m/s) was 6954. WAsP software was used to produce a wind map of the area; the estimated wind speed is visualized and different sites for wind turbines (WT) can be selected and proposed to be developed (Figure 3).
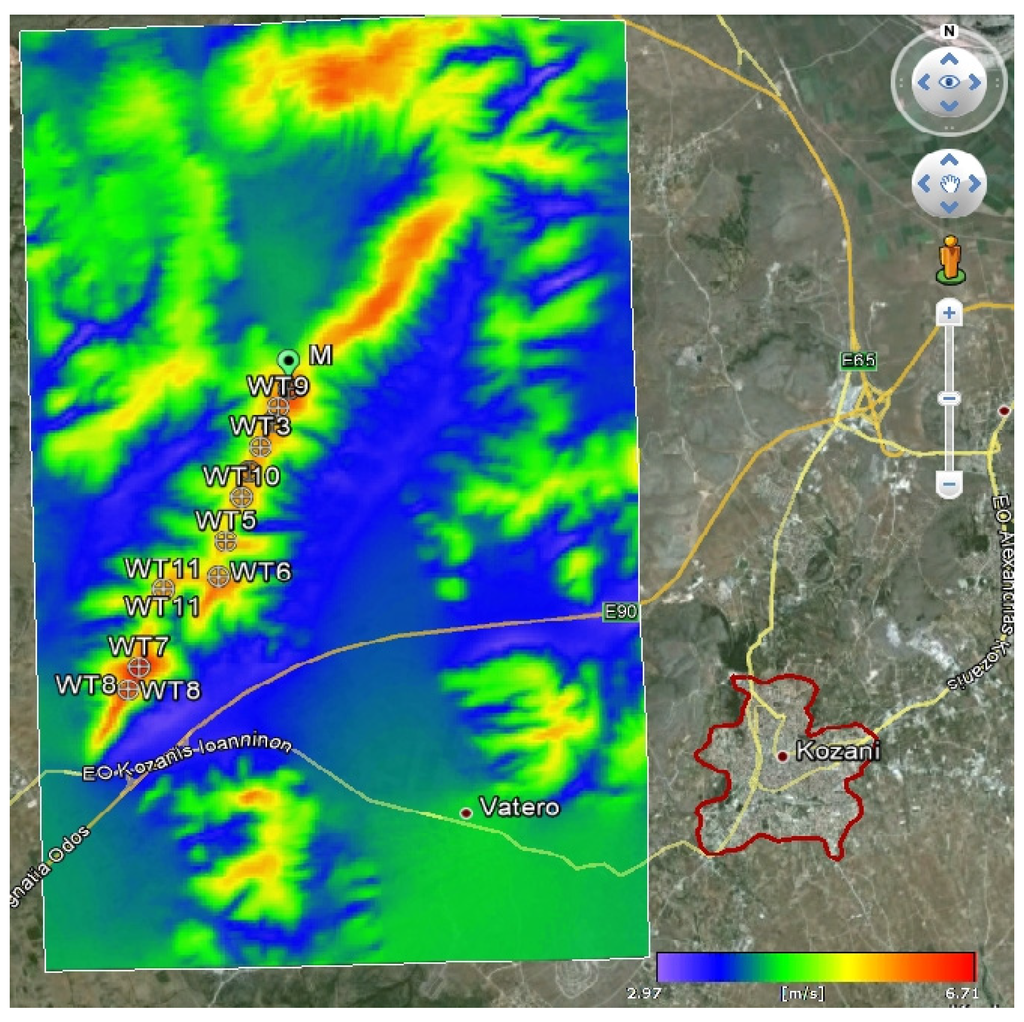
Figure 3.
Wind resource analysis in the area.
From the wind analysis implemented in the area, the results show that the lowest average wind speed is 3.36 m/s and the highest is 6.74 m/s, extrapolated at 78 m from the ground. What can be easily observed is that the company developing the WF did not optimize the planning. However, there are more constraints, such as construction restrictions or environmental restrictions, etc. that ought to be taken into account in construction. In this specific case, the promising areas on the north side of the current planning were left out because there were other applicants for WF installation in the area. Based on RAE’s licensing application files for new projects for power production [21] and the wind turbine spatial distribution limits per municipality, 2400 MW have been authorized and submitted to be installed in the prefecture (Table 3) [22].
Table 3.
WT installation upper limits in Kozani Prefecture.
| Municipalities | Surface (km2) | Max Allowed No. of WT | WT Licensed | WT Applications |
|---|---|---|---|---|
| Voiou | 771.05 | 508.89 | 136.69 | 131.00 |
| Eordeas | 708.80 | 467.80 | 210.32 | 407.00 |
| Kozanis | 971.33 | 641.08 | 108.26 | 131.00 |
| Servion–Velventou | 548.10 | 361.74 | 23.74 | 49.00 |
Note: Typical size of WT: 2 MW.
It can be seen from Figure 4 that there is enough space for new applications/installations, except in the Eordeas municipality.
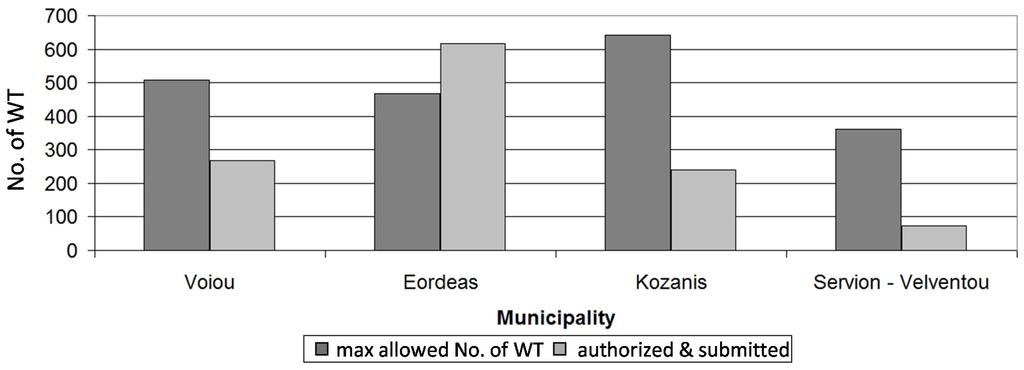
Figure 4.
WT spatial distribution limits per municipality and WT authorized and submitted.
Based on these limits and applications, and since the load of the substations and the high voltage and medium voltage lines are not defined only from surface coverage constraints, it is rather possible that all WF may not secure interconnection terms with the grid. What is likely to occur is WFs interconnected, however, with high shares of curtailment. How can the curtailed energy be used differently in order: (a) to be effectively utilized and not wasted; (b) the profits of the investor to be secured; and (c) increase renewable energy sources integration?
4. Case Study in Kozani Region
The idea of smart utilization of the curtailed energy from wind (reducing peak demand and providing balancing loads) increasing at the same time the overall system’s efficiency is improved was the drive for this research. Examining different scenarios with WF interconnection to the electricity grid and at the same time to the DH local grid will bring more options to the system. In general, it is known that the wind turbine is designed to operate under designed conditions, including constant air density. Thus, once the air density has changed, the output of wind turbine will certainly change. However, in this case, these calculations were included within the wind resource analysis. Adding up the electrical losses (internal interconnection medium voltage losses and transformer losses) and the wind turbine technical availability losses, a fixed percentage for the proposed wind farm, usually provided from the wind turbine manufacturer, it is possible to calculate the exergetic efficiency of the WF (Figure 5) [23,24,25,26,27].
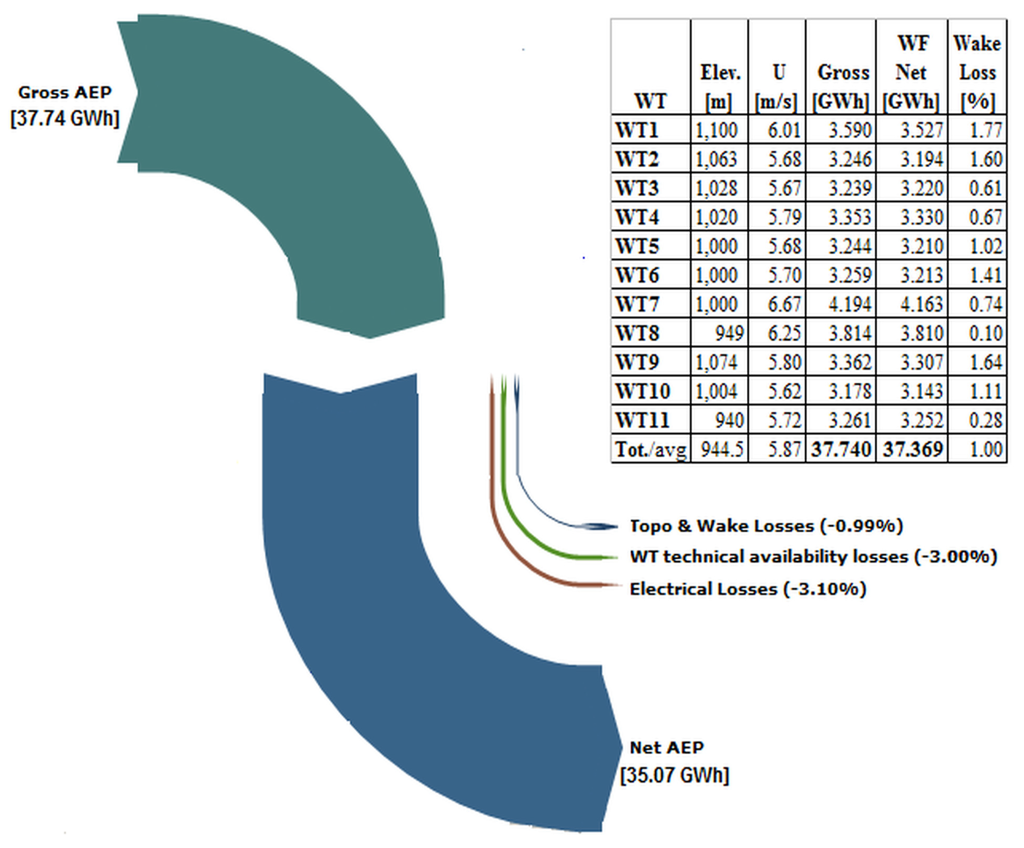
Figure 5.
Sankey flow diagram on the losses and the overall production of the WF.
The electrical losses were estimated taking into account the fact that the wind farm is planned to be 18.15 MW, and therefore the overall electrical losses will be specified from the medium voltage losses for the interconnection of the wind turbines and the distribution power station (20/150 kV 25 MVA transformer) losses. The average losses for each wind turbine of the internal Low Voltage/Medium Voltage (LV/MV) transformer are 0.6% and the wind farm MV/HV substation is 0.45% [28], the sum of the electrical losses is 3.1% for the proposed WF. Following the approach of Xydis [23] and of Hepbasli and Alsuhaibani [29], exergy efficiency of the proposed wind farm, including all losses can be estimated by using the Equation:
where NetAEP is the Net Energy (MWh); 8760 h are the total hours within a year (365 days·24 h); and Ci the installed capacity of the wind farm (MW).
However in this case, exergetic efficiency may be increased. The amount of energy that would be wasted can be used on a different feed-in-tariff scheme and therefore increase the utilization rate of the generated electricity. The need to cover some of the needs of the peak load boiler, which produces 5% of the yearly required thermal load, as well as the PPC lignite plants when these are operating in the technical minimum. There is no need to maintain the operation of lignite plants at high levels just for covering the heating needs of the DH system. For the implementation of the concept, though, interconnection of the electricity with the DH grid is necessary.
It is obvious, though, that the profitability of such a project would be based on various offered prices to the end-users. The peak load boiler consists of three boilers of 10 MWth and two of 27.5 MWth, totaling 85 MWth. Approximately 90% of the annual heat output comes from the central system (base load unit) and 10% from the peak boiler. The total district heating system is designed to serve the required demand with superheated water flow temperature, which vary seasonally between 90 °C and 120 °C. The building facilities allow return temperatures ranging (again based on the seasonal needs, e.g., the temperature is at its lowest during summer, when only hot service water is needed) between 55 °C and 70 °C.
The topography and hydraulic conditions of the network led to the design of a distribution network of 25 bar nominal pressure. The capacity of pumping stations was selected to ensure the supply of the outermost end-users. The distribution network consists of conductors insulated and installed directly on the ground. The conductors are insulated with polyurethane and polyethylene protective casing. Based on the data from Municipal Enterprise for water supply and sewerage of Kozani [1], it is calculated that on average the annual thermal energy production from the three PPC plants and the peak boiler is approx. 240,000 MWhth. Therefore, as mentioned before, the peak load boiler plant produces 5% of the thermal needs for the city of Kozani and suburbs annually, which actually means 12,000 MWhth. This exact amount of energy, which is covered from the boiler and uses oil as fuel, can be covered from the curtailed power. Currently, curtailment in the Greek mainland is taking place at low percentages, since it is something that it is mainly happening on islands, e.g., Crete Island [30]. However, it is something that will sway smart grids in the future. Based on a recent study of the National Technical University of Athens, founded from RAE and National Technical University of Athens, it was revealed that by the year 2025, when the Greek system is expected to have installed 5–8 GW of wind farms, it is expected that the average curtailment rate, for various reasons, to be from 0.8% to 4.3% [31]. Therefore there is:
which means approximately from 280.5 to 1508 MWhe yearly from this wind farm, taking into account the wind resource assessment and wind farm production forecasting that the NET Annual Energy Production is 35,070 MWh (Figure 5).
Wind Curtailment = (0.8% – 4.3%) ∙ NetAEP
5. Results and Discussion
In reality, however, based on this analysis for the season 2006–2007, where all the wind and heat data come from, it was found that the possible annual contribution varies from 154.3 to 701.3 MWh per year. This is because only when the energy needed to run the peak load boiler the surplus of wind energy could be utilized. In this case, it was roughly assumed that conversion of wind electricity to heat can be achieved by adding an electric resistance to the peak boiler with a conversion efficiency of 100%, exactly as in the work of Niemi et al. [4].
Analyzing the profile of the average monthly and peak load fluctuation (Figure 6), it can be seen that different profiles occur every month and that the district heating system serves the customers from October until May.
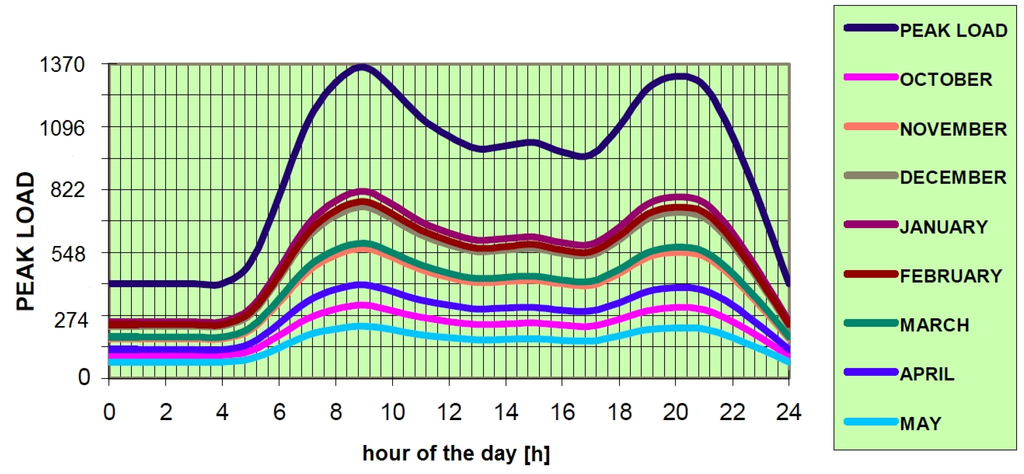
Figure 6.
Average monthly and peak load daily demand [32].
It is acceptable that different load profiles happen because of different seasonal heating needs. Using WindRose tool, wind time series were used to produce average energy time series from the studied WF. Orography, wake, electrical, and WT availability losses were roughly introduced to the model and the results in Figure 7 were obtained.
Based on Figure 7 and Table A1 (Appendix), it can be seen:
- (a)
- Regardless of the wind power curtailment rate, there is a realizable line (which represents what could happen in real life) that covers part of the needs of the peak load for every hour.
- (b)
- At night and in the early morning, curtailed wind can cover higher amounts of heating needs.
- (c)
- In May, the heating needs are so low that they can be almost totally covered from wind curtailment.
It should be clear, though the motive for the investor is to sell the rejected electricity from the system instead of only choosing curtailment as an option—and missing out on the associated remuneration. Based on the current law for renewables, Law 3851/2010, there is a provision for the compensation of the WF owner according to the occurred grid curtailment. At the end of each year, the TSO remunerates each WF owner additional payments, which are equal to a remuneration corresponding to 30% of the realized energy cuts imposed the previous year [33]. Therefore, the offered price from the WF owner to DEYAK should be higher than that. On the other hand, for DEYAK, the offered price should not be too expensive, however it should be cheaper compared to the current production cost of district heating. It has to be cheaper for DEYAK in order for this energy to be utilized instead of using the peak load boiler. A similar approach was followed in the recent study of Rezaie et al. [34].
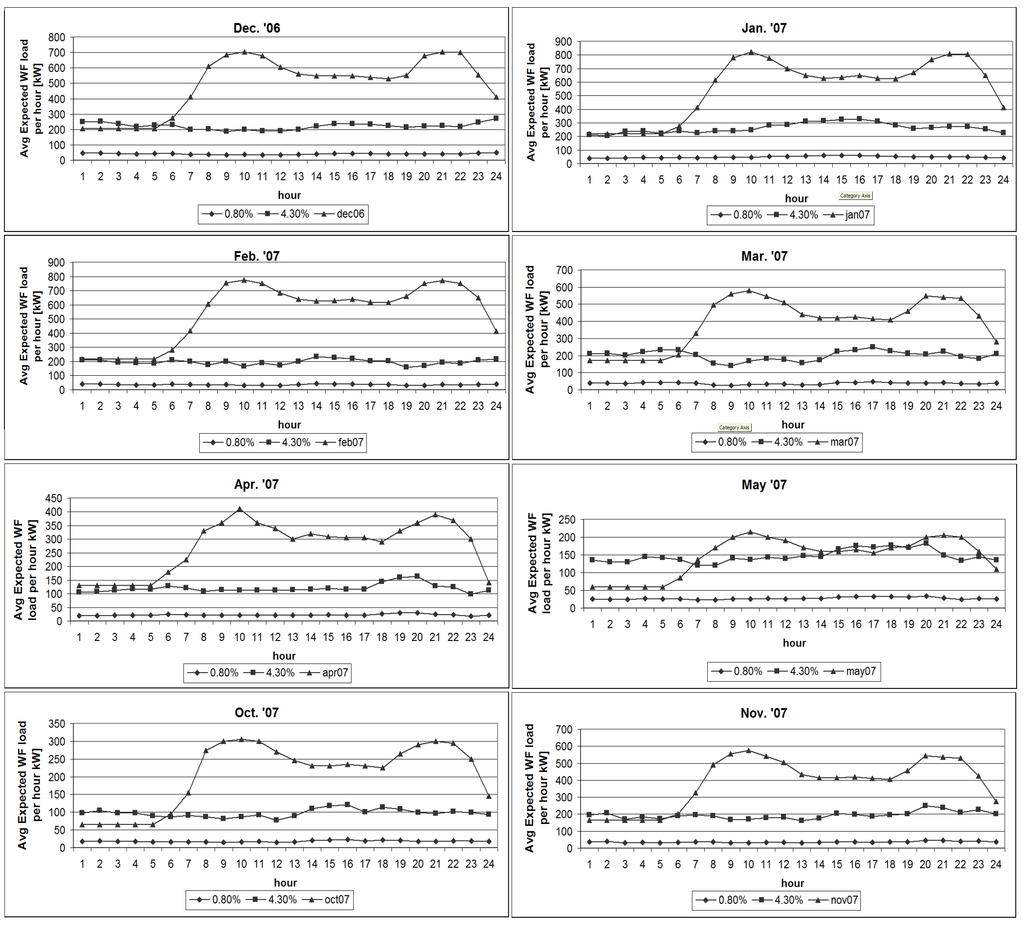
Figure 7.
Average monthly load daily demand and average low (0.8%) and high (4.3%) wind power curtailment rate.
Based on the wind curtailment data and dividing the Feed-in-Tariff (FiT) by this 30% remuneration factor, the minimum of the FiT for the WF is found equal to 26.35 €/MWh. If the requested price falls below this number, then the WF owner has higher profits by receiving the government reimbursement from this 30%. According to the Law 3851/2010, this fraction can be increased up to 100%, so as the total compensation is equal to the smallest amount between: (a) the compensation to be received if operated with two thousand (2000) hours equivalent; and (b) the compensation to be received if operating without any curtailments. Therefore, for wind farms with low capacity factor (in the order of 20%–25%, such as in this region of Greece), which is about 2000 h, the compensation is usually 100%. Initially, the wind producer won’t have any interest in selling his curtailments for heating at a lower price. However, under the EU Target Model, this is not effectively dealt—and the Renewables Directive simply says that renewables curtailment should be minimized via “appropriate grid and market-related operational measures” [35,36].
Therefore, a realistic approach was taken based on the discussions for the development of the energy commodity market in Greece and the curtailment was decided to be left out of the compensation according to the occurred curtailment, since, no physical power shall be offered to the grid. In order to minimize the investor’s loss at the same time—based on the TSO’s decisions on curtailment—it is assumed that the DH price to be offered can preserve part of the losses. The DH price offered to end-users remains steady over the past few years (52.46 €/MWh) despite the economic recession in Greece and the inconsistent oil prices. Therefore, if an assumed fixed price of 42 €/MWh can be offered from DEYAK to the WF owner when wind power can absorbed more from the heating system, and of course 26.35 €/MWh as a minimum, there are a number of scenarios that can be examined depending on the possible annual contribution (154.3–701.5 MWh). Based on the open source investment analysis tool (Cash Flow Model) that Xydis via [37] introduced through the author’s personal company (www.xydis.gr/gx) website [38], three scenarios were examined for different integration schemes. Introducing to the model the Price per MWp (1325 €/kW), the total installed Capacity in MWp (18.15), the investment scheme (subsidy:equity:loan of 35%:25%:40%), the capital discount rate (7.48%), the estimated energy output (1932 kWh/kW), insurance, maintenance and operation costs and the selling price of produced kWh, the results can be seen in Table 4 under the initial scenario (no curtailed wind power utilized). Adding up the two extreme scenarios to that (1, delivering to the heating system 154.3 MWh with a price of 0.02635 €/kWh; and 2. delivering to the heating system 701.5 MWh with a price of 0.042 €/kWh), the results change slightly (Scenarios 1 and 2). It is estimated, based on the ECOHEATCOOL project [35], that CO2 emissions reduction by using the curtailed wind energy in DH could reach up to 252 tn/yr (in the case of 701.5 MWh), while in the lower case of 154.3 MWh, CO2 savings can at least reach 55 tn/yr.
Table 4.
WF investment plan results.
| Initial Scenario | Scenario 1 | Scenario 2 | Scenario 3 | |
|---|---|---|---|---|
| Net Present Value (NPV) (T€) | 16,399 | 16,439 | 16,688 | 16,760 |
| Balance (T€) | 10,386 | 10,426 | 10,676 | 10,748 |
| Internal Rate of Return (IRR) | 12.42% | 12.47% | 12.78% | 12.87% |
| full repayment (yrs) | 9 | 9 | 9 | 9 |
In any case, between these two scenarios the overall IRR of the project increases from 0.05% (scenario 1) to 0.36% (scenario 2) and the increase in the NPV value can be a maximum of 287,000 €. It is definitely not a profit that will play a crucial role in deciding to move on to an investment or not, but it can surely balance some of the losses not initially foreseen or some of the expenses needed to convert the peak load oil boiler to an electric boiler, such as adding the resistance equipment. In the extreme scenario of buying the wind curtailed power at 52.46 €/MWh, which is the price offered to consumers, the additional profit for the WF owner is 72,000 € yearly (Scenario 3—Table 4).
Assuming that the FiT scheme will change in Greece soon and major cuts are going to be put into force, since there is an increasing Annual Electricity Tariff Deficit, just as happened in Italy and in Spain recently [36,39], new modeling parameters shall be taken into account for the future energy system.
Finally, following Xydis approach [40] on accumulated capacity factors (ACF), this can be calculated from:
where WPC is wind power curtailment and in real life can be anywhere between
Something, which will determine the final ACF to:
6. Conclusions
The basic aim of this research was to identify the difficulty for curtailed wind power to be integrated into the heating system minimizing the use of boilers that run on fossil fuels. Based on the case study for the city of Kozani examined here, it was found that curtailed wind can be utilized in a DH system thereby covering some of the needs that the peak load boiler would cover. It was found, an using energy time series, that the possible annual contribution could be from 154.3 to 701.5 MWh, far from the theoretical possible 1508 MWh yearly; this is because only when the energy is needed to run the peak load boiler can the surplus of wind power be utilized.
Scenarios examined on wind curtailment to DH revealed that not only profits for the WF owner can be increased but also the IRR of the project by 0.36%. It was also shown that the ACF of the plant can be increased by almost 0.4%. In any case, based on this and similar research, it can be understood that, since there is a way to use part of the wasted energy for the heating systems, it should be a priority for heating and electricity systems to be integrated; mostly because there is an increasing need for the system operator to balance renewable energy sources and stabilize the system using various ways.
Acknowledgments
The preparation of this paper would not have been possible without the support and valuable contribution of the Certified Laboratory of Wind Measurements of Vector Hellenic Windfarms S.A.
Appendix
Table A1.
Average monthly WF power output from power time series, low and high curtailment level, and heating needs per month.
| December 2006 | |||||||||||||||||||||||
| 5804 | 5836 | 5505 | 5073 | 5301 | 5382 | 4652 | 4678 | 4344 | 4611 | 4392 | 4445 | 4662 | 5118 | 5489 | 5490 | 5453 | 5192 | 4970 | 5108 | 5245 | 5074 | 5744 | 6313 |
| 46 | 47 | 44 | 41 | 42 | 43 | 37 | 37 | 35 | 37 | 35 | 36 | 37 | 41 | 44 | 44 | 44 | 42 | 40 | 41 | 42 | 41 | 46 | 51 |
| 250 | 251 | 237 | 218 | 228 | 231 | 200 | 201 | 187 | 198 | 189 | 191 | 200 | 220 | 236 | 236 | 234 | 223 | 214 | 220 | 226 | 218 | 247 | 271 |
| 205 | 205 | 205 | 205 | 205 | 274 | 411 | 610 | 685 | 705 | 680 | 605 | 560 | 548 | 548 | 548 | 540 | 530 | 550 | 680 | 705 | 700 | 555 | 410 |
| January 2007 | |||||||||||||||||||||||
| 4885 | 4752 | 5507 | 5555 | 5180 | 5583 | 5267 | 5547 | 5582 | 5771 | 6536 | 6649 | 7252 | 7282 | 7515 | 7605 | 7186 | 6568 | 6015 | 6189 | 6323 | 6310 | 5937 | 5234 |
| 39 | 38 | 44 | 44 | 41 | 45 | 42 | 44 | 45 | 46 | 52 | 53 | 58 | 58 | 60 | 61 | 57 | 53 | 48 | 50 | 51 | 50 | 47 | 42 |
| 210 | 204 | 237 | 239 | 223 | 240 | 226 | 239 | 240 | 248 | 281 | 286 | 312 | 313 | 323 | 327 | 309 | 282 | 259 | 266 | 272 | 271 | 255 | 225 |
| 218 | 218 | 218 | 218 | 218 | 277 | 414 | 613 | 780 | 822 | 775 | 700 | 650 | 630 | 635 | 650 | 630 | 625 | 670 | 765 | 810 | 805 | 650 | 414 |
| February 2007 | |||||||||||||||||||||||
| 4916 | 4905 | 4521 | 4439 | 4308 | 4900 | 4628 | 4115 | 4613 | 3836 | 4377 | 3977 | 4675 | 5406 | 5263 | 5110 | 4721 | 4731 | 3731 | 3902 | 4522 | 4315 | 4855 | 5029 |
| 39 | 39 | 36 | 36 | 34 | 39 | 37 | 33 | 37 | 31 | 35 | 32 | 37 | 43 | 42 | 41 | 38 | 38 | 30 | 31 | 36 | 35 | 39 | 40 |
| 211 | 211 | 194 | 191 | 185 | 211 | 199 | 177 | 198 | 165 | 188 | 171 | 201 | 232 | 226 | 220 | 203 | 203 | 160 | 168 | 194 | 186 | 209 | 216 |
| 218 | 218 | 218 | 218 | 218 | 280 | 417 | 606 | 756 | 775 | 750 | 685 | 640 | 625 | 630 | 640 | 620 | 615 | 660 | 750 | 770 | 750 | 650 | 414 |
| March 2007 | |||||||||||||||||||||||
| 4857 | 4955 | 4663 | 5155 | 5405 | 5393 | 4745 | 3550 | 3232 | 3921 | 4246 | 4091 | 3673 | 4014 | 5208 | 5412 | 5827 | 5293 | 4944 | 4809 | 5223 | 4469 | 4239 | 4882 |
| 39 | 40 | 37 | 41 | 43 | 43 | 38 | 28 | 26 | 31 | 34 | 33 | 29 | 32 | 42 | 43 | 47 | 42 | 40 | 38 | 42 | 36 | 34 | 39 |
| 209 | 213 | 201 | 222 | 232 | 232 | 204 | 153 | 139 | 169 | 183 | 176 | 158 | 173 | 224 | 233 | 251 | 228 | 213 | 207 | 225 | 192 | 182 | 210 |
| 170 | 170 | 170 | 170 | 170 | 205 | 330 | 495 | 560 | 580 | 545 | 510 | 440 | 420 | 420 | 425 | 415 | 410 | 460 | 550 | 540 | 535 | 430 | 280 |
| April 2007 | |||||||||||||||||||||||
| 2453 | 2490 | 2617 | 2721 | 2717 | 3001 | 2816 | 2550 | 2671 | 2627 | 2615 | 2609 | 2640 | 2694 | 2796 | 2713 | 2713 | 3337 | 3709 | 3804 | 2996 | 2885 | 2301 | 2629 |
| 20 | 20 | 21 | 22 | 22 | 24 | 23 | 20 | 21 | 21 | 21 | 21 | 21 | 22 | 22 | 22 | 22 | 27 | 30 | 30 | 24 | 23 | 18 | 21 |
| 105 | 107 | 113 | 117 | 117 | 129 | 121 | 110 | 115 | 113 | 112 | 112 | 114 | 116 | 120 | 117 | 117 | 143 | 160 | 164 | 129 | 124 | 99 | 113 |
| 130 | 130 | 130 | 130 | 130 | 180 | 225 | 330 | 360 | 411 | 360 | 340 | 300 | 320 | 310 | 305 | 305 | 290 | 330 | 360 | 390 | 370 | 300 | 140 |
| May 2007 | |||||||||||||||||||||||
| 3137 | 3029 | 3022 | 3373 | 3289 | 3162 | 2808 | 2805 | 3279 | 3189 | 3340 | 3252 | 3426 | 3375 | 3871 | 4070 | 3989 | 4131 | 3958 | 4237 | 3469 | 3100 | 3374 | 3140 |
| 25 | 24 | 24 | 27 | 26 | 25 | 22 | 22 | 26 | 26 | 27 | 26 | 27 | 27 | 31 | 33 | 32 | 33 | 32 | 34 | 28 | 25 | 27 | 25 |
| 135 | 130 | 130 | 145 | 141 | 136 | 121 | 121 | 141 | 137 | 144 | 140 | 147 | 145 | 166 | 175 | 172 | 178 | 170 | 182 | 149 | 133 | 145 | 135 |
| 60 | 60 | 60 | 60 | 60 | 85 | 137 | 170 | 200 | 215 | 200 | 190 | 170 | 160 | 160 | 165 | 155 | 170 | 175 | 200 | 205 | 200 | 160 | 110 |
| October 2007 | |||||||||||||||||||||||
| 2259 | 2440 | 2276 | 2285 | 2093 | 2011 | 2117 | 2030 | 1897 | 2029 | 2148 | 1802 | 2069 | 2564 | 2735 | 2801 | 2327 | 2651 | 2529 | 2289 | 2244 | 2365 | 2319 | 2172 |
| 18 | 20 | 18 | 18 | 17 | 16 | 17 | 16 | 15 | 16 | 17 | 14 | 17 | 21 | 22 | 22 | 19 | 21 | 20 | 18 | 18 | 19 | 19 | 17 |
| 97 | 105 | 98 | 98 | 90 | 86 | 91 | 87 | 82 | 87 | 92 | 77 | 89 | 110 | 118 | 120 | 100 | 114 | 109 | 98 | 96 | 102 | 100 | 93 |
| 65 | 65 | 65 | 65 | 65 | 95 | 155 | 274 | 300 | 305 | 300 | 270 | 245 | 230 | 230 | 235 | 230 | 225 | 265 | 290 | 300 | 295 | 250 | 145 |
| November 2007 | |||||||||||||||||||||||
| 4539 | 4842 | 3972 | 4265 | 4053 | 4407 | 4529 | 4432 | 3904 | 3966 | 4120 | 4191 | 3755 | 4092 | 4724 | 4610 | 4371 | 4530 | 4654 | 5823 | 5543 | 4907 | 5243 | 4664 |
| 36 | 39 | 32 | 34 | 32 | 35 | 36 | 35 | 31 | 32 | 33 | 34 | 30 | 33 | 38 | 37 | 35 | 36 | 37 | 47 | 44 | 39 | 42 | 37 |
| 195 | 208 | 171 | 183 | 174 | 189 | 195 | 191 | 168 | 171 | 177 | 180 | 161 | 176 | 203 | 198 | 188 | 195 | 200 | 250 | 238 | 211 | 225 | 201 |
| 165 | 165 | 165 | 165 | 165 | 200 | 325 | 490 | 555 | 575 | 540 | 505 | 435 | 415 | 415 | 420 | 410 | 405 | 455 | 545 | 535 | 530 | 425 | 275 |
Conflicts of Interest
The author declares no conflict of interest.
References
- Municipal Enterprise for Water Supply and Sewerage of Kozani (DEYAK). 2012. Available online: http://www.deyakozanis.gr/?page_id=7 (accessed on 1 December 2012).
- Sonne, P. Kozani—A Success Story in the District Heating World; Danish Board of District Heating (DBDH): Frederiksberg, Denmark, 2006. [Google Scholar]
- Regulatory Authority for Energy. RES Statistics. 2012. Available online: http://www.rae.gr/site/file/categories_new/renewable_power/licence/statistics/info?p=files&i=0 (accessed on 1 January 2013).
- Niemi, R.; Mikkola, J.; Lund, P.D. Urban energy systems with smart multi-carrier energy networks and renewable energy generation. Renew. Energy 2012, 48, 524–536. [Google Scholar] [CrossRef]
- Long, H.; Xu, R.; He, J. Incorporating the variability of wind Power with Electric heat pumps. Energies 2011, 4, 1748–1762. [Google Scholar] [CrossRef]
- Maegaard, P. Balancing fluctuating power sources. In Proceedings of 2010 World Non-Grid-Connected Wind Power and Energy Conference (WNWEC), Nanjing, China, 5–7 November 2010; pp. 4–7.
- Hong, L.; Lund, H.; Möller, B. The importance of flexible power plant operation for Jiangsu’s wind integration. Energy 2012, 41, 499–507. [Google Scholar] [CrossRef]
- Mathiesen, B.V.; Lund, H.; Connolly, D. Limiting biomass consumption for heating in 100% renewable energy systems. Energy 2012, 48, 160–168. [Google Scholar] [CrossRef]
- Lund, H.; Möller, B.; Mathiesen, B.V.; Dyrelund, A. The role of district heating in future renewable energy systems. Energy 2010, 35, 1381–1390. [Google Scholar] [CrossRef]
- Mathiesen, B.V.; Lund, H. Comparative analyses of seven technologies to facilitate the integration of fluctuating renewable energy sources. Renew. Power Gener. 2009, 3, 190–204. [Google Scholar] [CrossRef]
- Fitzgerald, N.; Foley, A.M.; McKeogh, E. Integrating wind power using intelligent electric water heating. Energy 2012, 48, 135–143. [Google Scholar] [CrossRef]
- Mortensen, N.G.; Landsberg, L.; Troen, I.; Petersen, E.L. Wind Atlas Analysis and Application Program (WAsP); Risø Nat. Labs: Roskilde, Denmark, 1993; p. 126. [Google Scholar]
- WindRose—A Wind Data Analysis Tool. User’s Guide. Available online: http://www.windrose.gr (accessed on 1 November 2014).
- Celik, A.N. A statistical analysis of wind power density based on the Weibull and Rayleigh models at the southern region of Turkey. Renew. Energy 2003, 29, 593–604. [Google Scholar] [CrossRef]
- Garcia, A.; Torres, J.L.; Prieto, E.; de Francisco, A. Fitting probability density distributions: A case study. Sol. Energy 1998, 62, 139–144. [Google Scholar] [CrossRef]
- Jamil, M.; Parsa, S.; Majidi, M. Wind power statistics and an evaluation of wind energy density. Renew. Energy 1995, 6, 623–628. [Google Scholar] [CrossRef]
- Vogiatzis, N.; Kotti, K.; Spanomitsios, S.; Stoukides, M. Analysis of wind potential and characteristics in North Aegean, Greece. Renew. Energy 2004, 29, 1193–1208. [Google Scholar] [CrossRef]
- Kose, R.; Ozgur, M.A.; Erbas, O.; Tugcu, A. The analysis of wind data and energy potential in Kutahya, Turkey. Renew. Sustain. Energy Rev. 2004, 8, 277–288. [Google Scholar] [CrossRef]
- Rehman, S. Wind energy resources assessment for Yanbo, Saudi Arabia. Energy Convers. Manag. 2004, 45, 2019–2032. [Google Scholar] [CrossRef]
- Xydis, G. Wind-direction analysis in coastal mountainous sites: An experimental study within the Gulf of Corinth, Greece. Energy Convers. Manag. 2012, 64, 157–169. [Google Scholar] [CrossRef]
- RAE’s Licensing Application Files for New Projects for Power Production. 2014. Available online: http://www.rae.gr/site/categories_new/renewable_power/licence/request.csp (accessed on 1 January 2014). (In Greek)
- RAE. Wind Turbine Spatial Distribution Installation Limits Per Municipality. 2012. Available online: http://www.rae.gr/site/categories_new/renewable_power/licence/wind_capacity.csp (accessed on 1 January 2013). (In Greek)
- Xydis, G. On the exergetic capacity factor of a wind—Solar power generation system. J. Clean. Prod. 2013, 47, 437–445. [Google Scholar] [CrossRef]
- Xydis, G.; Koroneos, C. A linear programming approach for the optimal planning of a future energy system. Potential contribution of energy recovery from municipal solid wastes. Renew. Sustain. Energy Rev. 2012, 16, 369–378. [Google Scholar] [CrossRef]
- Vogstad, K.-O. Energy Resource Planning; Integrating Wind Power. Ph.D. Thesis, Norwegian University of Science and Technology, Trondheim, Norway, December 2010. [Google Scholar]
- Jones, C.I.; McManus, M.C. Life-cycle assessment of 11 kV electrical overhead lines and underground cables. J. Clean. Prod. 2010, 18, 1464–1477. [Google Scholar] [CrossRef]
- Use and Maintenance of Oil-immersed Distribution Transformers; Schneider Electric: Athens, Greece, 2012.
- Wind Turbine Power Calculator; Danish Wind Industry Association: Copenhagen, Denmark, 2013.
- Hepbasli, A.; Alsuhaibani, Z. Exergetic and exergoeconomic aspects of wind energy systems in achieving sustainable development. Renew. Sustain. Energy Rev. 2011, 15, 2810–2825. [Google Scholar] [CrossRef]
- Xydis, G. Wind energy to thermal and cold storage—A systems approach. Energy Build. 2013, 56, 41–47. [Google Scholar] [CrossRef]
- Impacts on the Effects of the Greek System Operation from the Wind Integration of 5–8 GW Till 2025; National Technical University of Athens: Athens, Greece, 2011. (In Greek)
- Karlopoulos, E.; Pekopoulos, D.; Kakaras, E. District heating systems from lignite-fired power plants—Ten years experience in Greece. In Proceedings of the International Workshop on Promotion of CHP/Trigeneration and Collaborative Potentials in Chinese Market, Hangzhou, China, 26–28 April 2004.
- Greek Ministry of Environment, Energy and Climate Change. “Law 3851/2010: Accelerating the Development of Renewable Energy Sources to Deal with Climate Change and Other Provisions Relating to the Jurisdiction of the Ministry of Environment, Energy and Climate Change (Gazette 85/A/2010)”; Greek Ministry of Environment, Energy and Climate Change: Athens, Greece, 2012.
- Rezaie, B.; Reddy, B.V.; Rosen, M.A. Assessment of the utilization of thermal energy storage in district energy systems. Int. J. Energy Environ. Econ. 2013, 20, 395–414. [Google Scholar]
- Guidelines for Assessing the Efficiency of District Heating and District Cooling System; ECOHEATCOOL project, Work package 3; Euroheat & Power: Brussels, Belgium, 2006.
- McKenna, E.; Thomson, M. Impact of wind curtailment and storage on the Irish power system 2020 renewable electricity targets: A free open-source electricity system balancing and market (ESBM) model. In Proceedings of the 3rd IET Renewable Power Generation Conference (RPG), Naples, Italy, 24–25 September 2014; p. 6.
- Xydis, G. A techno-economic and spatial analysis for the optimal planning of wind energy in Kythira Island, Greece. Int. J. Prod. Econ. 2013, 146, 440–452. [Google Scholar] [CrossRef]
- Cash Flow Model. 2015. Available online: http://www.xydis.gr/gx/CFM_gxydis_Kozani_DH.xls (accessed on 2 March 2015).
- Brown, P. European Union Wind and Solar Electricity Policies: Overview and Considerations; Congressional Research Service: Washington, DC, USA, 2013. [Google Scholar]
- Xydis, G. Effects of air psychrometrics on the exergetic efficiency of a wind farm at a coastal mountainous site—An experimental study. Energy 2012, 37, 632–638. [Google Scholar] [CrossRef]
© 2015 by the authors; licensee MDPI, Basel, Switzerland. This article is an open access article distributed under the terms and conditions of the Creative Commons Attribution license (http://creativecommons.org/licenses/by/4.0/).