In this section, the current and future GB-aggregated capacity factor time series (
Section 2) will be used to assess and compare the statistical characteristics of a future wind power resource with greatly increased offshore wind penetration. Firstly, the long term characteristics such as the annual-mean capacity factor and the frequency distribution of hourly capacity factor values are compared (
Section 3.1). Following this, the frequency (and thus return period) of extreme persistence and ramping events are investigated (
Section 3.2 and
Section 3.3).
3.1. GB-Aggregated Capacity Factor: Long Term Statistics
The hourly GB-aggregated capacity factor time series described in
Section 2.1 has been used to analyse the annual mean capacity factor that would have been produced between 1980 and 2013, if the wind farm distributions described in
Section 2.2 had been present.
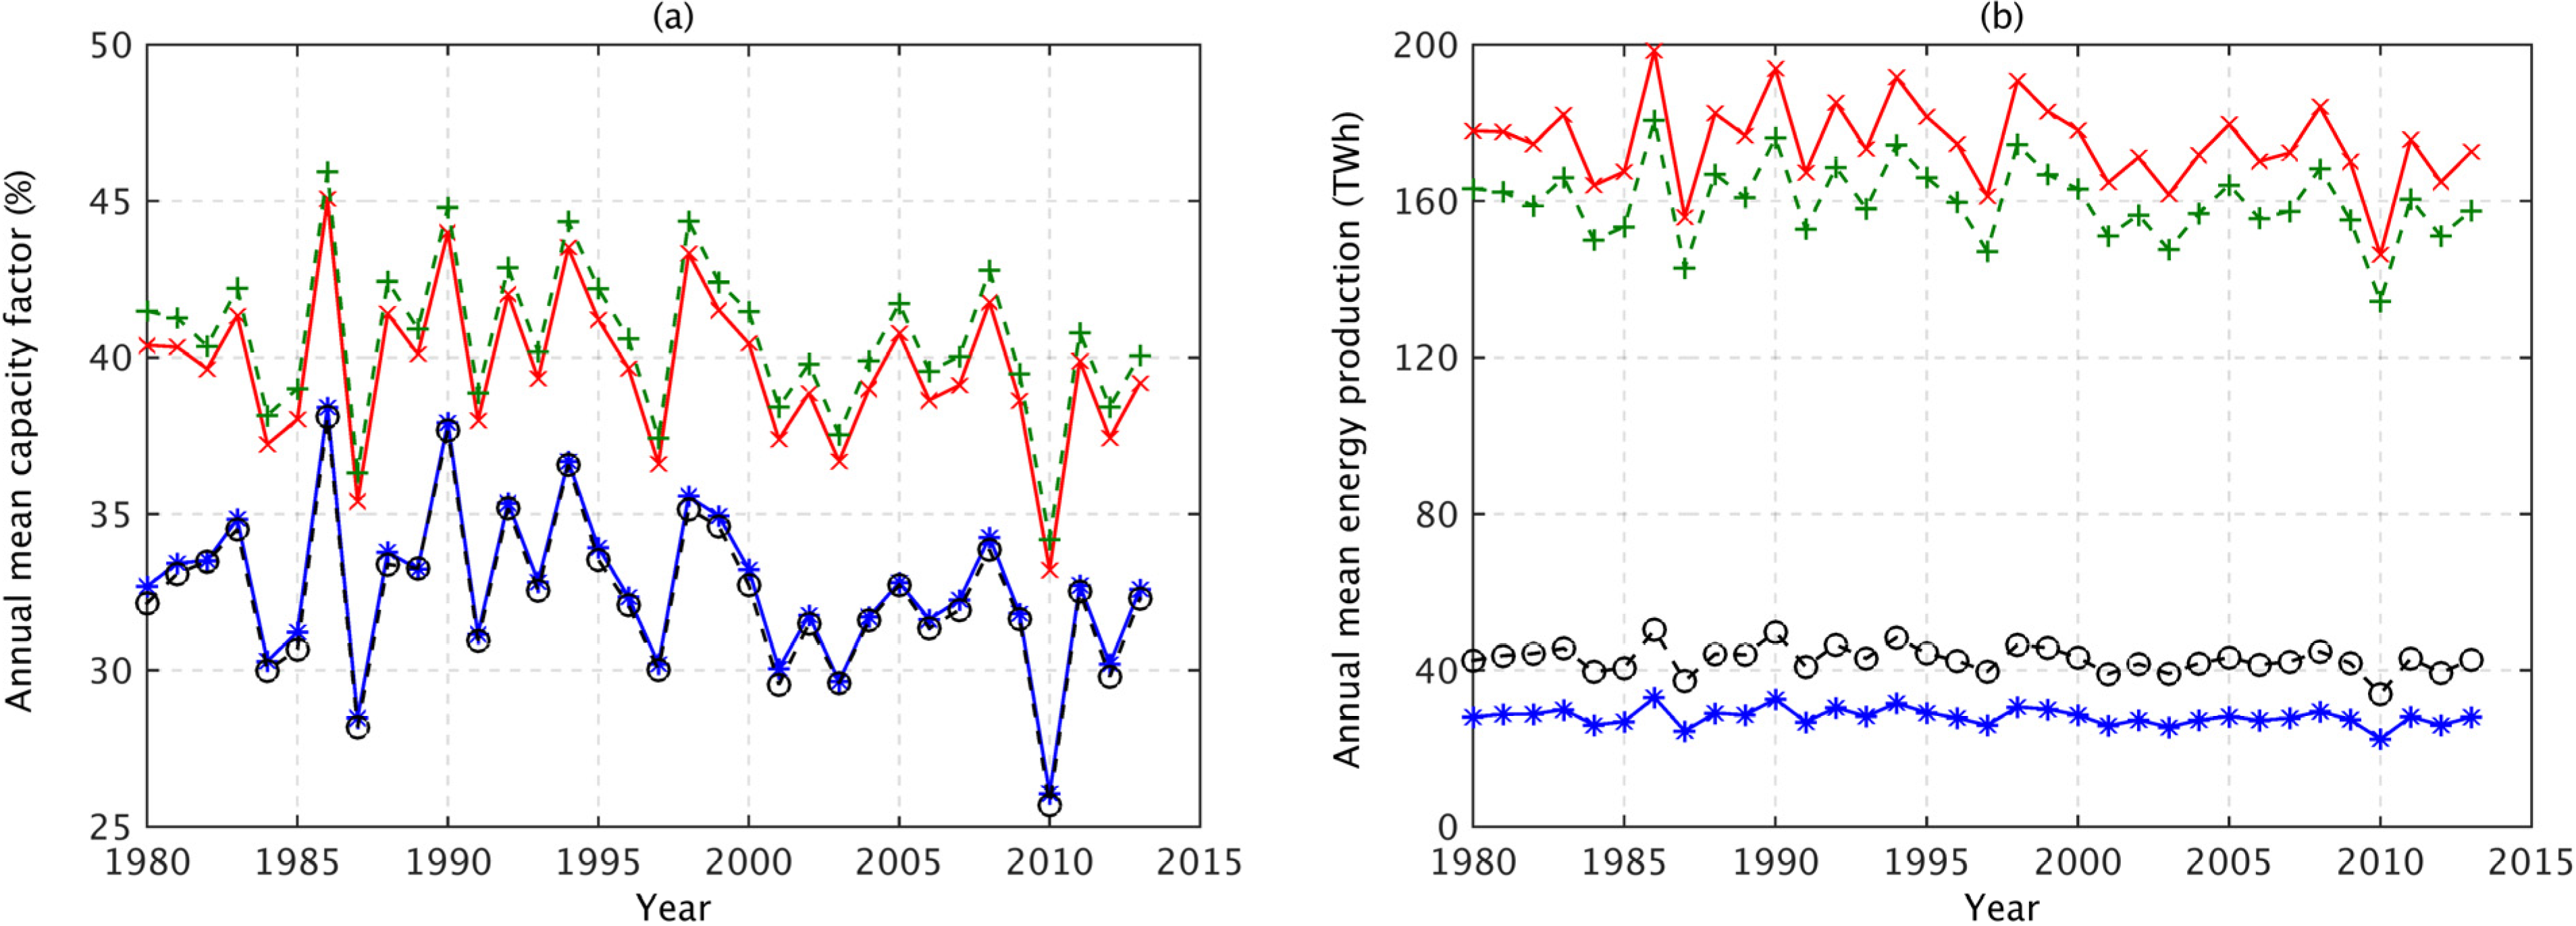
Figure 4a shows that for both the current and future wind farm distributions there is large year to year variability in the capacity factor. For the current wind farm distribution, the annual capacity factor varies from 25.7% to 38.4% with a mean value of 32.7% (blue line). This is slightly greater than previous long term estimates such as in [
8], who derived a capacity factor of 30% based on speed records for a period of 33 years (1970–2003) from onshore sites only. The annual capacity factor of the future wind farm distribution is consistently larger, with a range of 33.2%–45.0% and a mean value of 39.7% (red line). With the future wind farm distribution, it is therefore very unlikely that the annual GB capacity factor will be as low as the current mean value, even in a very low wind speed year. It is even less likely that the annual capacity factor will fall below 30%. This could lead to an increase in the capacity credit of wind generation, and thus smaller back-up costs [
20].
Figure 4.
(a) The annual mean capacity factor and (b) the annual mean energy production derived using different wind distribution scenarios; current (blue), future (red), current + onshore (black) and current + offshore (green).
Figure 4.
(a) The annual mean capacity factor and (b) the annual mean energy production derived using different wind distribution scenarios; current (blue), future (red), current + onshore (black) and current + offshore (green).
Figure 4b shows the annual mean energy production for each of the wind farm distributions. Over the 34-year period, the estimated energy production of the future wind farm distribution is a factor of 6.2 times greater than that for the current distribution. While, the addition of only the onshore wind farms slightly decreases the GB capacity factor, the increased capacity means that the energy production still increases by a factor of 1.5. In comparison, the addition of only the offshore wind farms increases the energy production by a factor of 5.7.
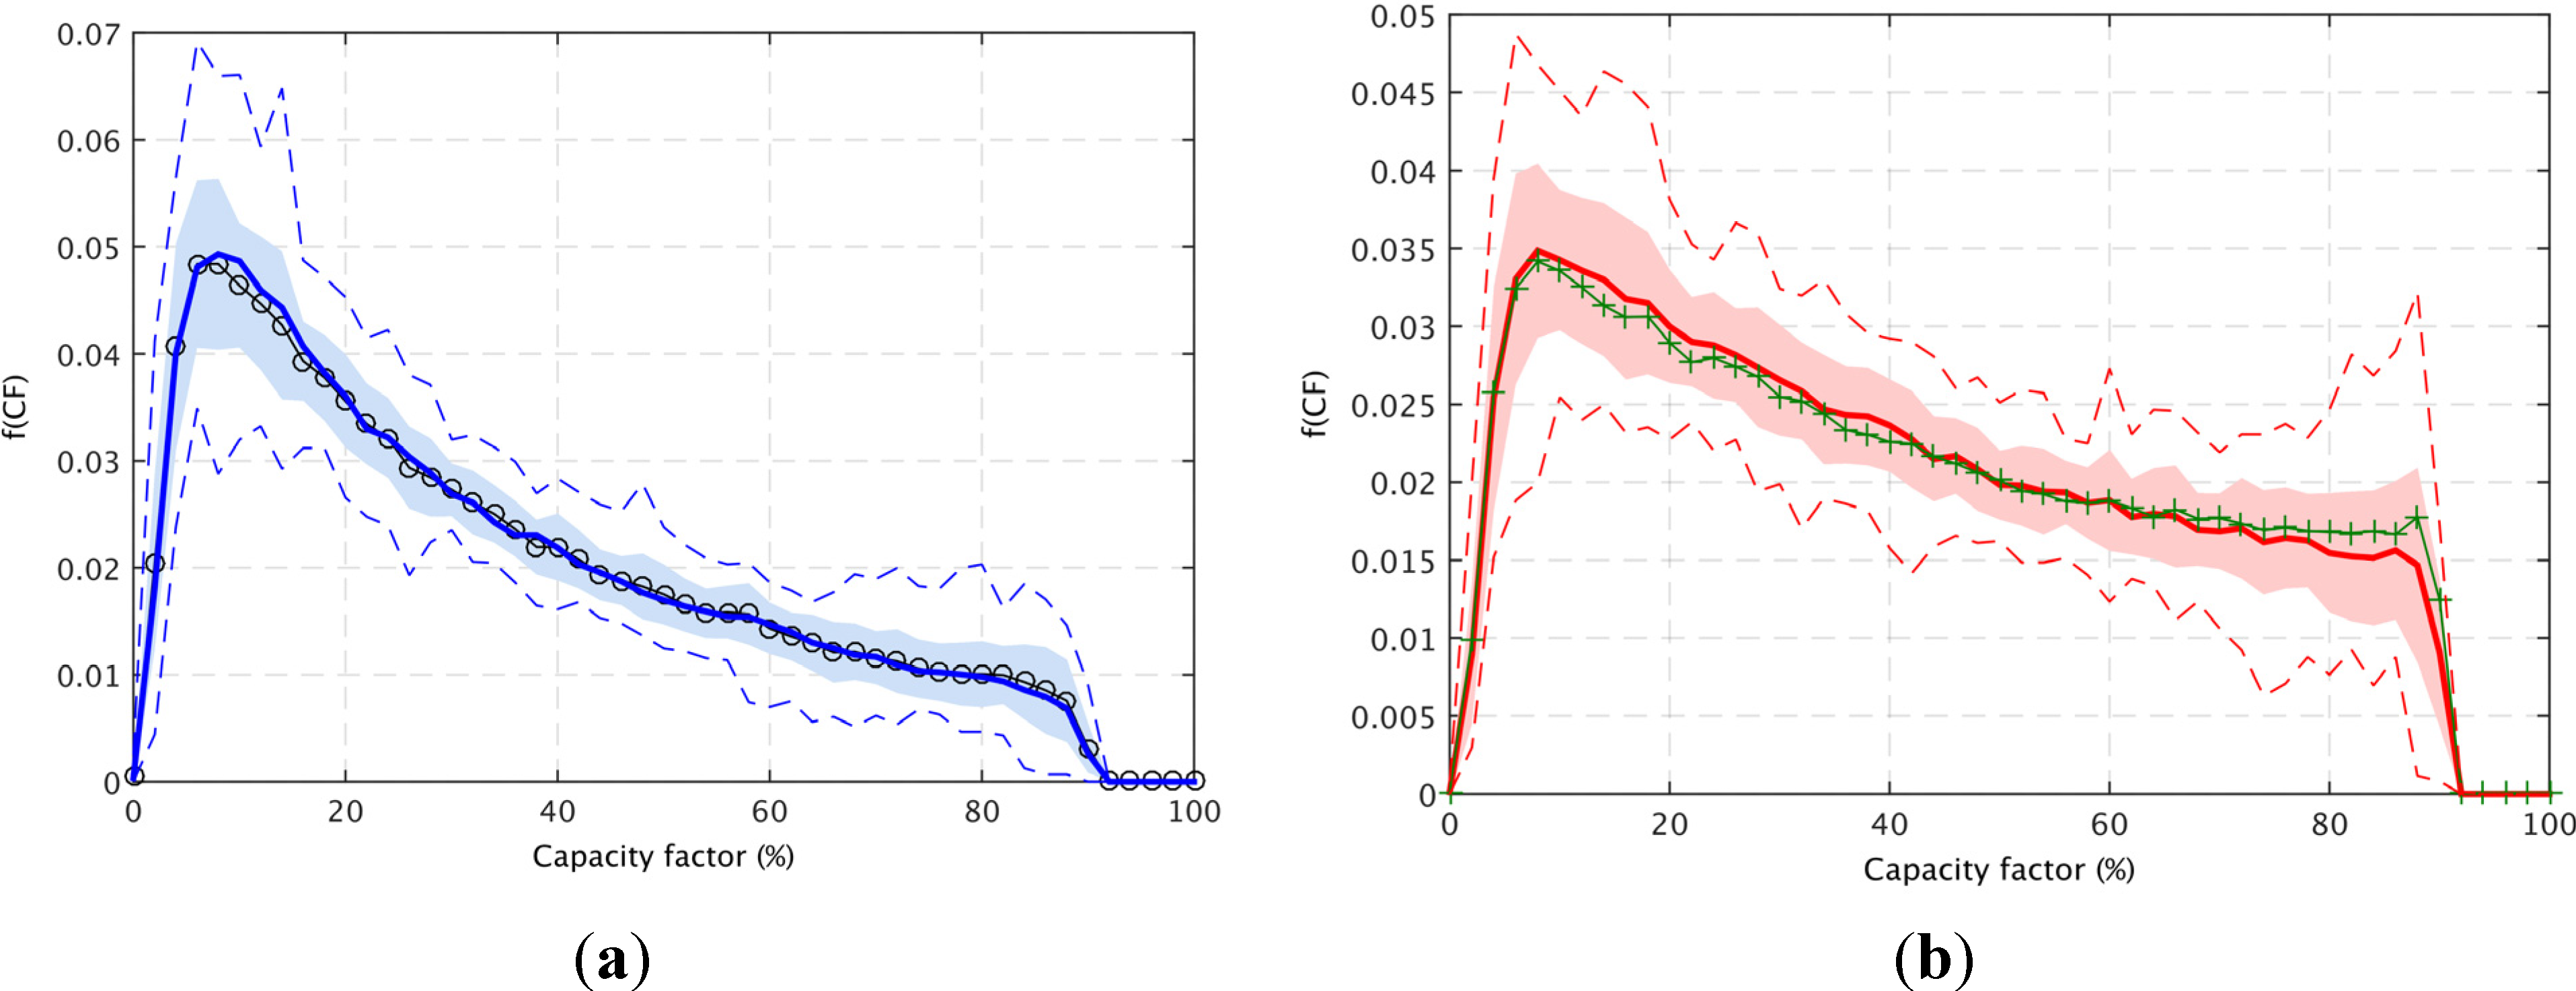
Further analysis of the hourly GB-aggregated capacity factor time series shows that for the current wind farm distribution, the frequency distribution is skewed towards low values (
Figure 5a); the 25th, 50th and 75th percentile values have mean capacity factors of 12%, 25% and 48% respectively. In comparison, for the future wind farm distribution there is a shift to higher capacity factors, thus the capacity factor values are more evenly distributed (
Figure 5b) and the 25th, 50th and 75th percentile values have mean capacity factors of 18%, 36% and 60% respectively.
Figure 5.
The frequency density distribution of the hourly GB-aggregated capacity factor derived from the full (1980–2013) time series for (a) the “current” wind farm distribution (blue) along with the “current + onshore” distribution (black, circles); and (b) the “future” wind farm distribution (red) along with the “current + offshore” distribution (green, crosses). The plot shows the mean value for each capacity factor bin (bin size 1%) across the 34 years and the shaded areas represent ±1 standard deviation from the mean (solid) and the dashed lines indicate the minimum and maximum annual frequencies.
In addition to the current and future scenarios,
Figure 4 and
Figure 5 also show results from two additional scenarios that consider the addition of future onshore and offshore wind farms separately. These results suggest that the improved performance of the future distribution is due almost entirely to the addition of offshore wind capacity.
Figure 5a shows that if only the planned onshore wind projects were added to the current distribution, there is very little change in the frequency distribution of the GB-aggregated capacity factor and the 34-year mean GB-aggregated capacity factor would decrease slightly to 32.4%. In contrast, if only the offshore wind farms were added, the frequency distribution of the GB-aggregated capacity factor is shifted to the higher values and is very similar to the results for the future wind farm distribution, in this case the mean capacity factor increases to 40.6%.
To analyse these differences in more detail,
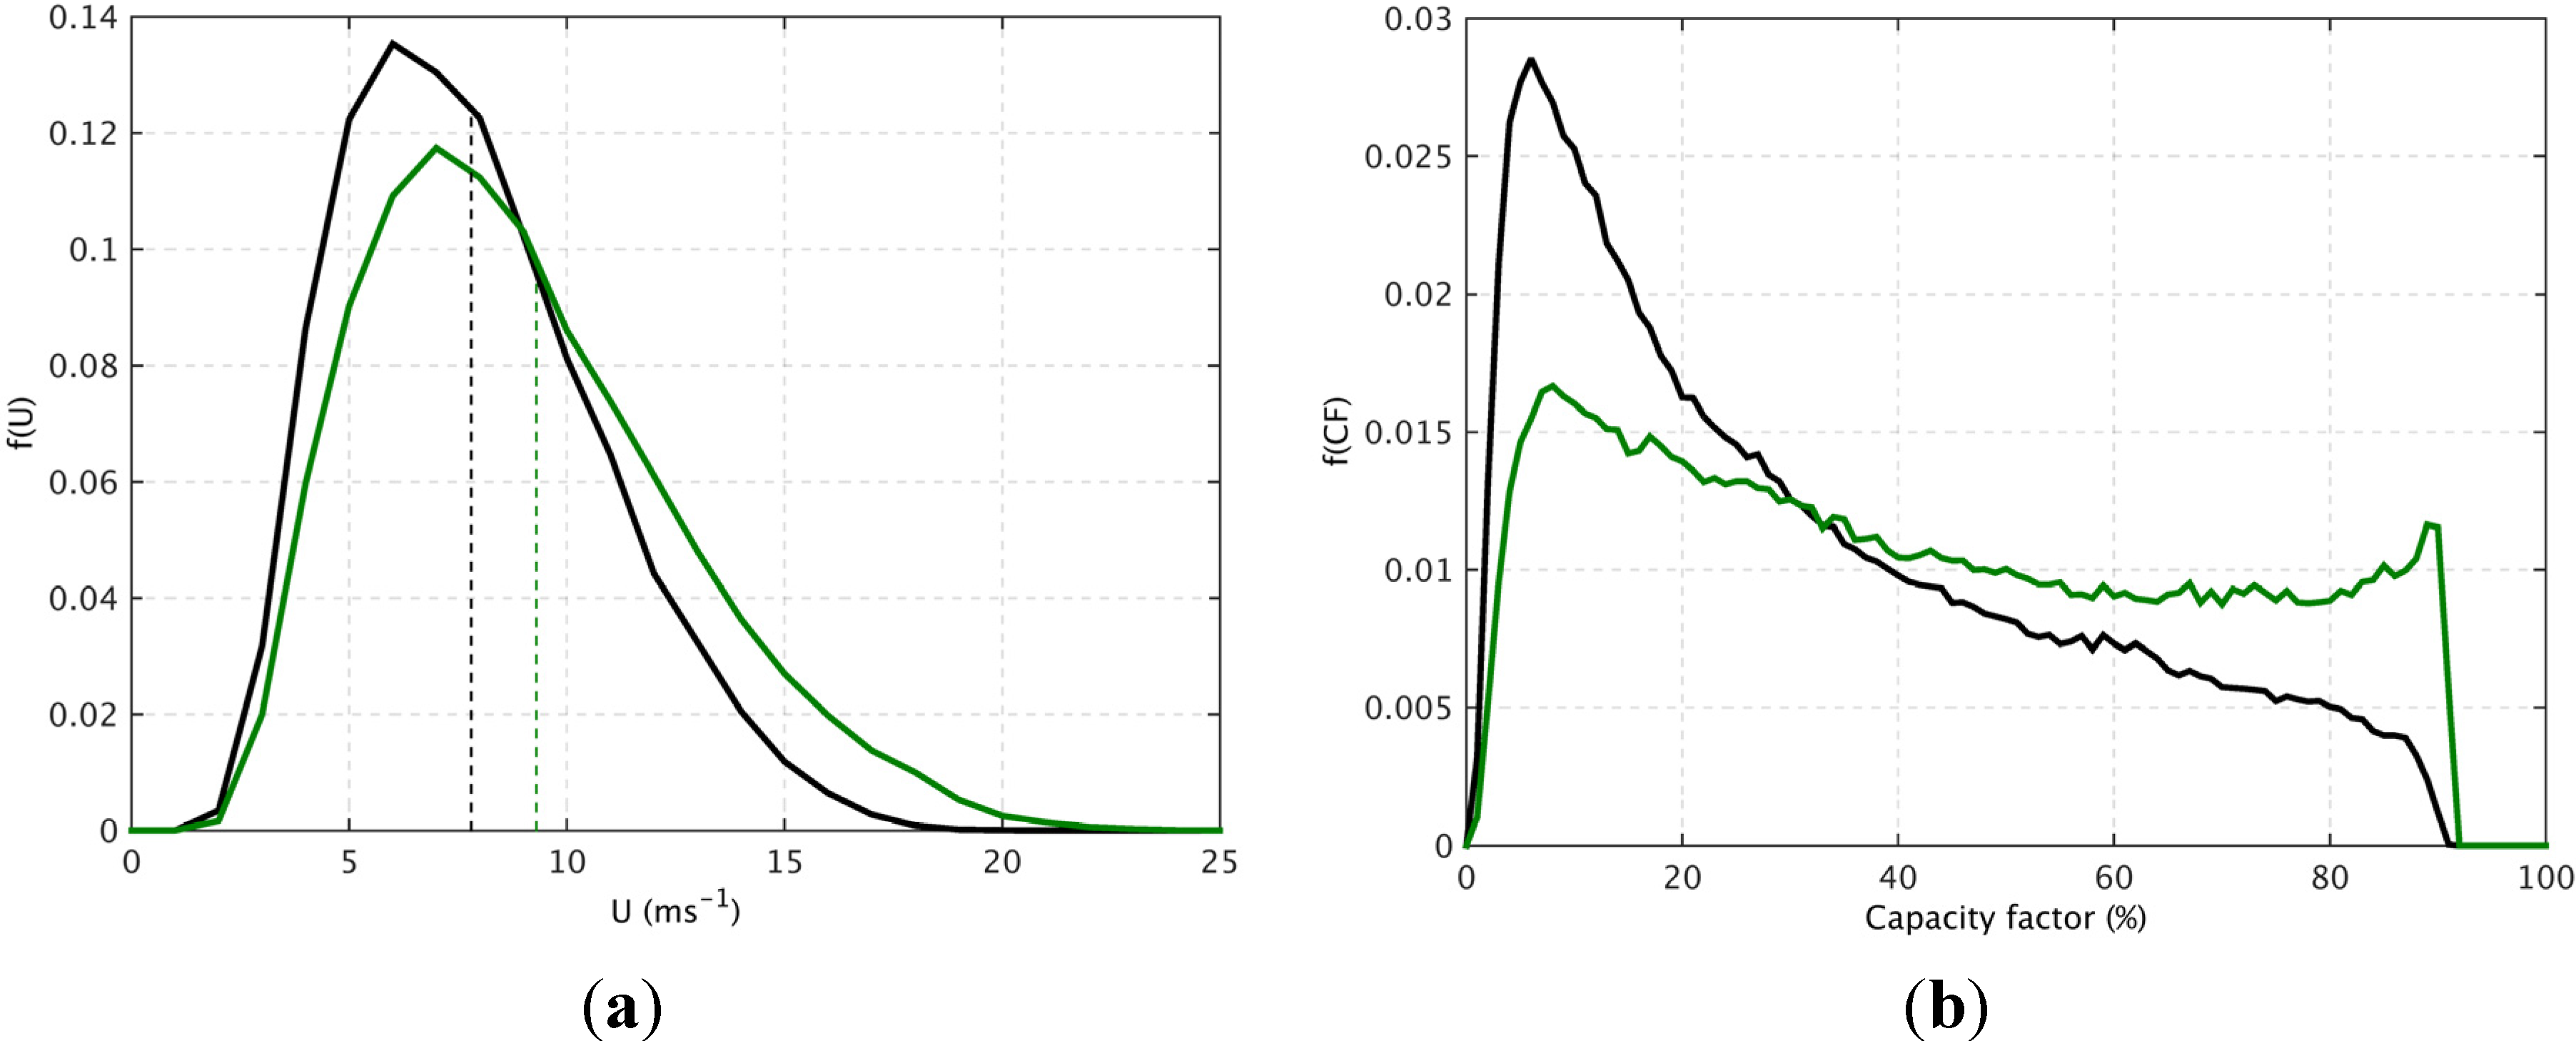
Figure 6a shows that (as expected) the offshore wind farms are more likely to experience higher wind speeds than the onshore farms. The capacity weighted 34-year mean wind speed for all of offshore wind farms in the future distribution is 9.3 ms
−1, compared to 7.8 ms
−1 for all onshore farms. As a result, the frequency distribution of hourly capacity factor values for offshore wind farms is relatively flat, while the onshore frequency distribution is clearly skewed towards low capacity factor values (
Figure 6b). The 34-year mean capacity factor for the onshore farms is 31.6%, compared to 42% for the offshore farms. The latter result is broadly in agreement with that for the Danish offshore wind fleet [
21]. However, it is significantly larger than the observed values from current offshore wind farms in GB. For the period 2004–2007, the Round 1 wind farms achieved a mean capacity factor of 29.5% [
22]. For the same period, the mean capacity factor of the Round 1 offshore wind farms derived from the MERRA data is 33%. The difference in these values is likely to be attributable to the relatively low availability of the offshore turbines in the Round 1 wind farms. For onshore farms, the annual turbine availability is typically above 97%, however for the UK Round 1 offshore wind farms this figure is reduced to just 80% [
22]. This difference is largely due to increased difficulty in accessing offshore turbines for repair or maintenance. The power curve used in this study is predominantly based on onshore wind turbines, and therefore does not take into account this reduced availability. Consequently, the capacity factors estimated in this study for the future wind farm distribution assume that the availability of offshore turbines in the larger Round 3 projects will approach the levels of availability currently found at onshore turbines.
Figure 6.
A comparison of (a) the frequency distribution of the hourly capacity weighted GB mean wind speed, the dashed lines represent the capacity weighted mean wind speeds; and (b) the frequency distribution of the hourly GB-aggregated capacity factor, for the future wind farm scenario. Statistics for the onshore (black) and offshore (green) wind farms are plotted separately.
3.2. A 34 Year Climatology of Persistent Low or High Wind Generation
Persistent low generation events can have serious implications for the security of supply, particularly if they coincide with periods of high demand. In contrast, as the penetration of wind capacity increases, periods of persistent high generation could lead to the deliberate curtailment of wind to ensure local load balancing. This is an inefficient use of the available resource and can lead to significant costs for the system operator [
23,
24]. This section uses the hourly GB-aggregated capacity factor time series to determine the magnitude and frequency of persistent low and high generation events for both the current and future wind farm distributions.
The mean frequency with which persistent low generation events occur is presented in
Figure 7a–c as a function of the length of time for which the GB-aggregated capacity factor remains below a given threshold (5%, 10% and 20%). The frequency of persistent low generation events reduces as the capacity factor threshold is decreased or the persistence time increases. The figure shows the mean number of events per year for the 34 years ±1 standard deviation, as well as the minimum and maximum number of events in any one year. As in
Figure 4 and
Figure 5, there is large inter-annual variability in the frequency of persistence events. For example, for the current wind farm distribution the GB-aggregated capacity factor remains below 20% for at least 10 h, between 65 and 92 times per year, depending on the year.
Figure 7.
The frequency of persistent low generation events for the current (solid lines) and future (dashed lines) wind farm distributions for three capacity factor thresholds: (a) 5%; (b) 10%; (c) 20%. All panels show the mean number of events per year for all 34 years ±1 standard deviation (shaded areas).
Figure 7a–c also show that there are fewer persistent low generation events for the future wind farm distribution. For example, for the current distribution there are 16 occasions per year on average in which the GB-aggregated capacity factor is below 5% for at least 12 h, compared with only nine occasions for the future distribution. For the capacity thresholds of 5% and 10%, the difference between the current and future scenarios decreases as the persistence time increases. However, for the 20% capacity factor threshold, the difference between the current and future scenarios initially widens as the persistence time increases, reaching a maximum when the persistence time equals 30 h, before decreasing as the persistence time increases further.
In contrast, there are a greater number of periods of persistent high generation for the future distribution than there are for the current distribution.
Figure 8a–c show the mean frequency with which persistent high capacity factor events occur as a function of the length of time for which the GB-aggregated capacity factor remains above a given threshold (50%, 65% and 80%). The frequency of these events decreases as the threshold or the persistence time increases. For the current wind farm distribution, the capacity factor remains above 65% for at least 24 h 16 times a year on average, compared with 27 times per year for the future distribution.
Figure 8.
The frequency of persistent high generation events for the current (solid lines) and future (dashed lines) wind farm distributions for three capacity factor thresholds: (a) 50%; (b) 65%; (c) 80%. All panels show the mean number of events per year for all 34 years ±1 standard deviation (shaded areas).
The changes in the frequency of persistent generation events in
Figure 7 and
Figure 8 are almost entirely due to the addition of the offshore wind farms, the addition of onshore farms has very little impact. This is shown by considering the results of the “current + onshore” and “current + offshore” scenarios, which are almost identical to the results of the current and future scenarios respectively. The increased offshore capacity leads to a shift in the frequency distribution of the hourly GB-aggregated capacity factor towards higher values (
Figure 5). As a consequence of this shift, the overall proportion of time for which the capacity factor is below the 5%, 10% and 20% thresholds is reduced from 6%, 20% and 42% for the current wind farm distribution to just 3%, 12% and 29% for the future distribution. In contrast, the overall proportion of time for which the GB-aggregated capacity factor exceeds the 50%, 65% and 80% thresholds is increased from 22%, 12% and 3% for the current distribution to 35%, 20% and 8% for the future distribution.
Given the difference in the capacity between the current (10.2 GW) and future distributions (50 GW) it is also important to consider the persistence of events defined by a fixed power output threshold.
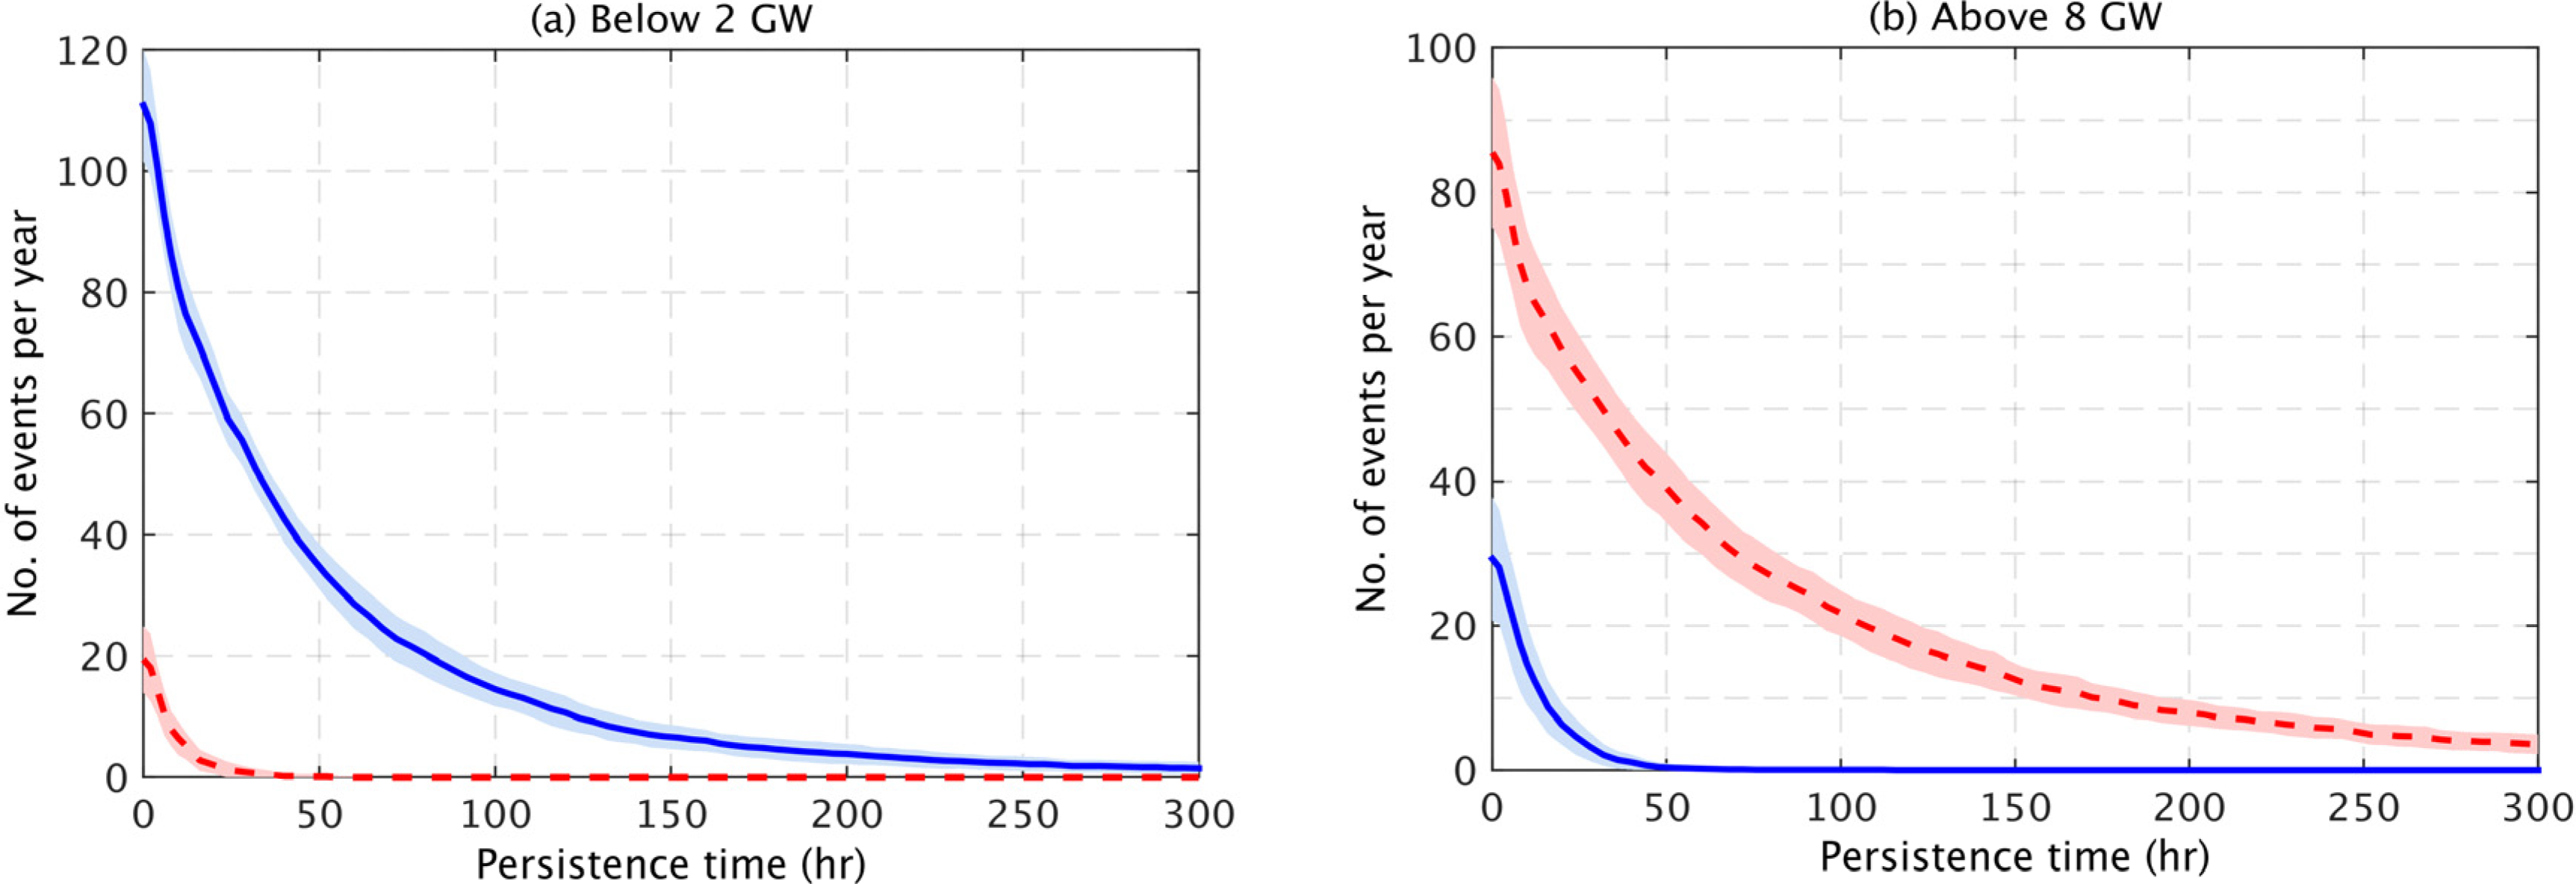
Figure 9a shows that for the future distribution, there are very few ocassions in a year where the GB mean power output is persistently below 2 GW, for any period of time. In contrast, for the current distribution, the power output falls below this threshold more frequently. For example, for the future distribution there is an average of only one event per year when the power output is below 2 GW for a period of 24 h, in comparison to 59 events per year for the current distribution.
Figure 9b shows that for the current distribution, there are few events where the GB mean power output is persistently greater than 8 GW. In contrast, for the future distribution this corresponds to a capacity factor of only 16% and therefore such events occur more frequently. For example, for the current distribution the GB power output is greater than 8 GW for a period of 24 h on only five occasions per year on average, in comparison to 55 events per year for the future distribution.
Figure 9.
The frequency of events for which: (a) the GB mean power output is persistently below 2 GW; and (b) the GB mean power output is persistently above 8 GW. Both panels show the mean value for the current (blue) and future (red) distributions ±1 standard deviation.
Figure 9.
The frequency of events for which: (a) the GB mean power output is persistently below 2 GW; and (b) the GB mean power output is persistently above 8 GW. Both panels show the mean value for the current (blue) and future (red) distributions ±1 standard deviation.
3.3. A 34 Year Climatology of Ramping Events
Ramping events are a major concern for power system operators as they can lead to large forecast errors which can have significant implications for the cost of balancing the system. As the penetration of wind increases, the implications of these errors will become greater.
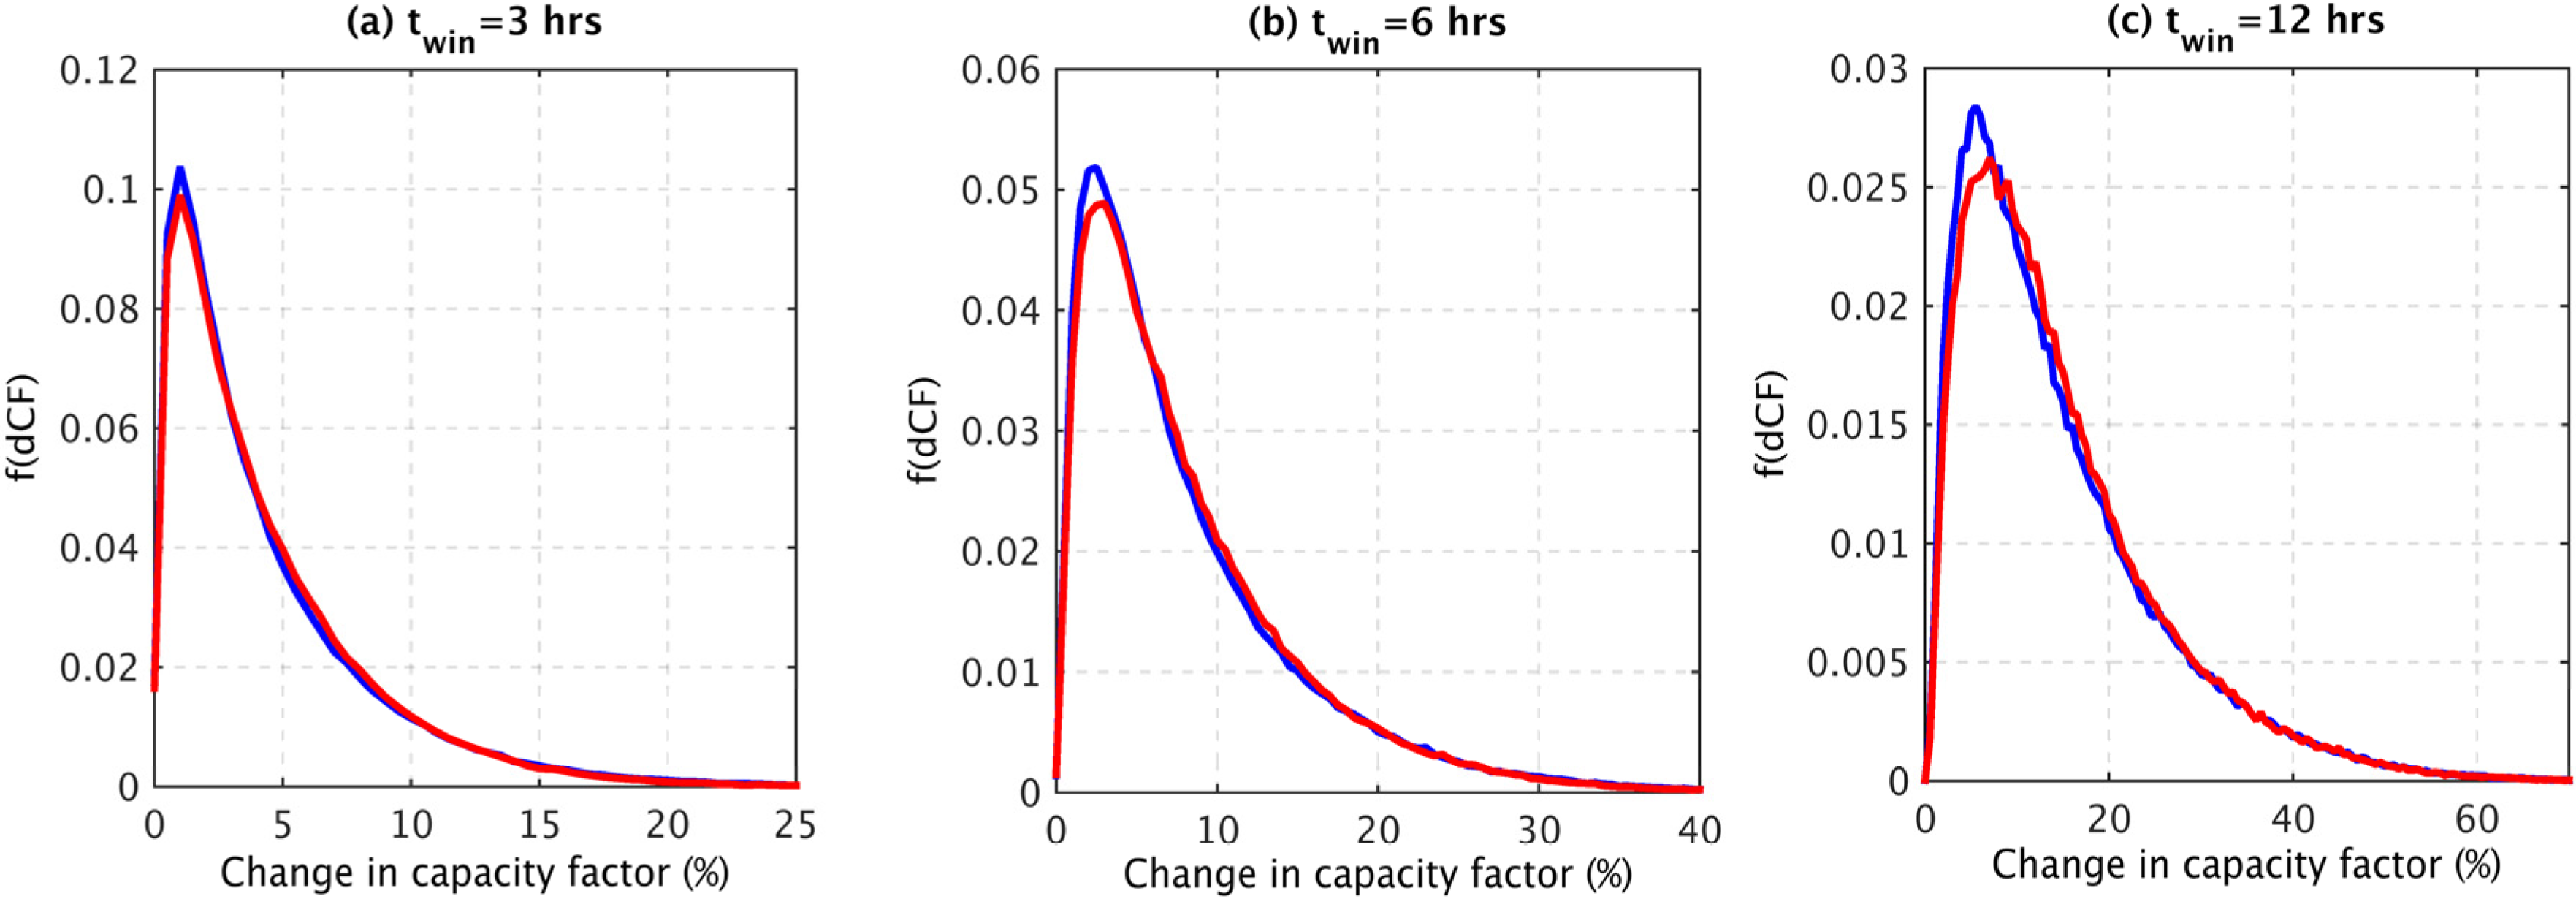
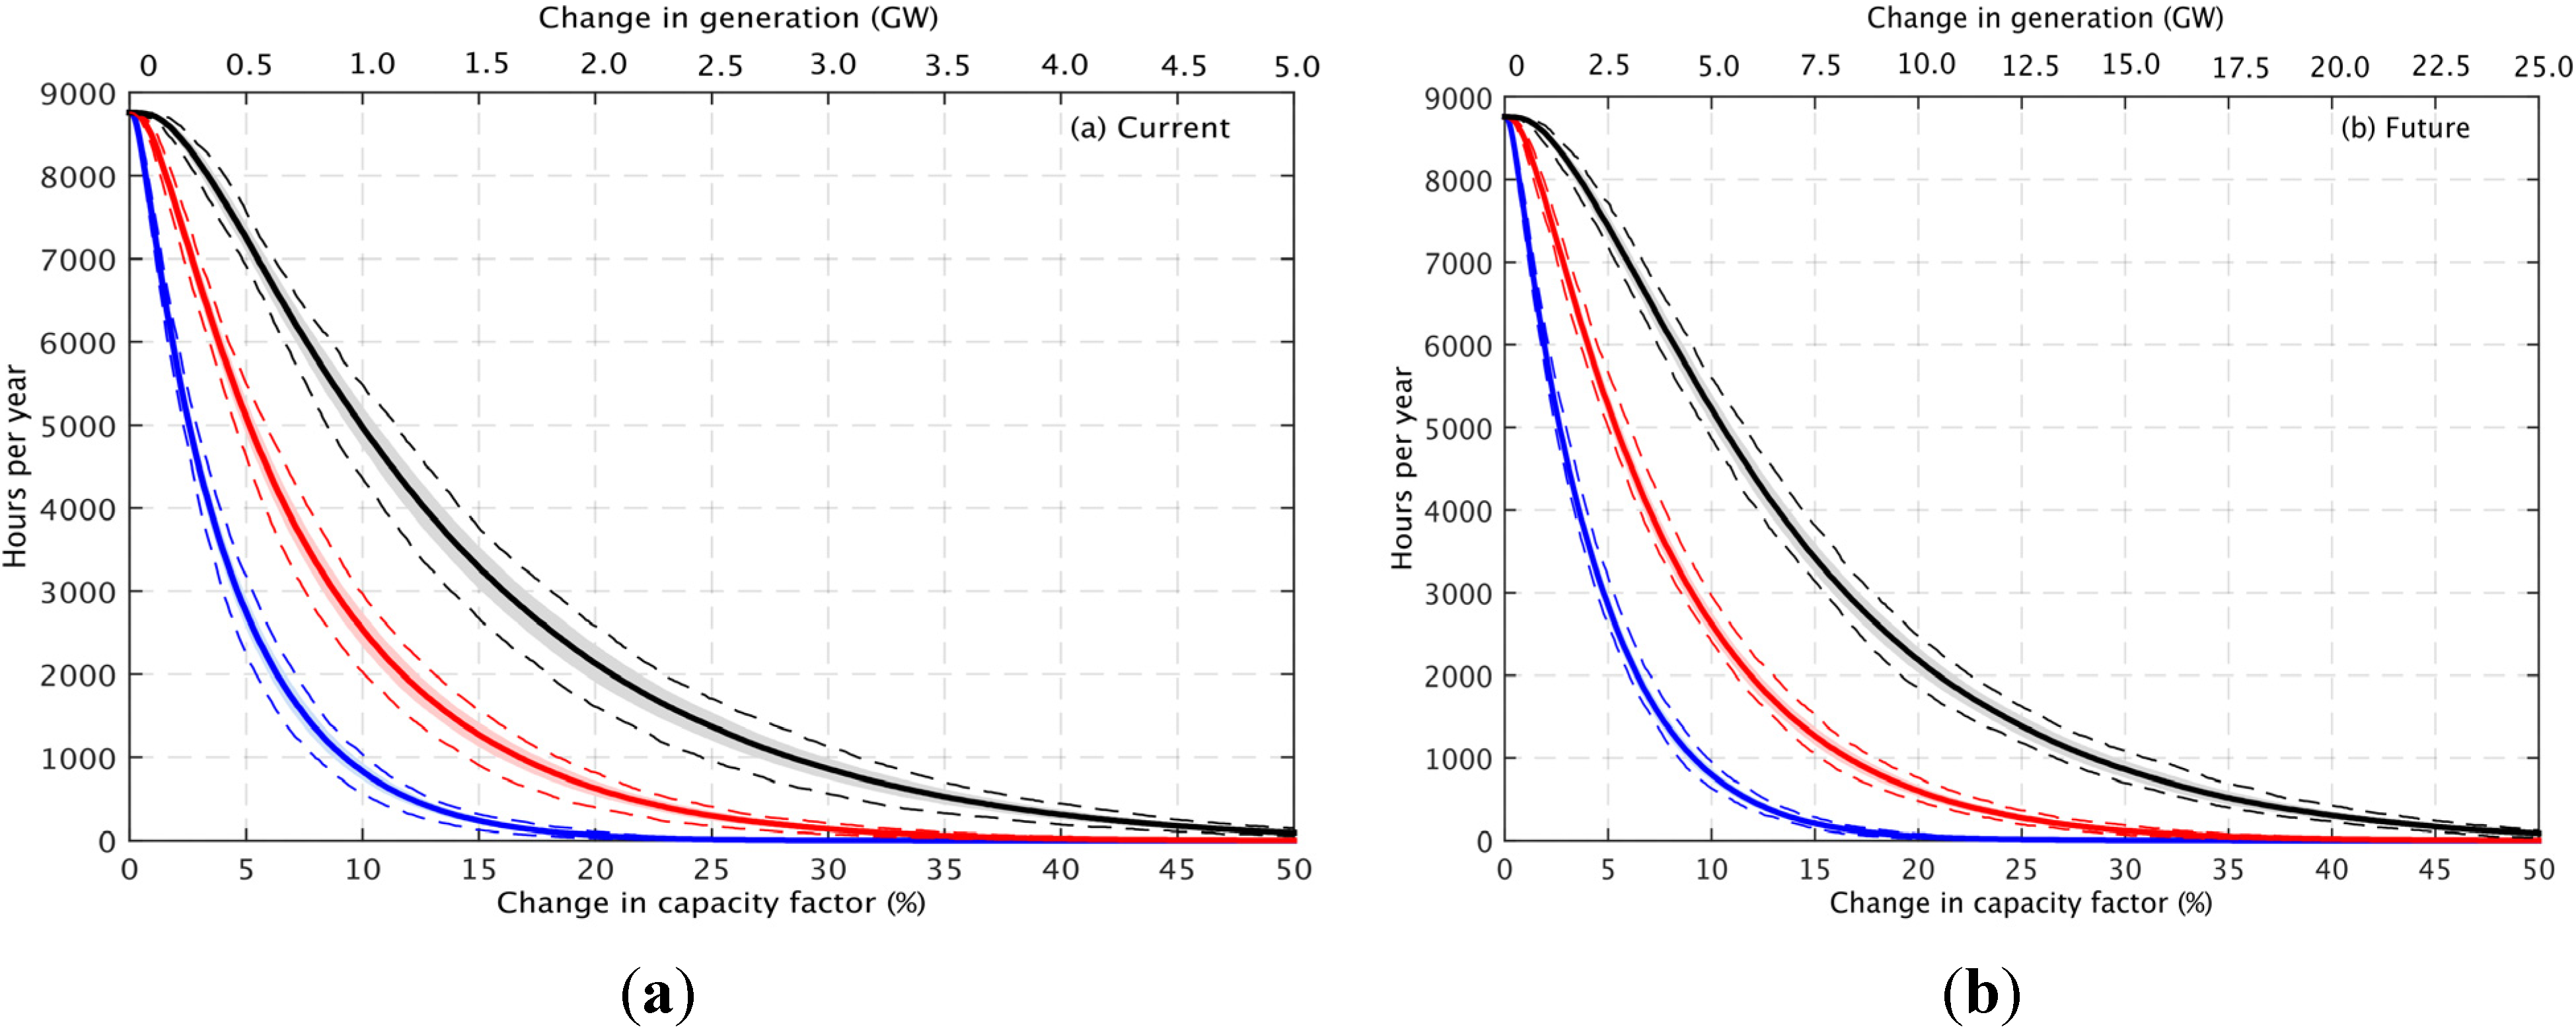
Figure 10a–c show the frequency distribution of current and future ramping events within three time windows: Δ
t = 3, 6 and 12 h. The figures suggest that, despite the fact that the offshore wind farms typically experience higher wind speeds than those onshore and therefore operate in a different region of the power curve, the frequency and magnitude of ramping events is largely insensitive to the change in wind farm distribution. Nevertheless, as the capacity of the future wind farm distribution is significantly greater than the current distribution, a similar change in capacity factor equates to a change in power which is approximately five times greater for the future distribution (
Figure 11). For example, for the current distribution a swing of 2.5 GW within 3 h (corresponding to a capacity factor of 25%) occurs on 14 occasions in an average year. However, for the future distribution a similar swing (2.5 GW within 3 h) corresponds to only a 5% swing in capacity factor and occurs much more frequently (for 2900 occasions in an average year).
Figure 10.
The frequency distribution of ramping events for the current (blue) and future (red) wind farm distributions for three time windows: (a) twin = 3 h; (b) twin = 6 h; and (c) twin = 12 h.
Figure 10.
The frequency distribution of ramping events for the current (blue) and future (red) wind farm distributions for three time windows: (a) twin = 3 h; (b) twin = 6 h; and (c) twin = 12 h.
Figure 11.
The frequency distribution of ramping events for the (a) current and (b) future wind farm distribution. The figures show the mean number of hours per year for which there is a subsequent ramp of at least ΔCF (also expressed as ΔP) within different time windows twin = 3 (blue), 6 (red) and 12 (black) h. The shaded area represents ±1 standard deviation, and the dashed lines represent the minimum and maximum numbers for any one year.
These results suggest that whilst the swings in capacity factor in the future will be similar to those currently experienced, the increased future capacity implies that the system operator will need to frequently manage much larger power swings than are experienced at present.
While the overall frequency distribution of the ramping events is largely unchanged (
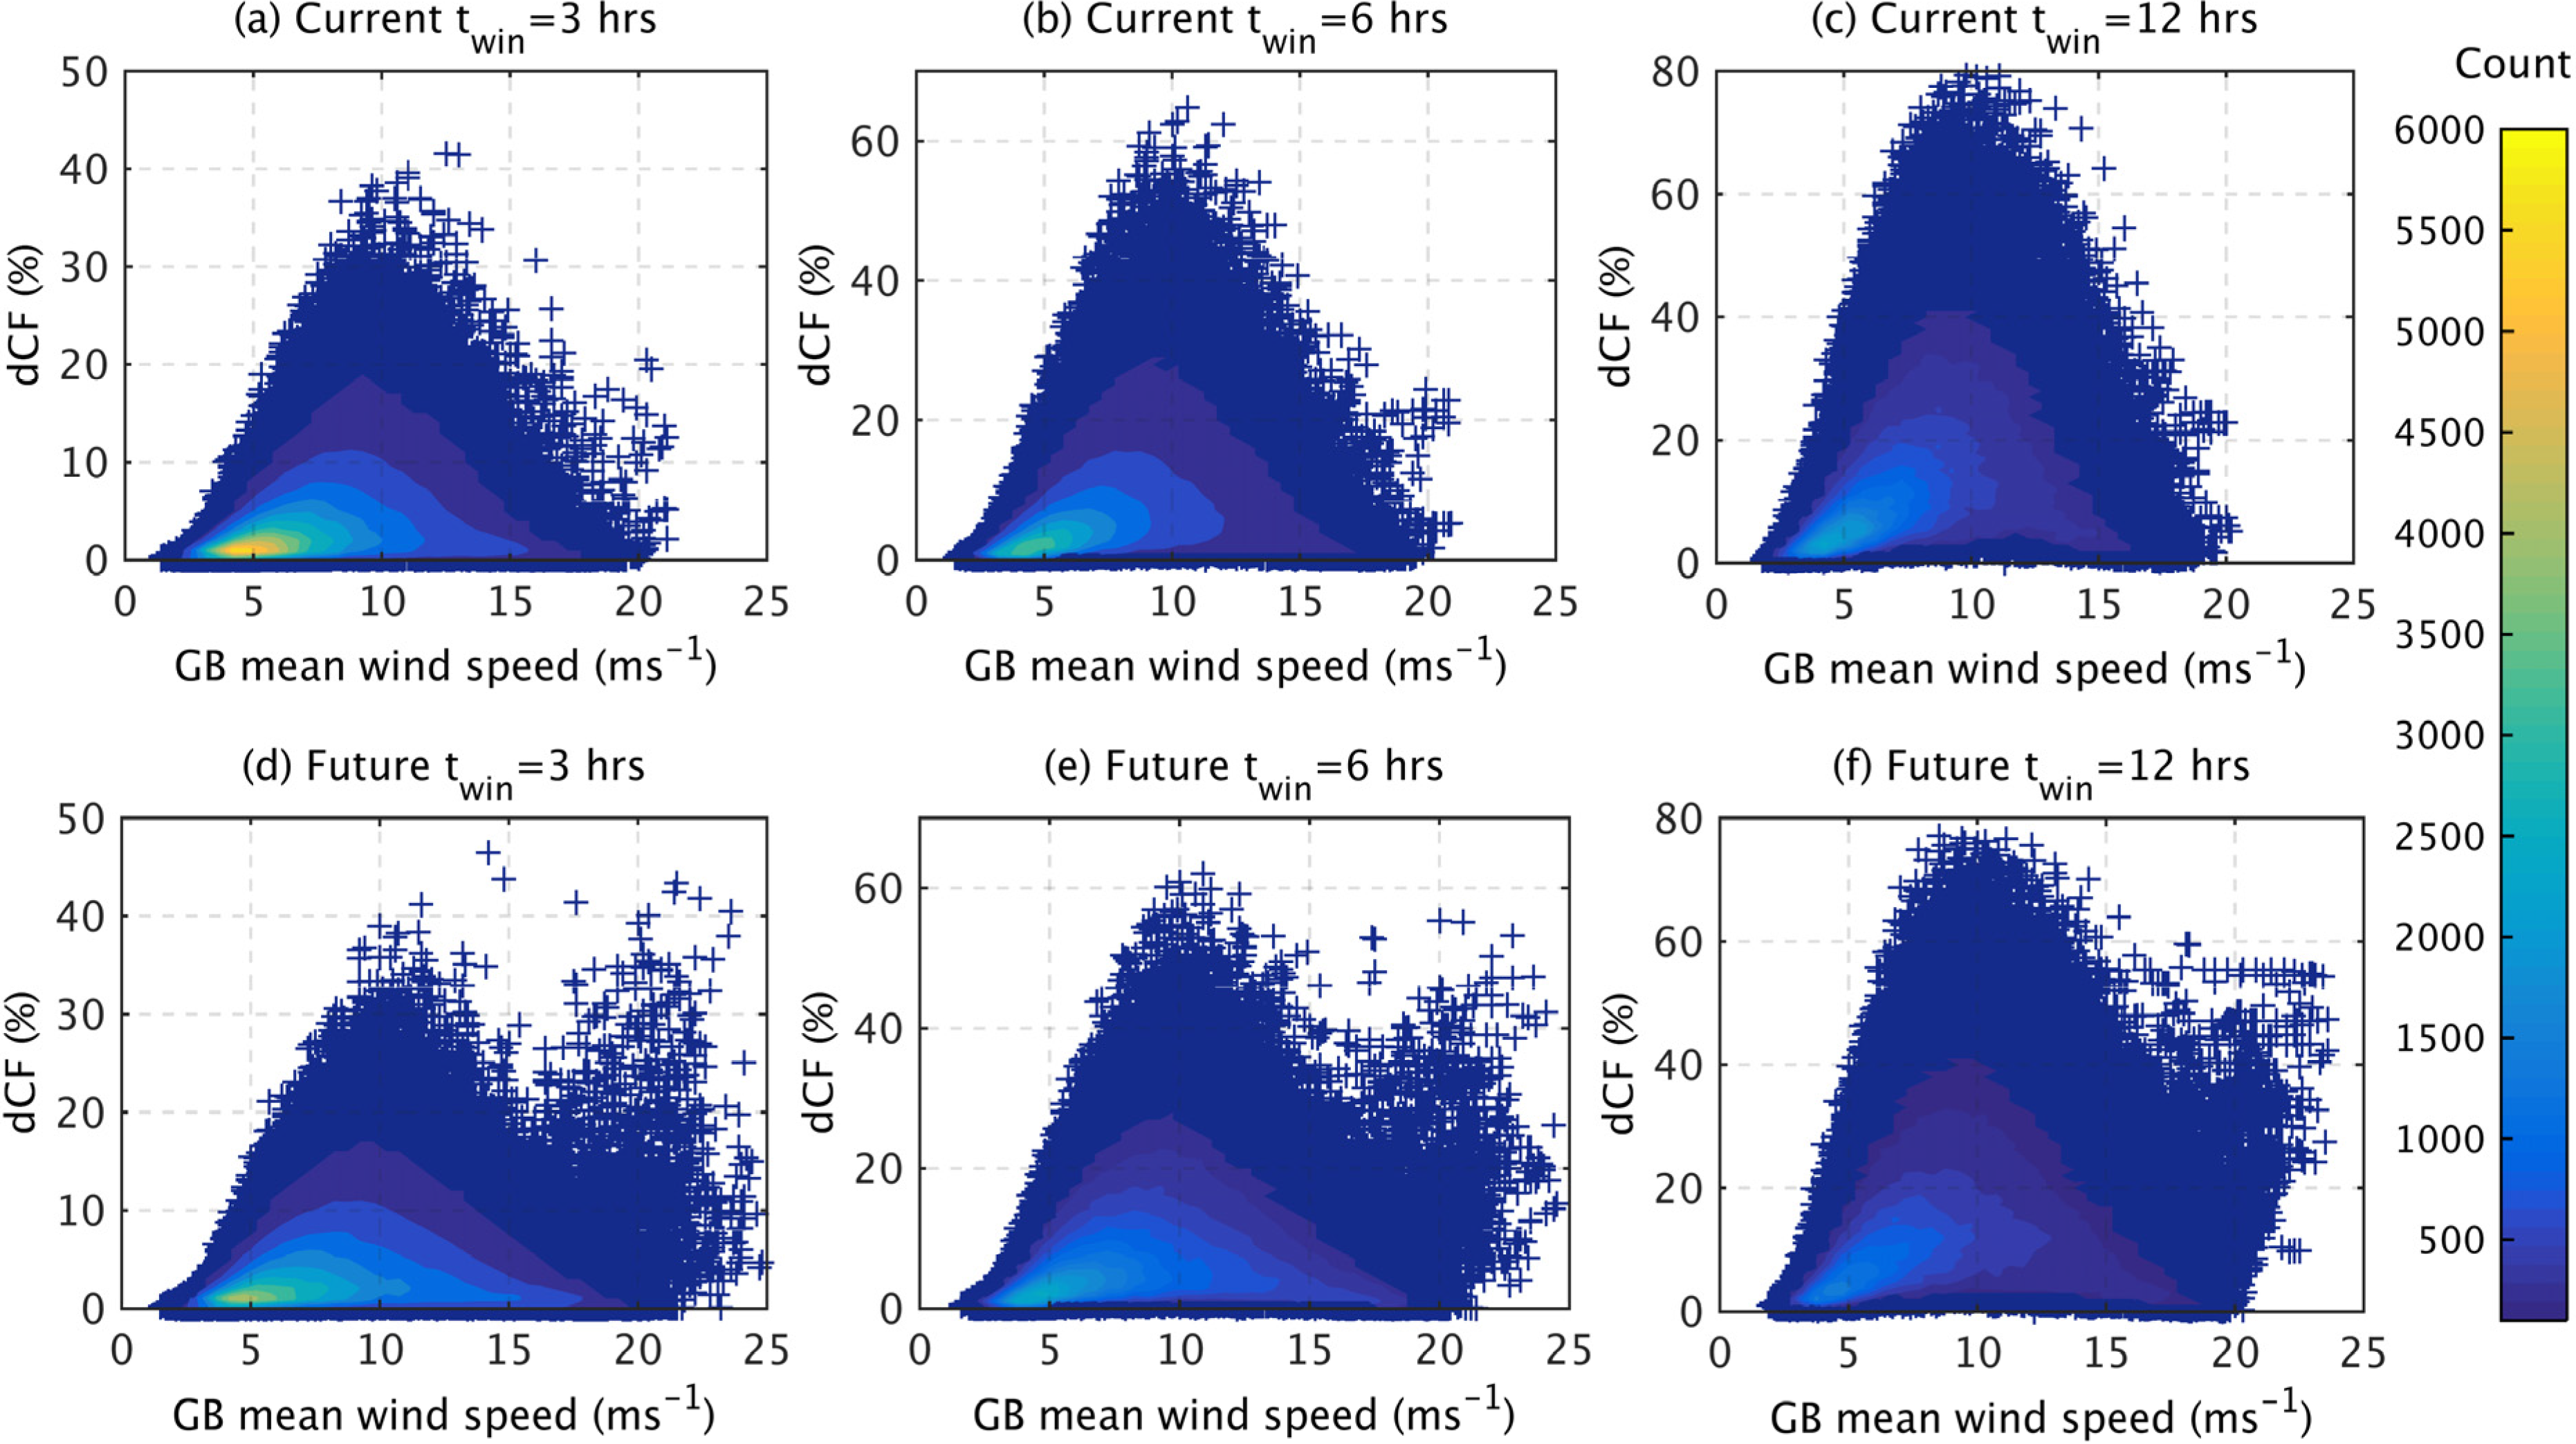
Figure 10), it should be noted that for individual cases the ambient meteorological conditions can sometimes elicit very different ramping responses from the current and future wind fleets. To investigate this,
Figure 12 shows the frequency of different ramp magnitudes as a function of the GB capacity weighted mean wind speed. In general, the shape of the distributions is very similar for the current and future wind fleets, with the majority of the large ramping events occurring at moderate GB mean wind speeds. However, for the future distribution a second peak emerges at high wind speeds (approx. 20 ms
−1), which can be attributed to turbine cut-out. These events are very rare and only occur on approximately 800 occasions (less than 0.25% of the time), but nonetheless need to managed by the system operator.
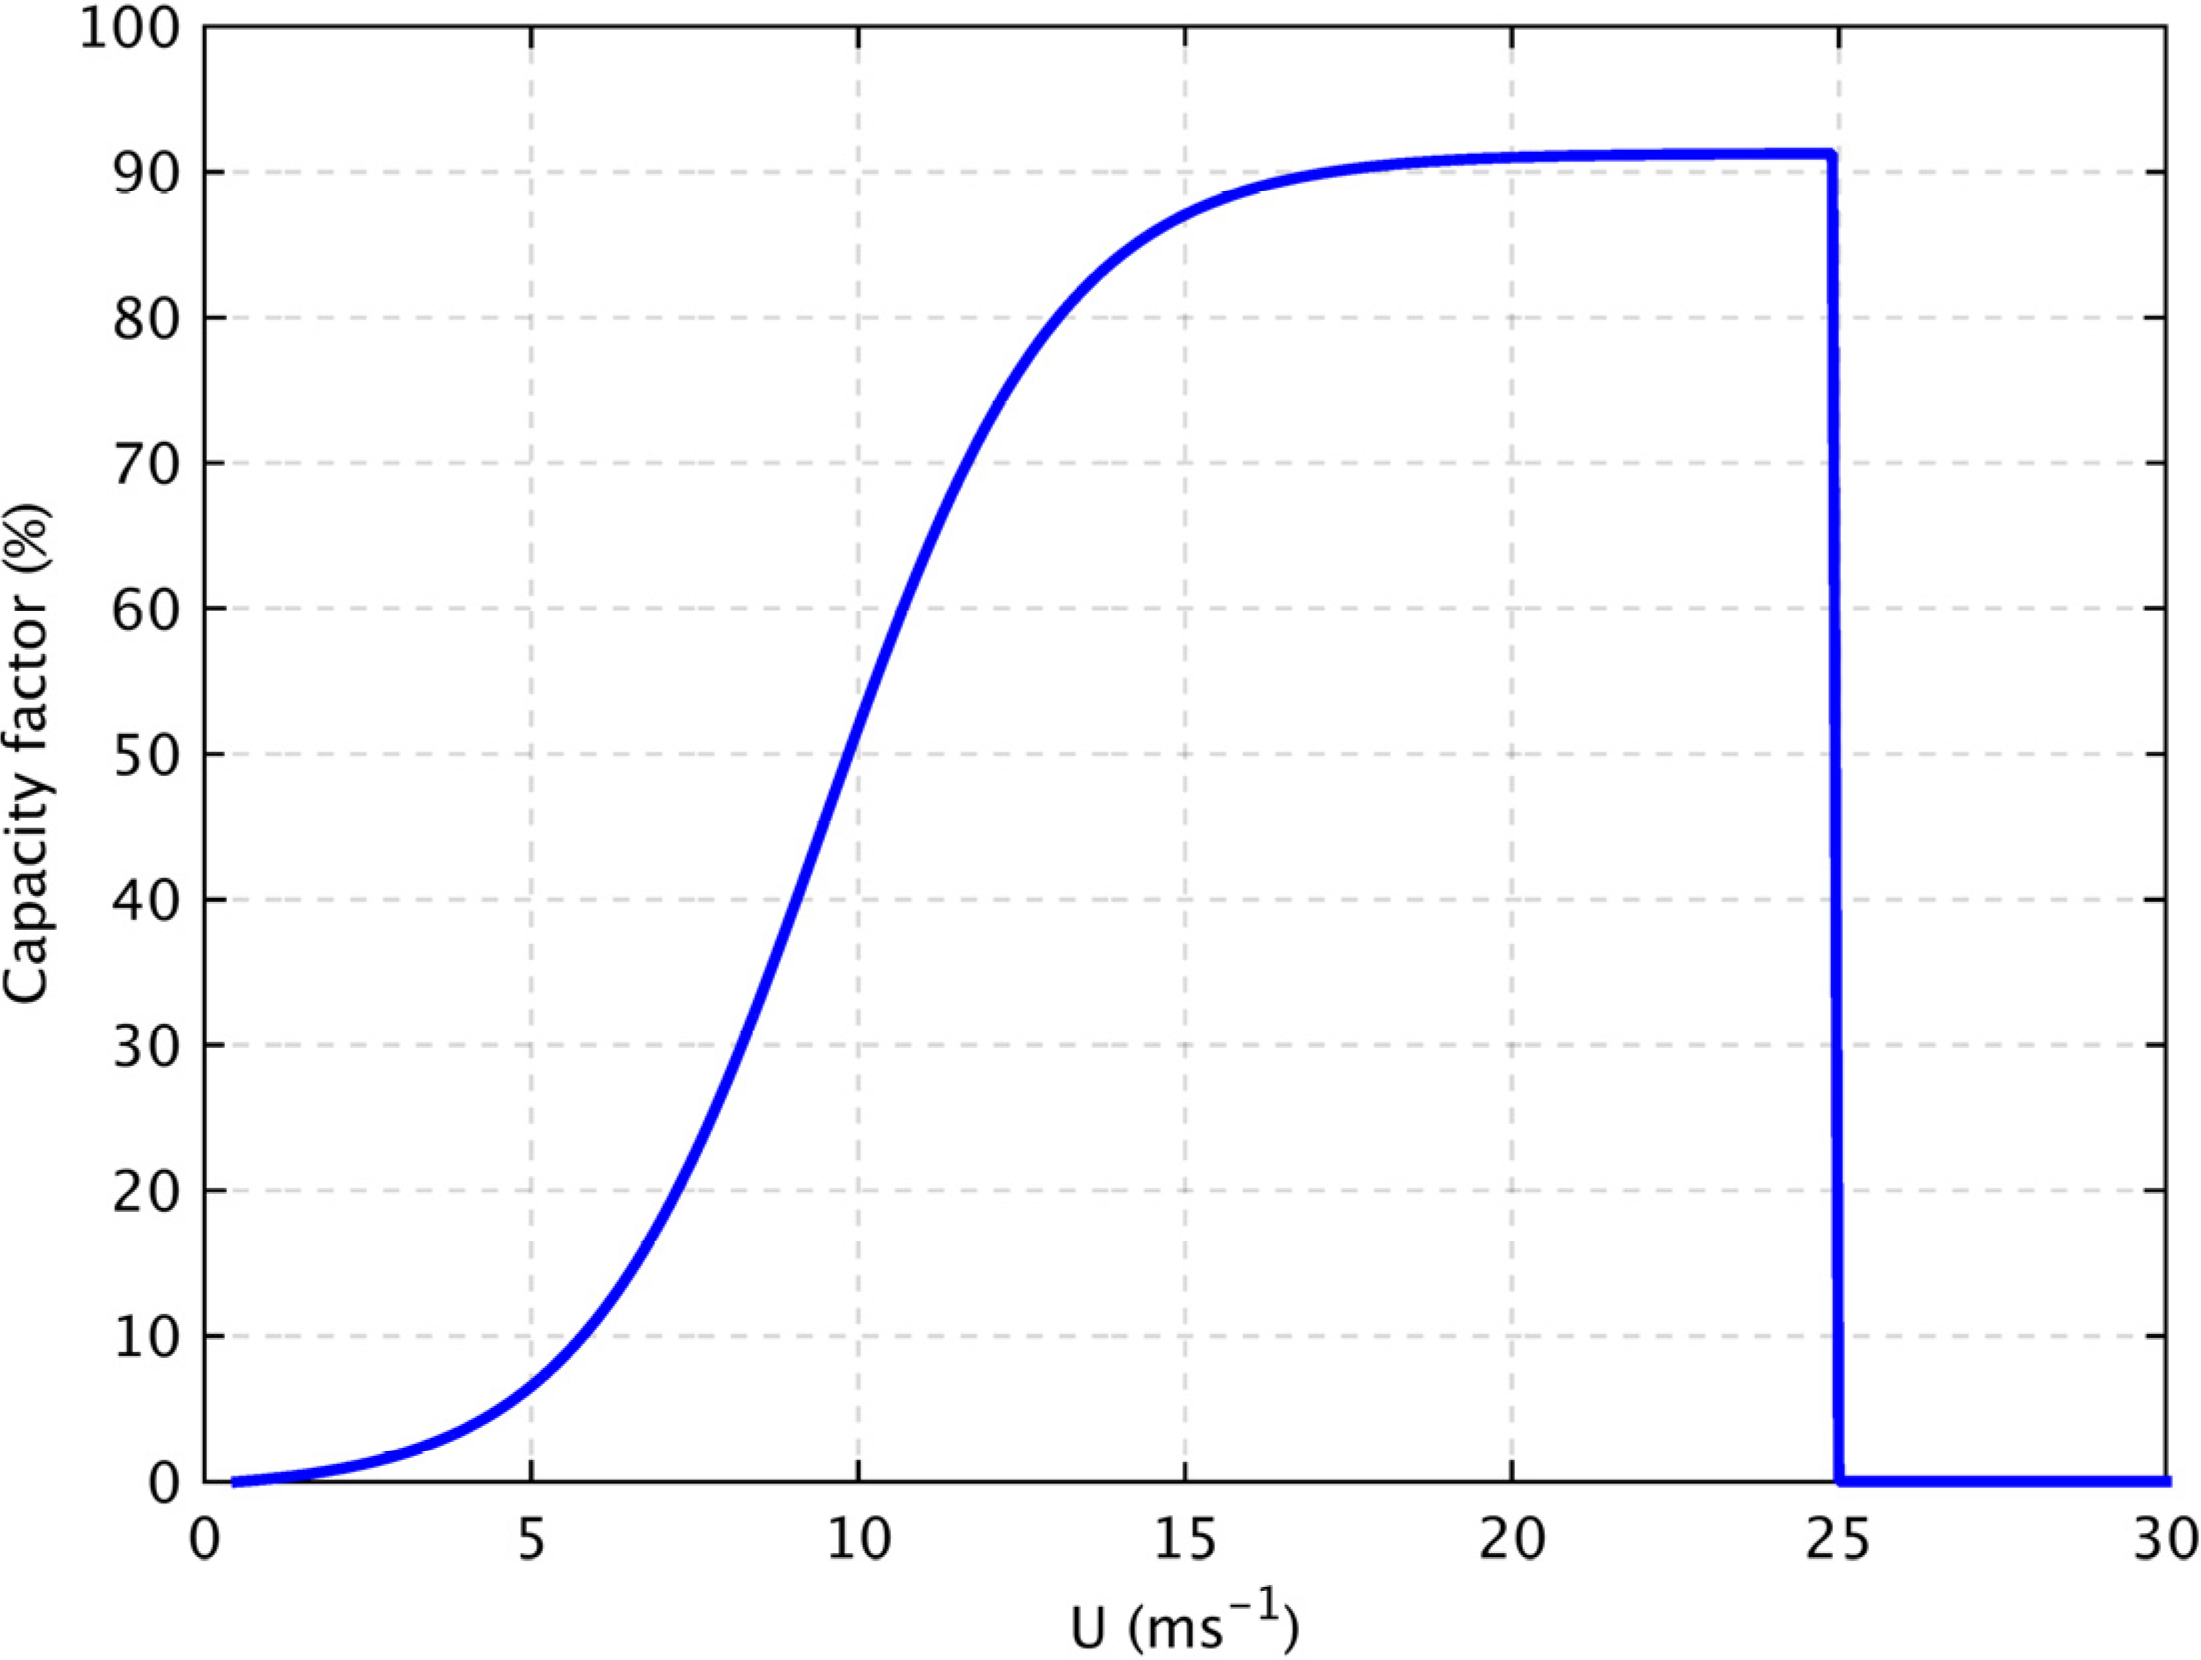
During some high wind events, a lot of wind farms in the current distribution operate at or just below their rated power, where a change in wind speed induces only a small change in power output (
Figure 1). For the future distribution, a lot of wind farms are located offshore and thus experience higher wind speeds. In such cases, an increase in wind speed can lead to very large power swings as large offshore farms cut-out (
Figure 1). This suggests that in the current scenario, cut-out events rarely contribute to the highest national ramping events, but with the move offshore, the cut-out events become more prominent and can contribute to the highest national ramps. These events are however very rare and of similar magnitude to moderate wind speed events (
UGB = 7.5–12.5 ms
−1). Further analysis has shown that for both distributions and all time windows, over 80% of these events occur in the winter months (December to February) and none occur in the summer months (June to August).
Figure 12.
The frequency of ramping events as a function of the magnitude in the ramp (expressed as a change in GB-aggregated capacity factor) and the GB capacity weighted mean wind speed. The analysis has been completed for three time windows twin = 3 h, twin = 6 h and twin = 12 h for the current (a–c) and future (d–f) wind farm distributions. The individual points show the full dataset, while the contours detail the density of the points in wind speed bins of 0.25 ms−1 and ΔCF of 1% (above 100 occurrences).
