
Article

The Role of Country-Level Governance in the Renewable Energy–Carbon Emissions Relationship: Evidence from RECAI-Selected Countries

by
Faozi A. Almaqtari
1,*,
Najib H. S. Farhan
2,
Abdulhadi Ibrahim
1,*,
Amal Yamani
3 and
Khalid Hamad Alturki
4
1
Department of Accounting and Finance, College of Business Administration, A’Sharqiyah University, Ibra 400, Oman
2
Department of Accounting, Faculty of Business Administration Studies, Arab Open University, Riyadh 11681, Saudi Arabia
3
Department of Accounting, Faculty of Economics and Administration, King Abdulaziz University, Jeddah 21589, Saudi Arabia
4
Department of Accounting, College of Business and Economics, Qassim University, Buraidah 51452, Saudi Arabia
*
Authors to whom correspondence should be addressed.
Resources 2026, 15(7), 92; https://doi.org/10.3390/resources15070092
Submission received: 14 April 2026 / Revised: 29 June 2026 / Accepted: 7 July 2026 / Published: 13 July 2026

Abstract

This study examines the relationship between renewable energy consumption (REC) and carbon dioxide (CO2) emissions and investigates the moderating role of country-level governance in 39 Renewable Energy Country Attractiveness Index (RECAI) economies over the 1996–2020 period. Drawing on institutional and environmental governance theories, this study evaluates whether governance strengthens the environmental benefits of renewable-energy consumption. Unlike previous studies that primarily focus on aggregate governance measures, this study separately examines six governance dimensions: control of corruption, political stability, rule of law, government effectiveness, regulatory quality, and voice and accountability. Using panel data from the World Bank, the analysis employs fixed-effects estimation and validates the findings through robust regression, the generalized method of moments (GMM), and panel-corrected standard error (PCSE) approaches. The results indicate that renewable energy consumption significantly reduces both CO2 emissions per capita and total CO2 emissions in the long run. The findings further show that governance significantly moderates the renewable energy–CO2 emissions relationship, with stronger governance enhancing the emission-reducing effect of renewable energy consumption. Governance mitigates the environmental impacts associated with urbanization and industrialization, highlighting the importance of institutional quality in managing the structural drivers of emissions. The robustness analyses confirm the consistency of the main results across the alternative estimation techniques. This study contributes to the literature by providing evidence of the distinct roles of individual governance dimensions in shaping environmental outcomes in economies actively engaged in renewable energy development. These findings suggest that renewable energy expansion and governance reforms should be pursued simultaneously to achieve more effective carbon emission reduction strategies.

1. Introduction

Climate change has gained immense popularity over the past few decades. Climate change refers to long-term alterations in weather, temperatures, and other atmospheric conditions. Currently, the world is experiencing the unavoidable effects of climate change, such as rising sea levels, uncertain weather conditions, coastal flooding, heatwaves, and bushfires [1]. Prominent climate change is primarily caused by greenhouse gas (GHG) emissions, including several poisonous gases such as carbon dioxide (CO2), methane (CH4), and nitrogen (NOx) [2]; the concentration of CO2 is larger than that of other poisonous gases in GHG emissions. Global GHG emissions reached a record high of 57.1 gigatons of CO2 equivalent (GtCO2e) in 2023, marking a 1.3% increase (0.7 GtCO2e) compared to the previous year [3]. Fossil fuels are the leading drivers of global climate change and are responsible for over 75% of global GHG emissions and nearly 90% of CO2 emissions [3]. Reducing CO2 emissions is essential for achieving the climate targets set in the Paris Agreement. GHGs have profound effects on both the environment and human health. To address these challenges, international frameworks such as the Kyoto Protocol (established in 1997) and the Paris Agreement (adopted in 2015) have been developed to mitigate GHG emissions and protect environmental and public health [4].
Governance plays a significant role in reducing CO2 emissions [5]. Consequently, the government and decision-makers can propose measures that encourage the adoption of RE sources for energy consumption, thereby reducing the need for environmental mitigation [6]. According to the BP energy outlook, by 2050, the proportion of fossil fuels in primary energy will have decreased from approximately 80% in 2019 to −55–20% globally, and the proportion of RE in primary energy will have grown rapidly from around 10% in 2019 to between 35 and 65% by 2050, which will compensate for the reduction in NRE and control its adverse impact on the environment [7]. Previous research has extensively highlighted the dual role of RE consumption (REC) in addressing environmental concerns. Several studies emphasize that RE not only reduces CO2 emissions but also serves as a sustainable pathway for economic growth without causing harm to the environment [8,9,10,11].
The reduction in dependence on fossil fuels cannot be achieved solely by increasing the number of renewable energy sources [10,11]. Many factors can either strengthen or weaken the association between REC and CO2 emissions. Effective governance is one of the factors that can enhance the relationship between REC and CO2 emissions [2]. The current scholarly discourse and academic debate on environmental sustainability have moved away from traditional policy definitions to a more dynamic empirical investigation of the relationship between renewable energy and CO2 emissions and the important, though complex, moderating effect of country-level governance [10,11,12,13]. The latest studies from the past three years (2024 to 2026) highlight a strong long-term balance in which the transition towards renewable energy is a key driver in reducing carbon footprints in various economic sectors, including the BRICS countries [14,15], as well as in Asia-Pacific countries (APAC) [13]. However, the effectiveness of this transition has increasingly been theorized to depend upon the notion of ‘institutional quality,’ which is a multi-dimensional concept that includes regulatory effectiveness, transparency, and policy stability [16].
Meanwhile, some recent empirical studies provide evidence of a persistent “synergy gap” [17], while other studies with high impact show that strong governance structures can greatly enhance the decarbonization potential of green innovations and renewable adoption [13,18]. Specifically, some findings indicate that in some emerging contexts, the relationship between renewable energy and the environment is not well moderated by the intervention of institutions, which means there is insufficient synergy between existing institutional frameworks and the green technological transition [17]. The inconsistencies suggest that the shift towards carbon neutrality is not just a simple replacement of energy sources, but is rooted in “institutional forces” that reduce policy uncertainty and help promote green growth [16,19]. Other emerging themes, including the relationship between green technology innovation, environmental policy stringency, and the goal of net zero, further emphasize the need to match governance and the goals of Sustainable Development (SDGs 7 and 13) [16,19]. Despite these developments, there is still a great deal of scholarly discussion about the role of governance as an essential catalyst or as a parallel driver of environmental quality [17,18].
Moreover, researchers [20,21] have concentrated on the role of governance in mitigating CO2 emissions and have shown that good governance can effectively control CO2 emissions in the environment. Simionescu et al. [22] showed that different governance indicators, such as regulatory quality, control of corruption, and the rule of law, play significant roles in minimizing environmental deterioration, in contrast to “voice and accountability, political stability, and government effectiveness,” which do not impact environmental pollution. This theoretical paradox requires a more micro-level study of the mediating role of particular aspects of governance in enhancing the effectiveness of renewable energy use. To our knowledge, no study has estimated the interaction between each governance indicator—voice and accountability (VA), rule of law (RL), regulatory quality (RQ), governance effectiveness (GE), control of corruption (CC), political stability (PS)—and all of these explanatory variables (REC, fossil fuel energy consumption, gross domestic product (GDP), urbanization, and industrialization). Therefore, this study aims to fill this gap by examining the institutional channels for enabling the realization of carbon neutrality in measurable terms based on renewable potential.
Considering the aforementioned research gap in the literature, this study’s research objectives are as follows. First, we analyze the relationship between REC and CO2 emissions in 39 countries. Second, we examined the moderating effect of governance on this relationship. Additionally, we aim to provide valuable insights to policymakers to assist them in understanding the moderating role of governance and aid in developing policies to control the adverse impact of global CO2 emissions.
This study contributes to the literature in several ways. First, although previous studies have extensively examined the relationship between renewable energy consumption, governance, and environmental quality, most existing research treats governance either as a composite index or investigates its moderating role only in the renewable energy–environment nexus. Along the same lines, [23] estimated the interaction of governance indicators with REC. Consequently, little is known about how the individual dimensions of governance influence the effectiveness of other major determinants of CO2 emissions. To address this gap, the present study separately examines six governance dimensions—voice and accountability, political stability, government effectiveness, regulatory quality, rule of law, and control of corruption—and evaluates their moderating effects on the impact of renewable energy and fossil fuel consumption, economic growth, urbanization, and industrialization on CO2 emissions. This approach provides a nuanced understanding of the specific institutional channels through which governance shapes environmental outcomes.
Second, unlike prior studies that focus exclusively on whether governance strengthens the environmental benefits of renewable energy, this study develops a broader institutional perspective by investigating whether governance conditions the environmental impact of multiple economic and structural drivers of carbon emissions. This study identifies which governance dimensions are most effective in enhancing environmental sustainability and mitigating the adverse effects of economic development activities.
Third, this study introduces a distinctive sample selection strategy based on the Renewable Energy Country Attractiveness Index (RECAI). Rather than relying on geographically defined or randomly selected country groups, the analysis focuses on 39 countries identified by RECAI as the most attractive destinations for renewable energy investment and development. These countries account for a substantial share of global renewable energy capacity, investment flows, and clean energy deployment. Examining this strategically selected group enables the study to assess whether governance quality enhances the environmental effectiveness of renewable energy in economies that are actively leading the global energy transition. This provides evidence that is particularly relevant to policymakers seeking to accelerate decarbonization through renewable energy expansion.
Fourth, this study employs two complementary measures of carbon emissions, namely, CO2 emissions per capita and total CO2 emissions in kilotons, to capture both individual-level and aggregate environmental impacts. Finally, the robustness of the findings is verified using multiple estimation techniques, including fixed effects, robust regression, generalized method of moments (GMM), and panel-corrected standard errors (PCSEs), ensuring the reliability and consistency of the empirical results.
The remainder of this paper is organized as follows. Section 2 discusses the reviewed literature, followed by Section 3, which discusses the theoretical framework, data and methods. Section 4 presents the data analysis and its findings, along with the conclusion. The potential policy implications are highlighted in Section 5.

2. Literature Review

2.1. Theoretical Underpinning

Drawing lessons from Institutional Theory [24], the Environmental Kuznets Curve perspective, and the energy transition literature, this study explains the relationship between structural drivers and the consumption of renewable energy at the country level, while considering the role of governance conditions.
According to Institutional Theory, focusing on the quality of institutional frameworks that influence policy formulation, implementation, and enforcement, in addition to structural conditions, shapes economic and environmental outcomes [25]. Furthermore, institutional quality, such as governance effectiveness, regulatory quality, and rule of law, has a significant impact on environmental performance and energy transition [24,26]. Policy and regulatory support are crucial in facilitating policy implementation and mitigating institutional inefficiencies, which in turn leads to enhanced renewable energy penetration, especially when good governance frameworks are well established [16,18]. In this sense, governance is a contextual moderator that determines a country’s capacity to respond to environmental challenges and economic opportunities [27].
The Environmental Kuznets Curve provides a conceptual framework suggesting that the relationship between economic development and environmental degradation may evolve over different stages of development [28]. In the early stages of development, environmental degradation may increase with economic expansion, whereas higher income levels may eventually facilitate environmental improvements through technological progress, structural transformation, and stronger environmental regulations [19,20,24]. In the present study, the EKC is discussed only as a theoretical perspective to motivate the interaction between economic development, institutional quality, and environmental sustainability. Since the empirical model does not include a nonlinear income specification (e.g., GDP squared), the study does not seek to formally test the EKC hypothesis.
The literature on energy transition and policy implementation also shows that the benefits of structural drivers such as urbanization or industrialization are not necessarily associated with higher absolute use of renewables, but depend on the capacity of institutions and the effectiveness of policies [20]. Good governance and infrastructure planning can either strengthen or facilitate fossil fuel dependency or sustainable energy systems, depending on the nature of urbanization [29,30]. Likewise, industrialization can drive the uptake of clean technologies with robust governance structures and policies [21]. Good governance means that energy needs from urban and industrial growth are met using sustainable energy sources instead of carbon-emitting energy sources [24].
This perspective is extended, and governance is understood as a conditioning factor that influences the intensity and direction of the links between emissions, GDP, urbanization, industrialization, and renewable energy consumption [31,32]. High-quality governance improves the positive effects of environmental pressure and economic capacity on renewable energy adoption by boosting policy responsiveness, strengthening regulatory enforcement, and minimizing inefficiencies [29,31]. However, weak governance can be a challenge for shifting to renewable energy because of the effect of policies and resource allocation [24]. Governance is a crucial moderating factor between structural and economic parameters and sustainable energy outcomes [24,27].
Based on the theoretical perspectives discussed above, an empirical model was constructed to capture both the direct and conditional determinants of carbon emissions. Renewable energy consumption (REC) is expected to reduce CO2 emissions because it substitutes fossil-fuel-based energy sources and promotes cleaner production processes. In contrast, fossil fuel consumption is expected to increase CO2 emissions because of its direct contribution to greenhouse gas generation. The Environmental Kuznets Curve (EKC) perspective suggests that economic growth may initially increase environmental degradation through higher production and energy demand, although improved institutional quality may eventually facilitate cleaner technologies and more sustainable growth patterns. Similarly, urbanization and industrialization can increase emissions through expanded economic activities and energy consumption; however, their environmental effects can be mitigated when supported by effective governance, environmental regulations, and sustainable infrastructure planning.
Institutional Theory further suggests that governance quality influences not only environmental outcomes directly but also the effectiveness of economic and energy-related policies. Consequently, governance indicators were incorporated as independent and moderating variables. Strong governance, reflected through effective institutions, regulatory quality, rule of law, political stability, control of corruption, and public accountability, is expected to strengthen the emission-reducing effects of renewable energy consumption while simultaneously weakening the adverse environmental impacts of fossil fuel consumption, economic growth, urbanization and industrialization. Therefore, the interaction terms included in the empirical model were designed to capture how governance conditions the relationship between these structural drivers and carbon emissions.

2.2. Renewable Energy Consumption (REC) and CO2 Emission Linkage

The relationship between renewable energy consumption (REC) and CO2 emissions has attracted considerable scholarly attention; however, empirical evidence remains inconclusive. A substantial body of literature reports a negative relationship between REC and CO2 emissions, suggesting that increased renewable energy adoption contributes to environmental sustainability by reducing dependence on fossil fuels and lowering greenhouse gas emissions [33,34,35,36]. Recent studies further support this view by demonstrating that renewable energy deployment reduces carbon intensity by substituting conventional energy sources and promoting cleaner production systems. For example, renewable energy generation from solar, wind, hydropower, and geothermal sources has been shown to significantly reduce national carbon emissions, while the substitution effect of renewable energy reduces reliance on carbon-intensive fuels and improves the environmental quality.
However, some studies have reported conflicting findings. Saidi and Omri [10] found no long-term relationship between renewable energy consumption and CO2 emissions, while other studies suggest that the impact of renewable energy may vary depending on economic conditions, institutional environments, and stages of energy transition [10,37,38]. Moreover, although renewable energy technologies generate substantially lower emissions during operation, their environmental effects are not entirely emission-free because emissions may arise during the manufacturing, installation, maintenance, and disposal stages. These mixed findings suggest that the environmental effectiveness of renewable energy may depend on contextual factors beyond energy consumption.
Renewable energy is widely recognized as an effective mechanism for mitigating carbon emissions and improving environmental quality. According to Erkut [39], renewable energy represents an innovative and environmentally friendly technological solution that contributes to reducing carbon emissions and enhances environmental sustainability. Empirical evidence from both EU and non-EU member countries within the Union for the Mediterranean reveals similar outcomes regarding the impact of renewable energy consumption on carbon emissions. Specifically, renewable energy utilization exhibited a significant relationship with carbon emissions across both groups, suggesting that the adoption of renewable energy technologies is no longer exclusive to developed European economies but has become increasingly accessible beyond the EU. Furthermore, the magnitude of the influence of renewable energy on economic growth remains comparable across these regions.
Similarly, Dong et al. [40] argued that renewable energy exerts a scale effect on carbon emission efficiency. Their findings indicate that the impact of renewable energy development initially constrains carbon emission efficiency but subsequently promotes it as investment levels rise. Although provinces such as Sichuan, Yunnan, and Qinghai reached an optimal range of renewable energy development by 2018, only Sichuan achieved a corresponding optimal level of carbon emission efficiency. This suggests that renewable energy development alone is insufficient to enhance environmental performance and must be complemented by broader institutional, technological, and policy measures to be effective. This study further highlights regional disparities, showing that the eastern region achieved the highest carbon emission efficiency despite having the lowest threshold of renewable energy development, whereas the western region displayed the opposite pattern.
Recent evidence by Kongkuah and Alessa [41] reinforces the environmental benefits of renewable energy by demonstrating that increased renewable energy generation significantly reduces carbon intensity at the national level, even after accounting for demographic characteristics and persistence. Their findings show that both aggregate renewable energy production and specific renewable technologies, including solar, wind, hydropower, and geothermal energy, are negatively associated with carbon emissions. Likewise, Mukhtarov et al. [42] explain this relationship through the substitution effect, whereby renewable energy gradually replaces conventional fossil fuel-based energy sources. As renewable energy consumption increases, dependence on carbon-intensive energy sources declines, leading to lower greenhouse gas emissions and improved environmental outcomes. Despite these benefits, some studies caution against viewing renewable energy as being entirely emission-free. Sobczuk et al. [43] contend that although renewable energy technologies substantially reduce greenhouse gas emissions during their operational phase, they still generate environmental impacts throughout their lifecycle. Life cycle assessments of photovoltaic systems and wind turbines have revealed that emissions occur during the manufacturing, installation, maintenance, storage, and disposal stages. Moreover, renewable energy infrastructure may adversely affect ecosystems, wildlife, and natural habitats, with several long-term ecological consequences that remain insufficiently explored. Therefore, while renewable energy plays a crucial role in carbon mitigation strategies, its overall environmental implications should be evaluated from a comprehensive life cycle perspective.
More recently, Hoa et al. [44] found that REC reduced environmental pollution in Vietnam over time. Bui Minh et al. [11] also conducted an investigation in Vietnam and showed the same result that the REC negatively impacted CO2 emissions in both the short run and long run, and also supported the environmental Kuznets curve (EKC) throughout 2000–2015. Similarly, Khan et al. [6] found that REC can reduce CO2 emissions in Morocco. Cheng et al. [34] investigated how RE and environmental patents affect CO2 emissions in Brazil, Russia, India, China, and South Africa (BRICS) between 2000 and 2013. The findings reveal that an increased RE supply is associated with decreased per capita CO2 emissions. Consequently, considerable uncertainty remains regarding the precise nature of this relationship, highlighting the need for further investigation using more standardized methods and comprehensive datasets to reconcile these differing perspectives. Qyas et al. [45] suggest the most optimized hybrid renewable energy system to be used in mining operations in Western Australia. It combines solar PV, battery storage, and backup generation components and optimizes the energy system with an LSTM-based optimization framework to enhance energy efficiency and reduce energy costs. The findings reveal that the system can contribute approximately 57% of the energy demand, generate substantial cost savings, and save up to 67% of carbon emissions, which can be considered a success rate in integrating renewable energy sources with the advantages of reducing carbon emissions in energy-intensive industries.

2.3. Governance and CO2 Emission Linkage

Governance is increasingly recognized as an important determinant of environmental performance. Existing studies have examined the role of governance using the World Bank’s governance indicators, including voice and accountability, political stability, government effectiveness, regulatory quality, rule of law, and control of corruption [5,46,47]. The underlying argument is that effective governance improves policy implementation, regulatory enforcement, transparency, and accountability, thereby facilitating environmental protection and sustainable development.
Most studies have reported that stronger governance contributes to lower carbon emissions. For example, Gani [48], Sarwar and Alsaggaf [49], Khan et al. [6], and Güney [5] found that governance quality improves environmental performance and contributes to emission reduction. However, the evidence is inconsistent. Simionescu et al. [22] showed that only certain governance dimensions, such as regulatory quality, rule of law, and control of corruption, significantly reduce environmental degradation, whereas other governance indicators have no significant effects. Similarly, Wang et al. [36] reported that governance affects carbon emissions differently across countries and governance dimensions.
These mixed findings suggest that governance is not a homogeneous concept and that different governance dimensions may influence environmental outcomes via distinct channels. Consequently, examining governance indicators separately rather than as a composite measure may provide a more nuanced understanding of their environmental impact.

2.4. Relationship Between Governance, Renewable Energy Consumption, and CO2 Emissions

Recent studies have increasingly recognized governance as a critical factor influencing the effectiveness of renewable energy policies and environmental outcomes [50,51]. Rather than affecting carbon emissions solely through direct channels, governance may also condition the environmental benefits of renewable energy consumption by improving regulatory quality, policy implementation, institutional accountability and investment conditions.
Empirical evidence examining the moderating role of governance in the renewable energy–CO2 emission relationship is limited. Szetela et al. [23] found that renewable energy consumption reduces CO2 emissions more effectively in countries characterized by stronger voice and accountability and rule of law, whereas political stability produces contrasting effects. Similarly, Kousar et al. [2] reported that governance strengthens the environmental benefits of renewable energy consumption. However, other studies suggest that certain governance dimensions, such as government effectiveness, may not always enhance the emission-reducing effect of renewable energy [22]. These findings indicate that different dimensions of governance may influence environmental outcomes through distinct institutional mechanisms.
Despite the growing interest in this topic, several important gaps remain in the literature. First, most studies rely on aggregate governance indices or examine only a limited number of governance dimensions, providing little insight into the specific institutional channels through which governance influences sustainability. Second, empirical evidence on the moderating role of individual governance indicators remains scarce and inconclusive. Third, existing studies have primarily focused on the interaction between governance and renewable energy consumption, while limited attention has been given to how governance affects the environmental effects of other structural determinants of carbon emissions, such as fossil fuel consumption, economic growth, urbanization, and industrialization.
To address these gaps, this study investigates the impact of renewable energy consumption on CO2 emissions and examines whether six individual governance dimensions—control of corruption, political stability, rule of law, government effectiveness, regulatory quality, and voice and accountability—moderate this relationship across 39 Renewable Energy Country Attractiveness Index (RECAI) economies. By focusing on countries actively engaged in renewable energy development and investment, this study provides new evidence of the institutional mechanisms through which governance influences environmental sustainability and carbon emission reduction.

3. Theoretical Framework, Data, and Methods

3.1. Theoretical Framework

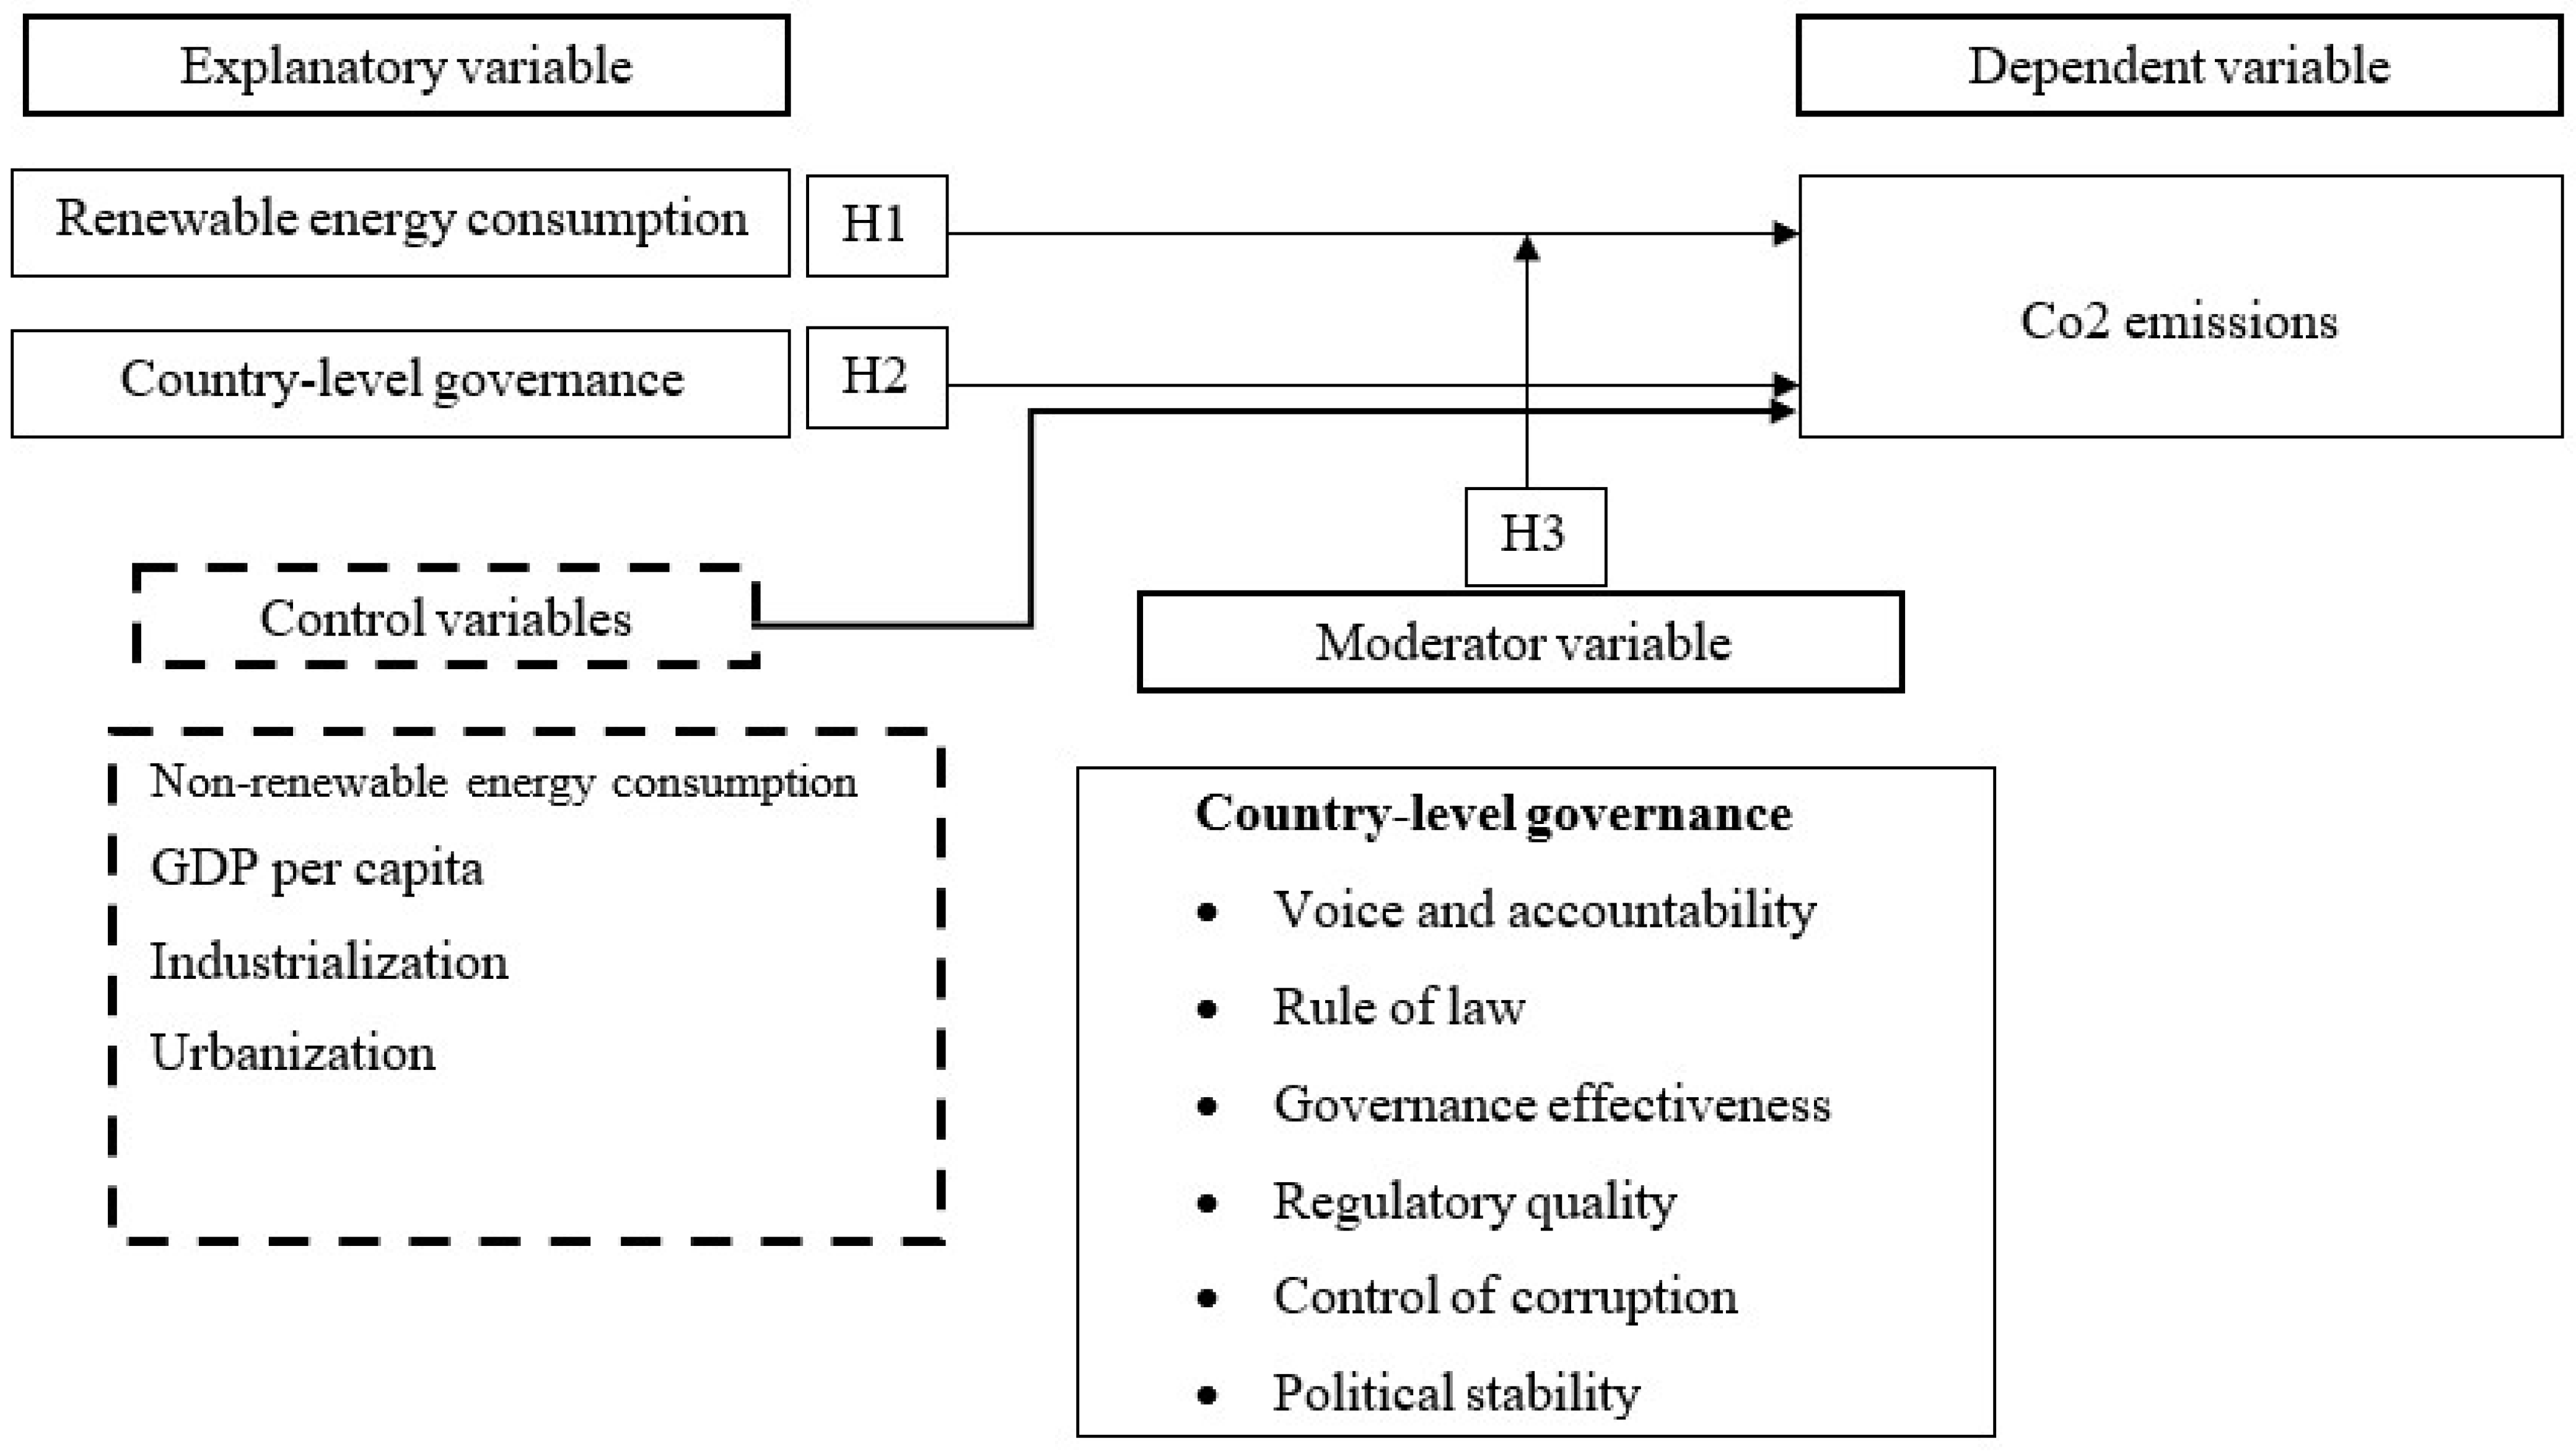
The literature examining the moderating role of governance in the relationship between renewable energy consumption (REC) and CO2 emissions is limited. To address this gap, the present study develops a conceptual framework grounded in core macroeconomic, institutional, and environmental governance theories (Figure 1). These theoretical perspectives collectively explain the direct influence of renewable energy consumption and governance on environmental quality and the conditional role of governance in enhancing the effectiveness of renewable energy deployment. Therefore, the hypotheses developed in this study are derived from both theoretical arguments and empirical evidence presented in the preceding literature review.
The relationship between renewable energy consumption and CO2 emissions can be explained through the lens of core macroeconomic theory [52]. From this perspective, renewable energy production and consumption contribute significantly to mitigating environmental degradation by reducing the emissions of harmful greenhouse gases, including CO2, CH4, and NOx [53,54]. Renewable energy serves as an important macroeconomic factor that reduces dependence on non-renewable energy sources and promotes a transition to a green and sustainable economy [55]. Unlike fossil fuel-based energy systems, renewable energy technologies generate energy with substantially lower carbon emissions, thereby contributing to environmental sustainability while supporting long-term economic growth. As renewable energy consumption increases, reliance on carbon-intensive energy sources declines, leading to lower levels of CO2 emissions. Therefore, renewable energy consumption is expected to negatively affect carbon emissions.
H1. 
Renewable energy consumption decreases CO2 emissions.
Institutional theory provides a theoretical foundation for understanding the relationship between governance and environmental outcomes [56]. This theory argues that formal and informal institutions shape policy formulation, implementation, monitoring, and enforcement, thereby influencing economic, social, and environmental performance. Strong institutional arrangements facilitate the design and enforcement of environmental regulations, improve resource allocation, reduce policy uncertainty, and enhance accountability mechanisms, all of which contribute to improved environmental quality [36,57]. Previous studies have applied institutional theory to explain environmental governance and carbon-mitigation strategies. For example, Andrews-Speed [58] emphasized the importance of institutional arrangements in managing low-carbon energy transitions, whereas Li et al. [59] highlighted the necessity of effective government intervention to reduce carbon emissions. From this perspective, governance dimensions such as government effectiveness, regulatory quality, rule of law, control of corruption, political stability, and voice and accountability can enhance environmental management and facilitate the implementation of policies aimed at reducing carbon emissions. Consequently, countries with stronger governance structures are expected to achieve lower CO2 emissions.
H2. 
Good governance has a significantly negative impact on carbon dioxide emissions.
The moderating role of governance in the relationship between renewable energy consumption and CO2 emissions is supported by environmental governance theory [60,61]. This theory emphasizes that environmental outcomes are not determined solely by technological advancement or energy choices but also by the quality of governance systems responsible for policy implementation and regulatory enforcement. Environmental governance involves the coordinated efforts of governments, businesses, civil society, and citizens to establish environmental standards, formulate regulations, and ensure compliance with sustainability objectives [62]. Effective governance creates an enabling environment for renewable energy development through supportive regulations, policy consistency, institutional transparency, and efficient implementation. Consequently, the environmental benefits of renewable energy consumption are likely to be greater in countries with stronger governance frameworks. Conversely, weak governance may limit the effectiveness of renewable energy policies, reduce investment incentives, and hinder the transition to cleaner energy systems. Therefore, governance is expected to strengthen the emission-reducing effect of renewable energy consumption by improving the institutional conditions necessary for a successful energy transition [63].
Although the six governance indicators capture different institutional dimensions, they are all expected to enhance the effectiveness of renewable energy policies through improved institutional capacity, regulatory quality, accountability, political stability, and policy implementation. Therefore, a common moderation hypothesis is proposed, while allowing empirical analysis to identify differences in the magnitude of the individual governance effects.
H3. 
Governance significantly moderates the relationship between renewable energy consumption and CO2 emissions.
Beyond its moderating influence on renewable energy consumption, governance may also affect the environmental effects of other structural and economic determinants of CO2 emissions. Drawing on Institutional Theory and the Environmental Kuznets Curve perspective, the environmental consequences of economic growth, fossil fuel dependence, urbanization, and industrialization are not solely determined by their direct effects but also by the quality of the institutional arrangements governing economic activities [24,25,28]. Effective governance can strengthen environmental regulations, improve policy implementation, enhance energy efficiency, promote technological innovation, and facilitate the transition toward cleaner production systems [16,18,26]. Consequently, countries with stronger governance structures may be better positioned to mitigate the adverse environmental impacts associated with fossil fuel consumption, rapid urbanization, and industrial expansion while simultaneously directing toward more sustainable pathways [19,20]. In contrast, weak governance may limit the effectiveness of environmental policies, increase regulatory inefficiencies, and exacerbate degradation. Therefore, governance is expected to serve as an important conditioning mechanism that influences the magnitude and direction of the relationships between renewable energy and fossil fuel consumption, economic growth, urbanization, industrialization, and CO2 emissions.

3.2. Data

This study examines the moderating effect of governance on the relationship between renewable energy consumption (REC) and CO2 emissions in 39 countries selected based on the Renewable Energy Country Attractiveness Index (RECAI) developed by Ernst & Young (EY) (London, UK). RECAI is a globally recognized index that evaluates countries according to the attractiveness of their renewable energy investment environment, considering factors such as market size, policy stability, regulatory support, infrastructure readiness, and investment opportunities. The study uses the RECAI edition available at the time of sample selection, and the country sample remains fixed throughout the analysis. The use of RECAI provides an energy-sector-specific framework for identifying economies with relatively favorable conditions for renewable energy investment and deployment.
The selection of RECAI countries is particularly relevant because these economies represent markets with comparatively attractive conditions for renewable energy investment and policy implementation. This characteristic provides an appropriate setting for examining whether governance influences the environmental effectiveness of renewable energy adoption under relatively supportive investment environments. Furthermore, RECAI countries exhibit considerable variations in governance quality, industrial structure, urbanization patterns, and energy systems. While all countries in the sample have demonstrated a commitment to renewable energy development, they differ substantially in their institutional capacities and policy environments. This diversity creates a valuable empirical setting for investigating whether governance enables mechanisms that strengthen the environmental benefits of renewable energy consumption. The presence of both developed and developing economies also allows the analysis to capture a wide range of governance and energy transition experiences. A potential limitation of the RECAI-based sampling approach is that it focuses on countries with relatively favorable renewable energy investment environments, which may introduce sample selection bias. Consequently, the sample should not be interpreted as representing countries with the highest levels of decarbonization or environmental performance, but rather economies that provide comparatively attractive conditions for renewable energy investment and deployment. The objective of this study is therefore not to generalize the findings to all countries globally, but to examine how governance shapes the renewable energy–environment relationship within investment-attractive renewable energy markets.
Nevertheless, the findings should be interpreted within the context of RECAI economies and may not be fully generalizable to countries with limited renewable energy markets, weak institutional frameworks, or low investment attractiveness. Instead, the results provide evidence that is particularly relevant for countries seeking to accelerate renewable energy deployment and achieve carbon reduction objectives through effective governance and institutional support. The data used for this study are balanced panel data from 1996 to 2020, which are available in the selected countries. The time period was selected to allow consistency and comparability with respect to key variables such as renewable energy consumption, governance indicators, and carbon dioxide (CO2) emissions. This long time frame allows for a panel econometric analysis of the energy transition patterns and quality of energy governance in various development contexts. Data on REC, CO2 emissions, GDP, urbanization, and industrialization were collected from the World Development Indicators (WDI) database, and country-level governance was obtained from the Worldwide Governance Indicators (WGI) database. Detailed descriptions of these variables are presented in Table 1.

3.2.1. Predicted Variable

CO2 emissions, which are the primary contributors to GHG emissions, pose a significant hazard to ecosystems [64]. In this study, we used two measures of CO2 emissions as dependent variables to provide a comprehensive analysis: CO2 emissions per capita and CO2 emissions in kilotons [48]. This approach aligns with prior research that employed similar metrics to examine the environmental impact of emissions at both individual and aggregate levels [8,65]. CO2 emissions per capita show the average level of CO2 emissions per person, whereas CO2 emissions in kilotons represent the aggregate level of carbon emissions at the national level.
To provide a comprehensive assessment of environmental sustainability, this study employs two alternative measures of carbon emissions. CO2 emissions per capita capture the average emissions generated per individual and reflect carbon intensity from a population-adjusted perspective, whereas total CO2 emissions (expressed in natural logarithms of kilotons) capture the aggregate environmental impact associated with national economic activity and energy consumption. These measures represent complementary dimensions of environmental pressure and therefore provide additional insight into the environmental effects of renewable energy adoption and institutional quality across countries with different economic and demographic characteristics.

3.2.2. Explanatory Variable

Renewable energy consumption (REC): In our study, REC was represented by the proportion of REC in total energy consumption. Renewable energy (RE) is an alternative energy source that is advantageous from two perspectives: environmental and economic. First, there are numerous sources of RE. Second, RE generation produces fewer carbon emissions [23,45,47].

3.2.3. Moderating Variable

Country-level governance [48,49]: Six governance indicators were used in this study. These are presented as follows:
“Control of corruption” assesses the extent to which public authority is utilized for personal profit, encompassing both minor and major instances of corruption, along with the influence of elites and private interests on the state.
The “effectiveness of governance” encompasses evaluations of public service quality, the competence and impartiality of the civil service, its insulation from political influence, the caliber of policy development and execution, and the government’s trustworthiness in upholding these policies.
“Political stability and the absence of violence/terrorism” refers to the assessment of the probability of encountering political instability or acts of violence, particularly those motivated by political reasons such as terrorism.
The “rule of law” reflects people’s trust in and adherence to societal norms, especially concerning the effectiveness of enforcing contracts, safeguarding property rights, the performance of law enforcement, the judiciary, and the prevalence of criminal activity and violence.
“Voice and Accountability” measures the extent to which a nation’s residents can choose their government, along with assessing the presence of freedom of speech, freedom of assembly, and independent media.
“Regulatory Quality” reflects how well the government is perceived in its capacity to create and enforce effective policies and regulations that facilitate and encourage private sector growth.

3.2.4. Control Variables

  • Non-renewable energy consumption or fossil fuel energy consumption: NRE is derived from non-renewable resources, which are depleted much faster than new ones are created, and it emits large amounts of CO2. NRE was the other explanatory variable in our study. The consumption of NRE significantly increases CO2 emissions [50,66].
  • Economic growth: GDP represents the economic growth of a country [51,52]. Environmental health is significantly affected by economic growth.
  • Industrialization (IND): Industrialization is represented by industrial value added and comprises value added in mining, construction, manufacturing, electricity, gas, and water [52,54,55]. Considering previous studies (e.g., [52,54,55], industrialization was used as a control variable in this study. Researchers have found that industrialization significantly contributes to the increase in CO2, resulting in ecological jeopardy [56,57].
  • Urbanization (URB): Urbanization is represented by the urban population as a percentage of the total population. Abdulqadir [67] demonstrated that the nexus between urbanization and CO2 emissions follows the Kuznets curve hypothesis. Thus, urbanization is a crucial macroeconomic factor for CO2 emissions mitigation. Based on previous research [52,65], urbanization was used as a control variable in this study.

3.3. Methods

This study used econometric methods to analyze the relationship between RE adoption and CO2 emissions, considering country-level governance. This study uses the panel data regression technique to analyze the proposed relationships, both baseline and moderation models. The Baseline Model is the effect of the independent variables on the dependent variable (Direct Effect); however, the Moderation Model is the effect of the interaction of the explanatory variables and the moderating variable on the dependent variable. The fixed effects model was used to isolate the impact of RE adoption on CO2 emissions while accounting for inherent differences among the thirty-nine countries. The effect of renewable energy (RE) adoption on CO2 emissions was estimated using a two-way fixed effects model, taking into account country and year fixed effects to capture time-invariant country-specific effects and common shocks that impact all countries for a particular year. To validate the distinction between fixed and random effects specifications, a Hausman specification test was performed, and the result of the test justified the use of the fixed effects estimator for the data analyzed. To prevent potential multicollinearity issues, all continuous variables, including interaction terms, were mean-centered. Continuous variables were also winsorized at the 1st and 99th percentiles to minimize the effect of extreme values. A number of diagnostic tests were carried out to validate the validity of the baseline estimates: the Breusch–Pagan test was used to check for heteroskedasticity, the Breusch–Godfrey test was used to test for serial correlation, and the Pesaran CD test was performed to check cross-sectional dependence across the panel units. When these tests suggested the presence of heteroskedasticity, autocorrelation, and/or cross-section dependence, GMM, Panel Corrected Standard Errors (PCSEs), and robust regression were also used as supplementary tests to safeguard the validity of the statistical inference under the above conditions. Fixed effects models were used to account for country-specific time-invariant characteristics [26], and the application of the Generalized Method of Moments alleviates simultaneity and reverse causality issues [25,31]. Furthermore, a robustness test was performed to account for heteroskedasticity and cross-sectional dependence [29]. The similarity of the results obtained from the various estimation methods increases the reliability of the results and confirms the validity of the proposed relationships [68].
A number of robustness checks were performed: robust regression, considering outlier sensitivity; Panel-Corrected Standard Errors (PCSEs), to address the issue of panel heteroskedasticity and contemporaneous correlation; and the Generalized Method of Moments (GMM) estimator to reduce the potential endogeneity problems. The internal instruments used in the GMM specification are lagged values of the explanatory variables, and the validity of the instrument and model is tested using Hansen/Sargan over-identification tests and Arellano–Bond serial correlation tests. Furthermore, diagnostic tests were conducted to check for cross-sectional dependence, heteroskedasticity, autocorrelation, and multicollinearity to ensure the reliability and robustness of the estimated results. Thus, the following models were estimated:
Direct effects:
C O 2 i t = α + β 1 R E C i t + β 2 C C i t + β 3 N R E i t + β 4 G D P + β 5 U R B i t + β 6 I N D i t + ε i t
C O 2 i t = α + β 1 R E C i t + β 2 G E i t + β 3 N R E i t + β 4 G D P + β 5 U R B i t + β 6 I N D i t + ε i t
C O 2 i t = α + β 1 R E C i t + β 2 P S i t + β 3 N R E i t + β 4 G D P + β 5 U R B i t + β 6 I N D i t + ε i t
C O 2 i t = α + β 1 R E C i t + β 2 R L i t + β 3 N R E i t + β 4 G D P + β 5 U R B i t + β 6 I N D i t + ε i t
C O 2 i t = α + β 1 R E C i t + β 2 R Q i t + β 3 N R E i t + β 4 G D P + β 5 U R B i t + β 6 I N D i t + ε i t
C O 2 i t = α + β 1 R E C i t + β 2 V A i t + β 3 N R E i t + β 4 G D P + β 5 U R B i t + β 6 I N D i t + ε i t
Moderating effects:
C O 2 i t = α + β 1 R E C i t + β 2 C C i t + β 3 N R E i t + β 4 G D P + β 5 U R B i t + β 6 I N D i t + β 7 C C R E C i t + β 8 C C N R E i t + β 9 C C G D P i t + β 10 C C U R B i t + β 11 C C I N D i t + ε i t
C O 2 i t = α + β 1 R E C i t + β 2 G E i t + β 3 N R E i t + β 4 G D P + β 5 U R B i t + β 6 I N D i t + β 7 G E R E C i t + β 8 G E N R E i t + β 9 G E G D P i t + β 10 G E U R B i t + β 11 G E I N D i t + ε i t
C O 2 i t = α + β 1 R E C i t + β 2 P S i t + β 3 N R E i t + β 4 G D P + β 5 U R B i t + β 6 I N D i t + β 7 P S R E C i t + β 8 P S N R E i t + β 9 P S G D P i t + β 10 P S U R B i t + β 11 P S I N D i t + ε i t
C O 2 i t = α + β 1 R E C i t + β 2 R L i t + β 3 N R E i t + β 4 G D P + β 5 U R B i t + β 6 I N D i t + β 7 R L R E C i t + β 8 R L N R E i t + β 9 R L G D P i t + β 10 R L U R B i t + β 11 R L I N D i t + ε i t
C O 2 i t = α + β 1 R E C i t + β 2 R Q i t + β 3 N R E i t + β 4 G D P + β 5 U R B i t + β 6 I N D i t + β 7 R Q R E C i t + β 8 R Q N R E i t + β 9 R Q G D P i t + β 10 R Q U R B i t + β 11 R Q I N D i t + ε i t
C O 2 i t = α + β 1 R E C i t + β 2 V A i t + β 3 N R E i t + β 4 G D P + β 5 U R B i t + β 6 I N D i t + β 7 V A R E C i t + β 8 V A N R E i t + β 9 V A G D P i t + β 10 V A U R B i t + β 11 V A I N D i t + ε i t
To prevent the severe econometric problems of high correlation between indicators of the Worldwide Governance Indicators and the risk of multicollinearity, all six indicators have not been included in a single regression model [13,17]. All WGI dimensions (Voice and Accountability, Political Stability and Regulatory Quality) have been identified broadly in the latest literature as closely related aspects of a single latent factor of “institutional quality” [14,17]. In a methodological sense, the simultaneous inclusion of these indicators would be an affront to the MV approach of no perfect or near-perfect multicollinearity, which would result in increased standard errors, unpredictable and sometimes counterintuitive signs of coefficients, and reduced statistical power [13,18]. This high variance skews the results from the moderating effect of a governance dimension, making it difficult to statistically infer from the models.
The risk of omitted variable bias is a common problem and is secondary in this case because both indicators can contain redundant institutional information, including both of them together causing a “masking effect” which affects the explanations of the variance [16,17]. Hence, the most relevant empirical studies published between 2024 and 2026 confirm that using the composite index of institutional quality or running separate regressions for every dimension of institutional governance to see whether any particular one moderates the renewable energy–CO2 nexus is the most appropriate empirical approach [13,17,18]. This approach allows for the stability of the model parameters and the assessment of the interactions between specific institutional mechanisms (e.g., corruption control or regulatory effectiveness) and green energy transition goals [13,14]. This approach is fully consistent with the best practice in empirical research as reported in leading journals, where the prevention of the bias caused by multicollinearity is crucial to preserve the validity of the econometric results [13,17,18].
The view that structural and economic variables do not have the same effect on renewable energy consumption across countries is the basis for CLG’s moderating role. The moderating role of CLG is based on the fact that structural and economic factors do not have the same effect on the consumption of renewable energy sources across countries [27,30]. Instead, the success of CO2 pressure influences economic growth, urbanization, and industrialization in terms of promoting renewable energy use, which relies on the quality of institutional and governance structures [24,32]. Effective CLG, such as regulatory quality, government effectiveness, and the rule of law, strengthens the implementation, institutional efficiency, and resource allocation for sustainable energy projects [16,22,24]. Therefore, governance is viewed as a contextual conditioning variable that affects the relationship between explanatory variables and renewable energy use [27,28]. Based on this background, the moderation effects of CLG (“Voice and Accountability, Political Stability and Absence of Violence/Terrorism, Government Effectiveness, Regulatory Quality, Rule of Law, Control of Corruption”) with some country-specific variables (GDP, URB, IND) are introduced.
GDP per capita reflects the scale of the effect of economic activities on environmental stress. It is well known that the quality of governance can be a conditioning factor and can affect the growth process by leading to cleaner production processes or by allowing for more emissions via energy-intensive growth. Therefore, the governance × GDP interaction is a measure of the interaction between the institutional effectiveness and environmental efficiency of the growth process. In the same context, urbanization is a structural transformation process that is closely associated with energy demand, transportation intensity, and land use changes. The relationship between governance and urbanization also shapes the efficiency of urban planning, how it is enforced, and the type of infrastructure built; hence, the extent to which institutional quality reduces or exacerbates the environmental impacts of urbanization. Moreover, industrialization is a major source of energy consumption and emissions. However, its environmental effect is not the same everywhere and is greatly influenced by governance performance in terms of environmental regulation, environmental norms, and industrial upgrading policies. Therefore, the governance × industrialization interaction is theoretically sound because it captures the varying emissions outcomes as a function of institutional setting. Notably, governance × REC and governance × non-renewable energy are the two main parts of the energy transition mechanism in this study, but extra interactions are added to represent the wider macro-structural pathways of governance. This is consistent with existing empirical research in environmental economics, which treats governance as a conditioning variable over a range of structural determinants of emissions, not just those related to energy [13,14,15,16,17,18].
Interaction terms in panel regression models can cause econometric issues such as multicollinearity and endogeneity [28]. To reduce multicollinearity, all variables used in the interaction terms were mean-centered before estimating the model so that the correlation between the main effects and interaction terms did not affect the interpretation of the coefficients [25]. Multicollinearity was also tested using the variance inflation factor to ensure that the VIF value did not exceed the threshold of 10. The value of the variance inflation factor (VIF) was also inspected to ensure that no VIF value exceeded 10 [20,69]. Furthermore, the regression models were modeled separately for each of the CLG indicators to prevent high collinearity between the governance variables, because the six dimensions of governance are conceptually and empirically correlated [24,30,31]. Thus, the estimate of the interaction coefficient is more stable, explainable, and robust when the models are estimated separately for each governance measure to minimize redundancy and overlapping explanatory effects of the measures [24,30].

4. Data Analysis and Findings

This study empirically analyzed the impacts of RE, NRE, GDP, urbanization, and industrialization on CO2 emissions.

4.1. Descriptive Statistics

Table 2 presents the descriptive statistics of the key variables across the dataset of 975 observations. The data showed that the average CO2 emissions in kilotons were approximately 5.29, with a median of 5.31, showing a generally balanced distribution. The average CO2 emissions per capita were 7.15 and a median of 7.11. In terms of country-level governance factors, CC has a mean of 71.01 and a median of 77.40, indicating some variation in governance quality among the sampled countries. Similarly, all other country-level governance variables, including GE, RQ, RL, PS, and VA, have means and medians near the midpoint of their respective scales, indicating moderate levels of governance quality with slightly negative skewness values. Non-REC also had a somewhat wide distribution, with a mean of 78.83 and a median of 82.94. GDP per capita has a mean of 4.14 and median of 4.34, indicating a constant distribution. However, the REC has a mean of 17.09 and a median of 11.41, indicating some variation in RE adoption across the investigated countries. Urbanization has modest means and medians, indicating some variation in urbanization levels across the investigated countries. Finally, the mean value of industrialization is 11.11, with a maximum of 12.74 and a minimum of 9.17.

4.2. Correlation Analysis

Table 3 presents the results of the study variables in the correlation matrix. REC has a strong negative correlation with NRE (−0.78), CO2I (−0.26), and CO2E (−0.41), which is expected, given that countries with higher REC may rely less on fossil fuels and generate lower carbon emissions. NRE had a modest positive correlation with CO2I (0.23) and CO2E (0.28), indicating that greater fossil fuel use is generally related to higher emissions. There is also a negative link with GDP (−0.27), implying that increasing fossil fuel usage may be connected to a decreased GDP per capita. This implies that countries with higher GDP per capita consume less fossil fuel. Industrialization is positively correlated with several other variables, including CO2I (0.83), CO2E (0.35), and GE (0.27), indicating that industrialized countries have higher emissions and more effective governments than non-industrialized countries. URB was positively correlated with CO2E (0.58), GE (0.54), and RL (0.50), implying that higher rates of urbanization are related to these variables. PS was positively correlated with CC (0.46), RQ (0.76), and RL (0.76). Various correlations imply that nations with higher PS scores have higher scores on various governance-related variables. RQ correlates positively with GE (0.93), PS (0.76), and RL (0.92), indicating that countries with higher RQ perform better in these governance-related domains. In most instances, country-level governance (CLG) has a substantial correlation. Although most of the correlation values were greater than 70, we assessed each variable separately to avoid multicollinearity.

4.3. Empirical Findings

4.3.1. Direct Effect Model

Table 4 reports the direct effect estimations for two alternative measures of carbon emissions. Models 1–6 use CO2 emissions per capita (CO2E) as the dependent variable, whereas Models 7–12 employ total CO2 emissions measured in kilotons (CO2I). Across all specifications, the results consistently indicate that renewable energy consumption (REC) reduces carbon emissions, thereby supporting H1.
The REC coefficient is negative and statistically significant in all models. For example, in the per capita emissions models, the coefficient ranges from −0.028 to −0.043, suggesting that an increase in renewable energy consumption is associated with a measurable reduction in carbon emissions. Similar results were observed when total emissions were used as the dependent variable. These findings indicate that expanding renewable energy deployment can meaningfully reduce environmental degradation by substituting carbon-intensive energy sources with cleaner alternatives. The results are consistent with previous studies [21,70,71] but contradict the findings of [72], who reported a positive relationship between renewable energy consumption and carbon emissions. The findings also support the core macroeconomic theory, which argues that renewable energy promotes sustainable economic growth while mitigating environmental damage [53,54].
In contrast, fossil fuel energy consumption (NRE) has a positive and highly significant effect across all specifications. The estimated coefficients range from 0.077 to 0.096 for per capita emissions, indicating that increased dependence on fossil fuels is one of the strongest contributors to environmental degradation. The magnitude of these coefficients suggests that the environmental costs associated with fossil fuel consumption substantially outweigh the emission-reduction benefits generated by renewable energy consumption. This finding supports previous studies [33,73,74] that identified fossil fuels as the primary source of carbon emissions.
Urbanization and industrialization have also emerged as important determinants of environmental deterioration. Industrialization displays the largest coefficient among the explanatory variables, ranging from 1.532 to 2.175 in the per capita emission models. This finding suggests that industrial expansion remains a dominant driver of carbon emissions, reflecting the continued reliance of industrial activity on energy-intensive production processes. Similarly, urbanization is positively associated with per capita carbon emissions, indicating that rapid urban growth increases energy demand, transportation requirements, and infrastructure development, all of which contribute to environmental pressures. These results are consistent with the findings of [75,76], although they contrast with the evidence reported by [77].
Economic growth (GDP) is positively associated with carbon emissions. The positive and statistically significant coefficients indicate that economic expansion in the sampled countries is accompanied by increased energy consumption and environmental pressure. The magnitude of the coefficients suggests that economic growth remains an important source of carbon emissions, highlighting the challenge of achieving economic development while pursuing environmental sustainability. These findings support earlier studies [73,75] and are broadly consistent with the Environmental Kuznets Curve literature in the early stages of economic development.
Governance indicators produce mixed results depending on the measure of carbon emissions employed. For the per capita emission models, governance indicators such as control of corruption (CC), political stability (PS), rule of law (RL), government effectiveness (GE), regulatory quality (RQ), and voice and accountability (VA) are positively associated with CO2 emissions. However, when total carbon emissions are considered, the governance indicators exhibit negative and statistically significant coefficients. This suggests that the direct environmental effect of governance may depend on how it is measured. While stronger governance may be associated with greater economic activity and energy use at the individual level, it appears to contribute to lower aggregate emissions through improved policy implementation, regulatory enforcement and environmental management. These findings partially support institutional theory [56] and are broadly consistent with the argument that effective governance enhances environmental performance [57,59]. Overall, the explanatory power of the models was relatively high. The adjusted R2 values ranged from 0.443 to 0.563 for the per capita emission models and from 0.847 to 0.863 for the total emission models, indicating that the selected explanatory variables accounted for a substantial proportion of the variation in carbon emissions. The highly significant F-statistics and associated p-values further confirm the overall validity and explanatory strength of the estimated models.

4.3.2. The Moderating Effect of Country-Level Governance

Country-level governance is estimated as a moderating variable to account for the extent of the influence of institutional quality on the relationship between structural drivers and renewable energy consumption. The interaction terms are based on the assumption that the impact of CO2 emissions, GDP, urbanization, and industrialization on the adoption of renewable energy differs in various countries depending on the levels of governance effectiveness, regulatory quality, and institutional capacity [24,27,32]. Well-governed and well-organized structures enable policy implementation, resource allocation, and enforcement of renewable energy transitions. Simultaneously, the governance context can negatively affect the capacity of countries to turn economic growth and environmental stress into sustainable energy outcomes [24,30,78].
Table 5 presents the moderating effects of country-level governance on the relationship between renewable energy consumption and carbon emissions. The most important finding is that all interaction terms between renewable energy consumption and governance indicators (CC × REC, PS × REC, RL × REC, GE × REC, RQ × REC, and VA × REC) are negative and statistically significant for both emission measures. This result strongly supports H3 and indicates that governance enhances the environmental benefits of renewable energy consumption. The magnitude and consistency of these interaction effects suggest that renewable energy becomes more effective in reducing carbon emissions when it is supported by stronger institutional frameworks. For example, the REC coefficient remains negative across all models, while the interaction coefficients range from −0.002 to −0.003 in the per capita emission models and remain significantly negative in the total-emission models. These findings imply that improvements in governance quality amplify the emission-reducing effects of renewable energy. In practical terms, renewable energy investments generate greater environmental benefits in countries with stronger regulatory quality, effective governments, lower corruption, greater political stability, stronger rule of law, and higher public accountability.
This finding is consistent with environmental governance theory [60,61], which argues that institutional quality enhances the effectiveness of environmental policies and sustainable energy transition. The results also support previous studies [5,6,20,49,51] while contradicting the findings of [23], who reported positive interaction effects for certain governance dimensions.
The results further reveal that governance influences the environmental consequences of fossil-fuel consumption. Although the direct effect of fossil fuel consumption is generally positive, the interaction effects vary across the specifications. For the total emission models, most governance–fossil fuel interaction terms are negative and statistically significant, suggesting that stronger institutions can partially mitigate the environmental damage associated with fossil fuel dependence. However, the positive interaction coefficients observed in several per capita models indicate that governance alone cannot fully offset the carbon-intensive nature of fossil-fuel consumption. These findings reinforce the view that institutional quality complements but does not replace the need for a transition away from fossil fuels [33,73,74].
The interaction effects of urbanization are predominantly negative and statistically significant. This finding suggests that the environmental costs of urban expansion are lower in countries with stronger governance. Effective institutions can facilitate sustainable urban planning, invest in public transportation, energy-efficient infrastructure, and environmental regulation, thereby reducing the carbon intensity of urban growth. These findings are consistent with environmental governance theory [60] and the empirical evidence reported by [77].
Similarly, the interaction terms between governance indicators and industrialization are consistently negative and highly significant across all specifications. Given that industrialization exhibits one of the largest direct positive effects on carbon emissions, the negative interaction terms imply that governance plays a crucial role in reducing the environmental burden associated with it. Strong regulatory frameworks, effective enforcement mechanisms, and transparent institutions encourage cleaner production practices and the adoption of environmentally friendly technologies. Therefore, governance can moderate, although not completely eliminate, the emission-generating effects of industrial activity [49,75].
The moderating role of governance in the relationship between economic growth and carbon emissions is comparatively weak. Most GDP interaction terms are positive but statistically insignificant, while only a few specifications show significant and positive coefficients. These results indicate that governance does not substantially alter the growth–emission nexus in most cases. Economic expansion continues to generate environmental pressure, even in countries with relatively strong institutions, suggesting that governance alone may be insufficient to decouple economic growth from carbon emissions without complementary investments in renewable energy and low-carbon technologies.
Overall, the findings consistently demonstrate that governance serves as an important institutional mechanism that strengthens the environmental effectiveness of renewable energy consumption and reduces the adverse environmental impacts associated with urbanization and industrialization. The results provide strong empirical support for Institutional Theory [24,27] and Environmental Governance Theory [60,61], highlighting that the success of renewable energy transitions depends not only on energy deployment but also on the quality of governance structures responsible for policy implementation, regulatory enforcement, and resource allocation.

4.3.3. Robustness Analysis

Several robustness and econometric tests of validity were carried out to ensure the reliability and validity of the empirical results. The tests are intended to overcome possible concerns over multicollinearity, endogeneity, and model specification that would make the estimated coefficients unstable. Through alternative estimation techniques and diagnostic checks, this study ensures the consistency of the results and enhances confidence in the empirical results. To reduce possible endogeneity and multicollinearity issues, all variables included in the interaction terms were mean-centered before estimating the model, and VIF diagnostics were performed to ensure acceptable levels of multicollinearity. Furthermore, regression models were computed for each governance indicator to minimize the correlations among country-level variables. Fixed effects analysis was used to control for unobserved heterogeneity, and GMM estimation was used to tackle possible reverse causality to alleviate endogeneity concerns. To ensure the robustness and reliability of the results in the presence of heteroskedasticity and CSD, they also utilized robust regression and PCSE.
To ensure the reliability of the empirical findings, a series of robustness analyses are conducted to address potential econometric concerns. Specifically, Driscoll–Kraay standard errors are employed to account for heteroskedasticity, serial correlation, and cross-sectional dependence; dynamic specifications are estimated to examine potential simultaneity and persistence effects; alternative governance indicators and global shock controls are used to assess the sensitivity of the moderating effects; and heterogeneity analyses based on income groups, legal systems, and the Paris Agreement period are performed to evaluate the stability of the results across different country contexts. Across all specifications, the principal coefficients remain broadly consistent in sign, magnitude, and statistical significance, supporting the robustness of the main conclusions.
(a)
Robust Regression
Table 6 shows the results of the robust regression, which was performed to check whether the data contained influential outliers or whether there was any violation of the regression assumption. The results show links between several determinants and carbon emissions in the 39 countries. REC has a significant negative impact on CO2E and CO2I in all models. Overall, the comparative analysis in Table 5 and Table 6 indicates that the direct effect estimation and robust regression produce nearly identical results, indicating that the data do not contain influential outliers that would significantly affect the parameter estimates in the direct effect model, and there is no issue of violation of the regression assumption. Statistical indicators such as R-squared (r2), adjusted R-squared (r2_a), F-statistic, and p-values also show that the robust regression model is statistically significant.
(b)
GMM Analysis
A generalized method of moments (GMM) estimator is used to ensure that endogeneity and multicollinearity do not significantly affect the results; explanatory variables may be endogenous and modified by omitted factors. The lagged CO2 emission variable as an instrument was significant, indicating that the GMM was valid. The results in Table 7 were re-estimated with the difference Generalized Method of Moments (GMM) developed by Arellano and Bond [79] to mitigate the possible reverse causality between the adoption of RE and the CO2 emissions. The correlation of the dependent variable (lagged CO2 emissions) with the country-specific error term after the panel is first-differenced to remove the fixed effects is the crucial aspect of this dynamic panel specification. As per the standard GMM practice with dynamic panel data, this variable was instrumented with internal instruments, which are the levels of the endogenous regressor with the appropriate lags.
The instrument set validity and the specification of the overall model was examined using the Sargan/Hansen test of over-identifying restrictions, and the results did not reject the null hypothesis of instrument validity. In addition, the Arellano–Bond AR(1) and AR(2) tests were used to ensure that there was no second-order serial correlation in the differenced residuals, and the presence of significant first-order serial correlation (AR(1)) and the absence of second-order serial correlation (AR(2)) showed that the model was correctly specified and the lag structure was suitable.
There may be reverse causality in the data on the relationship between RE adoption and CO2 emissions, where countries with higher emissions or more regulatory or public pressure to reduce emissions will be more motivated to invest in RE infrastructure, and greater RE adoption will also lead to reduction in future emissions. The bi-directional relationship suggests that OLS or static fixed effects estimates may be biased because the explanatory variable of interest is not necessarily exogenous to the outcome. To address this concern, the dynamic difference GMM estimator was used, which involves using lagged values of the endogenous variables as internal instruments and first-differences in the model to remove the possibility of country-specific heterogeneity existing in the model that is unobserved and might otherwise affect the results. The diagnostic tests used in this paper, Sargan/Hansen and Arellano–Bond AR(1)/AR(2) tests, are used jointly to provide more valid evidence regarding the direction and quantification of the RE–emissions relationship, as the dynamic adjustment process between the adoption of RE and emissions can be explicitly modeled. This allows the Sargan/Hansen and Arellano–Bond AR(1)/AR(2) diagnostic tests to be performed jointly, providing more valid evidence regarding the direction and quantification of the RE–emissions relationship, and the dynamic adjustment process between RE adoption and emissions can be explicitly modeled. Overall, as shown in Table 7, our findings hold and show that the results of the GMM are approximately the same as those presented in the direct effect estimation, indicating that there is no issue of endogeneity and multicollinearity. The relationship between REC and CO2 emissions remained significantly negative across all models.

4.3.4. Panel Correction Standard Error

In the previous section, GMM and robust regression were estimated for the direct effect, while for the moderation effect, we used another regression called panel correction standard error (PCSE) to check for multicollinearity, endogeneity, and outliers. Table 8 shows that the results of the interaction effect of governance indicators with explanatory variables on CO2E and CO2I are similar to those of the moderation effect model. On this basis, we can conclude that the PCSE provides consistent results for whatever presented in the moderation effect, indicating that there is no issue of multicollinearity, outliers, and endogeneity.
The signs of some coefficients change between the baseline estimation and PCSE results. This sign variation is due to the fact that the PCSE estimator includes cross-sectional dependence, heteroskedasticity, and contemporaneous correlation between countries that are not fully considered in the baseline models. Therefore, PCSE develops more efficient and conditionally adjusted estimates, and the signs of some of these relationships may change with the correct registration of these interdependencies. This implies that the underlying relationships are error structure-sensitive and may be due to variations in the countries sampled, not model misspecification.

5. Discussion of the Key Findings and Policy Implications

The fact that the consumption of renewable energy has a significant effect on the reduction in emissions is in line with the Environmental Kuznets Curve (EKC) view, which emphasizes that a shift towards cleaner energy is essential to break the link between economic growth and environmental damage [27,28]. Furthermore, the negative relationship between governance indicators and emissions supports the direct link between institutional quality and environmental degradation [25,31]. Specifically, the synergy between the two factors of REC and governance is strong, reinforcing the importance of the structural factor of REC and the need for a strong institutional structure to support the effectiveness of this factor [24,32].
Moreover, the findings are based on environmental governance theory, which states that governance is a key moderator of the interconnections between structural factors (urbanization, industrialization, and fossil fuel consumption) and environmental outcomes [29,30]. According to the findings, strong legal frameworks and political stability are “conditioning factors” that determine whether industrial expansion would automatically result in an increase in emissions [24,26]. This further shows that the impact of environmental policies is not widespread but varies according to the quality of governance institutions [27,30]. Therefore, policymakers should combine renewable energy goals with institutional changes. With improvements in regulatory quality and government effectiveness, an increase in REC is more effective [24,32]. Improvements in the rule of law and political stability must be considered fundamental environmental policies.
These can offer stability in making long-term sustainable energy investments and effective policy implementation [25,26]. Simultaneously, it is crucial for policymakers to have a robust governance framework that can drive the adoption of clean technology and sustainable infrastructure [24,29]. Lastly, because governance plays a moderating role in the impact of fossil fuel use, regulators should focus on clear and quality regulations to reduce the carbon intensity of traditional energy sectors [30,60]. In some contexts, improved governance is linked to increased CO2 emissions per capita in the short-to-medium term as a result of the impacts of economic growth and institutional preparedness [12]. Better governance can also provide better institutional efficiency, improve the investment climate, and increase industrial productivity, which can create an initial energy demand and consequently more fossil fuel use before the actual full transition to a renewable energy system is achieved [14,15]. This is similar to the “scale effect” that can occur in emerging economies, where institutional development fuels economic expansion, which in turn can lead to temporary increases in emissions due to heightened industrialization and ICT infrastructure [13,14].
In the long run, however, governance is expected to have a mitigating impact by enhancing environmental laws, strengthening the institutions that enforce them, and fast-tracking the implementation of green innovations [18,19]. Recent empirical studies indicate that institutional forces play a vital role in ensuring environmental sustainability and contributing to the movement towards carbon neutrality [19,61]. This study focuses on governance as a moderating factor and not a direct cause of emissions, as it is an integral component of the link between renewable energy use and CO2 emissions [13,14]. The modeling approach considers recent findings from the literature, which show that the effects of the renewable transition can be conditional on the quality of national governance, which decreases policy uncertainty and facilitates long-term investments in the green transition.

6. Conclusions

This study examined the impact of renewable energy consumption (REC) and governance on CO2 emissions and investigated whether governance moderates the relationship between renewable energy consumption and environmental outcomes in 39 RECAI countries from 1996 to 2020. To capture the multidimensional nature of institutional quality, six governance indicators, namely, control of corruption, political stability, rule of law, government effectiveness, regulatory quality, and voice and accountability, were examined separately.
The empirical findings indicate that renewable energy consumption significantly reduces both CO2 emissions and total CO2 emissions per capita. This result confirms the important role of renewable energy in supporting environmental sustainability and reducing dependence on carbon-intensive sources. In contrast, fossil fuel consumption, industrialization, and economic growth were found to increase carbon emissions, highlighting the continuing environmental challenges associated with conventional development pathways.
This study further demonstrates that governance plays a critical role in improving environmental outcomes. While the direct effects of governance vary across alternative measures of CO2 emissions, the moderation analysis provides consistent evidence that stronger governance enhances the emission-reducing effect of renewable energy consumption. In particular, the interaction terms between renewable energy consumption and all six governance indicators are negative and statistically significant, suggesting that renewable energy policies are more effective when they are supported by strong institutions, effective regulatory systems, political stability, and transparent governance structures.
The results also reveal that governance moderates the environmental effects of urbanization and industrialization. Countries with stronger governance frameworks appear better able to manage the environmental pressures associated with economic transformation through improved policy implementation, regulatory enforcement, and institutional capacity. These findings support the Institutional Theory and Environmental Governance Theory by demonstrating that environmental improvements depend not only on energy transitions but also on the quality of institutions responsible for implementing and enforcing environmental policies.
Based on these findings, several policy implications have emerged. First, policymakers should prioritize the expansion of renewable energy as a key strategy for reducing carbon emissions. However, the results suggest that renewable energy investments alone may not be sufficient to achieve substantial environmental improvement. Strengthening institutional quality, including regulatory effectiveness, the rule of law, government effectiveness, corruption control, political stability, and public accountability, is equally important for maximizing the environmental benefits of renewable energy deployment.
Second, environmental policies should be designed as integrated policy frameworks that combine renewable-energy promotion with governance reforms. The significant interaction effects indicate that countries with stronger governance systems derive greater environmental benefits from adopting renewable energy. Therefore, efforts to improve institutional quality should be viewed as complementary to investing in renewable energy infrastructure.
Third, the findings relating to urbanization and industrialization suggest that governments should promote sustainable urban planning, energy-efficient infrastructure, and cleaner industrial technologies. Strong governance can help ensure that economic development objectives are pursued alongside environmental sustainability goals, thereby reducing the carbon intensity of growth and structural transformations.
Finally, because governance quality influences the effectiveness of renewable energy policies, policymakers should focus on improving policy consistency, regulatory enforcement, institutional transparency and administrative capacity. Such reforms can create a more supportive environment for renewable energy investments and facilitate progress toward long-term carbon reduction targets.
This study highlights the importance of combining renewable energy use with effective governance to reduce CO2 emissions. Future research could expand this work by examining other types of pollutants, including those from underrepresented regions, to gain a more comprehensive understanding of the relationship between governance and sustainable environmental performance. One of the limitations of this study is that the dataset covers the period from 1996 to 2020, and that data for the most recent years (post-2020) were not always available for all variables and countries when the study was conducted. Therefore, the study does not reflect the latest developments in renewable energy markets, governance reforms, or CO2 emission patterns as of 2025. Future studies should improve and expand the dataset as harmonized post-2020 data become available to provide a more up-to-date examination of the changing relationship between renewable energy use, governance quality, and environmental outcomes. The present study is also limited in that the marginal effects at low, average, and high levels of the moderating variable were not calculated for the main effects of renewable energy consumption, fossil fuel consumption, GDP, urbanization, and industrialization, and their interaction terms with governance, as their calculation is not possible with the standard post-estimation procedure for dynamic panel GMM and PCSE estimators. This analysis could be extended using estimators that allow for this type of post-estimation analysis to report conditional marginal effects throughout the distribution of the moderator.

Author Contributions

Conceptualization: F.A.A., N.H.S.F., A.I., A.Y. and K.H.A. Methodology: F.A.A., N.H.S.F. and A.I. Software: F.A.A. and N.H.S.F. Validation: F.A.A., N.H.S.F., A.I., A.Y. and K.H.A. Formal Analysis: F.A.A. and N.H.S.F. Investigation: F.A.A., N.H.S.F., A.I., A.Y. and K.H.A. Resources: F.A.A., N.H.S.F., A.I., A.Y. and K.H.A. Data Curation: F.A.A. and N.H.S.F. Writing—Original Draft Preparation: F.A.A., N.H.S.F., A.I., A.Y. and K.H.A. Writing—Review & Editing: F.A.A., N.H.S.F., A.I., A.Y. and K.H.A. Supervision: F.A.A. Project Administration: F.A.A. and A.I. Funding Acquisition: F.A.A. and A.I. All authors have read and agreed to the published version of the manuscript.

Funding

This research was funded by the Ministry of Education, Oman, grant number No. (BFP/RGP/EI/24/260).

Data Availability Statement

The data supporting the findings of this study are available from the corresponding author upon reasonable request.

Acknowledgments

During the preparation of this manuscript, the authors used Grammarly 8.937 and Paperpal 2.0 (AI-based language editing tools) for grammar correction, language refinement, and improving clarity. The authors have reviewed and edited the output and take full responsibility for the content of this publication.

Conflicts of Interest

The authors declare no conflicts of interest.

Abbreviations

AbbreviationDescriptionSI Units
Abbreviations
BRICSBrazil, Russia, India, China, and South Africa(dimensionless)
CCControl of CorruptionPercentile rank based on a core provided by the World Bank
CLGCountry-Level GovernancePercentile rank based on a core provided by the World Bank
CO2ECO2 emissions per capitametric ton per capita
CO2ICO2 emissions ktkilotons
FFFossil Fuel Use(dimensionless)
GDPGDP per capitacurrent US$
GEGovernance EffectivenessPercentile rank based on a core provided by the World Bank
GHGsGreenhouse Gases(dimensionless)
GMMGeneralized Method of Moments(dimensionless)
INDIndustrializationannual growth rate
CH4Methanemol·m−3 (or kg·m−3)
NOxNitrogenmol·m−3 (or kg·m−3)
NRENon-Renewable Energy Consumption% of total energy consumption
PCSEPanel Correction Standard Error (dimensionless)
PSPolitical StabilityPercentile rank based on a core provided by the World Bank
RERenewable Energy(dimensionless)
RECRenewable Energy Consumption% of total energy consumption
RECAIRenewable Energy Country Attractiveness Index(dimensionless)
RLRule of LawPercentile rank based on a core provided by the World Bank
RQRegulatory QualityPercentile rank based on a core provided by the World Bank
URBUrbanization % of total population
VAVoice And AccountabilityPercentile rank based on a core provided by the World Bank
Superscripts
*, **, **** p < 0.10, ** p < 0.05, *** p < 0.01-
Subscripts and Greek Symbols
α Intercept (constant term) in the regression model(dimensionless)
β 1 : β 8 Regression coefficients associated with independent variables 1 to 8(dimensionless)
ε Random error term (disturbance term)(dimensionless)
i Cross-sectional unit (firm observation)
t Time period

References

  1. Perkins-Kirkpatrick, S.; Green, D. Extreme heat and climate change. In Heat Exposure and Human Health in the Context of Climate Change; Elsevier: Amsterdam, The Netherlands, 2023; pp. 5–36. [Google Scholar] [CrossRef]
  2. Kousar, S.; Ahmed, F.; García, M.D.L.N.L.; Ashraf, N. Renewable energy consumption, water crises, and environmental degradation with moderating role of governance: Dynamic panel analysis under cross-sectional dependence. Sustainability 2020, 12, 10308. [Google Scholar] [CrossRef]
  3. United Nations Environment Programme. Emissions Gap Repor. 2024. Available online: https://wedocs.unep.org/handle/20.500.11822/46404 (accessed on 11 October 2025).
  4. Lin, B.; Okoye, J.O. Towards renewable energy generation and low greenhouse gas emission in high-income countries: Performance of financial development and governance. Renew. Energy 2023, 215, 118931. [Google Scholar] [CrossRef]
  5. Güney, T. Solar energy, governance and CO2 emissions. Renew. Energy 2022, 184, 791–798. [Google Scholar] [CrossRef]
  6. Khan, Y.; Oubaih, H.; Elgourrami, F.Z. The effect of renewable energy sources on carbon dioxide emissions: Evaluating the role of governance, and ICT in Morocco. Renew. Energy 2022, 190, 752–763. [Google Scholar] [CrossRef]
  7. Dale, S. BP Energy Outlook 2023. 2023. Available online: https://www.bp.com/content/dam/bp/business-sites/en/global/corporate/pdfs/energy-economics/energy-outlook/bp-energy-outlook-2023.pdf (accessed on 11 October 2025).
  8. Bilgili, F.; Koçak, E.; Bulut, Ü. The dynamic impact of renewable energy consumption on CO2 emissions: A revisited Environmental Kuznets Curve approach. In Renewable and Sustainable Energy Reviews; Elsevier: Amsterdam, The Netherlands, 2016; Volume 54, pp. 838–845. [Google Scholar] [CrossRef]
  9. Mekhum, W. Smart cities: Impact of renewable energy consumption, information and communication technologies and E-governance on CO2 emission. J. Secur. Sustain. 2020, 9, 785–795. [Google Scholar] [CrossRef] [PubMed]
  10. Saidi, K.; Omri, A. The Impact of Renewable Energy on Carbon Emissions and Economic Growth in 15 Major Renewable Energy-Consuming Countries. Environ. Res. 2020, 186, 109567. [Google Scholar] [CrossRef] [PubMed]
  11. Bui Minh, T.; Nguyen Ngoc, T.; Bui Van, H. Relationship between carbon emissions, economic growth, renewable energy consumption, foreign direct investment, and urban population in Vietnam. Heliyon 2023, 9, e17544. [Google Scholar] [CrossRef] [PubMed]
  12. Azimi, M.N.; Rahman, M.M.; Maraseni, T. Green strategy and ecological efficiency: A nonlinear machine learning analysis under institutional quality intervention. Qual. Quant. 2025, 60, 3075–3128. [Google Scholar] [CrossRef]
  13. Hossain, A.; Mainuddin, I.; Acharjee, P.; Rahman, M.A. Renewable Energy Consumption, Governance Quality, and CO2 Emissions in Asia-Pacific Region: Evidence from the MMQR Approach. J. Risk Anal. Crisis Response 2025, 15, 20. [Google Scholar] [CrossRef]
  14. Almulhim, A.A.; Inuwa, N.; Chaouachi, M.; Samour, A. Testing the Impact of Renewable Energy and Institutional Quality on Consumption-Based CO2 Emissions: Fresh Insights from MMQR Approach. Sustainability 2025, 17, 704. [Google Scholar] [CrossRef]
  15. Saba, C.S.; Djemo, C.R.T.; Ngepah, N. The crucial roles of ICT, renewable energy sources, industrialization, and institutional quality in achieving environmental sustainability in BRICS. Environ. Sci. Pollut. Res. 2024, 31, 35083–35114. [Google Scholar] [CrossRef] [PubMed]
  16. Ahmad, M.; Rjoub, H.; Hussain, N. Editorial: Institutional forces, energy transition, and climate action: Strategies for achieving sustainable development goals 7 & 13. Front. Environ. Sci. 2024, 12, 1357229. [Google Scholar] [CrossRef]
  17. Nguyen, M.P.; Phan, A. Renewable Energy Transition, Institutional Quality, and CO2 Emissions: Evidence from Next-11 Emerging Economies. Int. J. Energy Econ. Policy 2026, 16, 1160–1170. [Google Scholar] [CrossRef]
  18. Gan, J. New insights into how green innovation, renewable energy, and institutional quality shape environmental sustainability in emerging economies. Front. Environ. Sci. 2025, 13, 1525281. [Google Scholar] [CrossRef]
  19. Tiwari, S.; Sharif, A. Disruptive Solutions for Carbon Neutrality and Sustainable Development: Evidence From CS-ARDL Approach. Sustain. Dev. 2025, 33, 5374–5389. [Google Scholar] [CrossRef]
  20. Danish Baloch, M.A.; Wang, B. Analyzing the role of governance in CO2 emissions mitigation: The BRICS experience. Struct. Change Econ. Dyn. 2019, 51, 119–125. [Google Scholar] [CrossRef]
  21. Mehmood, U. Renewable energy and foreign direct investment: Does the governance matter for CO2 emissions? Application of CS-ARDL. Environ. Sci. Pollut. Res. 2022, 29, 19816–19822. [Google Scholar] [CrossRef] [PubMed]
  22. Simionescu, M.; Strielkowski, W.; Gavurova, B. Could quality of governance influence pollution? Evidence from the revised Environmental Kuznets Curve in Central and Eastern European countries. Energy Rep. 2022, 8, 809–819. [Google Scholar] [CrossRef]
  23. Szetela, B.; Majewska, A.; Jamroz, P.; Djalilov, B.; Salahodjaev, R. Renewable Energy and CO2 Emissions in Top Natural Resource Rents Depending Countries: The Role of Governance. Front. Energy Res. 2022, 10, 872941. [Google Scholar] [CrossRef]
  24. Nchofoung, T.N.; Ojöng, N. Natural resources, renewable energy, and governance: A path towards sustainable development. Sustain. Dev. 2022, 31, 1553–1569. [Google Scholar] [CrossRef]
  25. Rasheed, N.; Khan, D.; Magda, R. The influence of institutional quality on environmental efficiency of energy consumption in BRICS countries. Front. Energy Res. 2022, 10, 943771. [Google Scholar] [CrossRef]
  26. Al-Tal, R.; Al-Tarawneh, A. The impact of government effectiveness and political stability on energy consumption in the selected mena economies. Int. J. Energy Econ. Policy 2021, 11, 1–6. [Google Scholar] [CrossRef]
  27. Sahu, M.; Alahdal, W.M.; Baatwah, S.R.; Elbanna, S. Governance and Green Energy: Unveiling Their Impact on Sustainable Development in OECD Countries. Sustain. Dev. 2025, 33, 7185–7209. [Google Scholar] [CrossRef]
  28. Wang, J.; Jiang, C.; Li, M.; Zhang, S.; Zhang, X. Renewable energy, agriculture, and carbon dioxide emissions nexus: Implications for sustainable development in sub-Saharan African countries. Sustain. Environ. Res. 2023, 33, 31. [Google Scholar] [CrossRef]
  29. Pan, X.M.; Dossou, T.A.M.; Berhe, M.W.; Kambaye, E.N. Towards efforts to promote renewable energy development in Africa: Does governance quality matter? Energy Environ. 2022, 34, 3039–3054. [Google Scholar] [CrossRef]
  30. Weng, F.; Cheng, D.; Zhuang, M.; Lü, X.; Yang, C. The effects of governance quality on renewable and nonrenewable energy consumption: An explainable decision frame. J. Forecast. 2024, 43, 2146–2162. [Google Scholar] [CrossRef]
  31. Asongu, S.; Ndour, C.T. Military Expenditure, Governance, and Environmental Degradation in Sub-Saharan Africa. Environ. Process. 2023, 10, 51. [Google Scholar] [CrossRef]
  32. Mahmood, H.; Tanveer, M.; Furqan, M. Rule of law, corruption control, governance, and economic growth in managing renewable and nonrenewable energy consumption in south asia. Int. J. Environ. Res. Public Health 2021, 18, 10637. [Google Scholar] [CrossRef] [PubMed]
  33. AlNemer, H.A.; Hkiri, B.; Tissaoui, K. Dynamic impact of renewable and non-renewable energy consumption on CO2 emission and economic growth in Saudi Arabia: Fresh evidence from wavelet coherence analysis. Renew. Energy. 2023, 209, 340–356. [Google Scholar] [CrossRef]
  34. Cheng, C.; Ren, X.; Wang, Z.; Yan, C. Heterogeneous impacts of renewable energy and environmental patents on CO2 emission-Evidence from the BRIICS. Sci. Total Environ. 2019, 668, 1328–1338. [Google Scholar] [CrossRef] [PubMed]
  35. Lee, J.W. The contribution of foreign direct investment to clean energy use, carbon emissions and economic growth. Energy Policy 2013, 55, 483–489. [Google Scholar] [CrossRef]
  36. Wang, Q.; Ali, A.; Chen, Y.; Xu, X. An empirical analysis of the impact of renewable and non-renewable energy consumption on economic growth and carbon dioxide emissions: Evidence from seven Northeast Asian countries. Environ. Sci. Pollut. Res. 2023, 30, 75041–75057. [Google Scholar] [CrossRef] [PubMed]
  37. Zaidi, S.A.H.; Danish, H.F.; Mirza, F.M. The role of renewable and non-renewable energy consumption in CO2 emissions: A disaggregate analysis of Pakistan. Environ. Sci. Pollut. Res. 2018, 25, 31616–31629. [Google Scholar] [CrossRef] [PubMed]
  38. Lei, W.; Xie, Y.; Hafeez, M.; Ullah, S. Assessing the dynamic linkage between energy efficiency, renewable energy consumption, and CO2 emissions in China. Environ. Sci. Pollut. Res. 2022, 29, 19540–19552. [Google Scholar] [CrossRef] [PubMed]
  39. Erkut, B. Renewable Energy and Carbon Emissions: New Empirical Evidence from the Union for the Mediterranean. Sustainability 2022, 14, 6921. [Google Scholar] [CrossRef]
  40. Dong, F.; Qin, C.; Zhang, X.; Zhao, X.; Pan, Y.; Gao, Y.; Zhu, J.; Li, Y. Towards Carbon Neutrality: The Impact of Renewable Energy Development on Carbon Emission Efficiency. Int. J. Environ. Res. Public Health 2021, 18, 13284. [Google Scholar] [CrossRef] [PubMed]
  41. Kongkuah, M.; Alessa, N. Renewable Energy and Carbon Intensity: Global Evidence from 184 Countries (2000–2020). Energies 2025, 18, 3236. [Google Scholar] [CrossRef]
  42. Mukhtarov, S.; Aliyev, F.; Aliyev, J.; Ajayi, R. Renewable Energy Consumption and Carbon Emissions: Evidence from an Oil-Rich Economy. Sustainability 2022, 15, 134. [Google Scholar] [CrossRef]
  43. Sobczuk, S.; Jaroń, A.; Mazur, M.; Borucka, A. Renewable Energy and CO2 Emissions: Analysis of the Life Cycle and Impact on the Ecosystem in the Context of Energy Mix Changes. Energies 2025, 18, 3332. [Google Scholar] [CrossRef]
  44. Hoa, P.X.; Xuan, V.N.; Phuong Thu, N.T. Nexus of innovation, renewable consumption, FDI, growth and CO2 emissions: The case of Vietnam. J. Open Innov. Technol. Mark. Complex. 2023, 9, 100100. [Google Scholar] [CrossRef]
  45. Qays, M.O.; Kumar, R.; Ahmed, M.; Lachowicz, S.; Amin, U. Empowering Optimal Operations with Renewable Energy Solutions for Grid Connected Merredin WA Mining Sector. Appl. Sci. 2025, 15, 5516. [Google Scholar] [CrossRef]
  46. Asongu, S.A.; Odhiambo, N.M. Governance, CO2 emissions and inclusive human development in sub-Saharan Africa. Energy Explor. Exploit. 2020, 38, 18–36. [Google Scholar] [CrossRef]
  47. Omri, A.; Kahia, M.; Kahouli, B. Does good governance moderate the financial development-CO2 emissions relationship? Environ. Sci. Pollut. Res. 2021, 28, 47503–47516. [Google Scholar] [CrossRef] [PubMed]
  48. Gani, A. The Relationship Between Good Governance and Carbon Dioxide Emissions: Evidence From Developing Economies. J. Econ. Dev. 2012, 37, 77–93. [Google Scholar] [CrossRef]
  49. Sarwar, S.; Alsaggaf, M.I. The role of governance indicators to minimize the carbon emission: A study of Saudi Arabia. Manag. Environ. Qual. Int. J. 2021, 32, 970–988. [Google Scholar] [CrossRef]
  50. Mehmood, U.; Agyekum, E.; Kotb, H.; Milyani, A.; Azhari, A.; Tariq, S.; Haq, Z.; Ullah, A.; Raza, K.; Velkin, V. Exploring the Role of Communication Technologies, Governance, and Renewable Energy for Ecological Footprints in G11 Countries: Implications for Sustainable Development. Sustainability 2022, 14, 12555. [Google Scholar] [CrossRef]
  51. Ronaghi, M.; Reed, M.; Saghaian, S. The Impact of Economic Factors and Governance on Greenhouse Gas Emission. Environ. Econ. Policy Stud. 2020, 22, 153–172. [Google Scholar] [CrossRef]
  52. Blinder, A.S. Is There a Core of Practical Macroeconomics That We Should All Believe? Am. Econ. Rev. 1997, 87, 240–243. [Google Scholar]
  53. Ahmed, F.; Kousar, S.; Pervaiz, A.; Trinidad-Segovia, J.E.; Del Pilar Casado-Belmonte, M.; Ahmed, W. Role of Green Innovation, Trade and Energy to Promote Green Economic Growth: A Case of South Asian Nations. Environ. Sci. Pollut. Res. 2022, 29, 6871–6885. [Google Scholar] [CrossRef] [PubMed]
  54. Alper, A.; Oguz, O. The Role of Renewable Energy Consumption in Economic Growth: Evidence from Asymmetric Causality. Renew. Sustain. Energy Rev. 2016, 60, 953–959. [Google Scholar] [CrossRef]
  55. Gazi, M.A.I.; Nahiduzzaman, M.; Shaturaev, J.; Dhar, B.K.; Halim, M.A. Dynamic Nexus between Macroeconomic Factors and CO2 Emissions: Evidence from Oil-Producing Countries. Front. Environ. Sci. 2022, 10, 1005814. [Google Scholar] [CrossRef]
  56. North, D.C. Institutions, Institutional Change and Economic Performance; Cambridge University Press: Cambridge, UK, 1990. [Google Scholar] [CrossRef]
  57. Wang, L.; Long, X.; Wu, K.J.; Tseng, M.L.; Cao, Y. Nexus amongst Environmental Regulations, Carbon Emission Intensity and Technological Innovation in China’s Construction Industry. Environ. Sci. Pollut. Res. 2023, 30, 57915–57930. [Google Scholar] [CrossRef] [PubMed]
  58. Andrews-Speed, P. Applying Institutional Theory to the Low-Carbon Energy Transition. Energy Res. Soc. Sci. 2016, 13, 216–225. [Google Scholar] [CrossRef]
  59. Li, J.; Dong, K.; Wang, K.; Dong, X. How Does Natural Resource Dependence Influence Carbon Emissions? The Role of Environmental Regulation. Resour. Policy 2023, 80, 103268. [Google Scholar] [CrossRef]
  60. Durant, R.F.; Fiorino, D.J.; O’Leary, R. Environmental Governance Reconsidered: Challenges, Choices, and Opportunities; MIT Press: Cambridge, MA, USA, 2017. [Google Scholar]
  61. Adeola, F.O. Cross-National Environmental Injustice and Human Rights Issues: A Review of Evidence in the Developing World. Am. Behav. Sci. 2000, 43, 686–706. [Google Scholar] [CrossRef]
  62. Yoshida, F. The Theory of Environment Governance. In Lecture on Environmental Economics; Hokkaido University: Sapporo, Japan, 2012; pp. 75–103. Available online: http://hdl.handle.net/2115/53454 (accessed on 11 October 2025).
  63. Huffman, J.L. The Past and Future of Environmental Law. Envtl. L. 2000, 30, 1. [Google Scholar]
  64. Nan, S.; Huang, J.; Wu, J.; Li, C. Does Globalization Change the Renewable Energy Consumption and CO2 Emissions Nexus for OECD Countries? New Evidence Based on the Nonlinear PSTR Model. Energy Strateg. Rev. 2022, 44, 100995. [Google Scholar] [CrossRef]
  65. Halkos, G.E.; Tzeremes, N.G. Carbon Dioxide Emissions and Governance: A Nonparametric Analysis for the G-20. Energy Econ. 2013, 40, 110–118. [Google Scholar] [CrossRef]
  66. Simionescu, M.; Plopeanu, A.P. Impact of Governance Quality on Pollution in Nuclear Energy Consuming Countries in the European Union. Energy Rep. 2023, 9, 4122–4134. [Google Scholar] [CrossRef]
  67. Abdulqadir, I.A. Urbanization, Renewable Energy, and Carbon Dioxide Emissions: A Pathway to Achieving Sustainable Development Goals (SDGs) in Sub-Saharan Africa. Int. J. Energy Sect. Manag. 2023, 18, 248–270. [Google Scholar] [CrossRef]
  68. Adedoyin, F.F.; Šatrović, E.; Kehinde, M.N. The Anthropogenic Consequences of Energy Consumption in the Presence of Uncertainties and Complexities: Evidence from World Bank Income Clusters. Environ. Sci. Pollut. Res. 2021, 29, 23264–23279. [Google Scholar] [CrossRef] [PubMed]
  69. Sarpong, S.Y.; Bein, M.A. The Relationship between Good Governance and CO2 Emissions in Oil- and Non-Oil-Producing Countries: A Dynamic Panel Study of Sub-Saharan Africa. Environ. Sci. Pollut. Res. 2020, 27, 21986–22003. [Google Scholar] [CrossRef] [PubMed]
  70. Dincă, G.; Bărbuță, M.; Negri, C.; Dincă, D.; Model, L.-S. The Impact of Governance Quality and Educational Level on Environmental Performance. Front. Environ. Sci. 2022, 10, 950683. [Google Scholar] [CrossRef]
  71. Dong, K.; Dong, X.; Jiang, Q. How Renewable Energy Consumption Lowers Global CO2 Emissions? Evidence from Countries with Different Income Levels. World Econ. 2020, 43, 1665–1698. [Google Scholar] [CrossRef]
  72. Bulut, U. The Impacts of Non-Renewable and Renewable Energy on CO2 Emissions in Turkey. Environ. Sci. Pollut. Res. 2017, 24, 15416–15426. [Google Scholar] [CrossRef] [PubMed]
  73. Mohsin, M.; Naseem, S.; Sarfraz, M.; Azam, T. Assessing the Effects of Fuel Energy Consumption, Foreign Direct Investment and GDP on CO2 Emission: New Data Science Evidence from Europe & Central Asia. Fuel 2022, 314, 123098. [Google Scholar] [CrossRef]
  74. Mohsin, M.; Kamran, H.W.; Nawaz, M.A.; Hussain, M.S.; Dahri, A.S. Assessing the Impact of Transition from Nonrenewable to Renewable Energy Consumption on Economic Growth-Environmental Nexus from Developing Asian Economies. J. Environ. Manag. 2021, 284, 111999. [Google Scholar] [CrossRef] [PubMed]
  75. Awan, A.; Abbasi, K.R.; Rej, S.; Bandyopadhyay, A.; Lv, K. The Impact of Renewable Energy, Internet Use and Foreign Direct Investment on Carbon Dioxide Emissions: A Method of Moments Quantile Analysis. Renew. Energy 2022, 189, 454–466. [Google Scholar] [CrossRef]
  76. Li, K.; Lin, B. Impacts of Urbanization and Industrialization on Energy Consumption/CO2 Emissions: Does the Level of Development Matter? In Renewable and Sustainable Energy Reviews; Elsevier: Amsterdam, The Netherlands, 2015; Volume 52, pp. 1107–1122. [Google Scholar] [CrossRef]
  77. Balsalobre-Lorente, D.; Driha, O.M.; Halkos, G.; Mishra, S. Influence of Growth and Urbanization on CO2 Emissions: The Moderating Effect of Foreign Direct Investment and Energy Use in BRICS. Sustain. Dev. 2022, 30, 227–240. [Google Scholar] [CrossRef]
  78. Orazalin, N.; Mahmood, M. Toward Sustainable Development: Board Characteristics, Country Governance Quality, and Environmental Performance. Bus. Strateg. Environ. 2021, 30, 3569–3588. [Google Scholar] [CrossRef]
  79. Arellano, M.; Bond, S. Some Tests of Specification for Panel Data: Monte Carlo Evidence and an Application to Employment Equations. Rev. Econ. Stud. 1991, 58, 277–297. [Google Scholar] [CrossRef]
Figure 1. Conceptual model of the study. Source: By Authors.
Resources 15 00092 g001
Table 1. Data description and definition of selected variables.
AbbreviationsVariablesBrief DescriptionDefinition *
RECRenewable energy consumption% of total energy consumptionRenewable energy consumption represents the proportion of energy derived from renewable sources in the overall final energy usage.
CO2ECO2 emissions per capitametric ton per capita“CO2 emission metric ton per capita” refers to the measurement of carbon dioxide (CO2) emissions in metric tons produced by a specific region, such as a country, divided by its population. This metric provides an average estimation of CO2 emissions per person in that region.
CO2ICO2 emissions ktkilotonsCO2 emissions in kilotons signify the overall quantity of carbon dioxide (CO2) emissions generated by a particular area, often a country, within a defined timeframe, typically a year.
NRENon-renewable energy consumption% of total energy consumptionNon-renewable energy consumption includes the utilization of energy sourced from coal, petroleum, and natural gas.
GDPGDP per capitacurrent US$GDP per capita is calculated by dividing the gross domestic product (GDP) by the population at the year’s midpoint. GDP represents the total value of goods and services produced within a country’s borders by all resident producers, including any taxes on products and excluding any subsidies that are not part of the product’s value.
URBUrbanization% of total populationThe urban population pertains to individuals residing in areas classified as urban by the national statistical authorities.
INDIndustrializationannual growth rateThe annual growth rate for industrial and construction value-added is calculated using a consistent local currency, and the aggregate figures are determined using stable 2015 price levels, represented in U.S. dollars.
CC
GE
PS
RL
RQ
VA
Control of corruption
Governance effectiveness
Political stability
Rule of law
Regulatory quality
Voice and accountability
percentile rankThe percentile rank represents a country’s position relative to all countries included in the overall indicator. A rank of 0 signifies the lowest position, and a rank of 100 signifies the highest.
* Definitions are taken from the world bank database site at https://databank.worldbank.org/ (accessed on 12 October 2025).
Table 2. Summary Statistics.
VariablesMeanMedianMaximumMinimumStd. Dev.SkewnessKurtosisObservations
CO2I_5.295.317.044.140.580.653.32975
CO2E7.157.1120.470.474.360.753.24975
CC71.0177.40100.008.9924.23−0.511.98975
NRE78.8382.94100.0025.1216.44−1.003.39975
GDP4.144.345.022.520.56−0.772.66975
GE74.8780.77100.0011.3519.86−0.482.09975
IND11.1111.0512.749.170.590.083.55975
PS58.3060.48100.004.7627.37−0.201.84975
RQ73.2979.15100.0014.4221.55−0.612.23975
REC17.0911.4162.610.0114.791.123.51975
RL72.4281.73100.0011.4423.51−0.501.93975
URB71.1577.3698.0822.5617.35−0.892.98975
VA68.4179.10100.002.3529.50−0.862.45975
All variables are defined in Table 1 and Abbreviations.
Table 3. Correlation Analysis.
Probability12345678910111213
CO2I (1)1
CO2E (2)0.301.00
***
CC (3)−0.170.501.00
***
NRE (4)0.230.28−0.271.00
*********
GDP (5)0.04−0.01−0.120.041.00
***
GE (6)−0.120.500.95−0.29−0.101.00
***************
IND (7)0.830.350.19−0.04−0.070.271.00
********* *****
PS (8)−0.230.460.76−0.30−0.070.730.061.00
*******************
RQ (9)−0.170.530.93−0.21−0.120.930.200.711.00
************************
REC (10)−0.26−0.410.04−0.780.000.04−0.110.11−0.031.00
****** *** ******
RL (11)−0.180.490.96−0.28−0.120.940.190.760.920.051.00
***************************
URB (12)−0.120.450.590.02−0.150.540.150.340.58−0.250.501.00
********* *********************
VA (13)−0.170.370.86−0.34−0.130.860.180.720.860.120.850.501.00
************************************
All variables are defined in Table 1 and Abbreviations. ***, ** indicate statistical significance at the 1%, 5% levels, respectively.
Table 4. Direct Effect Estimation.
Carbon Emission (Per Capita) ModelsCarbon Emission (Kilotons) Models
Political GovernanceRegulatory GovernancePolitical GovernanceRegulatory Governance
(1)(2)(3)(4)(5)(6)(1)(2)(3)(4)(5)(6)
REC−0.037 ***−0.028 **−0.031 ***−0.029 **−0.029 **−0.043 ***−0.002 ***−0.003 ***−0.003 ***−0.003 ***−0.003 ***−0.002 **
(−3.223)(−2.534)(−2.688)(−2.530)(−2.549)(−3.462)(−2.819)(−2.965)(−3.361)(−3.577)(−3.587)(−2.439)
NRE0.085 ***0.096 ***0.090 ***0.092 ***0.082 ***0.077 ***0.006 ***0.006 ***0.005 ***0.005 ***0.006 ***0.006 ***
(8.183)(9.739)(8.716)(8.787)(7.944)(6.931)(7.762)(7.929)(7.299)(6.837)(7.898)(7.713)
UR0.023 ***0.054 ***0.037 ***0.032 ***0.028 ***0.051 ***−0.005 ***−0.007 ***−0.005 ***−0.005 ***−0.004 ***−0.006 ***
(3.126)(8.763)(5.377)(4.527)(3.789)(6.762)(−8.705)(−14.726)(−10.755)(−9.500)(−8.742)(−11.322)
IN1.792 ***2.175 ***1.801 ***1.532 ***1.782 ***1.896 ***0.874 ***0.853 ***0.874 ***0.892 ***0.877 ***0.870 ***
(10.411)(13.473)(10.594)(8.783)(10.401)(10.363)(71.081)(67.887)(72.323)(73.214)(73.219)(68.913)
GDP5.924 ***5.746 ***6.768 ***5.116 **6.369 ***6.585 ***0.643 ***0.657 ***0.592 ***0.690 ***0.611 ***0.597 ***
(2.749)(2.825)(3.175)(2.376)(2.968)(2.870)(4.174)(4.150)(3.904)(4.589)(4.078)(3.772)
CC0.089 *** −0.005 ***
(16.535) (−13.045)
PS 0.079 *** −0.003 ***
(20.613) (−10.355)
RL 0.089 *** −0.005 ***
(17.370) (−14.409)
GE 0.107 *** −0.007 ***
(16.572) (−14.946)
RQ 0.098 *** −0.006 ***
(16.871) (−15.245)
VA 0.051 *** −0.003 ***
(11.339) (−10.502)
_cons−26.874 ***−32.600 ***−28.615 ***−27.048 ***−27.848 ***−26.500 ***−4.154 ***−3.954 ***−4.048 ***−4.134 ***−4.083 ***−4.168 ***
(−11.416)(−14.505)(−12.265)(−11.494)(−11.870)(−10.580)(−24.702)(−22.596)(−24.405)(−25.146)(−24.907)(−24.121)
PeriodYesYesYesYesYesYesYesYesYesYesYesYes
N975.000975.000975.000975.000975.000975.000975.000975.000975.000975.000975.000975.000
r20.5110.5650.5220.5120.5160.4470.8560.8480.8610.8630.8640.848
r2_a0.5080.5620.5190.5090.5130.4430.8550.8470.8600.8620.8630.847
F168.887209.184176.416169.215171.875130.361961.880899.744998.8241014.3831023.297902.782
p0.0000.0000.0000.0000.0000.0000.0000.0000.0000.0000.0000.000
Note: This table presents the baseline regression results estimating the direct effects of independent variables on the dependent variable. All variables are defined in Table 1 and Abbreviations. Country and year fixed effects are included, where applicable. The robust standard errors are reported in parentheses. ***, ** indicate statistical significance at the 1%, 5% levels, respectively.
Table 5. Moderating effect.
Carbon Emission (Per Capita) ModelsCarbon Emission (Kilotons) Models
Political GovernanceRegulatory GovernancePolitical GovernanceRegulatory Governance
(1)(2)(3)(4)(5)(6)(1)(2)(3)(4)(5)(6)
REC−0.155 ***−0.145 ***−0.125 ***−0.155 ***−0.137 ***−0.132 ***−0.012 ***−0.013 ***−0.011 ***−0.012 ***−0.011 ***−0.011 ***
(−14.520)(−12.626)(−10.993)(−13.967)(−12.677)(−12.540)(−24.345)(−27.314)(−21.952)(−22.706)(−22.620)(−23.786)
FF−0.0150.022 *0.006−0.0050.016−0.0060.002 ***0.002 ***0.003 ***0.002 ***0.002 ***0.002 ***
(−1.179)(1.715)(0.499)(−0.364)(1.388)(−0.475)(3.115)(2.918)(4.625)(3.287)(4.477)(3.306)
UR−0.022 **−0.046 ***−0.020 *−0.017 *−0.018 *−0.036 ***0.002 ***0.002 ***0.002 ***0.003 ***0.002 ***0.001 **
(−2.186)(−4.086)(−1.909)(−1.723)(−1.845)(−3.444)(4.927)(3.673)(5.037)(6.303)(4.994)(2.370)
IN1.169 ***1.024 ***1.254 ***1.215 ***1.238 ***1.292 ***0.235 ***0.227 ***0.237 ***0.237 ***0.239 ***0.228 ***
(7.198)(5.676)(7.831)(7.701)(7.835)(8.043)(31.581)(30.956)(32.413)(31.715)(33.187)(30.986)
GDP1.857 ***1.837 ***1.815 ***1.572 ***1.238 **1.803 ***0.101 ***0.103 ***0.085 ***0.085 ***0.073 ***0.094 ***
(3.415)(2.738)(3.340)(3.041)(2.365)(3.440)(4.063)(3.778)(3.432)(3.486)(3.069)(3.933)
CC0.207 *** 0.017 ***
(3.279) (6.042)
CC*REC−0.002 *** −0.000 ***
(−4.289) (−2.638)
CC*FF0.002 *** −0.000 *
(3.311) (−1.779)
CC*GDP0.030 0.001
(1.377) (1.161)
CC*UR−0.001 ** −0.000 ***
(−2.044) (−4.276)
CC*IN−0.023 *** −0.001 ***
(−5.153) (−4.625)
PS 0.343 *** 0.019 ***
(5.987) (8.184)
PS*REC −0.002 *** −0.000 ***
(−6.502) (−6.480)
PS*FF −0.001 *** −0.000 ***
(−3.270) (−7.967)
PS*GDP 0.034 0.001
(1.440) (1.450)
PS*UR −0.000 ** −0.000 ***
(−2.233) (−3.238)
PS*IN −0.019 *** −0.001 ***
(−4.375) (−4.879)
RL 0.320 *** 0.022 ***
(4.616) (7.076)
RL*REC −0.002 *** −0.000 ***
(−5.184) (−4.784)
RL*FF 0.001 ** −0.000 ***
(2.167) (−4.821)
RL*GDP 0.030 0.002 **
(1.422) (2.081)
RL*UR −0.001 *** −0.000 ***
(−4.967) (−3.311)
RL*IN −0.025 *** −0.001 ***
(−5.200) (−4.296)
GE 0.108 * 0.018 ***
(1.652) (5.930)
GE*REC −0.002 *** −0.000 ***
(−4.975) (−3.790)
GE*FF 0.001 *** −0.000 ***
(2.793) (−2.858)
GE*GDP 0.054 ** 0.003 **
(2.156) (2.227)
GE*UR 0.000 −0.000 *
(0.111) (−1.873)
GE*IN −0.015 *** −0.001 ***
(−3.208) (−4.268)
RQ 0.307 *** 0.023 ***
(4.339) (7.223)
RQ*REC −0.003 *** −0.000 ***
(−6.944) (−5.147)
RQ*FF 0.000 −0.000 ***
(0.649) (−4.111)
RQ*GDP 0.048 * 0.003 **
(1.914) (2.398)
RQ*UR −0.001 *** −0.000 ***
(−3.722) (−5.364)
RQ*IN −0.020 *** −0.001 ***
(−3.914) (−4.691)
VA 0.504 *** 0.023 ***
(8.377) (8.245)
VA*REC −0.002 *** −0.000 ***
(−5.553) (−3.775)
VA*FF 0.002 *** −0.000 **
(4.120) (−2.300)
VA*GDP 0.004 0.001
(0.230) (0.815)
VA*UR −0.000 ** −0.000 **
(−1.992) (−2.042)
VA*IN −0.051 *** −0.002 ***
(−11.356) (−7.872)
_cons−14.258 ***−23.597 ***−25.165 ***−9.365 *−25.074 ***−35.827 ***1.399 ***1.438 ***0.938 ***1.238 ***0.882 ***1.186 ***
(−3.187)(−6.004)(−4.982)(−1.952)(−5.055)(−8.518)(6.837)(9.012)(4.067)(5.451)(3.899)(6.166)
PeriodYesYesYesYesYesYesYesYesYesYesYesYes
N975.000975.000975.000975.000975.000975.000975.000975.000975.000975.000975.000975.000
r20.6020.5140.6040.6220.6140.6260.8830.8870.8840.8810.8870.890
r2_a0.5810.4880.5840.6020.5930.6070.8770.8810.8780.8750.8810.884
F127.39588.920128.512138.588133.635140.981634.916662.944641.443622.748659.907681.134
p0.0000.0000.0000.0000.0000.0000.0000.0000.0000.0000.0000.000
Note: This table reports the results of the moderation analysis examining the interaction effects between independent variables and governance indicators. All variables are defined in Table 1 and Abbreviations. Interaction terms were constructed using mean-centered variables to reduce multicollinearity. Country and year fixed effects are included, where applicable. The robust standard errors are reported in parentheses. ***, **, and * denote statistical significance at the 1%, 5%, and 10% levels, respectively.
Table 6. Robustness Analysis: Direct Effect.
Carbon Emission (Per Capita) ModelsCarbon Emission (Kilotons) Models
Political GovernanceRegulatory GovernancePolitical GovernanceRegulatory Governance
(1)(2)(3)(4)(5)(6)(1)(2)(3)(4)(5)(6)
REC−0.026 ***−0.032 ***−0.019 **−0.017 **−0.027 ***−0.040 ***−0.003 ***−0.003 ***−0.004 ***−0.004 ***−0.003 ***−0.003 ***
(−2.915)(−3.222)(−2.052)(−2.167)(−2.632)(−4.027)(−3.873)(−3.361)(−4.752)(−4.840)(−4.157)(−3.349)
FF0.065 ***0.075 ***0.075 ***0.070 ***0.063 ***0.060 ***0.005 ***0.006 ***0.004 ***0.004 ***0.005 ***0.005 ***
(8.265)(8.312)(8.988)(9.709)(6.982)(6.730)(6.618)(7.453)(5.972)(5.796)(7.146)(6.810)
UR0.010 *0.046 ***0.030 ***0.013 ***0.020 ***0.022 ***−0.005 ***−0.007 ***−0.005 ***−0.005 ***−0.005 ***−0.006 ***
(1.715)(8.275)(5.467)(2.591)(3.218)(3.637)(−9.011)(−15.190)(−11.219)(−10.243)(−9.443)(−11.350)
IN1.390 ***1.530 ***1.577 ***0.998 ***1.414 ***1.199 ***0.873 ***0.863 ***0.870 ***0.889 ***0.878 ***0.873 ***
(10.649)(10.394)(11.502)(8.318)(9.442)(8.176)(71.436)(68.821)(72.277)(73.506)(74.251)(70.536)
GDPg3.276 **4.977 ***4.942 ***1.2925.395 ***5.832 ***0.748 ***0.766 ***0.661 ***0.773 ***0.689 ***0.737 ***
(2.004)(2.683)(2.875)(0.872)(2.878)(3.170)(4.886)(4.846)(4.381)(5.175)(4.654)(4.745)
CC0.100 *** −0.005 ***
(24.437) (−11.793)
PS 0.075 *** −0.003 ***
(21.449) (−9.035)
RL 0.098 *** −0.005 ***
(23.642) (−13.238)
GE 0.128 *** −0.006 ***
(28.673) (−13.896)
RQ 0.101 *** −0.006 ***
(19.753) (−14.253)
VA 0.073 *** −0.003 ***
(20.181) (−9.625)
_cons−21.632 ***−23.374 ***−25.956 ***−20.571 ***−22.565 ***−17.730 ***−4.091 ***−4.037 ***−3.922 ***−4.041 ***−4.058 ***−4.165 ***
(−12.112)(−11.405)(−13.797)(−12.705)(−11.007)(−8.828)(−24.477)(−23.122)(−23.749)(−24.754)(−25.069)(−24.579)
N975.000975.000975.000975.000975.000975.000975.000975.000975.000975.000975.000975.000
r20.6060.5460.6030.6550.5380.5170.8570.8500.8610.8640.8660.853
r2_a0.6040.5430.6010.6530.5350.5140.8560.8490.8600.8630.8650.852
F248.258193.640245.526305.914187.602172.921966.108914.907996.4751025.8091045.604938.897
p0.0000.0000.0000.0000.0000.0000.0000.0000.0000.0000.0000.000
Note: This table presents the robustness checks for the direct effects using robust regression estimation to address potential outliers and heteroskedasticity. All variables are defined in Table 1 and Abbreviations. Country and year fixed effects are included, where applicable. The robust standard errors are reported in parentheses. ***, **, and * denote statistical significance at the 1%, 5%, and 10% levels, respectively.
Table 7. GMM–Direct Effect.
Carbon Emission (Per Capita) ModelsCarbon Emission (Kilotons) Models
Political GovernanceRegulatory GovernancePolitical GovernanceRegulatory Governance
Variable(1)(2)(3)(4)(5)(6)(1)(2)(3)(4)(5)(6)
LCO20.714 ***0.792 ***0.737 ***0.719 ***0.776 ***0.788 ***0.547 ***0.483 ***0.514 ***0.472 ***0.518 ***0.413 ***
49.73269.89643.82418.39089.23483.42413.40711.44721.70110.05713.06110.446
REC−0.063 ***−0.052 ***−0.054 ***−0.054 ***−0.056 ***−0.053 ***−0.008 ***−0.008 ***−0.008 ***−0.008 ***−0.007 ***−0.010 ***
−11.912−12.863−8.012−9.059−18.073−14.026−8.701−15.992−23.709−13.846−4.905−7.910
FF0.013 *−0.013 *0.0030.006−0.012 **−0.011−0.0010.0000.0000.0000.001−0.001
1.836−1.7810.3640.422−2.369−1.594−0.627−0.191−0.0370.1241.045−0.735
UR−0.046 ***−0.067 ***−0.044 **−0.048 *−0.054 ***−0.061 ***0.0010.003 **0.002 ***0.003 *0.003 **0.003 **
−3.534−6.681−2.216−1.754−4.491−4.2921.3142.3474.0601.8772.3932.499
IN0.570 ***0.493 ***0.389 ***0.410 ***0.288 ***0.438 ***0.093 ***0.088 ***0.090 ***0.093 ***0.081 ***0.101 ***
7.8665.4333.5463.2304.98610.4539.25416.05654.08114.6559.76010.743
GDP2.003 ***2.385 ***2.415 ***2.129 ***2.199 ***2.268 ***0.090 ***0.055 ***0.072 ***0.061 ***0.068 ***0.056 ***
13.55618.23210.4337.69114.68119.6238.5453.87612.2093.2225.9013.629
CC0.017 *** 0.000 ***
5.469 2.979
PS 0.002 * 0.000 ***
1.772 −4.198
RL 0.026 *** 0.000
8.871 0.708
GE 0.023 *** 0.001 ***
4.268 3.290
RQ 0.012 *** 0.000
9.747 0.930
VA 0.014 *** −0.001 ***
5.074 −5.070
Time effectsYesYesYesYesYesYesYesYesYesYesYesYes
Net effectsNoNoNoNoNoNoNoNoNoNoNoNo
AR (1)0.0900.2200.1900.1100.0700.1500.1800.1000.1600.1200.0800.230
AR (2)0.5400.5500.5890.4400.3580.6000.6840.4500.4000.4930.2480.718
Sargan OIR0.0000.0000.0000.0000.0000.0000.0000.0000.0000.0000.0000.000
Hansen OIR0.1900.1430.1240.0770.1050.0980.1170.1170.1040.0960.1160.150
DHT for instruments: Instruments in levels/H excluding group0.1670.1200.1000.0540.0820.0740.0940.0930.0810.0730.0930.126
Dif (null)0.3650.2750.2370.1480.2020.1870.2250.2240.2000.1840.2230.287
IV (years, eq (diff)): H excluding group0.1200.0730.0540.0450.0750.0580.0470.0870.0840.0760.0760.080
Dif (null)0.4490.3380.2920.1820.2480.2300.2760.2750.2460.2270.2740.353
Fisher45,863.1957,839.4049,214.7951,504.3655,268.2174,612.0856,411.72656,03.1873,672.3758,417.7975,882.5455,173.42
************************************
Instruments 38.00038.00038.00038.00038.00038.00038.00038.00038.00038.00038.00038.000
countries39.00039.00039.00039.00039.00039.00039.00039.00039.00039.00039.00039.000
observations975.000975.000975.000975.000975.000975.000975.000975.000975.000975.000975.000975.000
Note: This table reports the results of the Generalized Method of Moments (GMM) estimator used to address potential endogeneity and reverse causality issues. All variables are defined in Table 1 and Abbreviations. The specification employs lagged levels of explanatory variables as instruments. Model validity was assessed using the Hansen/Sargan test of overidentifying restrictions and the Arellano–Bond tests for first- and second-order serial correlation. Country and year fixed effects are included, where applicable. The robust standard errors are reported in parentheses. ***, **, and * indicate statistical significance at the 1%, 5%, and 10% levels, respectively.
Table 8. PCSE.
Table 8. PCSE.
Carbon Emission (Per Capita) ModelsCarbon Emission (Kilotons) Models
Political GovernanceRegulatory GovernancePolitical GovernanceRegulatory Governance
(1)(2)(3)(4)(5)(6)(1)(2)(3)(4)(5)(6)
REC−0.066 ***−0.033 ***−0.060 ***−0.047 ***−0.043 ***−0.079 ***0.004 ***−0.002 ***0.005 ***0.003 **−0.0010.000
(−8.758)(−6.431)(−7.644)(−6.147)(−4.883)(−6.177)(3.475)(−3.659)(4.217)(2.221)(−1.634)(0.362)
FF0.065 ***0.093 ***0.070 ***0.081 ***0.076 ***0.067 ***0.011 ***0.007 ***0.013 ***0.010 ***0.007 ***0.008 ***
(11.514)(25.892)(13.114)(11.135)(9.538)(5.658)(13.784)(27.580)(13.045)(9.612)(9.446)(8.354)
UR0.023 ***0.059 ***0.040 ***0.032 ***0.030 ***0.044 ***−0.002 ***−0.004 ***−0.003 ***−0.003 ***−0.003 ***−0.004 ***
(5.567)(13.071)(9.064)(7.306)(6.950)(13.164)(−4.304)(−10.057)s(−6.837)(−7.972)(−6.647)(−10.814)
IN2.128 ***2.209 ***2.062 ***1.670 ***1.944 ***2.082 ***0.864 ***0.818 ***0.863 ***0.873 ***0.863 ***0.874 ***
(22.345)(18.025)(21.013)(18.459)(19.719)(17.709)(46.307)(39.453)(47.927)(48.548)(47.774)(43.447)
GDPg6.154 **7.471 ***6.673 ***5.043 **6.718 ***6.030 **0.591 *0.631 *0.527 *0.641 **0.577 *0.589 *
(2.547)(2.984)(2.594)(2.093)(2.715)(2.372)(1.818)(1.763)(1.679)(2.179)(1.929)(1.896)
CC−0.692 *** −0.007 **
(−9.126) (−1.963)
CC*REC0.004 *** −0.000 ***
(7.878) (−10.523)
CC*FF0.002 *** −0.000 ***
(5.868) (−7.731)
CC*GDP0.104 0.004
(0.949) (0.688)
CC*UR0.002 *** 0.000 ***
(6.990) (6.524)
CC*IN0.043 *** 0.002 ***
(8.676) (6.819)0.004
(0.742)
GE −0.044
(−0.850) −0.000 ***
(−8.126)
GE*REC 0.002 ***
(6.880) −0.000 ***
(−2.734)
GE*FF 0.001 ***
(3.437) 0.000
(0.035)
GE*GDP 0.142 **
(2.093) 0.000 ***
(4.938)
GE*UR 0.001 ***
(6.924) −0.000
(−0.966)
GE*IN −0.002
(−0.356) −0.012 ***
(−2.941)
PS −0.694 ***
(−9.930) −0.000 ***
(−11.039)
PS*REC 0.003 ***
(7.976) −0.000 ***
(−8.277)
PS*FF 0.002 ***
(6.387) 0.006
(0.901)
PS*GDP 0.076
(0.720) 0.000 ***
(6.932)
PS*UR 0.002 ***
(9.027) 0.003 ***
(9.982)
PS*IN 0.043 ***
(9.370)
RL −0.635 *** −0.024 ***
(−6.669) (−6.313)
RL*REC 0.003 *** −0.000 ***
(5.617) (−8.521)
RL*FF 0.001 *** −0.000 ***
(3.018) (−4.497)
RL*GDP 0.073 0.006
(0.552) (0.712)
RL*UR 0.001 *** 0.000 ***
(5.973) (7.429)
RL*IN 0.047 *** 0.003 ***
(7.105) (9.207)
RQ −0.605 *** −0.018 ***
(−7.202) (−3.807)
RQ*REC 0.002 *** −0.000 ***
(4.919) (−3.927)
RQ*FF 0.001 ** −0.000
(2.235) (−1.544)
RQ*GDP 0.087 0.006
(0.695) (0.697)
RQ*UR 0.001 *** 0.000 ***
(6.095) (7.756)
RQ*IN 0.045 *** 0.001 ***
(6.930) (3.838)
VA −0.318 *** −0.005
(−4.116) (−1.211)
VA*REC 0.003 *** −0.000 ***
(4.649) (−4.548)
VA*FF 0.001 ** −0.000
(1.974) (−1.464)
VA*GDP 0.047 −0.000
(0.434) (−0.017)
VA*UR 0.002 *** −0.000 **
(8.893) (−1.975)
VA*IN 0.010 *** 0.001 ***
(3.380) (4.145)
_cons24.578 ***−24.794 ***23.590 ***23.170 ***18.708 ***−1.752−4.657 ***−4.359 ***−4.398 ***−3.327 ***−3.416 ***−4.348 ***
(5.268)(−9.161)(5.773)(3.697)(3.580)(−0.308)(−10.483)(−12.913)(−10.154)(−7.723)(−7.974)(−10.061)
Period YesYesYesYesYesYesYesYesYesYesYesYes
N975.000975.000975.000975.000975.000975.000975.000975.000975.000975.000975.000975.000
r20.5690.5800.5800.5530.5490.4980.8720.8600.8790.8780.8750.858
p0.0000.0000.0000.0000.0000.0000.0000.0000.0000.0000.0000.000
Note: This table presents the Panel-Corrected Standard Error (PCSE) estimates for the moderation models to account for heteroskedasticity and contemporaneous correlation across panels. All variables are defined in Table 1 and Abbreviations. Country and year fixed effects are included, where applicable. The robust standard errors are reported in parentheses. ***, **, and * denote statistical significance at the 1%, 5%, and 10% levels, respectively.
Disclaimer/Publisher’s Note: The statements, opinions and data contained in all publications are solely those of the individual author(s) and contributor(s) and not of MDPI and/or the editor(s). MDPI and/or the editor(s) disclaim responsibility for any injury to people or property resulting from any ideas, methods, instructions or products referred to in the content.