Article

Assessing Soil Quality in Conversion of Burned Forestlands to Rice Croplands: A Case Study in Northern Iran

by
Misagh Parhizkar
1,
Shahryar Babazadeh Jafari
1,
Zeinab Ghasemzadeh
2,
Pietro Denisi
3 and
Demetrio Antonio Zema
3,*
1
Rice Research Institute of Iran, Agricultural Research Education and Extension Organization (AREEO), Rasht 4199613475, Iran
2
School of Agriculture, Food & Wine, The University of Adelaide, Glen Osmond, SA 5064, Australia
3
Department AGRARIA, “Mediterranea” University of Reggio Calabria, Località Feo di Vito, I-89122 Reggio Calabria, Italy
*
Author to whom correspondence should be addressed.
Resources 2025, 14(9), 141; https://doi.org/10.3390/resources14090141
Submission received: 3 August 2025 / Revised: 3 September 2025 / Accepted: 9 September 2025 / Published: 10 September 2025

Abstract

Conversion of burned forestlands into rice croplands is often practised to increase food production. However, this practice can lead to a severe decline in soil quality and functioning. Unfortunately, no research has previously evaluated how and to what extent physico-chemical properties and overall quality of forest soils change when converted to rice paddy fields. This study has evaluated the changes in key soil properties and Soil Quality Index (SQI) when burned forests are converted to rice croplands in Guilan Province (Northern Iran). This conversion results in noticeable worsening of soil structure (shown by the decreases in size and stability of macro-aggregates, ~50%) and reductions in organic matter (−30%) and nutrient contents (−43% of TN and −49% of P) of soil in rice paddy fields in comparison to burned forest soils. In contrast, soil salinity increased by 180% and potassium by 12%, while pH remained unchanged between forestland and rice fields. The calculation of the SQI showed that the overall quality of the soil was severely affected by this change. The main message of this study is that replacement of forest ecosystems with rice croplands should be carefully controlled, in order to avoid noticeable impacts on soil properties and theiroverall quality. In sites where this conversion has occurred, sustainable land management practices, such as moderate supply of organic amendments and fertilisers, should be implemented to mitigate soil degradation.

1. Introduction

Unsustainable land management accelerates soil degradation by altering its physical, chemical, and biological properties, thereby undermining ecosystem functioning [1,2]. For example, in forest ecosystems, wildfire is one of the most important factors influencing changes in soil properties [3,4]. This issue is particularly felt in the Mediterranean forests, where long and dry summers severely increase the fire risk [5].In these climatic conditions, surface soils frequently burned by anthropogenic fires, even at low intensity, are affected by intense soil erosion and more general degradation [6].
In burned areas, conversion to croplands is common, at least in low-income countries, for cultivating food crops, as in the case of rice, a primary source for more than three billion people worldwide [7]. The excessive use and long-term application of chemical fertilisers have led to degradation of soil quality and a decline in its productivity and functioning [8]. Therefore, there is a need to breed high-yielding rice through more appropriate and environmentally sustainable methods that can support food security and sustainable production.
A plethora of studies have investigated the changes in land use, also in combination with climate change effects (e.g., [9,10,11,12,13,14]), as well as the techniques for soil protection under these forcings (e.g., [15,16,17]). However, few studies have explored the effects of the conversion of forests to rice croplands [18]. The latter authors investigated the environmental and economic consequences of converting natural mangrove ecosystems to rice paddy fields—especially regarding the CH4 and N2O emissions—and suggested a need for people’s awareness about the benefits of the mangrove forest compared to the rice cropland. Despite this isolated study, there is a need for a better understanding of soil quality in rice fields compared to forests. To the authors’ best knowledge, no previous studies have evaluated the soil properties and overall quality in the conversion of burned forestlands to rice croplands. This pathway of land transformation is particularly important in Northern Iran, where forest fires are increasingly frequent due to both climatic and anthropogenic factors. By providing quantitative evidence from a case study, our investigation addresses this critical research gap and offers novel insights into the environmental risks associated with replacing post-fire forest ecosystems with rice paddies.
To address this aim, this study has evaluated the changes in several properties and overall quality of soil between burned forests and rice paddy fields in Guilan Province (Northern Iran). The specific objectives of the study are as follows: (i) assessing whether the possible conversion of burned forestlands (now being marginal and subjected to shrub and herb regrowth) to rice croplands may result in degradation of soil quality, and (ii) evaluating the overall soil quality between these land uses using the well-known Soil Quality Index. We hypothesise that there is a clear difference in soil quality between the forest ecosystems studied and the rice fields. The results of this study should indicate the environmental feasibility of this conversion in the study area and suggest the appropriate management practices to minimise the expected impacts of this conversion.

2. Materials and Methods

2.1. Study Areas

Three forestlands, named Khortoum, Saravan and Saqalaksar (Guilan Province, geographical coordinates 37°08′04″ N, 49°39′44″ E, 37°09′24′′ N, 49°31′50′′ E and 37°07′10′′ N, 49°29′30″ E), and a rice cropland in Sangar district (37°11′53″ N, 49°44′16″ E) were selected as the study areas (Figure 1). These study sites represent typical post-fire landscapes, making them highly relevant for evaluating soil quality in the region.
The forest characteristics and soil physicochemical properties are very similar across these three locations. This high similarity level is due to the common climatic and geomorphological characteristics and very similar historical natural evolution and human management.
All forestlands and rice croplands (hereafter indicated as ‘land uses’) are under a Mediterranean climate, Csa class, according to the Köppen–Geiger classification [19]. The main characteristics of the forest parks and paddy fields are presented in Table 1.
All natural forestlands showed a high biodiversity with many trees, shrubs and herbaceous species, including Alnus glutinosa, Carpinus betulus, Alnus subcordata, Brachythecium plumose, Gleditsia caspica, Sambucus ebulus, Oriental beech, Crataegus ambigue, Rubus persicus and Primula heterochroma. However, in the past two decades, human disturbance, especially deforestation, and low-severity fires for recreational activities (e.g., barbecues) noticeably reduced this biodiversity. Vegetation removal due to these activities left large areas with bare soil, particularly on steep slopes, which have been exposed to rill erosion [20]. Despite the problems related to soil erosion on steep slopes, flat and mild-slope areas in these forests still have a favourable soil quality and may be suitable for a variety of uses, such as rice croplands. The abundant forest ecosystems in this area are affected by degradation, mainly due to fire and deforestation [21], and therefore may have the potential to be converted into rice croplands. The reduction in soil quality has been the main result of the recent land use change, which makes these forestlands suitable for the study’s aims.

2.2. Soil Sampling and Analyses

According to the time of rice cultivation, soil samples were collected simultaneously from both land uses for laboratory measurements (from 2020 to 2023). Soil was sampled from (i) burned and not further disturbed forestlands, and (ii) paddy fields converted from burned forestlands more than ten years ago. The soil samples were randomly collected from the top 15 cm, since this layer is directly influenced by root growth, organic matter inputs, and cultivation practices. Although deeper horizons may also change, the surface layer is more sensitive to land use and is associated with soil fertility and crop productivity. The soil samples were collected in November (before starting rice cultivation) and simultaneously from two land uses.
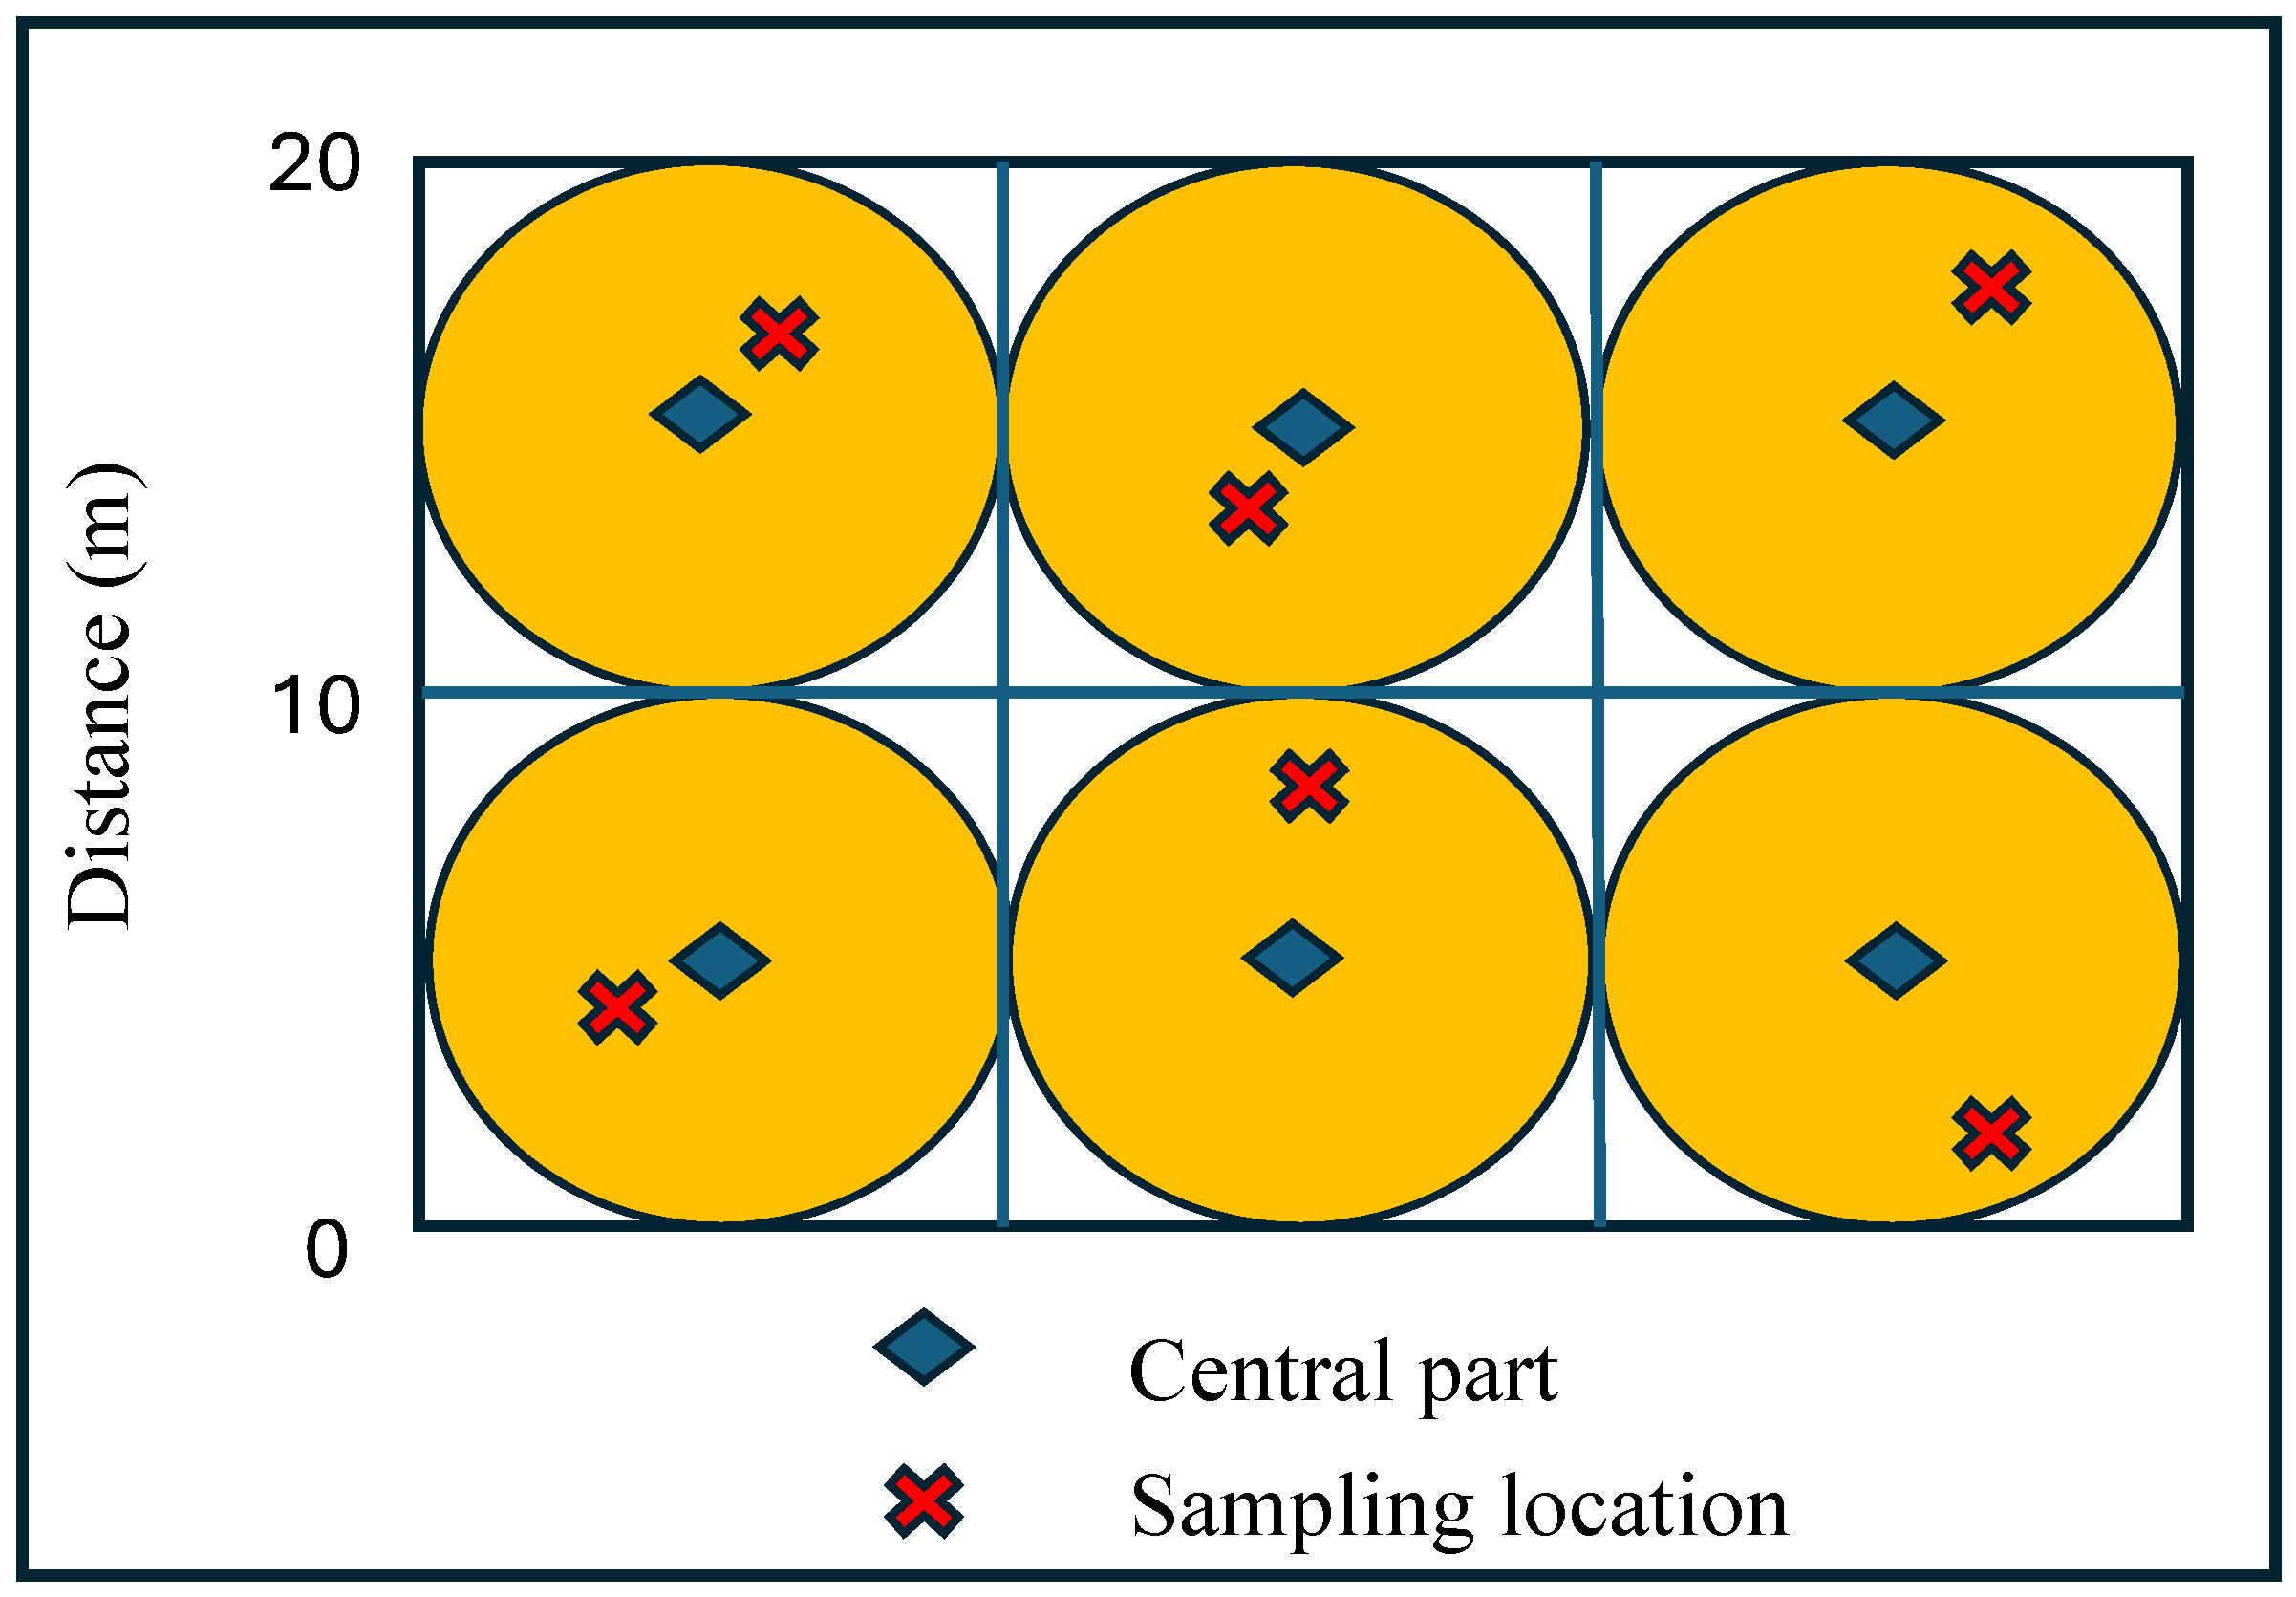
Before sampling, the land was divided into sections with very similar slope and aspect. Then, soil samples were taken close to the central point of each section for both land uses according to one of the layouts in Figure 2. Overall, the total number of sampled sites was 21 (11 in forestlands and 10 in the rice cropland). The changes in physical and chemical characteristics as well as overall soil quality between forest and croplands were thus compared, adopting soil properties (e.g., organic matter stock, nutrient availability, bulk density, and structure) as key indicators of these changes. Clay, silt and sand contents were measured by sieving samples, followed by the hydrometer method [22], to evaluate their texture. The following physico-chemical properties were measured: organic carbon (OC) by Walkley–Black method [23]; pH and electrical conductivity (EC) with1:2.5 soil/water ratio [24]; bulk density (BD) using the clod method [25]; aggregate stability (water stable aggregates, WSA, and mean weighted diameter, MWD), using the wet-sieving method [26]; total nitrogen (TN)by Kjeldahl method [27]; phosphorous (P), potassium (K), manganese (Mn) and zinc (Zn)using the methods reported by Claessen [28]; and cation exchange capacity (CEC)according to the method reported by Chapman [29].
This set of soil indicators was selected based on their established relevance to soil fertility, productivity, and sensitivity to land use change. These include physical (e.g., bulk density, aggregate stability) and chemical (e.g., organic carbon, nitrogen, pH, electrical conductivity) parameters that provide robust and comparable measures of soil quality. Biological indicators, such as microbial biomass, enzyme activity, and biodiversity, were not included due to resource constraints.

2.3. Evaluation of Soil Quality Index

The overall soil quality for each land use (forestlands and rice cropland) was evaluated using the well-known Soil Quality Index (SQI) [30]. In more detail, a Principal Component Analysis (PCA) was applied to the measured physico-chemical properties to select a Minimum Data Set (MDS) of ‘indicators’ of soil quality. PCA was carried out by standardising the original variables (expressed by different measurement units) and using Pearson’s method to compute the correlation matrix (Table A1 and Appendix A). The first three PCs, explaining at least 75% of the original variance, were retained. The indicators were identified as the highly weighted variables (i.e., those loadings with absolute values within 10% of the highest factor loading or ≥0.40) retained from each PC [31]. These indicators were then converted to ‘scores’ using a linear method and ranked in ascending or descending order, depending on whether a higher value was considered ‘good’ or ‘poor’ in terms of soil functions. For ‘more is better’ indicators, each indicator was divided by the highest measured value (thus, the highest measured value received a score of one). For ‘less is better’ (in our case EC and BD), the lowest measured value—in the numerator—was divided by each measure—in the denominator—(the lowest measured value thus received a score of one) [30]. A mid-point optima method, such as a Gaussian function, was used to calculate the pH indicator [30]. Then, each score of the variables measured at each sampling point was weighted as the product by the per cent eigenvalue. This eigenvalue was associated with the most influential PC, which gave the highly weighted variables as described in the previous step. Finally, the weighted scores for each sampling point were summed up, and the mean and standard errors for each land use were calculated.

2.4. Statistical Analysis

The statistical significance of the differences between the two soil conditions (independent variables or factors with two levels, forestland and rice cropland) was evaluated using a t-test (p-level < 0.01), which was applied to the physico-chemical properties of soil and SQI (dependent or response variables). The assumptions of the t-test (equality of variance and normal distribution) were checked by Shapiro–Wilk’s and Levene’s tests, respectively.
The PCA applied to calculate the SQI was used to simplify the analysis of the large number of soil properties, by selecting a lower number of derivative variables (Principal Components, PCs) [32] and losing as little information as possible.
Finally, the measures of soil properties at each sampling point were grouped in clusters using the Agglomerative Hierarchical Cluster Analysis (AHCA). AHCA is a technique to group samples with similar characteristics. The Euclidean distance was used as a similarity-dissimilarity measure for this approach, which was calculated by Ward’s method.
The statistical analysis was carried out using the Origin (Pro) v10.2.5.212 software (OriginLab Corporation, Northampton, MA, USA).

3. Results

3.1. Variations in Soil Properties Between Forestland and Rice Cropland

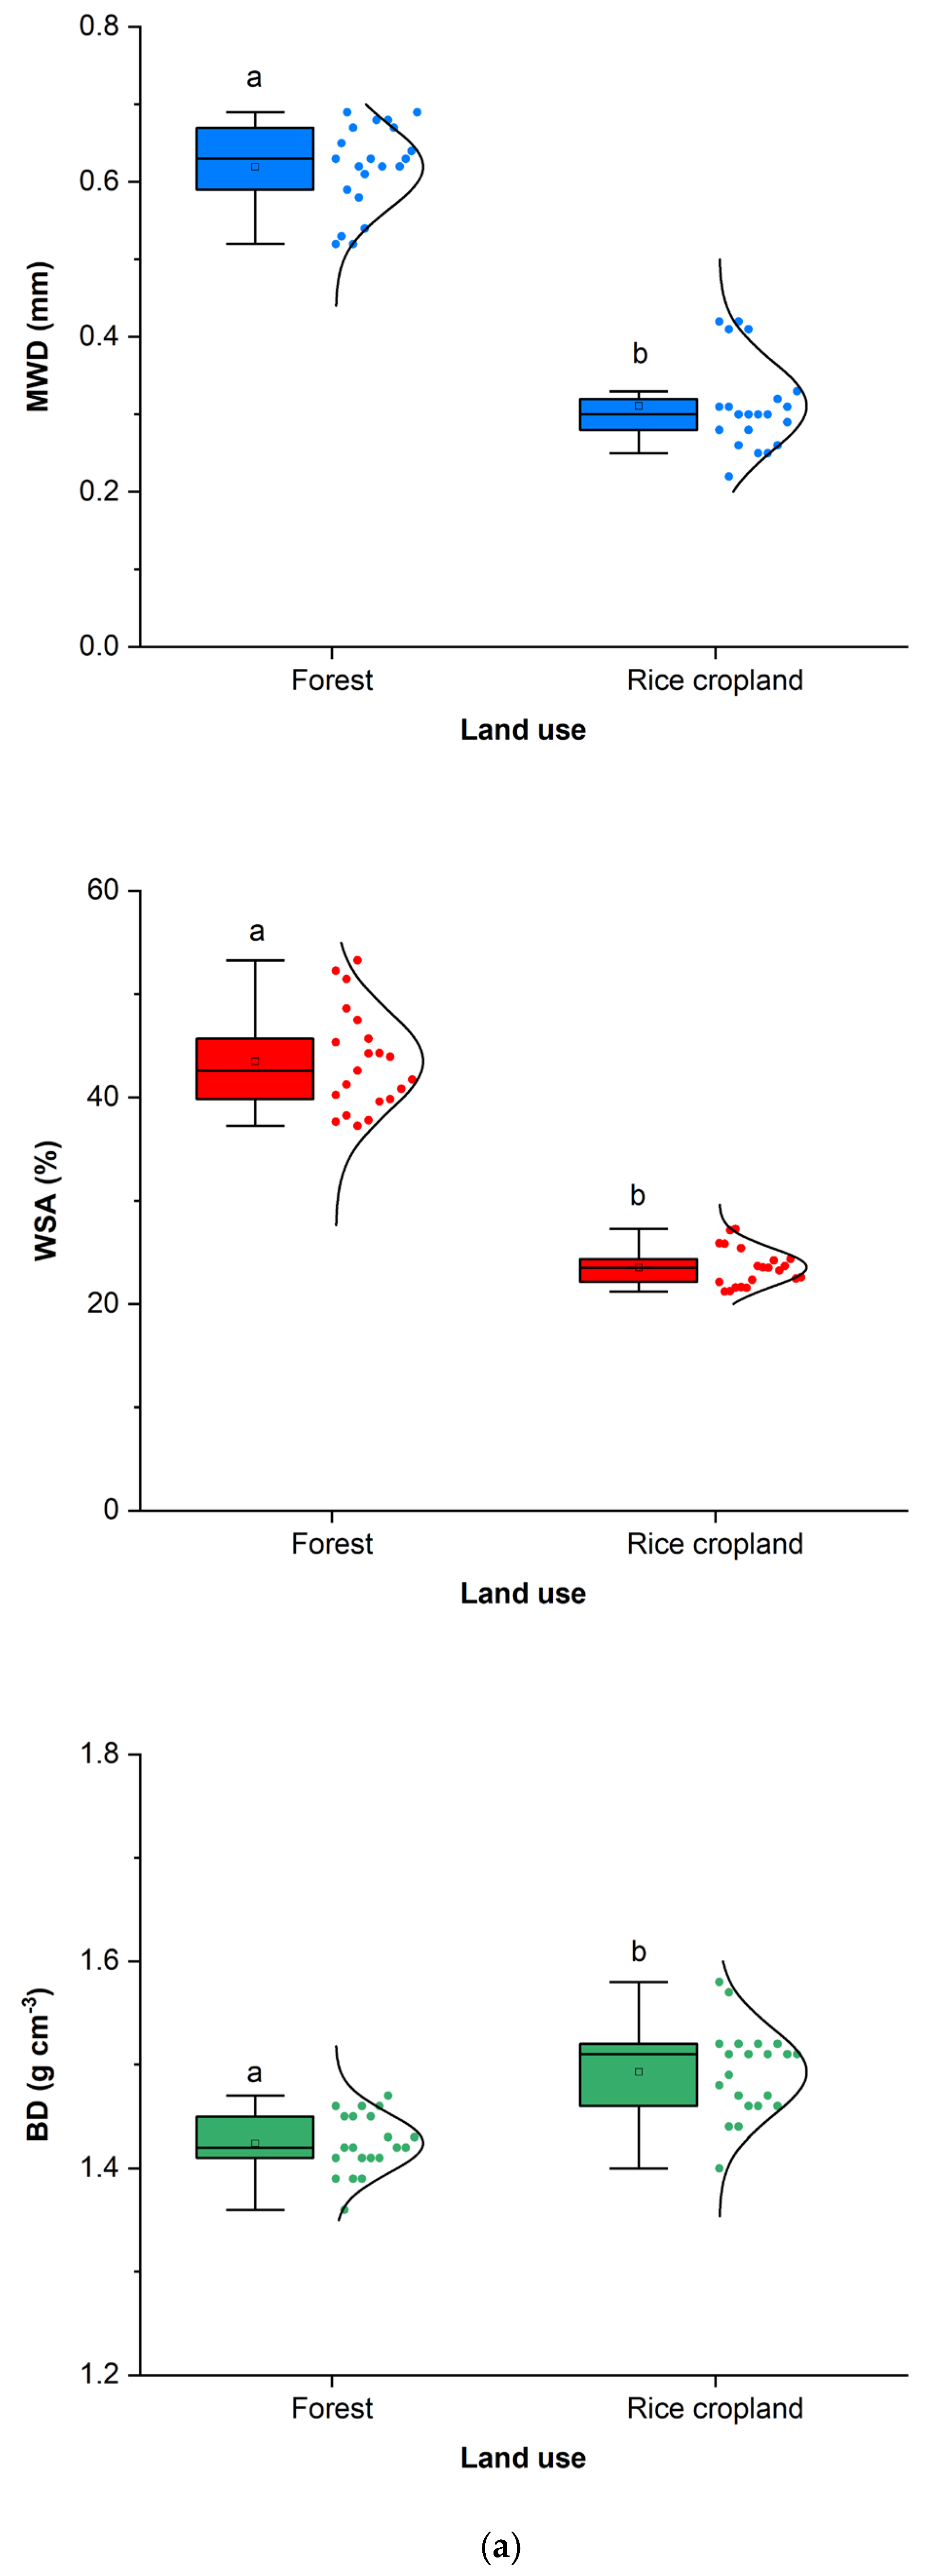
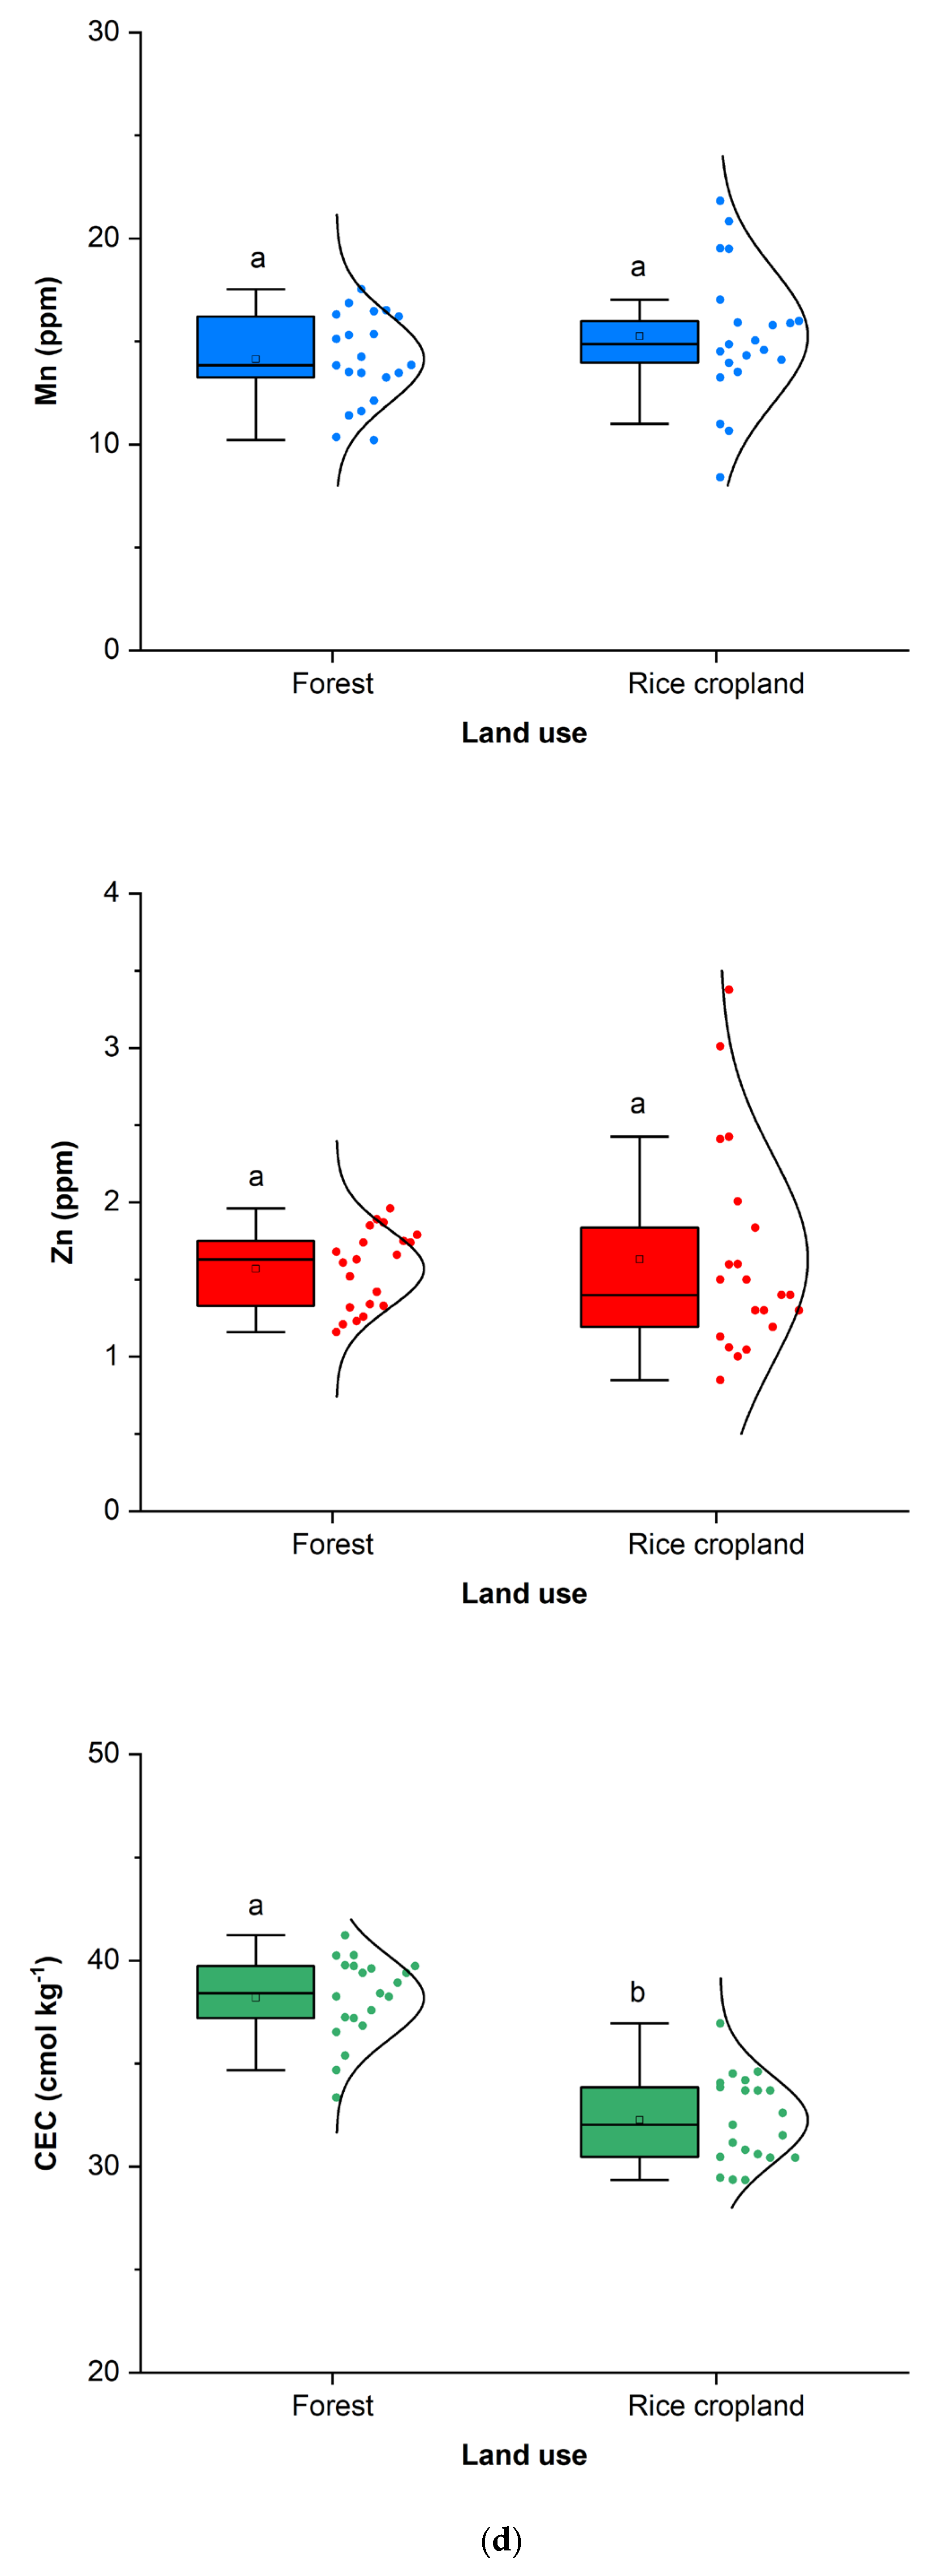
All physico-chemical properties of soils were significantly different between the two land uses (p < 0.01 in t-tests), except pH (p = 0.32), Mn (p = 0.13), and Zn (p = 0.66) (Figure 3). More specifically, MWD and WSA were higher in the forestland (0.62 ± 0.06 mm and 43.5 ± 4.88%) compared to the rice cropland (0.31 ± 0.06 mm and 23.6 ± 1.87%). The latter land use showed a higher BD (1.49 ± 0.04 g/cm3 against 1.42 ± 0.03 g/cm3 of forest soils) (Figure 3a).
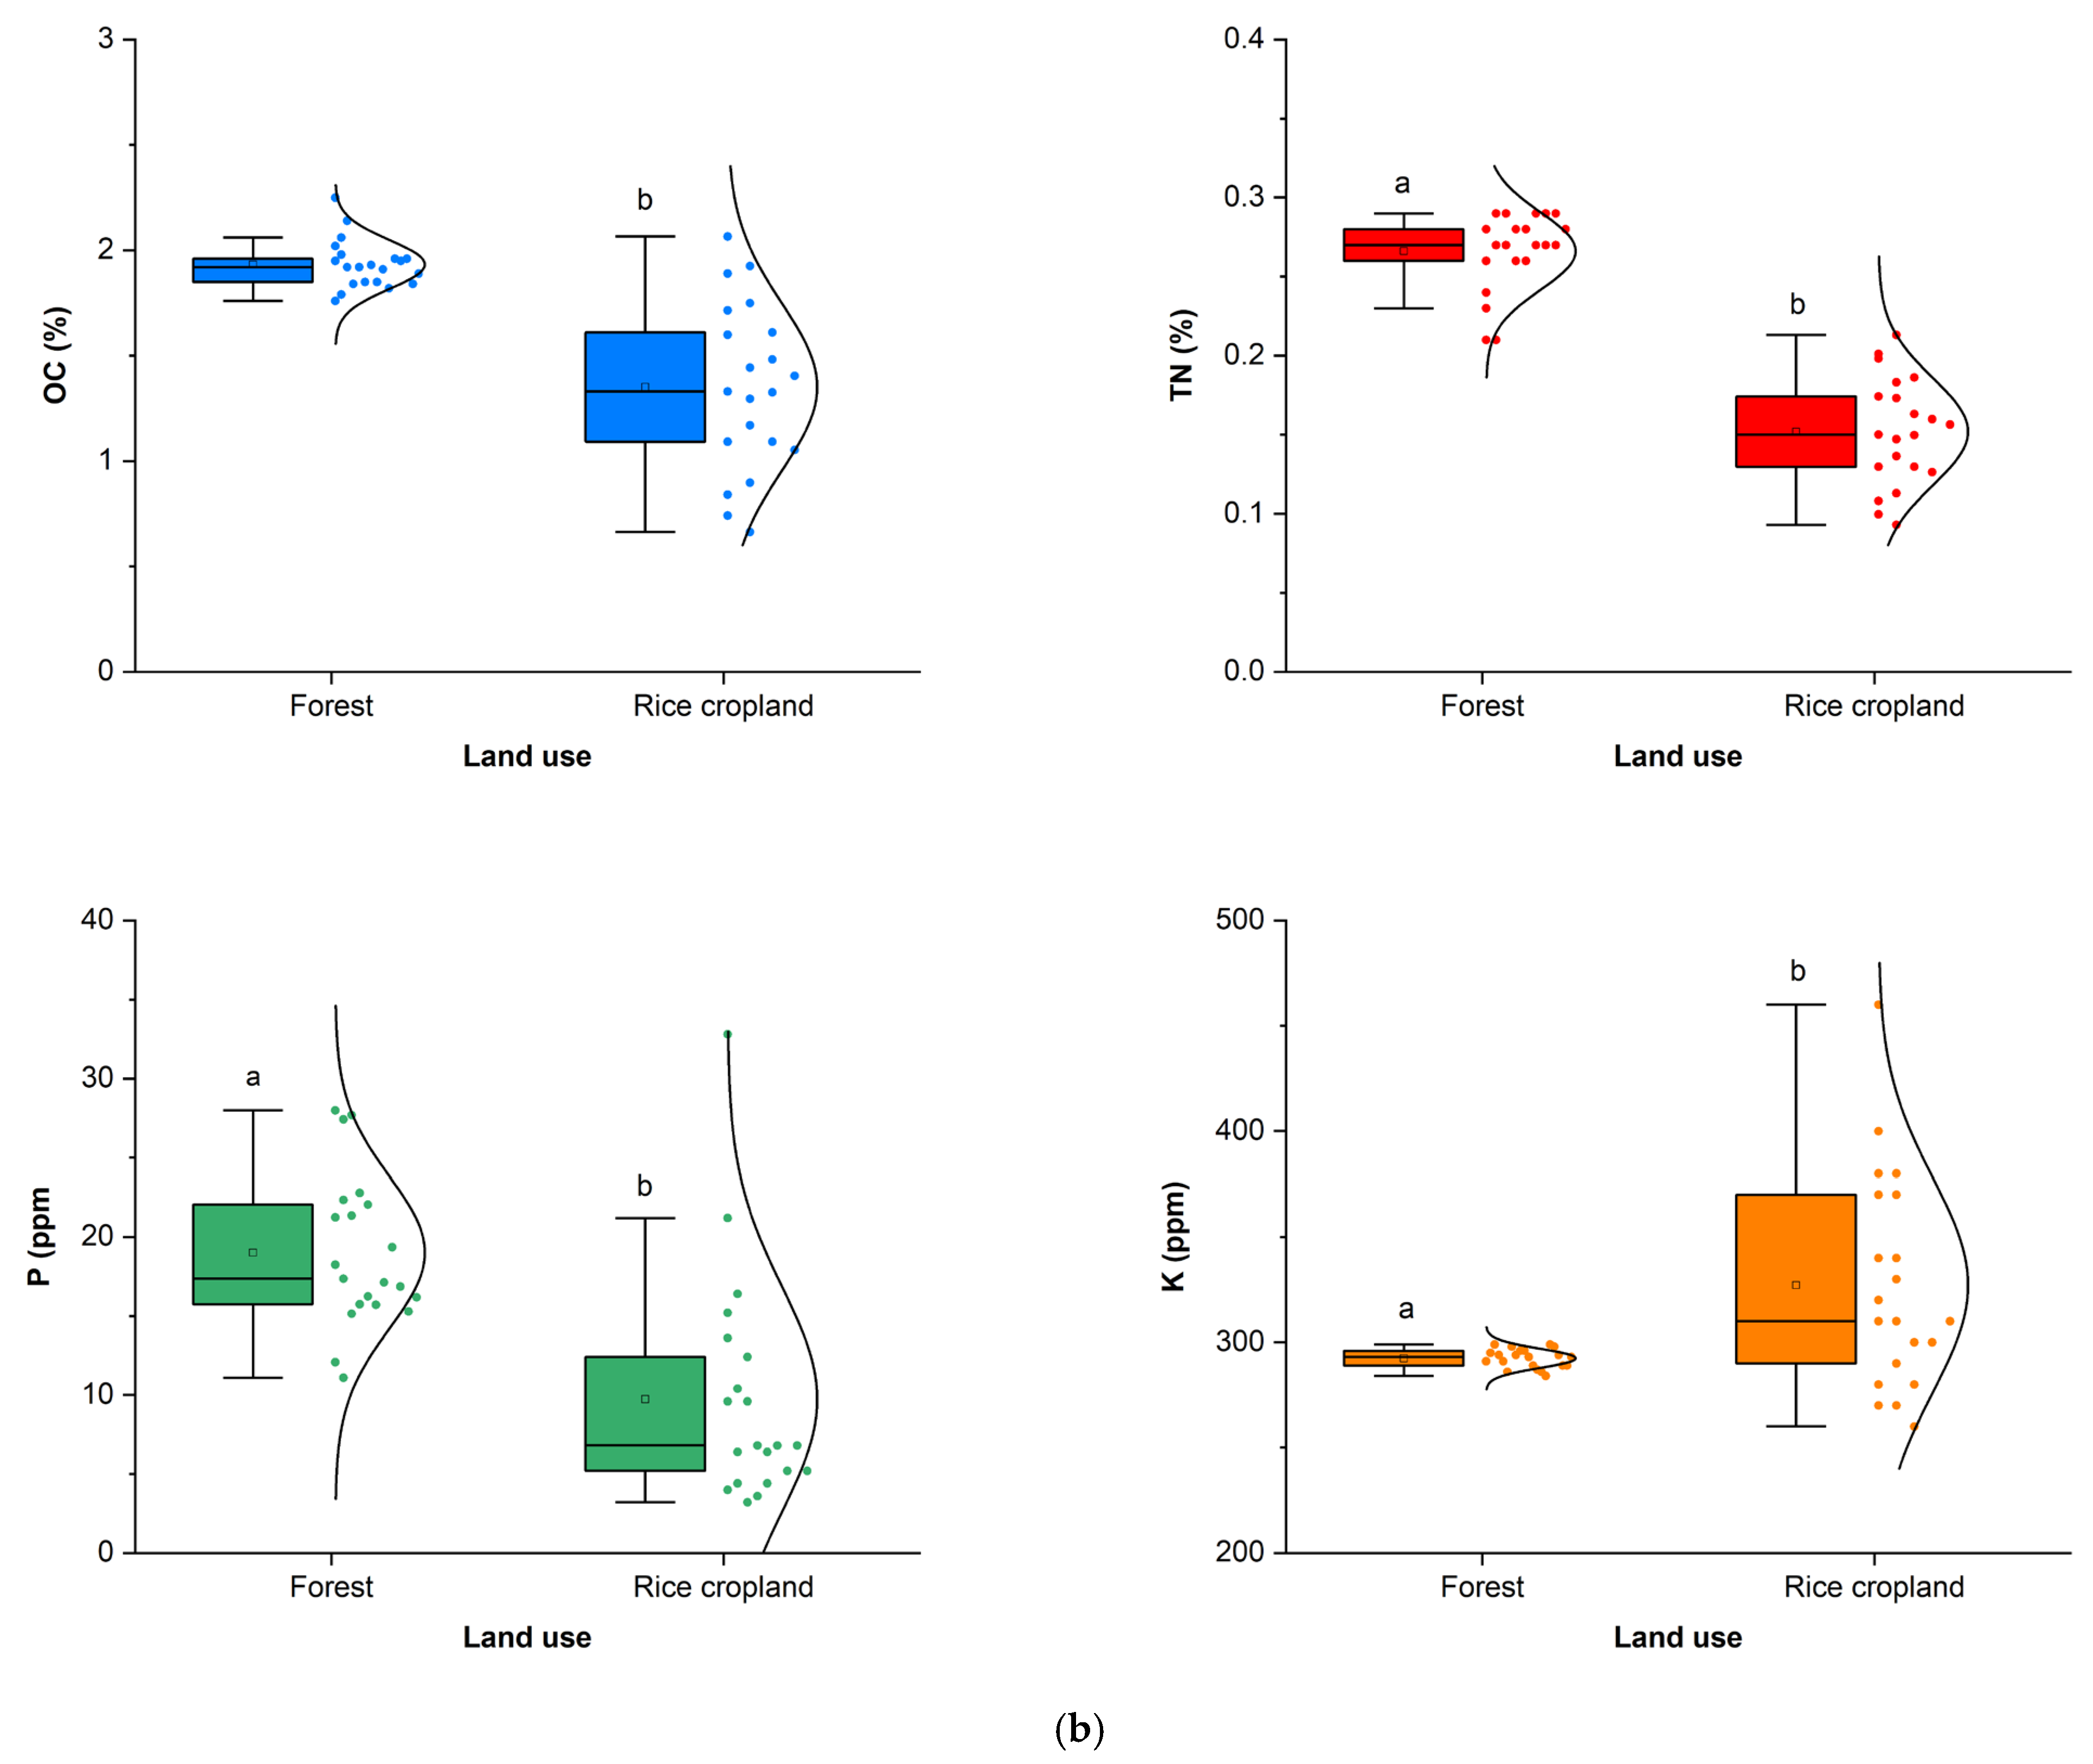
The highest OC was found in the forest soil (1.93 ± 0.12%), while it was much lower in the rice paddy field (1.35 ± 0.40%). TN and P were in higher abundance in forestland (0.27 ± 0.02%, TN, and 19 ± 4.79 ppm, P) than in rice cropland (0.15 ± 0.03% and 9.73 ± 7.14 ppm, respectively), the latter showing instead higher K (293 ± 4.53 ppm against 327± 50.9 ppm in forestland) (Figure 3b). Finally, EC was the minimum in forestland (0.41 ± 0.08 dS/m) and maximum in rice cropland (1.15 ± 0.23 dS/m). The maximum CEC was measured in the forest soil (38.2 ± 2.01 cmol/kg), and it was much lower in the rice paddy field (32.3 ± 2.12 cmol/kg) (Figure 3c). From the scatterplots of Figure 3, it is worth noting that all soil properties show a greater variability in the rice croplands compared to the forest sites, especially WSA, EC, OC, K and Zn.

3.2. Discrimination in Soil Properties Between the Two Land Uses

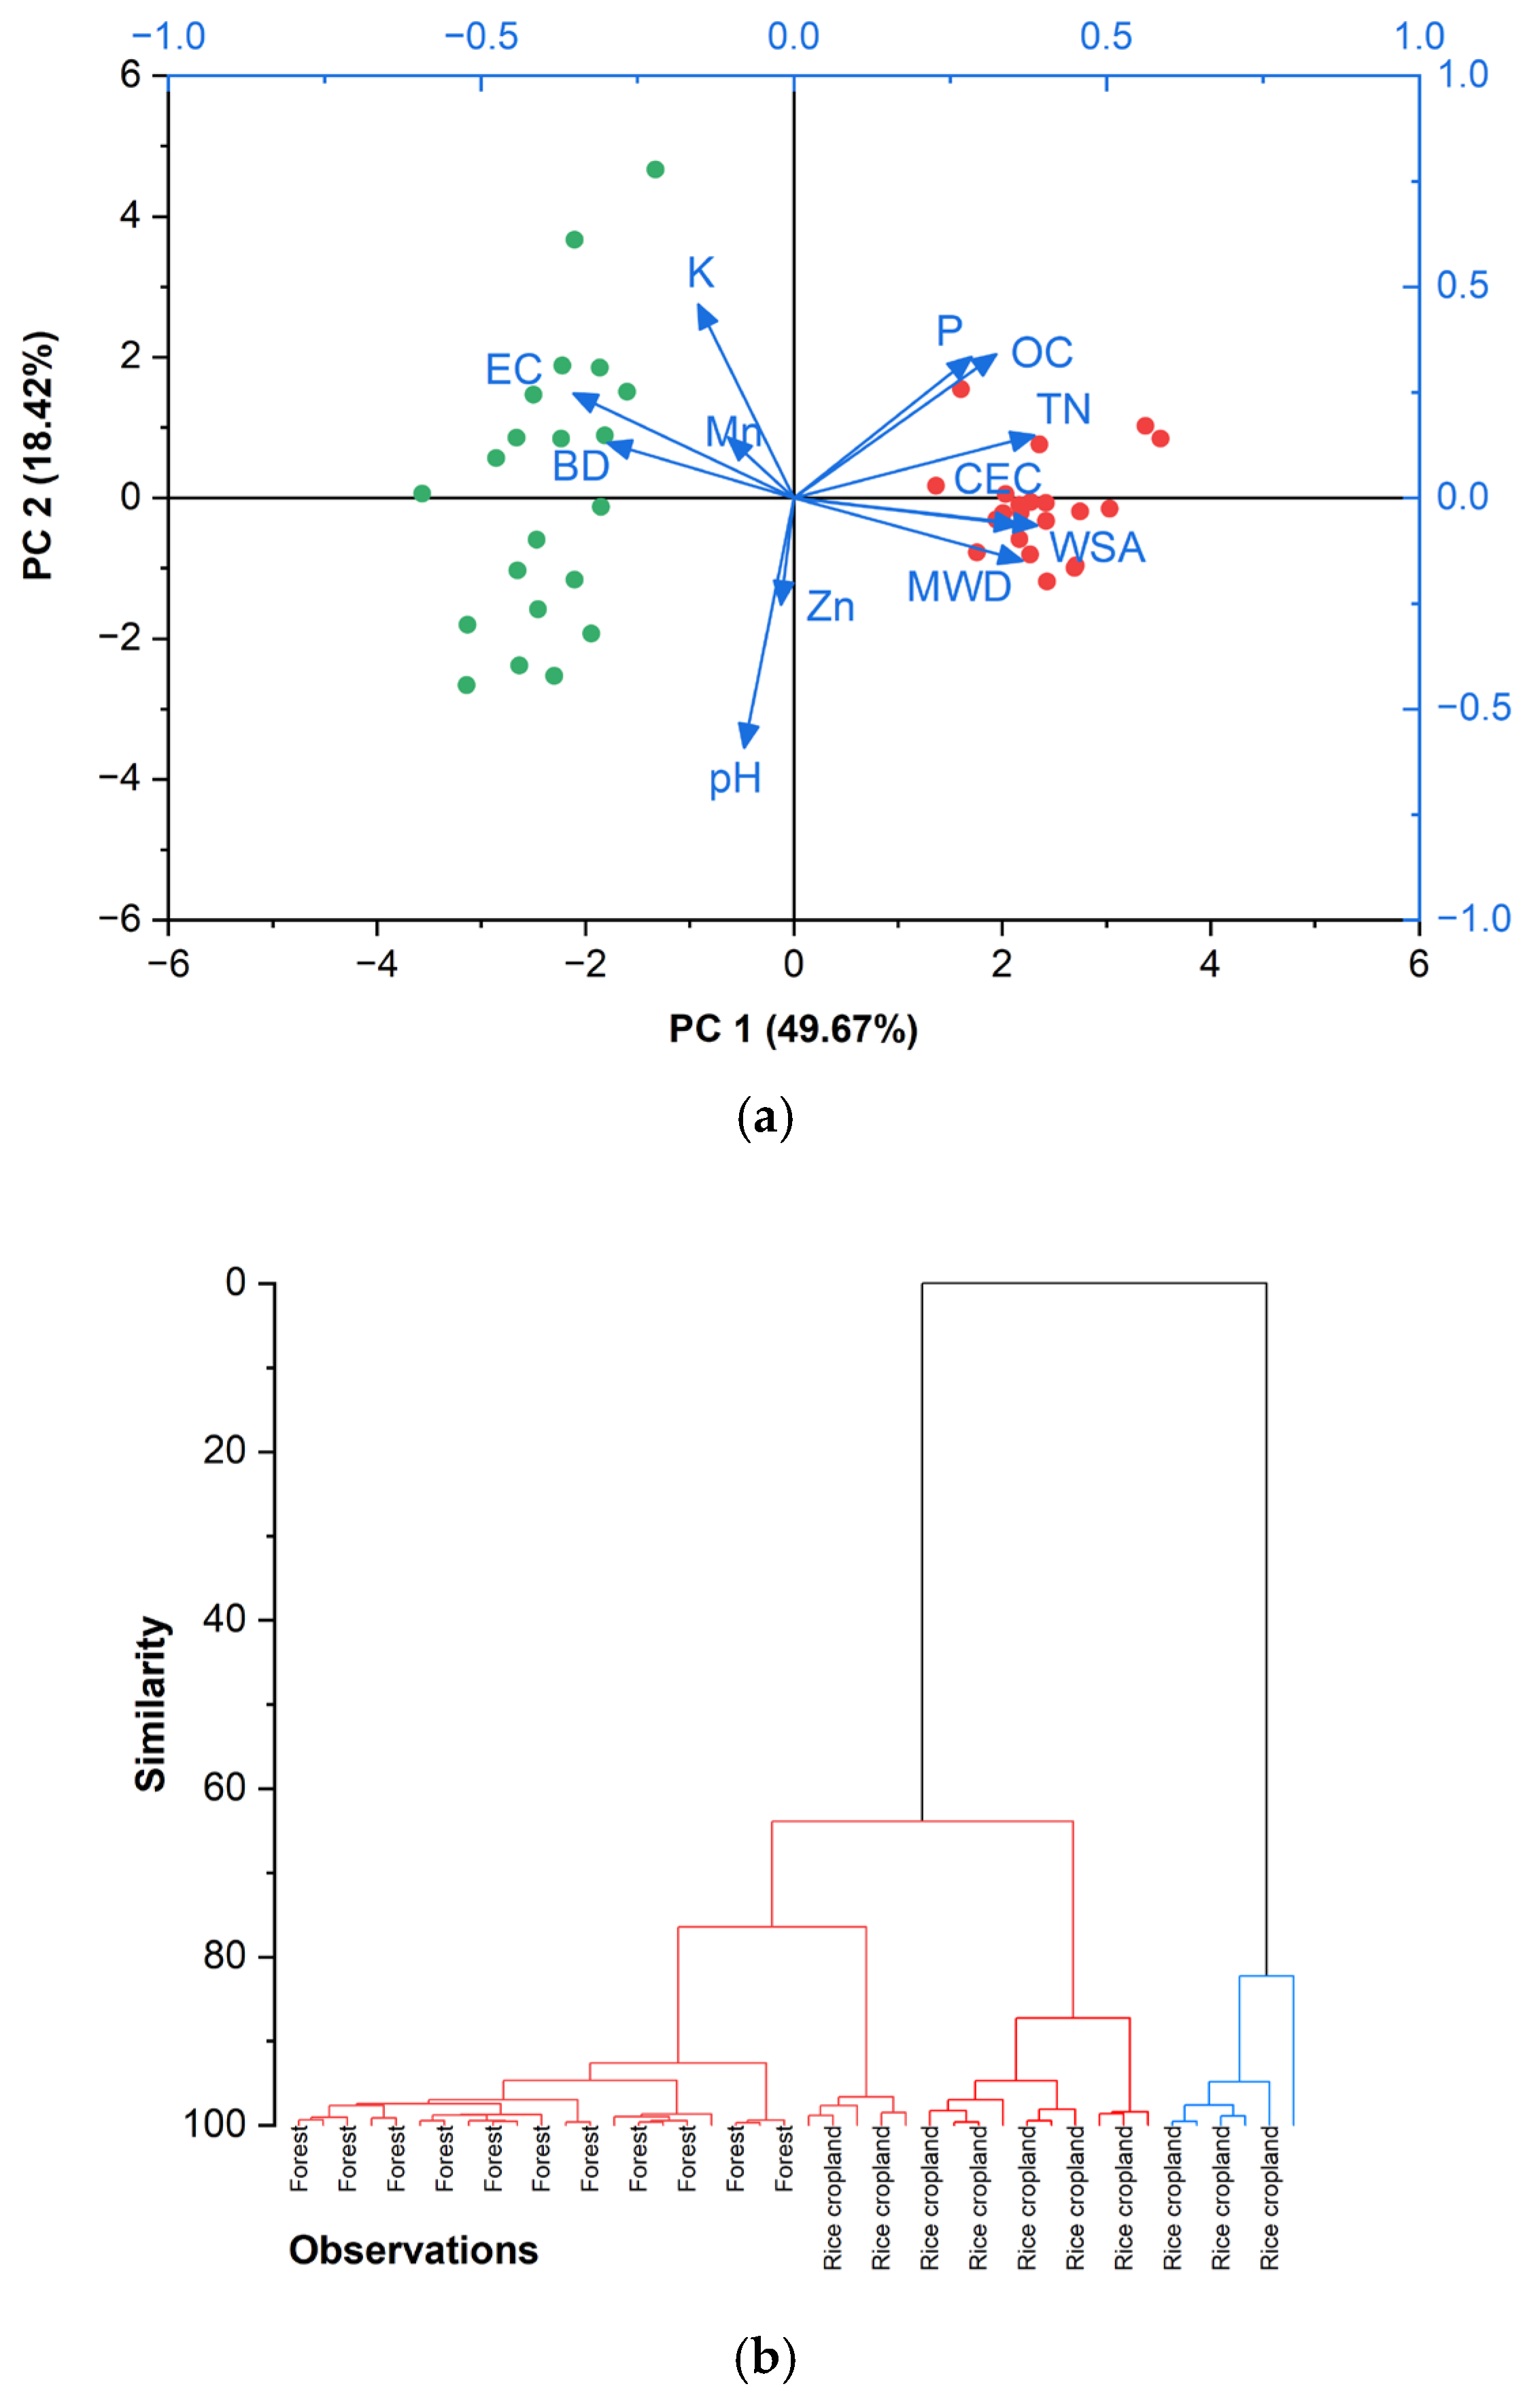
The PCA gave two Principal Components which together explained 68.1% of the total variance of the original variables (49.7% for PC1 and 18.4% for PC2). PC1 was associated with higher loadings of MWD, WSA, BD, TN, EC, and CEC, while pH, K, and Zn had a higher influence on PC2; OC, P and Mn almost equally weighed on both PCs (Figure 4a). The AHCA clustered the soil samples in non-homogeneous groups in terms of soil properties. More specifically, all samples collected in forest soils were clustered at the highest level of similarity in one group, together with many soil samples of rice croplands. A second cluster contained only samples collected in a few sites with rice (Figure 4b).

3.3. Difference in the Soil Quality Index Between the Two Land Uses

The calculation of the SQI showed that all soil properties noticeably influenced the soil quality, except BD, P and Zn contents, as shown by the MDS method. The forestland showed a significantly (p < 0.001) higher SQI (2.45 ± 0.09) compared to rice cropland (1.58 ± 0.05), with the latter land use showing the largest variability in this index again (Figure 5).

4. Discussion

The main finding of this study is that replacing burned forestlands with rice crops induces significant changes in the physico-chemical properties of soils. This land use change determined a noticeable worsening of soil structure, as evidenced by a nearly 50% reduction in its size and stability of macro-aggregates. The high aggregate stability and low compaction are distinctive characteristics of forest soils, reflecting the strong associations between soil aggregation and organic carbon content [33], the latter being a key driver of soil structure [34]. Generally, organic matter acts as a cementation agent that flocculates particles and forms aggregates in soil [35]. As observed in our study, soil aggregate stability tends to decrease following the conversion from forest to rice cultivation. The variations in MWS and WSA in our study are in line with Zhu et al. [36], who showed that indices of soil aggregate stability are significantly affected by land use change. Another study [37] found that soils of paddy fields show lower mean weight and geometric mean diameters compared to natural soils. The deterioration of soil structure in rice croplands represents an adverse consequence of this land-use change. According to this author [37], in paddy fields, the reduction in aggregate stability may lead to decreased porosity and increased compaction of soils, potentially affecting water movement and root penetration. In this study [37], soils of rice croplands were more compact compared to forest soils (−5% in bulk density), and this result is in line with findings of other researchers. For instance, Hasanah et al. [38] measured an almost 2-fold bulk density in forest soils converted to cultivated lands.
The strong association between aggregate stability and organic matter content of soil is confirmed by this study. Rice cultivation led to a reduction in organic matter (−30%) and nutrient contents (−43% of TN and −49% of P) of the soil. The higher organic carbon content detected in forest land use can be the result of its accumulation due to root-derived contributions [39]. Mishra et al. [40] demonstrated that clearing peat forests for rice paddy fields alters nutrient/carbon dynamics, which are key mechanisms for post-conversion emissions. Significant losses in organic carbon and total nitrogen were measured by Beheshti et al. [41], following conversion of natural forests to rice croplands. Reyna-Bowen et al. [42] stated that, under high cover and production of plant and tree species on soil, as in forestlands, organic carbon content increases. According to Cao et al. [43], a reduction in soil organic carbon up to 85% may be observed in forests converted to rice croplands. These reductions are common after this land use change, as also stated by the study of Wei et al. [44]. This global meta-analysis reported that converting forests to agricultural land leads to an average loss in organic carbon content of soil from 45% to 98%. These reductions are observed both in the short (e.g., by approx. 40%, one year after converting dryland to paddy fields [45]) and long (e.g., after 40 years of rice cultivation, Ref. [46]). The lower organic carbon in rice fields is often linked to intensive agricultural practices [47] or altered carbon cycles [18]. The latter authors quantified the loss of carbon for methane production as a consequence of converting Indian mangroves to rice. Paddy fields are exposed to continued drying and wetting cycles, and these cycles create differences in the chemical and physical properties of paddy soils.
Regarding the dynamics of soil nutrients, again Cao et al. [43] reported a significant decrease (approx. 60%) in total nitrogen after land conversion from forest to rice, which was ascribed to the reduced input of organic compounds as well as to increased nitrogen leaching due to flooded conditions. Also, this decrease in nitrogen content of rice croplands could be due to the sequence of drying and wetting cycles, which results in anaerobic conditions of the soil. Phosphorus content, although sometimes initially increased through fertilisation, often declines over time due to leaching and reduced availability in paddy fields. For instance, Jiang et al. [48] found that prolonged rice cultivation in paddy fields resulted in a decrease in phosphorus content compared to other croplands or undisturbed soils.
In our rice fields, soil salinity increased by 180% and potassium by 12% compared to forest soils. Such increases in electrical conductivity and potassium are commonly associated with management practices in rice cultivation, particularly the application of fertilisers [49]. Fertiliser inputs alter the concentration of ions in the soil solution, thereby increasing EC [50]. In paddy soils, EC often rises due to the accumulation of soluble salts from both irrigation and fertilisation [51,52]. Moreover, the presence of significant variations in the levels of some soil characteristics in rice paddies (e.g., potassium, 11 times compared to forestlands) could be due to management heterogeneity. Farmers use varying amounts of chemical fertilisers for rice cultivation each year, which may cause large variability in soil nutrients. Since fertilisers vary in their proportions of nitrogen, phosphorus, and potassium, inconsistent application rates directly affect soil chemical composition [53]. Unfortunately, specific studies on EC changes and K dynamics after forest-to-rice conversion are limited, which could have confirmed this hypothesis.
CEC is considered one of the most important indicators of soil quality, given that plants absorb nutrient elements in the form of cations [54]. This soil property was noticeably affected by comparing two land uses, although less markedly (−16%) compared to the other soil properties. The CEC fate agrees with the findings of other research, which associates this property with soil organic carbon. Bi et al. [55] reported that soils with higher organic matter show higher CEC because of the formation of complexes between the negative ions and cations. In contrast, Msofe et al. [56] measured a decrease in CEC in rice farms compared to forested areas.
In contrast, the pH underwent a slight and non-significant change between forestland and rice fields. This absence of variations in soil pH could be due to the good buffering capacity of the soil and indicates favourable conditions for rice cultivation. Soil pH is a critical factor influencing nutrient uptake and distribution within rice plants. Very low or very high values of pH can be dangerous for the rice crop. For example, Huang et al. [57] reported that high soil pH decreased rice yield, shoot weight and nutrient contents. Liu et al. [58] found an increase in pH after forest conversion to paddy fields, which was ascribed to the increase in exchangeable cations after application of manure following deforestation.
The PCA calculated a Principal Component that is associated with the most noticeable changes in soil properties, namely the aggregate stability, salinity and contents of organic matter and nutrients. Therefore, this PC could be a synthetic measure of these changes. Some changes, however, were not able to sharply discriminate between the two land uses, as shown by AHCA. In other words, one would have expected that rice croplands and forestlands would be grouped in separate clusters, but this did not happen. Therefore, despite the clear differences between the two land uses (which are revealed by the analysis of the individual soil properties), some paddy soil samples are similar to those collected in forest sites, due to the overall similarity of their soil characteristics to forest soil. This means that the discrimination between the land uses after conversion is noticeable but not sharp. The comparison of land uses showed a severe decrease in overall soil quality in rice croplands compared to burned forests (−35% in SQI). This is in line with findings of Islam and Weil [59], who found soil quality degradation after conversion of a tropical forest to rice croplands. The calculation of this index attributed this noticeable variation primarily to the worsened structure of soil, decrease in TN and CEC, and increase in EC (influencing the PC1), while the variations in the other soil parameters (e.g., K and pH, associated with PC2) played a much lower role in the degradation of soil quality. The differences are entirely due to both characteristics of land use and legacy effects. Paddy soils have been continuously cultivated by farmers and not used for any other purposes. Moreover, the studied forestlands were protected areas that were used by people for nature-based recreation on holidays, and forest management operations were carried out by land managers.
Overall, these results highlight the noticeable impacts of converting burned forestlands to rice croplands on soil properties and their overall quality. Some studies reported other detrimental effects of this conversion: for instance, rice paddies are a significant source of methane, a potent greenhouse gas, since the flooded, anaerobic conditions promote the activity of methanogenic microbes [60]. Moreover, since rice is a water-intensive crop, the high water usage in its cultivation can strain water resources, and poor water management can lead to the degradation of water and soil quality [61]. Therefore, this human-induced change in land use must be avoided when possible [62]. It is imperative to implement sustainable land management practices to mitigate soil degradation and restore the pre-change quality. Since the land conversion process is usually regulated by specific laws, and forest ecosystems must be protected, a combination of water and soil management, and appropriate fertilisation practices is crucial for preserving both natural and productive ecosystems in Northern Iran. In this regard, Faoziyah et al. [63] emphasise the need for policy actions to balance the dual role of forest protection and rice production.
Specifically dealing with technical management, we suggest the application of organic amendments and fertilisers (avoiding mineral types, which can increase soil salinity), in order to supply the soil with organic matter and nutrients and preserve the good structure that is typical of forest soils. Nonetheless, application rates must be carefully managed to prevent undesirable outcomes, such as excessive nutrient leaching and potential groundwater contamination. For instance, organic compost and manure should be applied in a 2:1 ratio by doses of approximately 5 t/ha per year. Late winter represents the most suitable time for compost application in rice fields, as this timing enhances soil quality and promotes rice growth. In addition, continuous long-term monitoring of key soil properties (e.g., organic matter, pH, electrical conductivity) is strongly recommended to provide ‘early warning’ of soil degradation before irreversible damage occurs as a result of unsustainable rice cultivation.
This study has some limitations that must be acknowledged. First, soil samples were collected at a single time point and by shallow-depth sampling, which may not capture seasonal and spatial variability in soil properties. Future studies should, therefore, prioritise long-term monitoring of soil quality over multiple years to explore temporal changes and resilience mechanisms following land-use conversion. Moreover, this additional research should include subsoil layers to better understand processes of nutrient leaching, compaction, and salinisation. Extending similar studies to different agro-ecological zones under various climatic and geomorphological conditions will also be essential to evaluate the generalisability of our results and to guide region-specific management strategies. Second, the variability in agricultural practices among rice farmers (e.g., fertilisation, irrigation, tillage) may introduce heterogeneity not fully accounted for in our dataset. Third, only physical and chemical indicators were assessed, but no information was given about the biochemical properties of soil. For example, it would be interesting to analyse the composition and abundance of soil microbial species (bacteria and fungi) through microbiological data [64], which may show different soil microbiota characteristics. In this regard, Kumar et al. [65] reported that mangrove conversion into rice cultivation adversely affected the soil microbial diversity, thereby altering natural sustainability. About the biochemical properties of soil, Raiesi et al. [66] stated that enzyme activity shows more clearly the soil’s responses to paddy rice cultivation than in primary forests. These limitations may influence the generalisability of the results, but the observed patterns provide a strong basis for understanding the impacts of land-use conversion on soil quality in fire-affected regions.

5. Conclusions

The potential conversion of burned forestlands to rice croplands in Northern Iran resulted in a noticeable decline in structure, a reduction in organic matter (−30%) and nutrient contents (−43% of TN and −49% of P), and an increase in salinity in the studied soil. Other changes, although to a lesser extent, were recorded for potassium and cation exchange capacity. In contrast, soil pH was not affected by this land use change. The most noticeable variations in the aforementioned properties led to an evident soil quality degradation, quantitatively shown by the reduction in the Soil Quality Index (−35%) in paddy soils compared to the burned forest soils. Therefore, the working hypothesis about a clear difference in soil quality between the studied forest ecosystems and the rice fields can be substantially confirmed, but this distinction is not sharp, as shown by AHCA.
Overall, considering that soil structure and fertility are the most sensitive properties affected by converting forestlands to croplands, a cautious management of these soils is recommended. This includes the application of fertilisers and soil amendments based on organic substrates, aimed at restoring soil quality and preventing further degradation. Future work on paddy soils in Northern Iran and other environmental conditions should focus on a comprehensive assessment of soil quality, exploring a larger data set of soil properties and combining scientific and local knowledge for sustainable management in the case of conversion of forestlands to rice paddy fields. Some operational recommendations for land managers are the application of compost and organic amendments combined with conservation tillage, and applied in late winter to help improve soil quality and increase rice growth.

Author Contributions

Conceptualisation, M.P., S.B.J. and D.A.Z.; validation, S.B.J. and D.A.Z.; formal analysis, M.P. and D.A.Z.; investigation, S.B.J. and P.D.; data curation, M.P. and S.B.J.; writing—original draft preparation, M.P. and D.A.Z.; writing—review and editing, M.P., Z.G. and D.A.Z.; supervision, M.P., S.B.J. and D.A.Z.; project administration, M.P. and D.A.Z. All authors have read and agreed to the published version of the manuscript.

Funding

This research received no external funding.

Informed Consent Statement

Not applicable.

Data Availability Statement

The data presented in this study are available on request from the corresponding author.

Conflicts of Interest

The authors declare no conflicts of interest.

Appendix A

Table A1. Pearson’s correlation matrix of soil properties measuredon samples collected under the two land uses (forestlands and rice croplands in the study areas (Khortoum, Saravan and Saqalaksar parks, and Sangar district, Guilan Province, Northern Iran). Legend: PC1 and PC2 = first two Principal Components; OC = organic carbon; EC= electrical conductivity; BD = bulk density (BD); WSA = water stable aggregates; MWD = mean weighted diameter; TN = total nitrogen; P = phosphorus; K = potassium; Mn = manganese; Zn = zinc; CEC = cation exchange capacity; SQI = Soil Quality Index.
MWDWSABDpHECOCTNPKMnZnCEC
MWD10.85−0.63−0.02−0.860.580.800.47−0.53−0.100.030.74
WSA0.851−0.66−0.09−0.900.650.840.67−0.44−0.19−0.080.81
BD−0.63−0.661−0.050.64−0.51−0.62−0.310.220.25−0.11−0.61
pH−0.02−0.09−0.051−0.14−0.61−0.37−0.46−0.38−0.160.27−0.04
EC−0.86−0.900.64−0.141−0.42−0.67−0.430.590.240.09−0.76
OC0.580.65−0.51−0.61−0.4210.900.750.01−0.12−0.060.63
TN0.800.84−0.62−0.37−0.670.9010.72−0.22−0.23−0.070.79
P0.470.67−0.31−0.46−0.430.750.7210.050.07−0.130.52
K−0.53−0.440.22−0.380.590.01−0.220.051−0.02−0.17−0.25
Mn−0.10−0.190.25−0.160.24−0.12−0.230.07−0.0210.03−0.44
Zn0.03−0.08−0.110.270.09−0.06−0.07−0.13−0.170.0310.00
CEC0.740.81−0.61−0.04−0.760.630.790.52−0.25−0.440.001

References

  1. Yan, X.; Liu, M.; Zhong, J.; Guo, J.; Wu, W. How Human Activities Affect Heavy Metal Contamination of Soil and Sediment in a Long-Term Reclaimed Area of the Liaohe River Delta, North China. Sustainability 2018, 10, 338. [Google Scholar] [CrossRef]
  2. Sun, W.; Li, S.; Zhang, G.; Fu, G.; Qi, H.; Li, T. Effects of climate change and anthropogenic activities on soil pH in grassland regions on the Tibetan Plateau. Glob. Ecol. Conserv. 2023, 45, e02532. [Google Scholar] [CrossRef]
  3. Salgado, L.; Alvarez, M.G.; Díaz, A.M.; Gallego, J.R.; Forján, R. Impact of wildfire recurrence on soil properties and organic carbon fractions. J. Environ. Manag. 2024, 354, 120293. [Google Scholar] [CrossRef] [PubMed]
  4. Parhizkar, M.; Lucas-Borja, M.E.; Zema, D.A. Rill Erosion Due to Wildfire or Deforestation in Forestlands of Northern Iran. Forests 2024, 15, 1926. [Google Scholar] [CrossRef]
  5. Sutanto, S.J.; Vitolo, C.; Napoli, C.D.; D’Andrea, M.; Van Lanen, H.A.J. Heatwaves, droughts, and fires: Exploring compound and cascading dry hazards at the pan-European scale. Environ. Int. 2020, 134, 105276. [Google Scholar] [CrossRef] [PubMed]
  6. Parhizkar, M.; Cerdà, A. Modelling effects of human-caused fires on rill detachment capacity based on surface burning of soils in forest lands. J. Hydrol. 2023, 624, 129893. [Google Scholar] [CrossRef]
  7. Zafar, S.; Jianlong, X. Recent Advances to Enhance Nutritional Quality of Rice. Rice Sci. 2023, 30, 523–536. [Google Scholar] [CrossRef]
  8. Zhang, H.; Li, X.; Zhou, J.; Wang, J.; Wang, L.; Yuan, J.; Xu, C.; Dong, Y.; Chen, Y.; Ai, Y.; et al. Combined Application of Chemical Fertilizer and Organic Amendment Improved Soil Quality in a Wheat–Sweet Potato Rotation System. Agronomy 2024, 14, 2160. [Google Scholar] [CrossRef]
  9. Pielke, R.A., Sr.; Pitman, A.; Niyogi, D.; Mahmood, R.; McAlpine, C.; Hossain, F.; Goldewijk, K.K.; Nair, U.; Betts, R.; Fall, S.; et al. Land use/land cover changes and climate: Modeling analysis and observational evidence. Wiley Interdiscip. Rev. Clim. Change 2011, 2, 828–850. [Google Scholar] [CrossRef]
  10. Gaitanis, A.; Kalogeropoulos, K.; Detsis, V.; Chalkias, C. Monitoring 60 years of land cover change in the Marathon Area, Greece. Land 2015, 4, 337–354. [Google Scholar] [CrossRef]
  11. Strandberg, G.; Kjellström, E. Climate impacts from afforestation and deforestation in Europe. Earth Interact. 2019, 23, 1–27. [Google Scholar] [CrossRef]
  12. Parcerisas, L.; Marull, J.; Pino, J.; Tello, E.; Coll, F.; Basnou, C. Land use changes, landscape ecology and their socioeconomic driving forces in the Spanish Mediterranean coast (El Maresme County, 1850–2005). Environ. Sci. Policy 2012, 23, 120–132. [Google Scholar] [CrossRef]
  13. Meneses, B.; Reis, E.; Pereira, S.; Vale, M.; Reis, R. Understanding driving forces and implications associated with the land use and land cover changes in Portugal. Sustainability 2017, 9, 351. [Google Scholar] [CrossRef]
  14. Krajewski, P.; Solecka, I.; Mrozik, K. Forest landscape change and preliminary study on its driving forces in Ślęża Landscape Park (Southwestern Poland) in 1883–2013. Sustainability 2018, 10, 4526. [Google Scholar] [CrossRef]
  15. Parhizkar, M.; Lucas-Borja, M.E.; Zema, D.A. Changes in rill detachment capacity after deforestation and soil conservation practices in forestlands of Northern Iran. Catena 2024, 246, 108405. [Google Scholar] [CrossRef]
  16. Louwagie, G.; Gay, S.H.; Sammeth, F.; Ratinger, T. The potential of European Union policies to address soil degradation in agriculture. Land Degrad. Dev. 2011, 25, 5–17. [Google Scholar] [CrossRef]
  17. Gzyl, J. Soil protection in central and eastern Europe. J. Geochem. Explor. 1999, 66, 333–337. [Google Scholar] [CrossRef]
  18. Chauhan, R.; Datta, A.; Ramanathan, A.L.; Adhya, T.K. Whether conversion of mangrove forest to rice cropland is environmentally and economically viable? Agric. Ecosyst. Environ. 2017, 246, 38–47. [Google Scholar] [CrossRef]
  19. Kottek, M.; Grieser, J.; Beck, C.; Rudolf, B.; Rubel, F. World Map of the Köppen-Geiger climate classification updated. Meteorol. Z. 2006, 15, 259–263. [Google Scholar] [CrossRef]
  20. Ghasemzadeh, Z.; Parhizkar, M.; Zomorodian, M.; Shamsi, S.; Shabanpour, M. The role of extracellular polysaccharide produced by Bradyrhizobium strain in root growth, improvement of soil aggregate stability and reduction of soil detachment capacity. Rhizosphere 2023, 27, 100771. [Google Scholar] [CrossRef]
  21. Gholoubi, A.; Emami, H.; Alizadeh, A.; Azadi, R. Long term effects of deforestation on soil attributes: Case study, Northern Iran. Casp. J. Environ. Sci. 2019, 17, 73–81. [Google Scholar]
  22. Gee, G.W.; Bauder, J.W. Particle-size analysis. In Methods of Soil Analysis, Part 1. Physical and Minerological Methods; Klute, A., Ed.; ASA-SSSA: Madison, WI, USA, 1986; pp. 383–411. [Google Scholar]
  23. Walkley, A.; Black, I.A. An examination of the Degtjareff method for determining soil organic matter and a proposed modification of the chromic acid titration method. Soil Sci. 1934, 37, 29–38. [Google Scholar] [CrossRef]
  24. Hesse, P.R. A Text Book of Soil Chemical Analysis; John Nurray Williams Clowes and Sons Ltd.: London, UK, 1971; p. 324. [Google Scholar]
  25. Radcliffe, D.E.; Simunek, J. Soil Physics with HYDRUS: Modeling and Applications; CRC Press: Boca Raton, FL, USA, 2018. [Google Scholar]
  26. Kemper, W.D.; Rosenau, R.C. Aggregate stability and size distribution. In Methods of Soil Analysis: Part 1 Physical and Mineralogical Methods; American Society of Agronomy: Madison, WI, USA, 1986. [Google Scholar]
  27. Bremner, J.M. Total nitrogen. In Methods of Soil Analysis, Part 2 Chemical and Microbiological Properties; American Society of Agronomy: Madison, WI, USA, 1982; Volume 10, pp. 594–624. [Google Scholar]
  28. Claessen, M.E.C. Manual for Methods of Soil Analysis; Embrapa Solos: Rio de Janeiro, Brazil, 1997. [Google Scholar]
  29. Chapman, H.D. Cation exchange capacity. In Methods of Soil Analysis; Black, C.A., Ed.; American Society of Agronomy: Madison, WI, USA, 1965; pp. 891–901. [Google Scholar]
  30. Andrews, S.S.; Karlen, D.L.; Mitchell, J.P. A comparison of soil quality indexing methods for vegetable production systems in Northern California. Agric. Ecosyst. Environ. 2002, 90, 25–45. [Google Scholar] [CrossRef]
  31. Wander, M.M.; Bollero, G.A. Soil Quality Assessment of Tillage Impacts in Illinois. Soil Sci. Soc. Am. J. 1999, 63, 961–971. [Google Scholar] [CrossRef]
  32. Lee Rodgers, J.; Nicewander, W.A. Thirteen ways to look at the correlation coefficient. Am. Stat. 1988, 42, 59–66. [Google Scholar] [CrossRef]
  33. Wu, J.; Teng, B.; Zhong, Y.; Duan, X.; Gong, L.; Guo, W.; Qi, P.; Haider, F.U.; Cai, L. Enhancing Soil Aggregate Stability and Organic Carbon in Northwestern China through Straw, Biochar, and Nitrogen Supplementation. Agronomy 2024, 14, 899. [Google Scholar] [CrossRef]
  34. Pan, Z.; Cai, X.; Bo, Y.; Guan, C.; Cai, L.; Haider, F.U.; Li, X.; Yu, H. Response of soil organic carbon and soil aggregate stability to changes in land use patterns on the Loess Plateau. Sci. Rep. 2024, 14, 31775. [Google Scholar] [CrossRef] [PubMed]
  35. Sarker, T.C.; Incerti, G.; Spaccini, R.; Piccolo, A.; Mazzoleni, S.; Bonanomi, G. Linking organic matter chemistry with soil aggregate stability: Insight from 13C NMR spectroscopy. Soil Biol. Biochem. 2018, 117, 175–184. [Google Scholar] [CrossRef]
  36. Zhu, G.Y.; Shangguan, Z.P.; Deng, L. Variations in soil aggregate stability due to land use changes from agricultural land on the Loess Plateau, China. Catena 2021, 200, 105181. [Google Scholar] [CrossRef]
  37. Lan, J. Changes of soil aggregate stability and erodibility after cropland conversion in degraded karst region. J. Soil Sci. Plant Nutr. 2021, 21, 3333–3345. [Google Scholar] [CrossRef]
  38. Hasanah, U.; Amami, A.A.; Amelia, R. Forest conversion to agricultural lands: Impact on soil physical characteristics. IOP Conf. Ser. Earth Environ. Sci. 2023, 1253, 012027. [Google Scholar] [CrossRef]
  39. Yang, X.; Wang, B.; Fakher, A.; An, S.; Kuzyakov, Y. Contribution of roots to soil organic carbon: From growth to decomposition experiment. Catena 2023, 231, 107317. [Google Scholar] [CrossRef]
  40. Mishra, S.; Page, S.E.; Cobb, A.R.; Lee, J.S.H.; Jovani-Sancho, A.J.; Sjögersten, S.; Jaya, A.; Aswandi; Wardle, D.A. Degradation of Southeast Asian tropical peatlands and integrated strategies for their better management and restoration. J. Appl. Ecol. 2021, 58, 1370–1387. [Google Scholar] [CrossRef]
  41. Beheshti, A.; Raiesi, F.; Golchin, A. Soil properties, C fractions and their dynamics in land use conversion from native forests to croplands in northern Iran. Agric. Ecosyst. Environ. 2012, 148, 121–133. [Google Scholar] [CrossRef]
  42. Reyna-Bowen, L.; Fernandez-Rebollo, P.; Fernández-Habas, J.; Gómez, J.A. The influence of tree and soil management on soil organic carbon stock and pools in dehesa systems. Catena 2020, 190, 104511. [Google Scholar] [CrossRef]
  43. Cao, R.; Chen, L.; Hou, X.; Lü, X.; Li, H. Nitrogen addition reduced carbon mineralization of aggregates in forest soils but enhanced in paddy soils in South China. Ecol. Process 2021, 10, 45. [Google Scholar] [CrossRef]
  44. Wei, X.; Shao, M.; Gale, W.; Li, L. Global pattern of soil carbon losses due to the conversion of forests to agricultural land. Sci. Rep. 2014, 4, 4062. [Google Scholar] [CrossRef]
  45. Cai, Y.; Xiao, J.; Liao, X.; Dong, Y.; Pan, B.; Zhang, L.; Xie, G.; Chen, Y.; Xie, Y. Dryland-to-Paddy Conversions Lead to Short-Term Decreases in Soil Organic Carbon and Carbon Pool Management Index in Karst Soil of Guizhou Province, China. Agriculture 2025, 15, 396. [Google Scholar] [CrossRef]
  46. Wang, C.; Zhao, Y.; Hao, S.; Chen, J.; Chen, S.; Liu, J.; Liu, H.; Zhu, X.; Li, X.; Zhang, A. Effects of composted straw, biochar, and polyacrylamide addition on soil permeability and dynamic leaching characteristics of pollutants in loessial soil in urban greenbelts according to indoor simulation experiments. Agronomy 2024, 14, 1958. [Google Scholar] [CrossRef]
  47. Valenzuela-Balcázar, I.G.; Visconti-Moreno, E.F.; Faz, Á.; Acosta, J.A. Soil Organic Carbon Dynamics in Two Rice Cultivation Systems Compared to an Agroforestry Cultivation System. Agronomy 2022, 12, 17. [Google Scholar] [CrossRef]
  48. Jiang, X.; Amelung, W.; Cade-Menun, B.J.; Bol, R.; Willbold, S.; Cao, Z.; Klumpp, E. Soil organic phosphorus transformations during 2000 years of paddy-rice and non-paddy management in the Yangtze River Delta, China. Sci. Rep. 2017, 7, 10818. [Google Scholar] [CrossRef]
  49. Atapattu, A.J.; Rohitha Prasantha, B.D.; Amaratunga, K.S.P.; Marambe, B. Increased rate of potassium fertilizer at the time of heading enhances the quality of direct seeded rice. Chem. Biol. Technol. Agric. 2018, 5, 22. [Google Scholar] [CrossRef]
  50. Yang, T.; Samarakoon, U.; Altland, J.; Ling, P. Influence of Electrical Conductivity on Plant Growth, Nutritional Quality, and Phytochemical Properties of Kale (Brassica napus) and Collard (Brassica oleracea) Grown Using Hydroponics. Agronomy 2024, 14, 2704. [Google Scholar] [CrossRef]
  51. Islam, M.N.; Islam, A.; Biswas, J.C. Effect of gypsum on electrical conductivity and sodium concentration in salt affected paddy soil. Int. J. Agric. Pap. 2017, 2, 19–23. [Google Scholar]
  52. Li, H.Y.; Shi, Z.; Webster, R.; Triantafilis, J. Mapping the three-dimensional variation of soil salinity in a rice-paddy soil. Geoderma 2013, 195, 31–41. [Google Scholar] [CrossRef]
  53. Xiao, Q.; He, B.; Wang, S. Effect of the Different Fertilization Treatments Application on Paddy Soil Enzyme Activities and Bacterial Community Composition. Agronomy 2023, 13, 712. [Google Scholar] [CrossRef]
  54. Sharma, A.; Weindorf, D.C.; Wang, D.; Chakraborty, S. Characterizing soils via portable X-ray fluorescence spectrometer: 4. Cation exchange capacity (CEC). Geoderma 2015, 239, 130–134. [Google Scholar] [CrossRef]
  55. Bi, X.; Chu, H.; Fu, M.; Xu, D.; Zhao, W.; Zhong, Y.; Wang, M.; Li, K.; Zhang, Y.-N. Distribution characteristics of organic carbon (nitrogen) content, cation exchange capacity, and specific surface area in different soil particle sizes. Sci. Rep. 2023, 13, 12242. [Google Scholar] [CrossRef]
  56. Msofe, N.K.; Sheng, L.; Li, Z.; Wang, L.; Msofe, N.K.; Msofe, N.K.; Sheng, L.; Li, Z.; Wang, L. Influence of agricultural land use change on the selected physico-chemical soil properties in kilombero valley floodplain, Southeastern Tanzania. Int. J. Environ. Sci. Nat. Resour. 2019, 21, 1–11. [Google Scholar] [CrossRef]
  57. Huang, L.; Liu, X.; Wang, Z.; Liang, Z.; Wang, M.; Liu, M.; Suarez, D.L. Interactive effects of pH, EC and nitrogen on yields and nutrient absorption of rice (Oryza sativa L.). Agric. Water Manag. 2017, 194, 48–57. [Google Scholar] [CrossRef]
  58. Liu, T.; Wu, X.; Li, H.; Alharbi, H.; Wang, J.; Dang, P.; Chen, X.; Kuzyakov, Y.; Yan, W. Soil organic matter, nitrogen and pH driven change in bacterial community following forest conversion. For. Ecol. Manag. 2020, 477, 118473. [Google Scholar] [CrossRef]
  59. Islam, K.R.; Weil, R.R. Land use effects on soil quality in a tropical forest ecosystem of Bangladesh. Agric. Ecosyst. Environ. 2000, 79, 9–16. [Google Scholar] [CrossRef]
  60. Ouyang, Z.; Jackson, R.B.; McNicol, G.; Fluet-Chouinard, E.; Runkle, B.R.; Papale, D.; Knox, S.H.; Cooley, S.; Delwiche, K.B.; Feron, S.; et al. Paddy rice methane emissions across Monsoon Asia. Remote Sens. Environ. 2023, 284, 113335. [Google Scholar] [CrossRef]
  61. Mallareddy, M.; Thirumalaikumar, R.; Balasubramanian, P.; Naseeruddin, R.; Nithya, N.; Mariadoss, A.; Eazhilkrishna, N.; Choudhary, A.K.; Deiveegan, M.; Subramanian, E.; et al. Maximizing Water Use Efficiency in Rice Farming: A Comprehensive Review of Innovative Irrigation Management Technologies. Water 2023, 15, 1802. [Google Scholar] [CrossRef]
  62. Parhizkar, M.; Shabanpour, M.; Lucas-Borja, M.E.; Zema, D.A.; Li, S.; Tanaka, N.; Cerdà, A. Effects of length and application rate of rice straw mulch on surface runoff and soil loss under laboratory simulated rainfall. Int. J. Sediment Res. 2021, 36, 468–478. [Google Scholar] [CrossRef]
  63. Faoziyah, U.; Rosyaridho, M.F.; Panggabean, R. Unearthing agricultural land use dynamics in Indonesia: Between food security and policy interventions. Land 2024, 13, 2030. [Google Scholar] [CrossRef]
  64. Ghasemzadeh, Z.; Parhizkar, M.; Mirmohammadmeygooni, S.; Shabanpour, M.; Chalmers, G. Forest soil inoculation with Bacillus subtilus reduces soil detachment rate to mitigate rill erosion. Rhizosphere 2023, 26, 100707. [Google Scholar] [CrossRef]
  65. Kumar, U.; Kaviraj, M.; Panneerselvam, P.; Nayak, A.K. Conversion of mangroves into rice cultivation alters functional soil microbial community in sub-humid tropical paddy soil. Front. Environ. Sci. 2022, 10, 858028. [Google Scholar] [CrossRef]
  66. Raiesi, F.; Beheshti, A. Soil specific enzyme activity shows more clearly soil responses to paddy rice cultivation than absolute enzyme activity in primary forests of northwest Iran. Appl. Soil Ecol. 2014, 75, 63–70. [Google Scholar] [CrossRef]
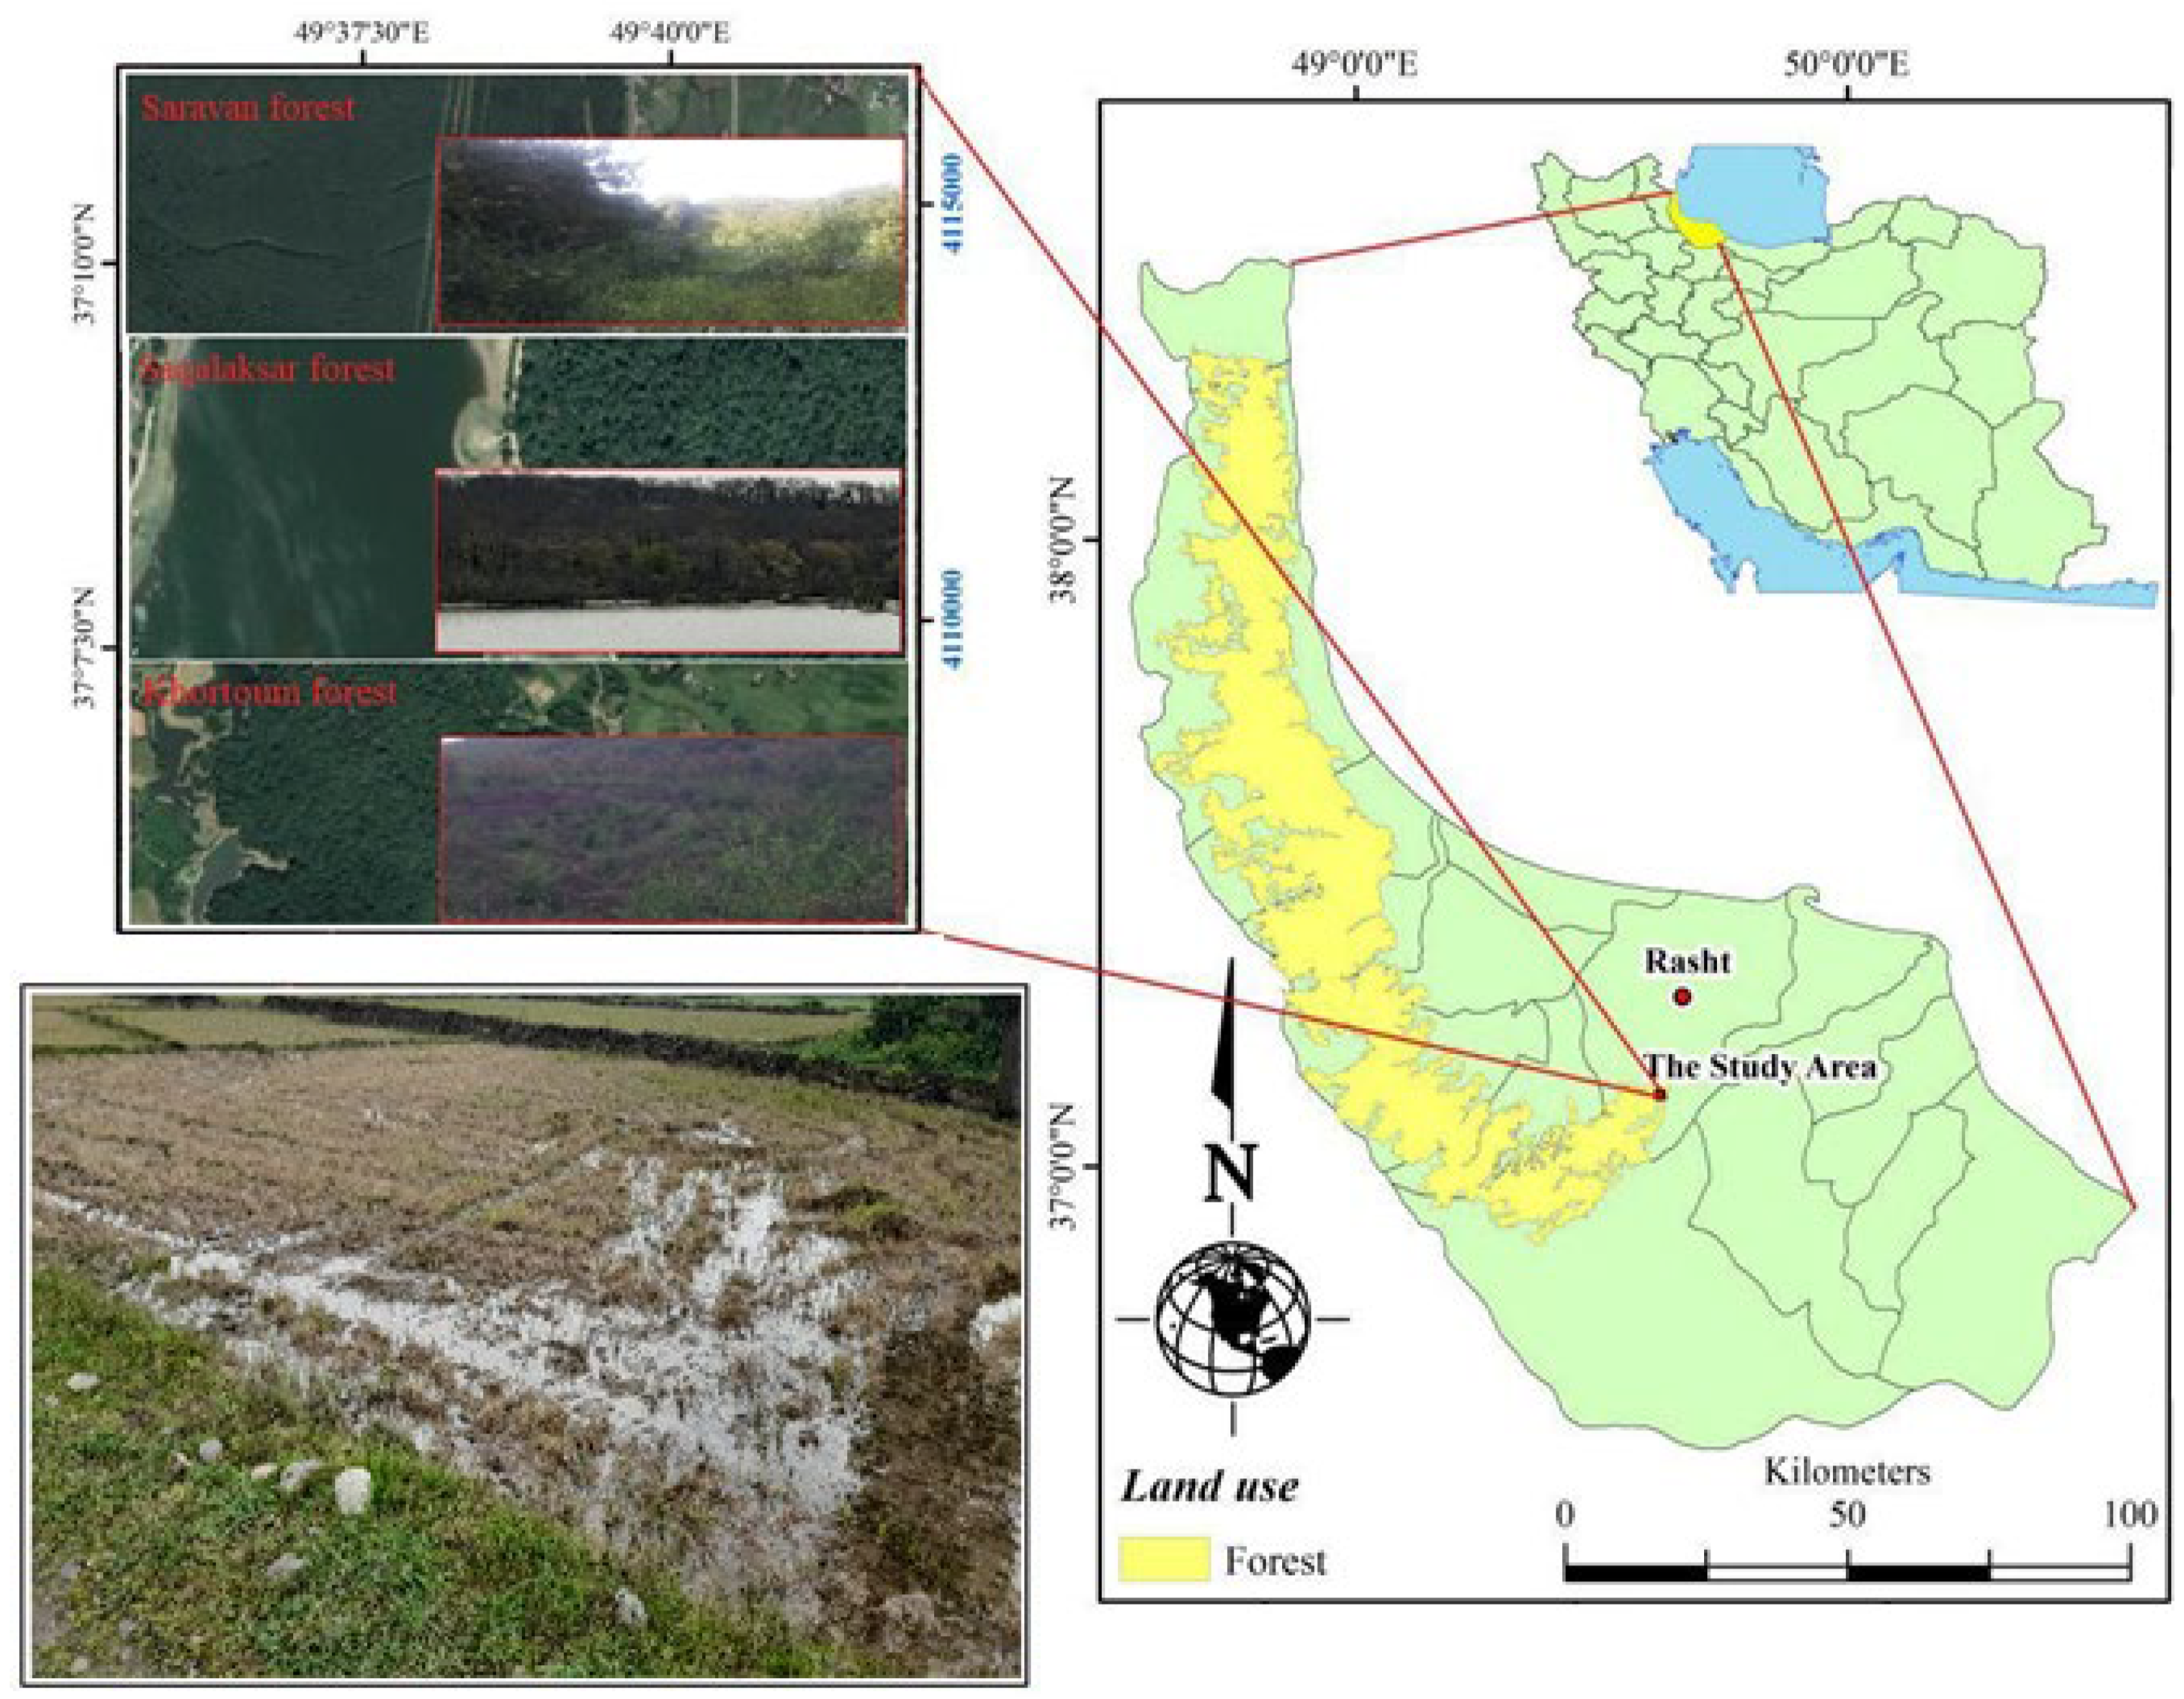
Figure 1. Location of the study areas (Khortoum, Saravan and Saqalaksar, GuilanProvince, Northern Iran) (right) and pictures of forestlands and rice croplands in paddy fields (left).
Resources 14 00141 g001
Figure 2. Different soil sampling layouts in the studied paddy fields and forestlands.
Resources 14 00141 g002
Figure 3. Scatterplots of soil properties (n = 21) measured in the forestland and rice cropland in the study areas (Khortoum, Saravan and Saqalaksar parks, and Sangar district, Guilan Province, Northern Iran). Legend: (a) MWD = mean weighted diameter; WSA = water stable aggregates; BD = bulk density (BD); (b) OC = organic carbon; TN = total nitrogen; P = phosphorus; K = potassium; (c) pH; EC= electrical conductivity; and (d) Mn = manganese; Zn = zinc; CEC = cation exchange capacity. Different letters indicate significant differences after Tukey’s tests (p < 0.01).
Resources 14 00141 g003aResources 14 00141 g003bResources 14 00141 g003cResources 14 00141 g003d
Figure 4. Biplot of Principal Component Analysis (a) and dendrogram provided by the Agglomerative Hierarchical Cluster Analysis (b) applied to original variables (soil properties) measured on samples collected under the two land uses (forestlands and rice croplands cropland in the study areas (Khortoum, Saravan and Saqalaksar parks, and Sangar district, Guilan Province, Northern Iran). Red and blue colours indicate the different clusters in the dendrogram. Legend: PC1 and PC2 = first two Principal Components; OC = organic carbon; EC= electrical conductivity; BD = bulk density (BD); WSA = water stable aggregates; MWD = mean weighted diameter; TN = total nitrogen; P = phosphorus; K = potassium; Mn = manganese; Zn = zinc; CEC = cation exchange capacity; SQI = Soil Quality Index.
Resources 14 00141 g004
Figure 5. Scatterplots of Soil Quality Index (SQI) calculated in the forestland and rice cropland in the study areas (Khortoum, Saravan and Saqalaksar parks, and Sangar district, Guilan Province, Northern Iran). Different letters indicate significant differences after Tukey’s tests (p < 0.01).
Resources 14 00141 g005
Table 1. Main characteristics of forestlands and rice croplands in the study areas (Khortoum, Saravan and Saqalaksar parks, and Sangar district, Guilan Province, Northern Iran).
CharacteristicsForestsRice Croplands
MorphologyAltitude (m a.s.l.)50 to 25030 to 150
Slope (%)1 to 3
ClimateMean precipitation (mm/yr)1360
Mean temperature (°C)16.3
SoilTextureSilty clay loamySilty clay
Sand content (%)1310
Silt content (%)5048
Clay content (%)3742
Disclaimer/Publisher’s Note: The statements, opinions and data contained in all publications are solely those of the individual author(s) and contributor(s) and not of MDPI and/or the editor(s). MDPI and/or the editor(s) disclaim responsibility for any injury to people or property resulting from any ideas, methods, instructions or products referred to in the content.