Article

Impact Assessment of Mining Dewatering on Vegetation Based on Satellite Image Analysis and the NDVI Index—A Case Study of a Chalk Mine

Faculty of Geoengineering, Mining and Geology, Wrocław University of Science and Technology, Wybrzeże Wyspiańskiego 27, 50370 Wrocław, Poland
*
Author to whom correspondence should be addressed.
Resources 2025, 14(9), 134; https://doi.org/10.3390/resources14090134
Submission received: 8 July 2025 / Revised: 18 August 2025 / Accepted: 22 August 2025 / Published: 26 August 2025

Abstract

The exploitation of mineral resources often necessitates groundwater drainage, which may impact surrounding ecosystems, particularly vegetation. In this study, the effects of passive drainage in the Kornica-Popówka chalk mine in eastern Poland were analyzed using Sentinel-2 satellite images and the NDVI vegetation index. Groundwater monitoring wells were used to delineate the extent of the depression cone, representing areas of potentially altered hydrological conditions. NDVI values were analyzed across multiple time points between 2023 and 2024 to assess the condition of vegetation both inside and outside the depression cone. The results indicate no significant difference in NDVI values during the 2023–2024 study period for this specific chalk mine case between areas affected and unaffected by the depression cone, suggesting that vegetation in this region is not experiencing stress due to lowered groundwater levels. This outcome highlights the influence of other environmental factors, such as rainfall and land use, and suggests that the local geological structure allows plants to maintain sufficient access to water despite hydrological alterations. This study confirms the utility of integrating remote sensing with hydrogeological data in environmental monitoring and underlines the need for continued observation to assess long-term trends in vegetation response to mining-related groundwater changes.

1. Introduction

The exploitation of natural resources is connected with various environmental impacts of mines. The change in water conditions results from the necessity to dewater the deposit (located in permeable rocks) to make the exploitation of the raw material possible. The scale of these impacts depends on many factors. The main ones include the following: the magnitude of mining-related hydrological impacts depends primarily on four interlinked factors: the geological framework of the ore body and its host rocks; their hydrogeological properties, notably hydraulic conductivity and drainage capacity; the extraction schedule and the resulting adjustment of the pit-dewatering system; and whether drainage is passive (gravity-driven), active (supported by pumping wells), or a hybrid system combining linear drains, trenches, and point dewatering wells.
This results in the formation of a cone of depression around the open pit, within the range of which hydrodynamic conditions may change and natural biological processes may be disrupted. An extreme example of the range of impact of open-pit dewatering on he aquatic environment are the areas of lignite open pits, around which large-area depression cones are recorded, which results from the lithology of the rocks surrounding the deposit as well as the depth of exploitation [1,2,3]. On the other hand, there are smaller mining plants where the mining depth is several dozen meters and the surrounding rocks have poor water permeability parameters, and the impact effect has a range of no more than several hundred meters around the excavation. The Kornica-Popówka mine represents such a case, distinguished by its passive drainage system, a limited depression cone extent of less than 1 km2, and an ecosystem dominated by low-value or already disturbed natural vegetation. This contrasts with large lignite mining operations that typically involve active groundwater pumping, extensive hydrological alterations, and impact on high-value natural habitats. Consequently, the Kornica-Popówka site offers a valuable example of how smaller-scale chalk mining interacts with local hydrogeology and vegetation, enabling insights into subtle environmental changes often overlooked in broader mining impact studies.
The mine’s depression cone is the area of lowered groundwater table in the aquifers affected by the mine’s drainage [4]. The area of lowered groundwater table can occur a short distance from the excavation, but in the case of favorable geological conditions and deep mining, it can reach a range of several kilometers [5].
This phenomenon may or may not cause a series of changes in the natural environment, including a lowering of the groundwater level, which results in difficulties in accessing water from wells by local communities and a deterioration of the condition of soils and vegetation. Soil drainage, if present in areas affected by depression cones, leads to destabilization of the soil, increases the risk of erosion, and prevents vegetation from growing. In the case of unfavorable geological conditions, this phenomenon also negatively affects water reservoirs, causing them to disappear as a result of surface water flowing towards the drainage center. The consequence of these processes is the disruption of ecosystems and the migration of species dependent on stable hydrological conditions [6].
Therefore, constant environmental monitoring is necessary to monitor the effects of mining activities and implement appropriate countermeasures in case of adverse changes [5]. Regular groundwater level measurements using monitoring wells allow the extent of the depression cone to be determined and the rate of its changes to be monitored [7].
Difficulties arise when it is necessary to determine the real quantitative and qualitative impact of the dewatering of the excavation and the existing depression cone on the natural environment at the surface. Accordingly, two practical questions must be addressed whenever an environmental decision is sought: to what extent pit dewatering alters the flow regime of nearby streams and ponds and whether the drawdown cone in the first aquifer compromises crop productivity or the vitality of natural vegetation.
Satellite observations have been helpful in recent years. Hydrological analysis of water bodies makes it possible to assess the impact of mining activities on the local water balance [8], and the use of satellite data, such as NDVI (plant health) indicators, helps to identify areas affected by drought and vegetation degradation [9]. In addition, quality control of groundwater and surface water helps to prevent contamination with harmful substances [10].
Environmental monitoring also includes a natural analysis to assess the impact of hydrogeological changes on biodiversity [11]. A comprehensive analysis of issues related to the impact of a mine excavation on water relations and, consequently, on biological life allows for a realistic determination of the extent of the impact of mining operations and for the proper conduct of proceedings for the issuance of an environmental decision, which is an essential document regulating the scope of the mine’s activities.
This article describes a case study of a chalk mine in eastern Poland, for which we have data on the level of the groundwater table in the first aquifer from observations made in monitoring wells. Based on these observations, the real extent of the impact of passive dewatering of the excavation was determined. This makes it possible to determine the boundary within which changes in vegetation growth intensity due to groundwater deficit can potentially be expected on the surface. The satellite data used (Sentinel) serves to verify the thesis, which for the selected case (chalk mine) is that “within the depression cone, there are deteriorated conditions for vegetation growth, which is evident in the lower NDVI index describing the health and quantity of vegetation in relation to areas outside the range of the depression cone, i.e., areas where no impact of drainage on water relations is observed”.

2. Materials and Methods

2.1. Study Area

The chalk deposit “Kornica-Popówka” is located between the villages of Stara Kornica, Wólka Nosowska, and Nowa Kornica, within the municipality of Stara Kornica, in the Łosice district, in the eastern part of the Masovian Voivodeship.
The excavation site is physiographically located in the Podlasie region, on the border of the Siedlce Upland and the Łuków Plain. The absolute altitudes range from 154 to 163 m above sea level within the boundaries of the open pit to about 175 m above sea level in the rest of the deposit.
Before mining operations began, the area was covered by low-grade arable land that did not require exclusion from agricultural production. Due to the poor soil quality, the land was only partially used for agriculture. Due to the presence of poor, mainly ruderal vegetation, the mine area does not have high natural value. There are no watercourses flowing through the deposit area.
Geologically, the area is located in the southwestern part of the East European Platform, within two Paleozoic structural units formed in the Variscan orogeny: the Podlasie Trough and the Łuków Block. In the axis of the maximum lowering of the glacitectonic depression, Cretaceous sediments occur at a depth of 149.0–152.0 m. In contrast, in the foreground of this depression, folded chalky formations overlain on Cenozoic sediments have been uplifted to the surface, forming parallel outcrop belts approximately 50–100 m wide.
The Quaternary sedimentary complex around the Cretaceous deposit consists of glacial and fluvioglacial formations from the following glaciations: southern Polish, central Polish, and northern Polish, as well as fluvioglacial, fluvial, and stagnant deposits of the Great Interglacial (Mazovian) and interstadial periods and the Holocene.
The area is located in the micro-catchment area of a tributary of the Klukówka River, a stream called “Dopływ spod Walimia”. The river is about 18.7 km long and has a catchment area of 58.4 km2. Its upper valley is up to 1.5 km wide, marshy, and deeply indented. In the 1970s and 1980s, the area was subjected to land improvement measures, including the regulation of the watercourse.
The “Kornica-Popówka” mine has a passive drainage system consisting of a ditch and a drainage channel, into which groundwater as well as rainwater and snowmelt from the entire mine flow. From the ditch, the water is pumped through a pipeline system into the Walimka river, outside the mine area.
After mining activities ceased in the 1990s, the groundwater and rainwater filled the excavation, creating a water reservoir. Based on geodetic measurements taken in May 2013, the water level in the excavation site stabilized at 163.00 m above sea level. This level was recognized as the natural groundwater level of the first aquifer when no passive drainage of the deposit is taking place.
Chalk, as a sedimentary rock, is characterized by low to medium hydraulic conductivity; for example, permeability typically ranges from 0.1 to 10 mD, corresponding to a hydraulic conductivity of 10−9–10−7 m/s [12], and in other measurements from 1 to 10 mD or 10−8–10−7 m/s [13]. Such properties slow the rate of groundwater decline, allowing plants to adapt through sustained capillary rise into the root zone. In addition, fine-textured soils (e.g., clay loams) have a higher field capacity—about 30–40% volumetric water content- compared to sandy soils (~20%) [14,15]. This combination of geological and pedological factors maintains root-zone moisture reserves even under fluctuating groundwater levels, explaining the absence of pronounced NDVI-based vegetation stress signals in the depression cone area.
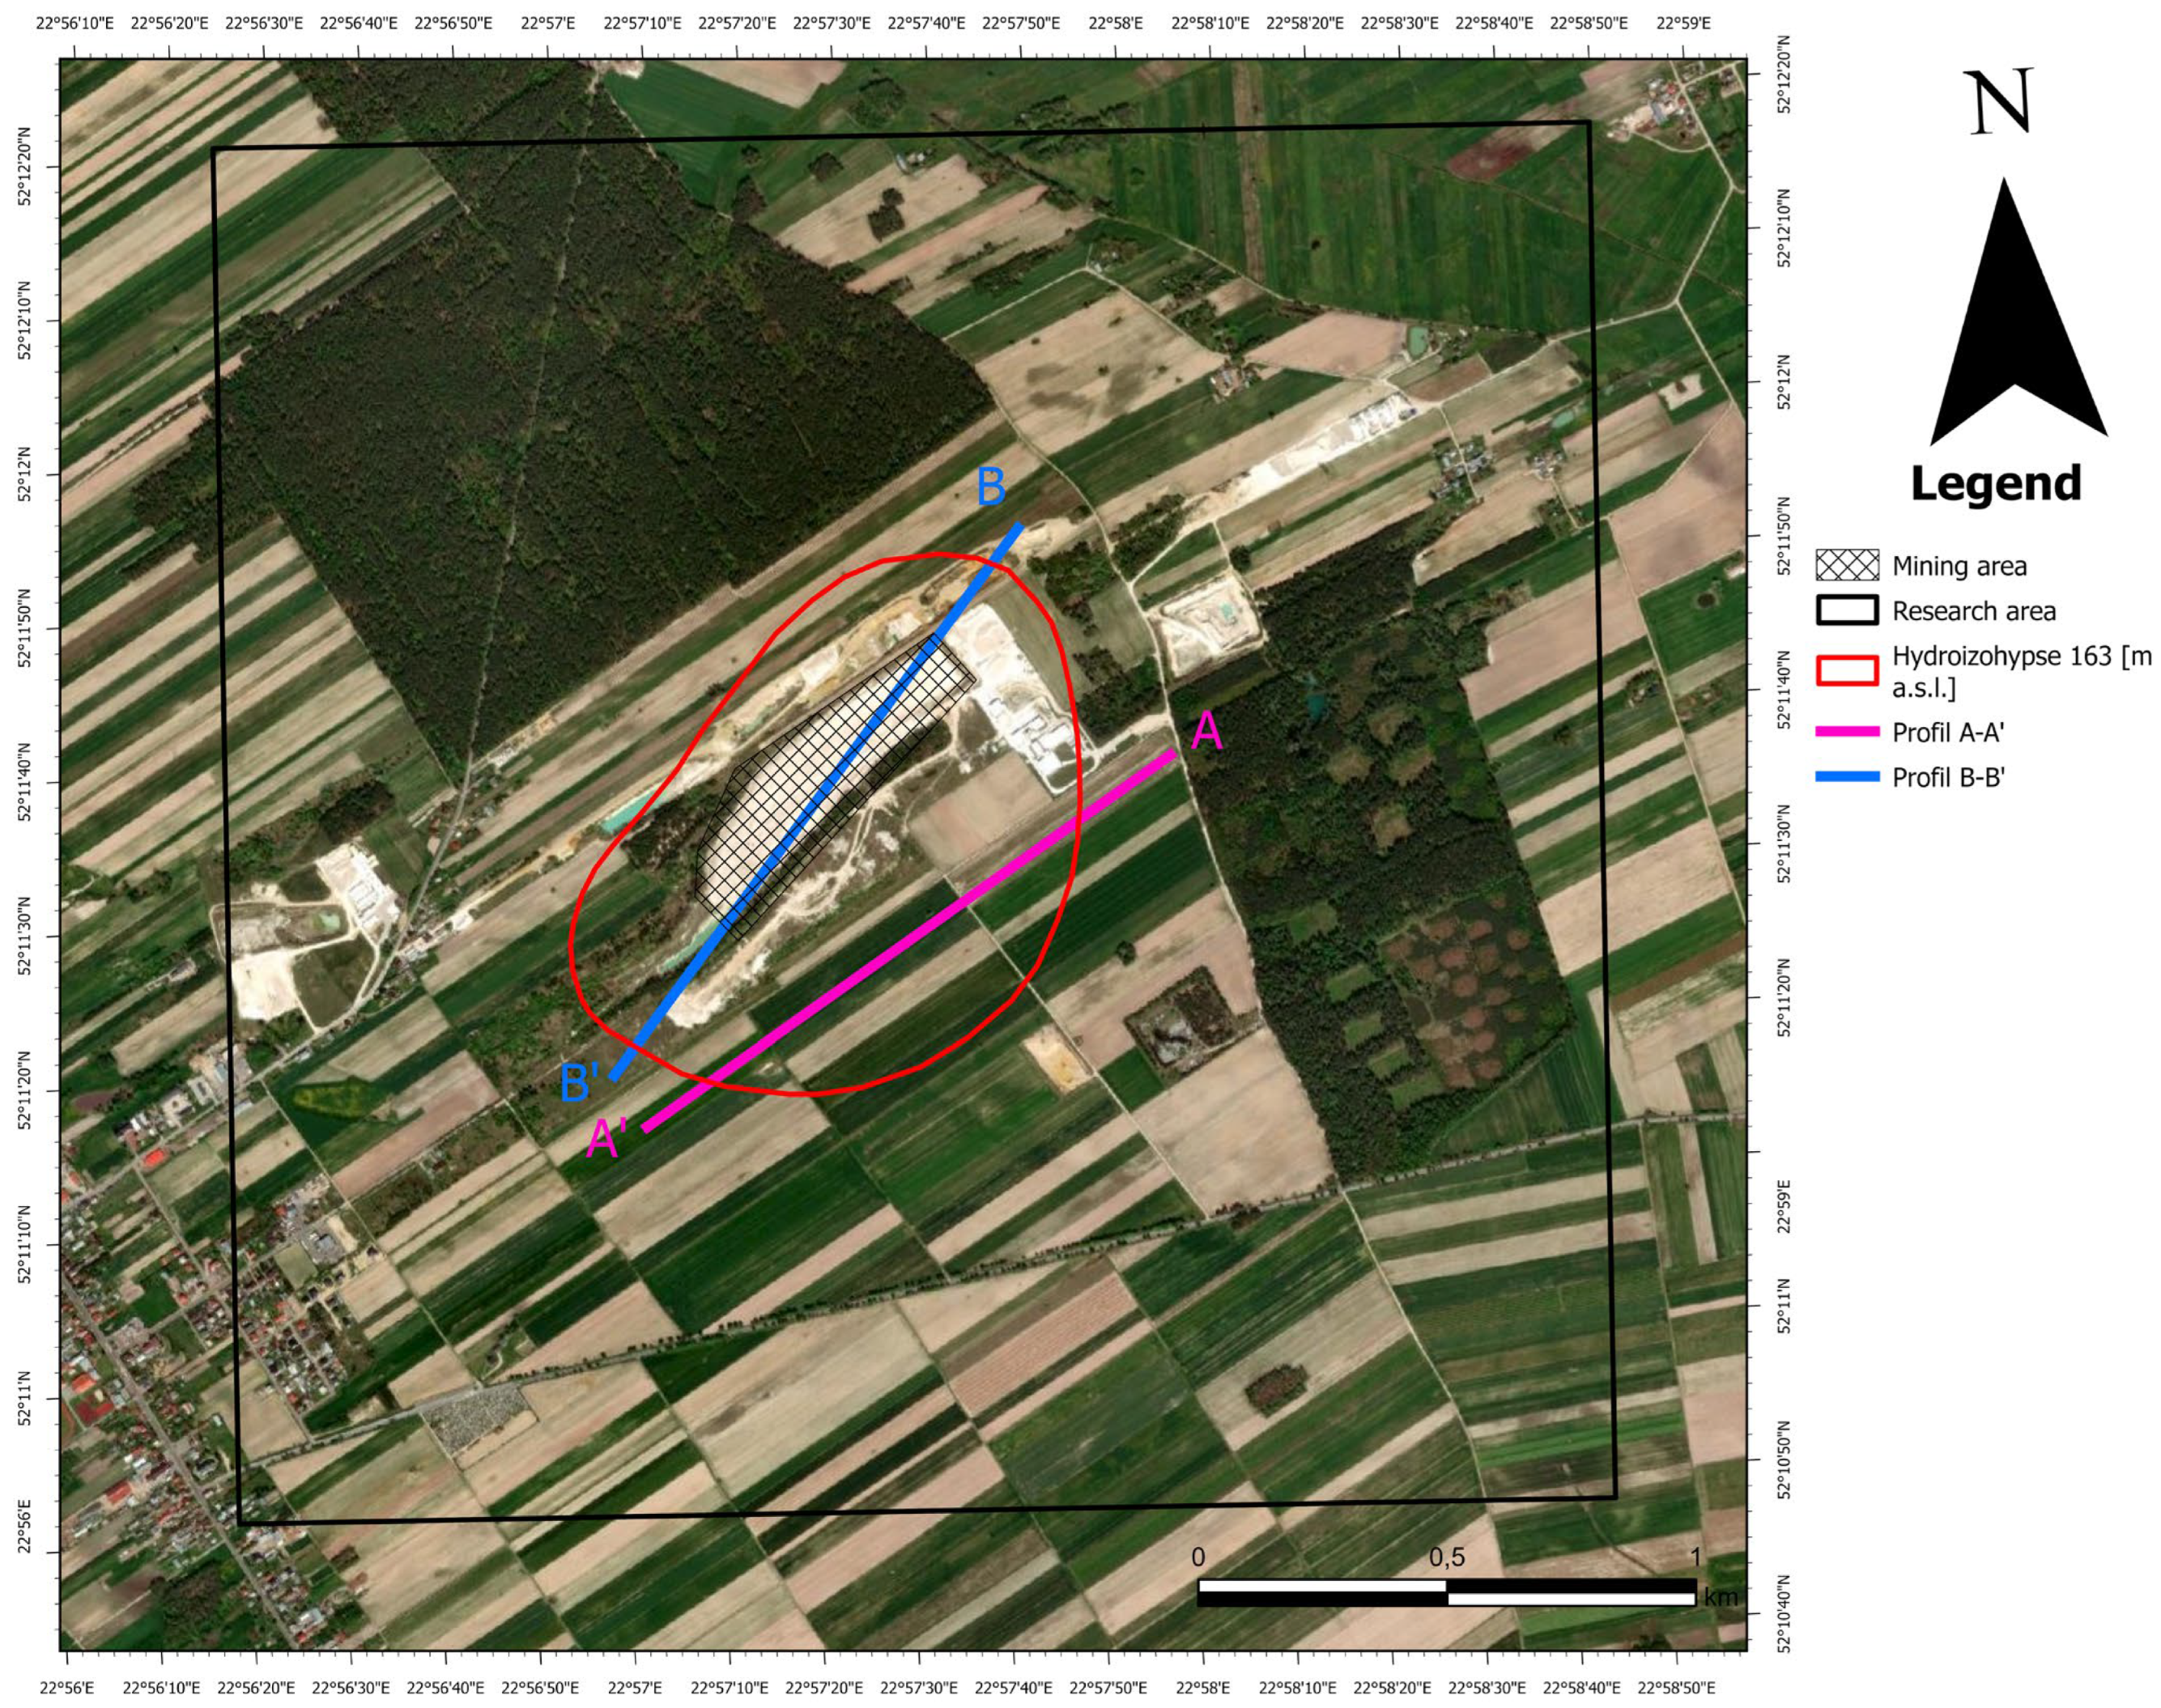
Determining the extent of a potential cone of depression based on measurements from the groundwater monitoring network is the most reliable and accurate method because it is based on real measurements. Measurements taken on 10.2023 were used to plot the groundwater table level of the first aquifer. A hydroisohypse with a value of 163 m above sea level (a.s.l.) was adopted as the maximum range of the potential impact of the mine. This value reflects the natural groundwater table level of the first aquifer that would prevail in the absence of mining operations [Figure 1].
The surface area of the designated potential impact area of the mine on groundwater is 639,424 m2 (0.64 km2). The area of the documented deposit is 11.650 ha, of which the mining area is 9.880 ha (as of 31 December 2023) [16]. The designated study area for the analysis of satellite images is 7.65 km2.

2.2. Application of Satellite Data

The Sentinel-2 program, part of the European Space Agency’s (ESA) Copernicus initiative, offers advanced imaging data from orbit that can be crucial for environmental monitoring. The Sentinel-2 mission relies on two satellites equipped with a multispectral imaging instrument (MSI) that allows analysis in 13 spectral bands, covering the visible, near-infrared (NIR), and shortwave infrared (SWIR) spectral regions. The spatial resolution of 10 to 60 m allows a very detailed study of the spatial variability of mine sites and their surroundings [17].
Level 2A products are produced by the Sen2Cor processor, which processes level 1C TOA data from a single day to produce surface reflectance (SR). Sen2Cor performs atmospheric correction by removing Rayleigh scattering, aerosol effects, and water vapor absorption, converting top-of-atmosphere (TOA) reflectance to surface reflectance (SR). Potential errors include residual cloud contamination, inaccurate aerosol estimation, and reflectance bias over bright or heterogeneous surfaces [18]. Sen2Cor results are divided into two types:
1. Radiometric—including surface reflectance (SR), aerosol optical thickness (AOT) and water vapor (WV) maps [18].
2. Cloud and scene classification—including a classification map that assigns a label to each pixel (e.g., vegetation, water, clouds, snow), as well as probabilistic masks for clouds and snow [18].
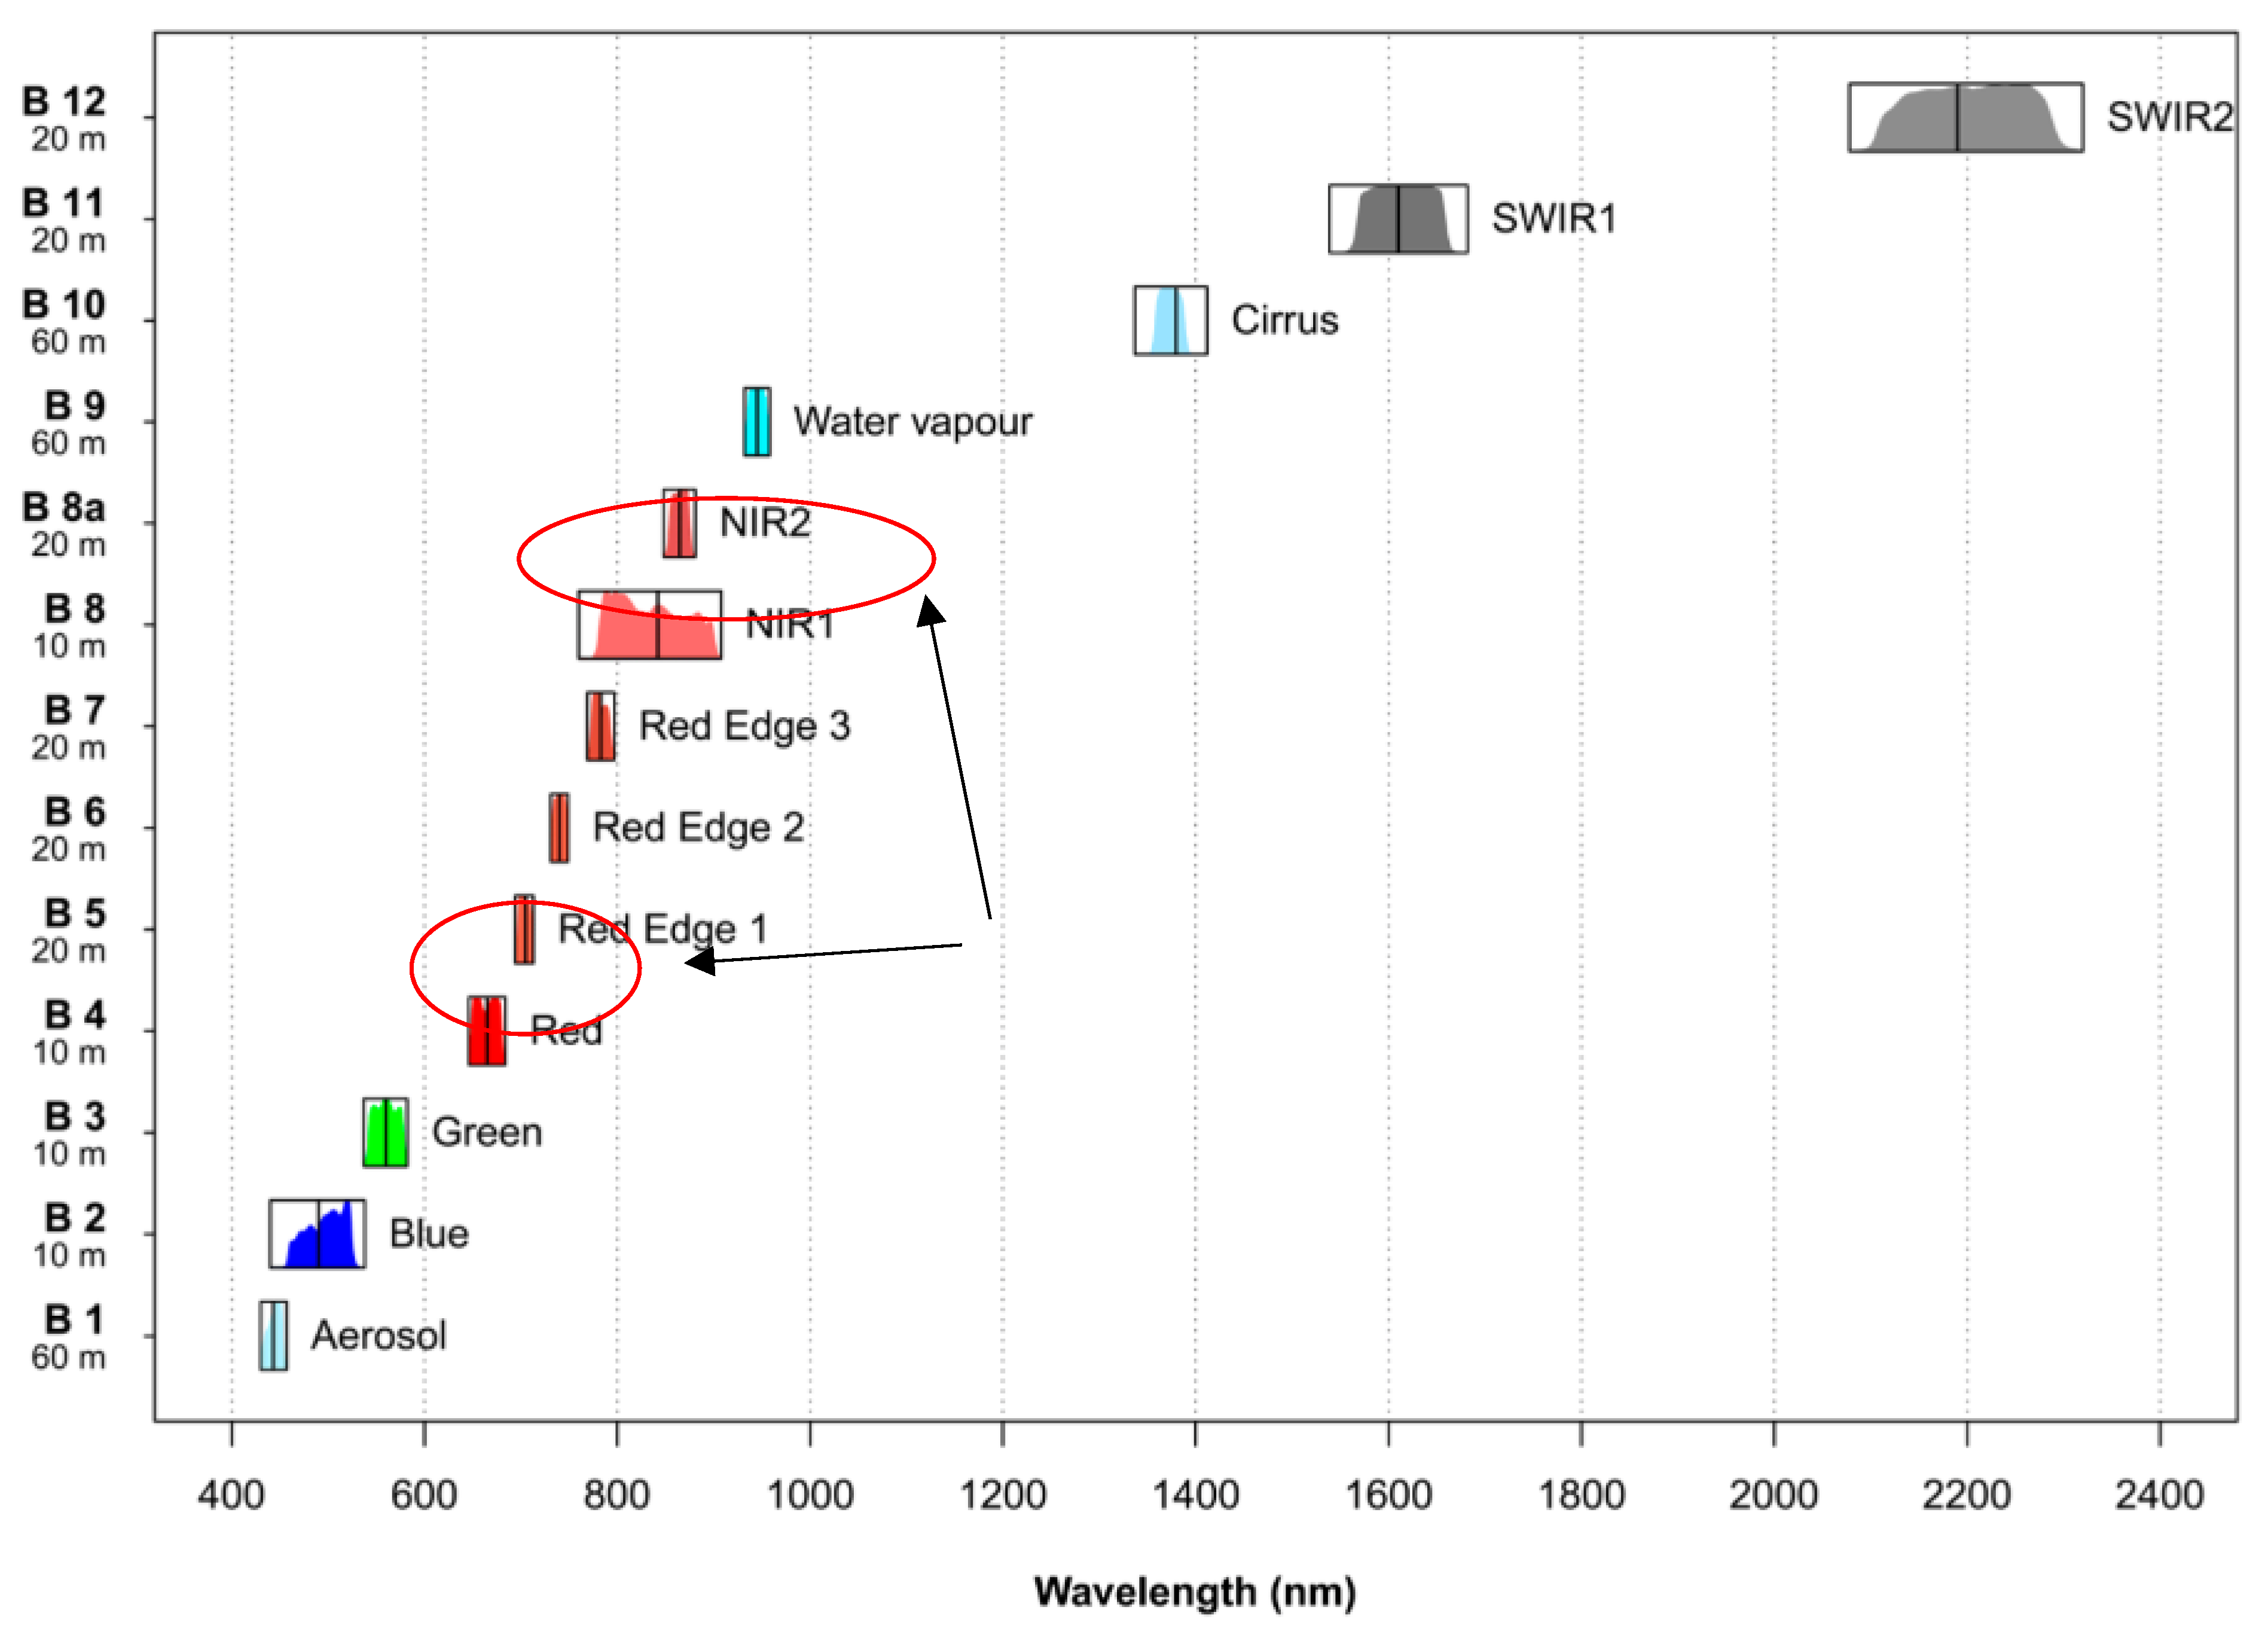
Figure 2 shows the characteristics of the multispectral instrument (MSI) on board Sentinel-2 and bands 8 and 4 that were used in this study.
In the context of mining operations, the Sentinel-2 satellite allows the calculation of indices such as the Normalized Difference Vegetation Index (NDVI), which can provide information on changes in vegetation cover and water content in areas around mine as shown in Equation (1).
NDVI—an index describing the health and quantity of vegetation, calculated as
N D V I = N I R R E D N I R + R E D
where NIR is the near-infrared reflectance value (band 8) and RED is the red reflectance (band 4). High NDVI values indicate lush and healthy vegetation, while low values suggest stress, degradation, or lack of vegetation cover [17].
NDVI values range from −1 to 1. NDVI values correspond to classifications into different classes, which may vary according to the studies of individual authors. The Polish Space Agency adopts a classification in which NDVI values close to −1 occur in areas covered by water. Values in the range −0.1 to 0.1 occur in areas of bare soil without vegetation cover. NDVI values in the range of 0.2 to 0.4 are characteristic of areas covered by vegetation that is in the early stages of development or in poor condition. NDVI values > 0.6 are considered an indicator of healthy vegetation with high vitality. In contrast, NDVI values close to 1 are characteristic of vegetation that is at its highest stage of development and in very good health [20]. In the work presented here, the following classification of NDVI index classes was adopted, which is shown in Table 1.
In this study, the NDVI-based classification scheme for land cover types was initially based on the ranges proposed in [17], which were developed for a different climatic and geographic context (Pakistan). It is acknowledged that NDVI thresholds may vary across regions and seasons due to differences in vegetation types, soil background, and atmospheric conditions. This introduces uncertainty when applying static NDVI classes across a multi-temporal dataset in a temperate European region.
Therefore, while the ranges from [17] provided a general reference framework, the interpretation of NDVI values in this study emphasized relative changes and spatial patterns rather than absolute land cover class labels. For instance, consistent seasonal trends (e.g., peak NDVI in summer and decline in winter) were analyzed for comparable vegetation types across space. However, future versions of this research will incorporate local calibration and field validation to establish more region-specific NDVI thresholds, particularly for distinguishing between sparse and dense vegetation classes.

2.3. Spatial Analysis

In the study reported here, the following algorithm was developed in the process of analyzing satellite images in assessing the impact of the presence of a potential depression cone on plant vegetation, as shown in Figure 3.
The spatial analysis was conducted using two complementary approaches to assess vegetation response within and outside the depression cone boundaries. Zonal analysis compared NDVI values between the area inside the depression cone (defined by the 163 m a.s.l. hydroisohypse) and control areas outside this boundary, where no hydrological impact from mining was observed. Profile analysis was performed along two transects: A-A’ (detailed description in Section 3.4, running parallel to the mining area through agricultural crops, and B-B’, running axially through the center of the “Kornica-Popówka” deposit. Both profiles cross the 163 m a.s.l. hydroisohypse marking the potential extent of the depression cone.

2.4. Technological Limitations and Minimization of Measurement Errors

The satellite images used in the study were selected so that the time difference between them and the piezometer measurements was reduced to the shortest possible gap. This made it possible to minimize differences due to temporal variability of hydrological phenomena and to obtain more reliable data correlation results. This choice of data is dictated by the technological limitations of the Sentinel-2 mission, which provides images at a certain frequency.
Sentinel-2 has a frequency of capturing images at the same location every 5 days under ideal conditions (for two satellites working together). This means that, in the study areas, the satellite data are updated at regular intervals, but do not always coincide directly with field survey dates [17].
Sentinel-2 satellites acquire images in the visible and infrared bands; consequently, cloud cover can obscure the study area and limit the usefulness of the scenes [21,22]. Because image acquisition is periodic, the temporal resolution may fail to capture hydrological phenomena that change rapidly over short periods [23]. Although the sensor provides good spatial detail at 10 m in its key spectral bands, some fine features of small local objects can still remain unresolved.

2.5. Image Processing and Quality Control

Image Selection Criteria: To ensure data quality and temporal consistency, satellite images were selected based on four primary criteria. The time gap between the satellite acquisition and the piezometric measurement was kept as small as possible to minimize discrepancies caused by hydrological variability. Cloud cover threshold was set at ≤30% over the study area, with individual visual assessment of each scene to verify actual coverage over the region of interest. Images were distributed across different seasons to capture phenological variability and avoid bias toward specific growth periods. Visual inspection was conducted for each candidate image to identify and exclude scenes affected by atmospheric artifacts such as haze, dust, or sensor anomalies.
Cloud Masking and Gap-Filling Algorithms: Cloud detection utilized the scene classification layer provided with Sentinel-2 L2A products, which assigns labels to each pixel including vegetation, water, clouds, and snow. Cloud shadow identification employed geometric relationships between cloud positions and solar angles, combined with spectral analysis to detect areas of reduced reflectance consistent with shadow patterns [24]. For pixels obscured by clouds or shadows, a simple interpolation algorithm was applied that assigned NDVI values based on the mean of neighboring unobscured pixels within a 3 × 3 window. NDVI values were normalized to the standard range of −1 to +1, as the raw Sentinel Hub output ranged from 0 to 10,000. For gap filling, obscured pixels were interpolated using the mean of the surrounding unobscured pixels in a 3 × 3 moving window (8-neighborhood). This approach preserves local spatial variability while minimizing edge artefacts. If more than 50% of pixels in the 3 × 3 neighborhood were also masked, the value was left as no-data to avoid propagating uncertainty. All reflectance values were normalized to the standard NDVI range of –1 to +1 after interpolation.
Validation of gap filling was performed by creating an artificial test mask over cloud-free reference scenes. In these masked areas, the gap-filling algorithm was applied and the resulting NDVI values were compared pixel-by-pixel against the original unmasked NDVI using the Root Mean Square Error (RMSE).
Across three reference dates (13 August 2023, 10 April 2024, 28 August 2024), the RMSE of the reconstructed NDVI remained in the range 0.021–0.034, indicating that the applied interpolation introduced only minor deviations from the true values. This is well below the NDVI seasonal variability amplitude in the study area (~0.3–0.4), confirming that the gap filling did not distort the spatial NDVI patterns relevant to our analysis.
Temporal Data Correlation: Long-term NDVI trends from 2016 to 2025 were analyzed to distinguish between seasonal phenological patterns and potential long-term impacts of mining dewatering. Baseline NDVI values were established for different land cover types (agricultural fields, forests, grasslands) in areas unaffected by mining to provide reference conditions for impact assessment.
These measures minimized the impact of technical limitations, enabling a reliable analysis of the impact of mining activities on the surrounding environment, including monitoring changes in groundwater levels and vegetation degradation in the area of the depression cone. The assumption of the study is that the obtained analysis may show that the decrease in NDVI coincides with the area of decreased water level in piezometers, which will clearly indicate the impact of the depression cone on groundwater and the vegetation covering the area.

3. Results

3.1. Satellite Image Dataset and Temporal Coverage

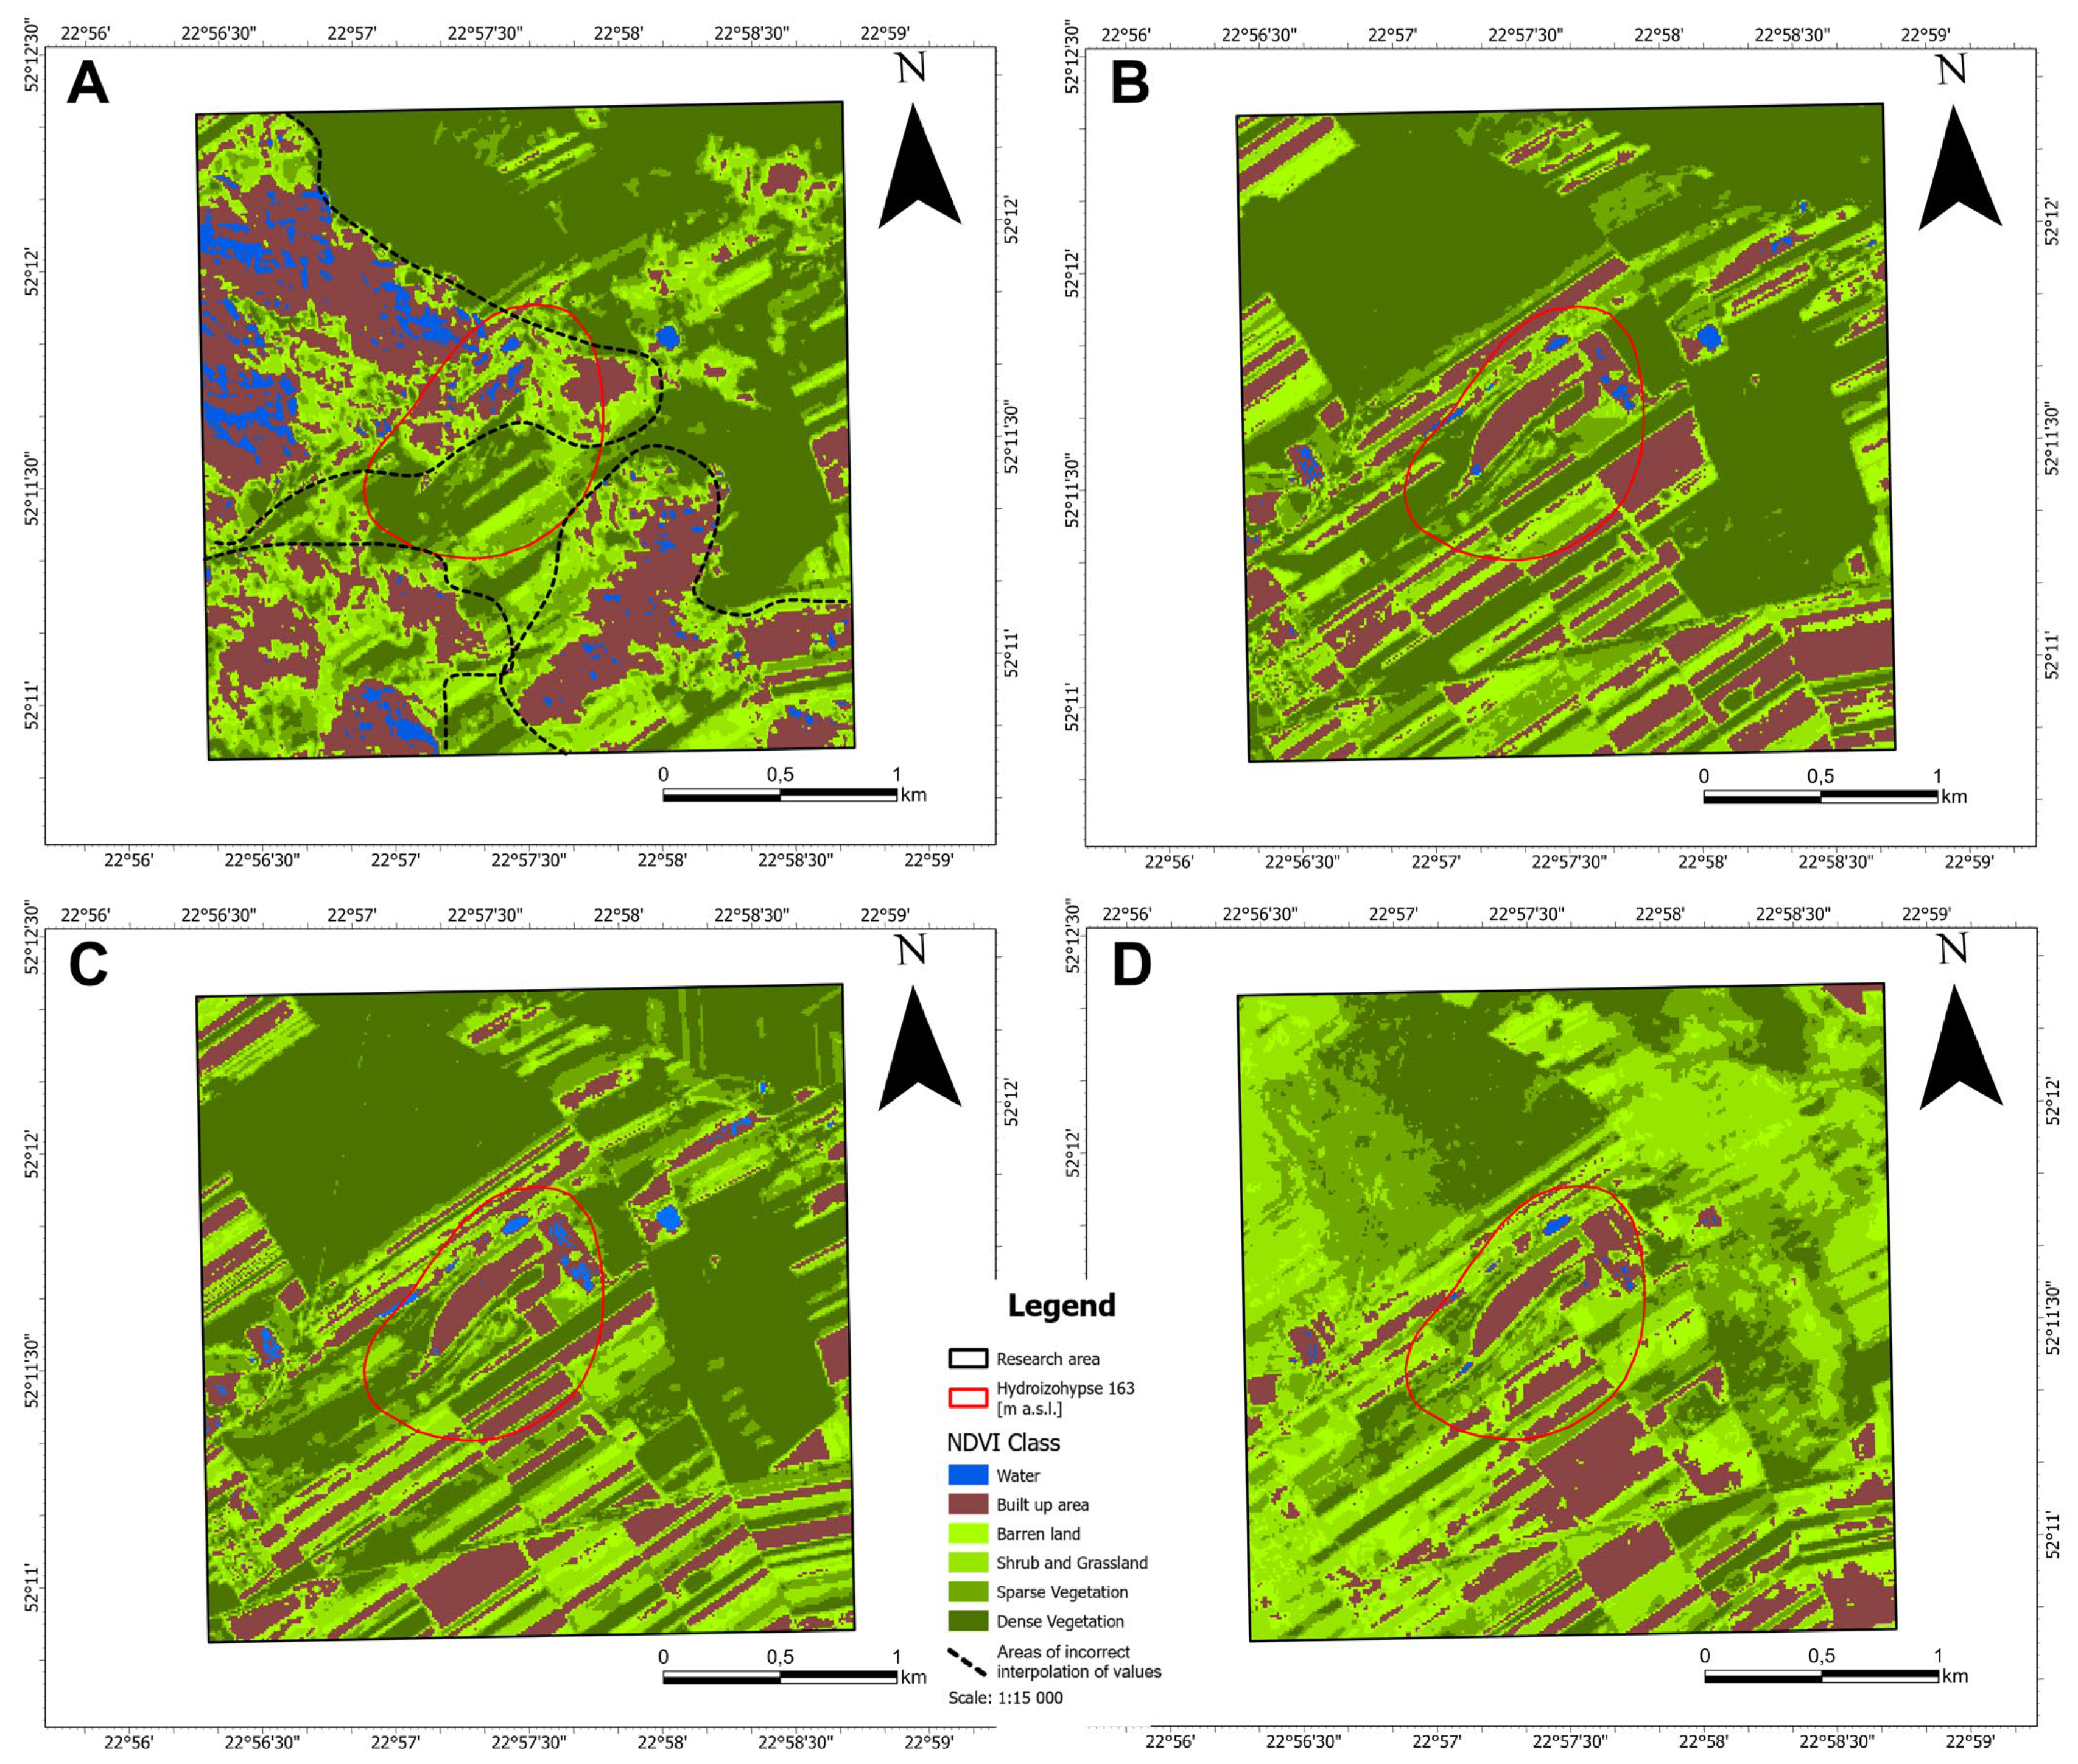
Images from 1 October 2023 to 10 October 2024 were analyzed, covering one complete hydrological year. The hydrological year in Poland spans 12 months, from 1 November (00:00 UTC) to 31 October (23:59 UTC), divided into winter (up to 30 April) and summer (from 1 May) semesters [25]. From a total of 304 images analyzed, 62 had cloud cover ≤30% over the entire satellite scene. However, this threshold applied to the full scene rather than specifically to our study area, requiring individual assessment of each image. Following detailed quality assessment, six satellite images met all selection criteria (area cloudiness ≤30% and seasonal distribution): 3 October 2023, 18 October 2023, 10 April 2024, 5 May 2024, 13 August 2024, and 28 August 2024 (Figure 4A–D and Figure 5B,C). Additionally, one processed image from 07.10.2024 was included after applying cloud masking algorithms and gap filling procedures (Figure 5D). The cloud masking algorithm replaced obscured pixels with interpolated values based on neighboring pixel means, though results were not entirely satisfactory due to extensive coverage of interpolated values in some areas, as demonstrated in Figure 5A from 1 August 2024.

3.2. Spatial Distribution of NDVI Values

Analysis of NDVI spatial patterns revealed distinct land cover classes across the study area. Dense vegetation (NDVI 0.36–0.74) dominated forested areas southwest of the excavation, with maximum values reaching 0.6 during peak growing season. Agricultural areas showed highly variable NDVI values depending on crop type, ranging from 0.1 during winter months to 0.6 during peak vegetation periods. Sparse vegetation and grasslands (NDVI 0.18–0.36) characterized marginal areas and meadows surrounding the excavation, with typical values of 0.2–0.4. Barren land and built-up areas (NDVI 0.015–0.18) included the active mining area, roads, and disturbed ground, consistently showing low NDVI values around 0.08–0.15.
The spatial distribution of NDVI classes remained relatively consistent across all analyzed dates (Figure 4A–D and Figure 5B–D), with seasonal variations primarily affecting the magnitude rather than the spatial pattern of vegetation indices. No systematic spatial gradient in NDVI values was observed across the depression cone boundary, suggesting limited impact of groundwater drawdown on surface vegetation patterns. This observation indicates that climatic, soil, and land-use factors likely play a greater role in NDVI variability than groundwater level changes alone.

3.3. Temporal Variability of NDVI

Temporal analysis revealed strong seasonal patterns in NDVI values consistent with temperate climate phenology. Spring emergence (April–May) showed rapid NDVI increases in agricultural areas, with rapeseed fields reaching maximum values of 0.6 by May (Figure 4D). The summer peak (July–August) exhibited highest NDVI values across all vegetation types, with cereals achieving 0.6 in August before harvest (Figure 5B,C). Autumn decline (September–October) demonstrated decreasing NDVI values as crops matured and senescence began, dropping to 0.2–0.4 (Figure 4A,B and Figure 5D). Winter minimum values were not captured in the available dataset due to cloud cover limitations during this period.

3.4. Comparison of NDVI Inside and Outside Depression Cone

Analysis of NDVI values inside and outside the depression cone did not show clear signs of deterioration in vegetation condition as a result of lowering the groundwater table. In the profile A-A’, the average NDVI values inside (0.42 ± 0.13; n = 637) and outside (0.41 ± 0.13; n = 273) the cone were statistically indistinguishable (t-test, p = 0.144), indicating no impact of the depression cone on vegetation.
In the profile B-B’, NDVI values inside the cone were significantly lower (0.17 ± 0.13; n = 847) than outside it (0.30 ± 0.07; n = 119), (t-test, p < 0.001). However, this difference is not due to hydrogeological impact but to the specific land use, namely the presence of an open-pit mine and large areas devoid of vegetation, which significantly lower the average NDVI values.
The results confirm that the lowering of the groundwater table within the depression cone does not in itself have a negative impact on the health and coverage of vegetation. The reduced NDVI values in the profile B-B’ are solely a consequence of surface transformations related to mining activities.

3.5. Spectral Profile Analysis

Two spectral profiles were analyzed to examine NDVI variability across the depression cone boundaries and in vegetation health (Figure 6).
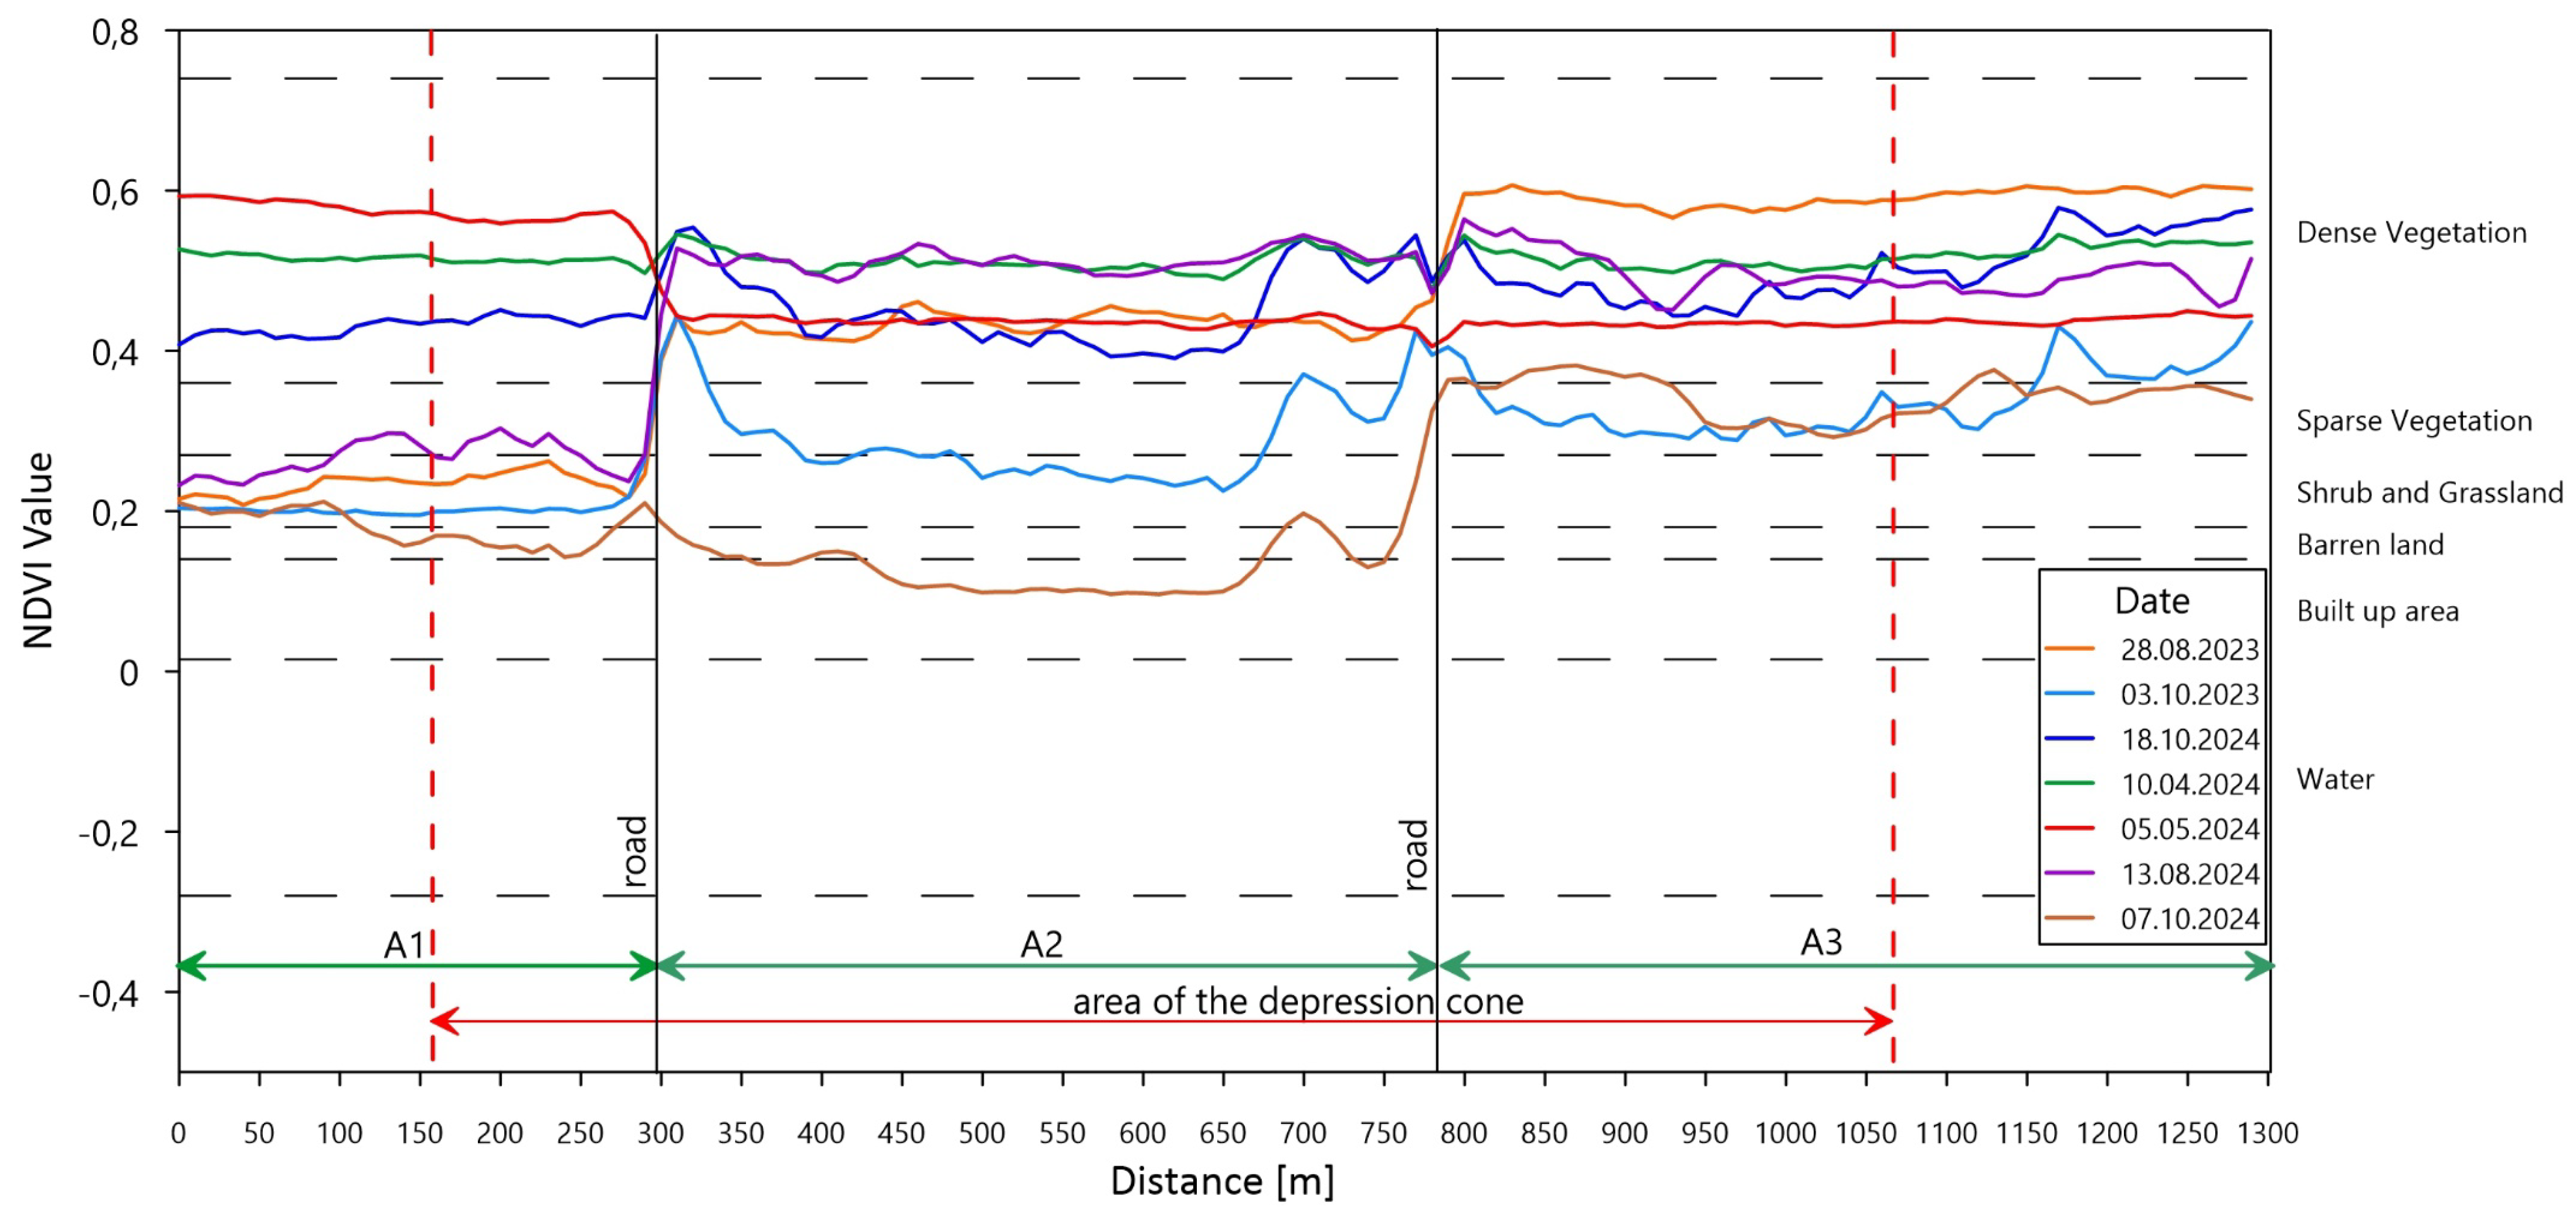
Profile A-A’ (Figure 7) runs 1300 m axially through the deposit center, crossing the depression cone at 156 m and 1066 m. Analysis reveals the following: Section A1 (0–270 m) contains rapeseed cultivation with a peak NDVI of 0.6 during May–June flowering; Section A2 (297–780 m) supports cereal crops (wheat/rye), achieving maximum NDVI values near 0.6 in August and dropping to 0.1–0.4 in other months with winter minima; Section A3 (784–1300 m) is used for corn cultivation with an August peak NDVI of 0.6, declining to 0.2 by September–October, showing less winter reduction potentially due to fall crop establishment. Road crossings at the 297 m and 780–785 m positions produced characteristic point-wise NDVI reductions to near-zero values due to absence of vegetation cover. No systematic differences in NDVI values were observed between segments inside versus outside the depression cone boundaries along either profile, confirming the previous analysis results.
Profile B-B’ (Figure 8) extends 1370 m parallel to the mining area through predominantly agricultural land, crossing the depression cone boundary at 74 m and 1280 m. Key features include the following: Section A (0–160 m, 1130–1220 m, 1290–1370 m) represents meadows and shrubland with NDVI values of 0.2–0.4; Section B (160–355 m) encompasses forest areas with elevated NDVI values reaching 0.6, showing gradual decrease toward the pit edge due to historical soil disturbance from pre-1990s mining preparation; Section C (355–420 m, 1040–1100 m) covers pit slopes where localized NDVI increases of 0.1–0.2 during August–September likely reflect enhanced moisture availability from the nearby drainage ditch and shallow groundwater; Section E (1100–1130 m, 1220–1290 m) represents disturbed wasteland from adjacent mining operations with reduced NDVI values of 0.18–0.2.

4. Discussion

The present study demonstrates that passive dewatering of the “Kornica-Popówka” chalk mine exerts no detectable adverse effect on vegetation health as measured by NDVI over a complete hydrological year (1 November 2023–31 October 2024). Despite delineating a clear dewatering-influence boundary (163 m a.s.l.) and analyzing seven cloud-free Sentinel-2 scenes, the maximum NDVI difference across this boundary never exceeded 0.05, which lies well within the expected inter-annual variability for wheat.
Continuous spectral-profile analysis (Figure 7 and Figure 8) revealed no systematic NDVI depression as transects crossed the dewatering boundary. Both profiles A-A′ and B-B′ exhibited typical vegetation-type signatures meadows and shrublands (NDVI 0.20–0.40), forests (up to 0.60), and crops (peak 0.60)—without deviation near the cone of depression. This spatial homogeneity suggests that the local soil and geological matrix (fine sands and chalk) effectively buffer short-term groundwater drawdown, maintaining adequate rootzone moisture for all plant communities.
Strong seasonal NDVI patterns—early spring green-up (May), summer peak (July)—Factors such as soil water-holding capacity, crop type, irrigation practices, and land-use patterns can influence NDVI independently of groundwater level changes. These may mask subtle hydrological stress signals, especially in temperate agricultural landscapes. Geological features such as rock permeability and soil texture are crucial for protecting vegetation from the negative effects of groundwater depletion. The structure of chalk, including its porosity and karst features, influences groundwater storage and flow, which supports soil moisture retention and water availability for vegetation [26]. Geological and textural diversity in the soil creates micro-zones of moisture that increase the ecosystem’s resistance to drought. In this way, the hydrogeological characteristics of chalk play a key role in protecting vegetation when groundwater levels drop. In regions where chalk is overlain by thick clay deposits, groundwater recharge is slower, but the resulting micro-zones of soil moisture enhance vegetation resilience to drought [27].
Summer (August) and autumn decline (September–October) closely mirror the phenological cycles of rapeseed, cereals, and corn. These cycles overshadow any potential hydrological stress signal, as vegetation phenology and farm management (e.g., sowing and harvest) impose larger NDVI fluctuations than moderate changes in the groundwater table.
Although the simple cloud-masking and gap-filling approach used here proved sufficient for this stage of research, more advanced multi-temporal cloud-removal algorithms may increase image availability in future work. Extending the time series and integrating groundwater data will further strengthen assessments of long-term vegetation response to dewatering.
In summary, this study confirms that phenology, soil buffering, and agronomic practices dominate NDVI index variability; no seasonal or spatial NDVI depression occurs at the dewatering boundary; and passive dewatering at this chalk mine does not impose measurable water stress on surrounding vegetation. These conclusions validate the coupling of satellite-based NDVI analysis with piezometric monitoring for environmental impact assessment of mining dewatering.

5. Conclusions

The integrated analysis of Sentinel-2 NDVI data and groundwater monitoring demonstrates that passive dewatering at the Kornica-Popówka chalk mine exerts no detectable stress on surrounding vegetation over a full hydrological year (1 November 2023–31 October 2024). Despite delineating a clear 163 m a.s.l. dewatering-influence boundary from piezometric measurements, the maximum NDVI difference across that boundary never exceeded 0.05, remaining within expected seasonal and crop-specific variability for winter wheat and other crops.
Key conclusions are as follows:
  • Vegetation health, as indicated by NDVI index, is driven mainly by phenological cycles and agronomic practices rather than by modest changes in the groundwater table. Seasonal NDVI index changes—from spring green-up through summer peak to autumn decline—mirror crop development and mask any hydrological signal.
  • Spatial profiles crossing the depression cone (Figure 7 and Figure 8) revealed uniform NDVI signatures for meadows (0.20–0.40), forests (up to 0.60), and arable fields (peak 0.60), with no consistent depression near the dewatering boundary. This implies effective root-zone moisture buffering by local fine sands and chalk.
  • The absence of significant differences in NDVI index inside versus outside the cone confirms that groundwater drawdown did not have a negative impact on the vitality of vegetation.
  • The applied approach—combining Sentinel-2 surface reflectance NDVI with piezometric mapping—provides a solid basis for monitoring vegetation response to mine drainage.
These findings support the use of satellite-based vegetation indices together with groundwater monitoring for environmental impact assessment. Future work should extend the time series, apply advanced multi-temporal cloud removal, and integrate hydrogeological datasets to refine detection of subtle long-term vegetation responses [28,29,30,31,32,33].
Without using this integrated approach, the real impact of dewatering would remain indirect and uncertain—this method allows direct mapping of the cone of depression and its potential ecological effects. The integrated approach used in this study has clear advantages: it improves monitoring accuracy through the combination of NDVI analysis and hydrogeological data, allows for a more comprehensive ecological impact assessment by directly relating vegetation condition to hydrological boundaries, and enables spatially explicit mapping of potential impact zones. However, limitations include challenges in acquiring high-quality, cloud-free satellite imagery during critical phenological stages, the need for dense and reliable groundwater monitoring networks, and the associated costs and technical expertise for processing and integrating multi-source datasets. These factors should be considered when applying the method to other mining areas.

Author Contributions

Conceptualization, K.C. and K.G.; methodology, K.G.; validation, K.C. and K.G.; formal analysis, K.C.; investigation, K.C.; resources, K.C.; data curation, K.C.; writing—original draft preparation, K.C.; writing—review and editing, K.G. and K.C.; visualization, K.G. and K.C.; supervision, K.C. and K.G.; project administration, K.G.; funding acquisition, K.C. All authors have read and agreed to the published version of the manuscript.

Funding

This research received no external funding. The APC was funded by the Wrocław University of Science and Technology.

Data Availability Statement

The original contributions presented in this study are included in the article. Further inquiries can be directed to the corresponding author.

Acknowledgments

We would like to acknowledge the Omya Group for their help during experiments and the sharing of groundwater measurement data.

Conflicts of Interest

The authors declare no conflicts of interest.

References

  1. Libicki, J. Changes in the Groundwater Due to Surface Mining. Górnictwo Geol. 1982, 25, 25–30. [Google Scholar] [CrossRef]
  2. Zawadzki, J.; Przeżdziecki, K.; Miatkowski, Z. Determining the Area of Influence of Depression Cone in the Vicinity of Lignite Mine by Means of Triangle Method and LANDSAT TM/ETM+ Satellite Images. Geologia 2016, 166, 605–614. [Google Scholar] [CrossRef]
  3. Kowalczyk, A.; Witkowski, A.; Różkowski, A.; Szczepański, A.; Rogoż, M.; Przybyłek, J.; Staśko, S. What Polish Mining Owes to Polish Hydrogeology? Przegląd Geol. 2010, 58, 774–786. [Google Scholar]
  4. Kleczkowski, A.S.; Różkowski, A. Słownik Hydrogeologiczny; Wydawnictwo Trio: Warszawa, Poland, 1997. [Google Scholar]
  5. Paull, D.; Banks, G.; Ballard, C.; Gillieson, D. Monitoring the Environmental Impact of Mining in Remote Locations through Remotely Sensed Data. Resources 2006, 21, 33–42. [Google Scholar] [CrossRef]
  6. Gajewski, P.; Kaczmarek, Z. Selected Properties of Soils Located within the Depression Cone of a Planned Excavation of the Drzewce Open Cast Pit (Central Poland). Soil Sci. Annu. 2021, 72, 143890. [Google Scholar] [CrossRef]
  7. Polak, K.; Kaznowska-Opala, K.; Różkowski, K.; Pawlecka, K. Cone of Depression and Range of Negative Impact of Dewatering. J. Environ. Eng. 2025, 71, 98–103. [Google Scholar]
  8. Kasperek, R.; Wiatkowski, M.; Rosik-Dulewska, C. Investigations of Hydrological Regime Changes in an Area Adjacent to a Mine of Rock Raw Materials. J. Water Land Dev. 2015, 17, 256–274. [Google Scholar]
  9. Hejmanowska, B.; Wezyk, P. Dane Satelitarne dla Administracji Publicznej. 2020. Available online: https://polsa.gov.pl/wp-content/themes/polsa/files/Podrecznik.pdf (accessed on 23 January 2025).
  10. Cacciuttolo, C.; Guzmán, V.; Catriñir, P.; Atencio, E.; Komarizadehasl, S.; Lozano-Galant, J.A. Low-Cost Sensor Technologies for Monitoring Sustainability and Safety Issues in Mining Activities: Advances, Gaps, and Future Directions in the Digitalization for Smart Mining. Sensors 2023, 23, 6846. [Google Scholar] [CrossRef] [PubMed]
  11. Adynkiewicz-Pirgas, M.; Lejcuś, I. Studies on Hydromorphological Attributes Variability and the Degree of Transformation of Combined Water Body of Chosen River Valleys in South-Western Poland; IMGW-PIB. 2016. Available online: https://www.researchgate.net/publication/320444593_Studies_on_hydromorphological_attributes_variability_and_the_degree_of_transformation_of_combined_water_body_of_chosen_river_valleys_in_south-western_Poland (accessed on 23 January 2025).
  12. West, L.J.; Farrell, R.P.; Foley, A.E.; Howlett, P.R.; Massei, N. An introduction to the chalk aquifers of northern Europe. Geol. Soc. Lond. Spec. Publ. 2023, 517, 1–14. [Google Scholar]
  13. Downing, R.A.; Price, M.; Jones, G.P. The Hydrogeology of the Chalk of Nirth-West Europe, The Chalk as an Aquifer in the Netherlands; Clarendon Press: Oxford, UK, 1993. [Google Scholar]
  14. Gould, S. A Guide to Soil Moisture. Available online: https://connectedcrops.ca/the-ultimate-guide-to-soil-moisture/ (accessed on 12 August 2025).
  15. USDA Natural Resources Conservation Service. Soil Quality Indicators; USDA Natural Resources Conservation Service: Washington, DC, USA, 2008.
  16. Państwowy Instytut Badawczy. Złoża Kopalin. Available online: https://geoportal.pgi.gov.pl/portal/page/portal/midas/zrodlo_danych (accessed on 22 January 2025).
  17. Copernicus. A European Wide-Swath, High-Resolution, Multi-Spectral Imaging Mission. Available online: https://dataspace.copernicus.eu/explore-data/data-collections/sentinel-data/sentinel-2 (accessed on 22 January 2025).
  18. Gascon, F.; Bouzinac, C.; Thépaut, O.; Jung, M.; Francesconi, B.; Louis, J.; Lonjou, V.; Lafrance, B.; Massera, S.; Gaudel-Vacaresse, A.; et al. Copernicus Sentinel-2A Calibration and Products Validation Status. Remote Sens. 2017, 9, 584. [Google Scholar] [CrossRef]
  19. Immitzer, M.; Vuolo, F.; Atzberger, C. First Experience with Sentinel-2 Data for Crop and Tree Species Classifications in Central Europe. Remote Sens. 2016, 8, 166. [Google Scholar] [CrossRef]
  20. Polska Agencja Kosmiczna. Wskaźniki Teledetekcyjne Jako Miara Stanu Środowiska, Scenariusz Warstwowy 2. Available online: https://sat4envi.imgw.pl/elearning/mod/resource/view.php?id=548 (accessed on 23 January 2025).
  21. Rodríguez-Puerta, F.; Perroy, R.L.; Barrera, C.; Price, J.P.; García-Pascual, B. Five-Year Evaluation of Sentinel-2 Cloud-Free Mosaic Generation under Varied Cloud Cover Conditions in Hawai’i. Remote Sens. 2024, 16, 4791. [Google Scholar] [CrossRef]
  22. Zou, X.; Zhao, Y.; Tao, P.; Cui, Y. Research on cloud removal based on fusing Multi-temporal Remote Sensing Images. In Proceedings of the 2022 IEEE 10th Joint International Information Technology and Artificial Intelligence Conference (ITAIC), Chongqing, China, 17–19 June 2022; IEEE: New York, NY, USA, 2022. [Google Scholar] [CrossRef]
  23. Jiang, J.; Zheng, Y.; Pang, T.; Wang, B.; Chachan, R.; Tian, Y. A Comprehensive Study on Spectral Analysis and Anomaly Detection of River Water Quality Dynamics with High Time Resolution Measurements. Sci. Total Environ. 2020, 589, 125175. [Google Scholar] [CrossRef]
  24. Meraner, A.; Ebel, P.; Zhu, X.X.; Schmitt, M. Cloud Removal in Sentinel-2 Imagery Using a Deep Residual Neural Network. ISPRS J. Photogramm. Remote Sens. 2020, 166, 333–346. [Google Scholar] [CrossRef] [PubMed]
  25. METEO IMGW-PIB. Najważniejsze Pojęcia i Zwroty w Hydrogeologii. Available online: https://imgw.pl/wp-content/uploads/2024/10/slownik-dla-mediow_chok.pdf (accessed on 1 April 2025).
  26. Maurice, L.; Farrant, A.R.; Mathewson, E.; Atkinson, T. Karst hydrogeology of the Chalk and implications for groundwater protection. Geol. Soc. Lond. Spec. Publ. 2021, 517, 39–62. [Google Scholar] [CrossRef]
  27. Marks, R.J.; Lawrence, A.R.; Whitehead, E.J.; Cobbing, J.E.; Darling, W.G.; Hughes, A.G. Groundwater Systems and Water Quality Programme, Internal Report IR/04/007, Recharge to the Chalk Aquifer; British Geological Survey: Nottingham, UK, 2004. [Google Scholar]
  28. Ebel, P.; Garnot, V.S.F.; Schmitt, M.; Wegner, J.D.; Zhu, X.X. UnCRtainTS: Uncertainty Quantification for Cloud Removal in Optical Satellite Time Series. Remote Sens. 2023, 202, 2086–2096. [Google Scholar]
  29. El Mendili, L.; Puissant, A.; Chougrad, M.; Sebari, I. Towards a Multi-Temporal Deep Learning Approach for Mapping Urban Fabric Using Sentinel-2 Images. Remote Sens. 2020, 12, 423. [Google Scholar] [CrossRef]
  30. Ebel, P.; Xu, Y.; Schmitt, M.; Zhu, X. SEN12MS-CR-TS: A Remote Sensing Data Set for Multi-Modal Multi-Temporal Cloud Removal. Remote Sens. 2022, 60, 1–14. [Google Scholar] [CrossRef]
  31. Bui, Q.-T.; Jamet, C.; Vantrepotte, V.; Mériaux, X.; Cauvin, A.; Mograne, M.A. Evaluation of Sentinel-2/MSI Atmospheric Correction Algorithms over Two Contrasted French Coastal Waters. Remote Sens. 2022, 14, 1099. [Google Scholar] [CrossRef]
  32. Moravec, D.; Komárek, J.; López-Cuervo Medina, S.; Molina, I. Effect of Atmospheric Corrections on NDVI: Intercomparability of Landsat 8, Sentinel-2, and UAV Sensors. Remote Sens. 2021, 13, 3550. [Google Scholar] [CrossRef]
  33. Khetkeeree, S.; Petchthaweetham, B.; Liangrocapart, S.; Srisuk, S. Sentinel-2 Image Dehazing using Correlation between Visible and Infrared Bands. In Proceedings of the 2020 8th International Electrical Engineering Congress (iEECON), Chiang Mai, Thailand, 4–6 March 2020. [Google Scholar]
Figure 1. Location of the study area.
Resources 14 00134 g001
Figure 2. Characteristics of the multispectral instrument (MSI) aboard Sentinel-2. Spectral response functions are shown in color, and the central wavelength is highlighted in black. Band names and corresponding spatial resolutions (in meters) are also indicated. The bands used in the study were 8 and 4 [19].
Resources 14 00134 g002
Figure 3. Methodology of this study.
Resources 14 00134 g003
Figure 4. NDVI classes for (A) 3 October 2023; (B) 18 October 2023; (C) 10 April 2024; and (D) 5 May 2024.
Resources 14 00134 g004
Figure 5. NDVI classes for (A) 1 August 2024 after applying the developed algorithm; (B) 13 August 2024; (C) 28 August 2024; and (D) 7 October 2024.
Resources 14 00134 g005
Figure 6. The trajectory of the determined spectral profiles.
Resources 14 00134 g006
Figure 7. A-A’ spectral profiles for different satellite images.
Resources 14 00134 g007
Figure 8. B-B’ spectral profiles for different satellite images.
Resources 14 00134 g008
Table 1. Used Normalized Difference Vegetation Index (NDVI) ranges identified for land cover classes; based on reference [17].
ClassNDVI Range
Water−0.28 to 0.015
Built up area0.015 to 0.14
Barren land0.14 to 0.18
Shrub and Grassland0.18 to 0.27
Sparse Vegetation0.27 to 0.36
Dense Vegetation0.36 to 0.74
Disclaimer/Publisher’s Note: The statements, opinions and data contained in all publications are solely those of the individual author(s) and contributor(s) and not of MDPI and/or the editor(s). MDPI and/or the editor(s) disclaim responsibility for any injury to people or property resulting from any ideas, methods, instructions or products referred to in the content.