Article

Loss and Early Recovery of Biomass and Soil Organic Carbon in Restored Mangroves After Paspalum vaginatum Invasion in West Africa

by
Julio César Chávez Barrera
1,
Juan Fernando Gallardo Lancho
2,*,†,
Robert Puschendorf
3 and
Claudia Maricusa Agraz Hernández
4,*
1
Doctorado en Ciencias Biológicas y de la Salud, Universidad Autónoma Metropolitana, Ciudad de México 14386, Mexico
2
Consejo Superior de Investigaciones Científicas, IRNASaф, Salamanca 37008, Spain
3
School of Biological and Marine Sciences, University of Plymouth, Devon PL24 8AA, UK
4
Instituto EPOMEX, Universidad Autónoma de Campeche, Av. Agustín Melgar s/n, Entre Juan de la Barrera y Calle 20, Col. Buenavista, San Francisco de Campeche 24039, Mexico
*
Authors to whom correspondence should be addressed.
retired.
Resources 2025, 14(8), 122; https://doi.org/10.3390/resources14080122
Submission received: 19 June 2025 / Revised: 17 July 2025 / Accepted: 23 July 2025 / Published: 29 July 2025

Abstract

Invasive plant species pose an increasing threat to mangroves globally. This study assessed the impact of Paspalum vaginatum invasion on carbon loss and early recovery following four years of restoration in a mangrove forest with Rhizophora racemosa in Benin. Organic carbon was quantified in the total biomass, including both aboveground and belowground components, as well as in the soil to a depth of −50 cm. In addition, soil gas fluxes of CO2, CH4, and N2O were measured. Three sites were evaluated: a conserved mangrove, a site degraded by P. vaginatum, and the same site post-restoration via hydrological rehabilitation and reforestation. Invasion significantly reduced carbon storage, especially in soil, due to lower biomass, incorporation of low C/N ratio organic residues, and compaction. Restoration recovered 7.8% of the total biomass carbon compared to the conserved mangrove site, although soil organic carbon did not rise significantly in the short term. However, improvements in deep soil C/N ratios (15–30 and 30–50 cm) suggest enhanced soil organic matter recalcitrance linked to R. racemosa reforestation. Soil CO2 emissions dropped by 60% at the restored site, underscoring restoration’s potential to mitigate early carbon loss. These results highlight the need to control invasive species and suggest that restoration can generate additional social benefits.

1. Introduction

Mangroves are strategic ecosystems for climate change mitigation due to their ability to capture carbon dioxide (CO2) and store it for decades in biomass and carbon-rich soils [1]. Soils constitute the main carbon (C) reservoir in mangroves, owing to their high primary productivity and the accumulation of recalcitrant organic compounds that are resistant to microbial decomposition [2,3]. Water saturation further limits the mineralization of soil organic matter (SOM), thereby reducing CO2 emissions from soil respiration [4]. As a result, mangroves can store more soil organic carbon (SOC) per unit area than many terrestrial ecosystems [5].
Despite this ecological importance, mangrove forests are increasingly affected by environmental degradation, driven by changes in biotic and abiotic conditions that reduce their productivity and ecological functioning [6]. Deforested areas are especially vulnerable to invasion by non-native plant species [7], and biological invasion is now the second leading global threat to biodiversity [8]. In mangroves, nearly 70% of invasive species become persistent, displacing native trees and inhibiting natural regeneration [9]. These invasions can disrupt ecosystem processes such as carbon and nutrient cycling, microbial activity, and habitat integrity, as shown in previous studies [10,11].
The effects of invasive species on carbon dynamics in mangroves remain complex and context dependent. Some studies have reported increased carbon capture, while others documented reductions [12,13,14]. Furthermore, invasion intensified carbon dioxide (CO2), nitrous oxide (N2O), and methane (CH4) emissions by altering SOC [15]. In West Africa, Paspalum vaginatum Swartz (Poaceae), a halophytic grass, has recently invaded mangroves in the Republic of Benin. Deforestation, altered hydrology, and eutrophication have limited the regeneration of Rhizophora racemosa Meyer, facilitating the establishment of P. vaginatum [16].
It has been hypothesized that this invasion may compromise the carbon sink function of mangroves in the region. Given this context, there is an urgent need to evaluate the potential of ecological restoration to recover ecosystem services in mangroves affected by invasive species. Mangrove restoration recovers ecosystem services (including carbon storage) and strengthens soil structure, microbial activity, and the ecosystem’s long-term resilience, as demonstrated in recent studies [17,18,19,20,21,22,23]. However, restoration in Africa often faces challenges due to limited financial resources and high poverty levels. Nonetheless, successful efforts in Benin have demonstrated progress in controlling P. vaginatum and restoring mangrove forest cover, such as the studies by [16]. Establishing a baseline that quantifies the effects of this invasion and the potential for early carbon recovery is essential to support large-scale restoration strategies and inform decision-making around the costs and benefits of greenhouse gas mitigation schemes.
The aim of this study was to assess the impact of P. vaginatum invasion on carbon stocks in biomass and soil in West African mangroves, and to evaluate the potential for early recovery following ecological restoration. To do this, we quantified total carbon stocks and soil CO2 emissions across three sites in Ouidah, Benin: a conserved reference mangrove, a site degraded by grass invasion, and the same site four years after hydrological rehabilitation and reforestation. We also analyzed pore water and soil properties, the elemental composition (C, N, and C/N ratio) of plant tissues, and used soil CO2 fluxes as indicators of soil respiration. We hypothesized that active restoration could induce short-term biomass recovery, while soil carbon recovery would require longer periods.

2. Materials and Methods

2.1. Study Area

West Africa contains about 15% (21,715 km2) of the world’s mangrove forests, which are distributed across 19 countries in the region [24], extending from the southern border of Mauritania to the northern edges of Angola and Benin. The extensive mangroves of West Africa support local economies by providing habitat for fisheries, protecting human populations from extreme weather events, and serving as natural barriers against flooding and coastal erosion. In Benin, the mangrove area declined by 62.1% between 1988 and 2001 [25], primarily due to conversion into grasslands (52.4%) and other vegetation types (17.6%). This decline was particularly severe in the municipalities of Abomey-Calavi and Ouidah [25].
This study was conducted in Ouidah, located on the Atlantic coast of the Republic of Benin, within the Western African region (Figure 1). Despite economic and social constraints that hinder conservation efforts in many African countries, Benin has made notable progress in coastal ecological restoration. One of the most significant achievements stems from a project funded by the French Global Environment Facility (FFEM), aimed at restoring 30 ha of mangrove in the Djégbadji wetland, which had been displaced by P. vaginatum [16] (Figure 1).
The primary objective was to carry out hydrological rehabilitation with the involvement of local communities.
The local community was actively involved in planning, implementation, environmental monitoring, and finally the restoration evaluation [16]. These communities participated in the excavation of artificial channels and the clearing of silted natural channels, successfully re-establishing tidal flow and freshwater input in the site degraded by grass invasion (P. vaginatum). In doing so, hydrological functioning at the site was restored (actions categorized as hydrological rehabilitation). As a result, the hydrological conditions became unfavorable for P. vaginatum but favorable for the development of mangrove species used in reforestation [16].
Simultaneously, P. vaginatum was manually removed (Figure 1) to flatten microtopography, increase flood frequency, and reduce spatial competition with mangrove species. After implementing hydrological rehabilitation, monthly environmental monitoring was conducted to determine the optimal timing for reforestation, based on intervals like those observed at the conservation site.
Of the total restored area, 20 ha were reforested through the direct planting of R. racemosa hypocotyls (Figure 1) in zones where the topography matched the natural distribution of this species. Planting was carried out at high density, as a strategy to prevent the long-term recolonization of P. vaginatum, using reference forest density as a benchmark. The study was conducted at two sites (Figure 1 and Figure A1): a conserved mangrove (reference) and a restored mangrove, with sampling plots established in areas reforested with R. racemosa.

2.2. Field Sampling

In 2018, preliminary measurements were taken at a conserved mangrove site (Mref) and at a site invaded by P. vaginatum (Mdeg), with the aim of assessing the floristic composition and carbon stocks (Figure A1).
Four years later, a second monitoring campaign was conducted at the Mdeg site following its ecological restoration, hereafter referred to as Mres (Figure 1 and Figure A1). The sampling focused on the R. racemosa populations present at Mref and Mres. Structural attributes such as tree height and diameter were recorded following the criteria described by [26]. At each of the three selected sites, measurements were taken in three plots (three replicates). Each plot covered an area of 100 m2.

2.3. Pore Water Parameters

Pore water is defined as the liquid fraction that freely occupies and moves through the pore spaces between soil particles [27]. Its importance in mangrove studies is well documented, as the dynamics of this water regulate the physicochemical properties of the soil. These, in turn, influence mangrove zonation, forest physiognomy (tree diameter and height, forest density), species distribution and dominance, biogeochemical processes, and the degree of ecosystem degradation [27].
To monitor interstitial water, piezometers (gravitational water collectors) were constructed using PVC tubes, 10.16 cm in diameter and 1.5 m in length [28]. Each piezometer had 1.0 cm diameter perforations along the lower 30 cm of the tube wall to allow water flow. This design helped prevent oxidation of samples and avoided errors due to alterations in their natural chemical composition. Water samples were collected from within the tube after draining and stabilization. Data collected in February and April 2018 were used, corresponding to measurements taken prior to the restoration.
Salinity was measured using an A&O refractometer, with a scale from 0 to 100 g of salt per kg of water, expressed in practical salinity units (PSU) [27].
Redox potential was measured with a multiparameter probe (Hach-HQ11d), expressed in millivolts (mV).
Soluble nutrient concentrations (nitrate (NO3), phosphate (PO43−), and sulfate (SO42−)) were determined by ion chromatography (IC Advanced 861) [29], with a precision of ±0.01 mg L−1. An automated sample filtration system (model 788) operated with Magic Net software version 3.1 was used. The injection volume was 20 μL. Chromatographic analysis was performed using a Metrosep A Supp 5 anion separation column (reference 6.1006.503) with a length of 250 mm and an internal diameter of 4.0 mm, together with a CO2 suppressor (model 853 MCS). The eluent consisted of a mixture of 0.003 M NaHCO3 and 0.0024 M Na2CO3, while a 250 mM H2SO4 solution was used for suppressor regeneration. All reagents and solutions, including sample dilutions, were prepared using ultrapure water (resistivity ≥18.2 MΩ·cm).

2.4. Organic Carbon in Vegetation

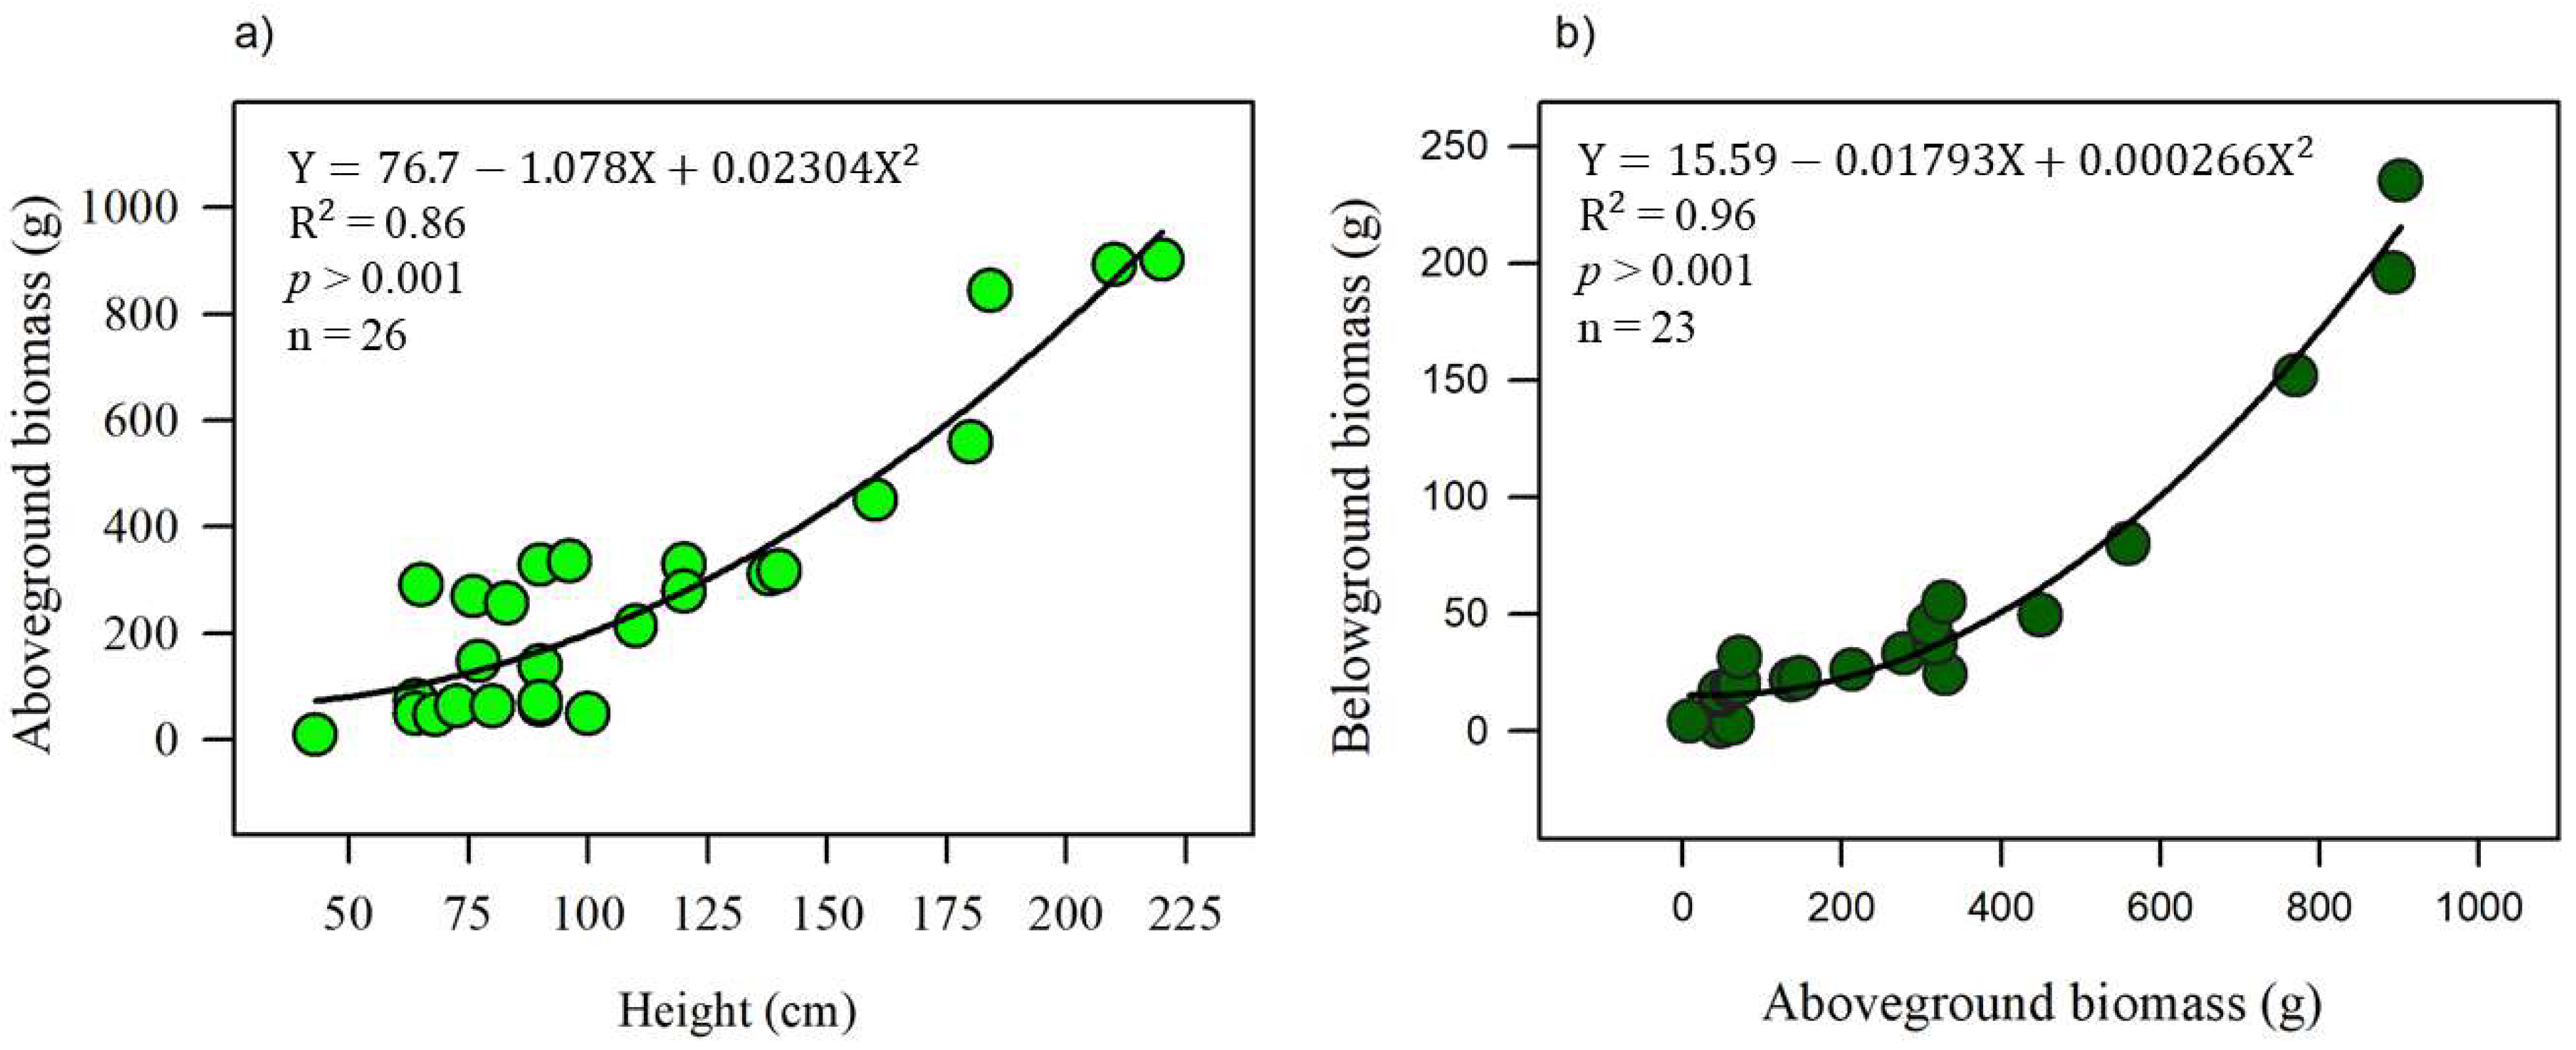
To estimate tree biomass at the reference site (Mref), the allometric equations (AEs) reported by [30] were used. These equations, specific to the above- and below-ground biomass of R. racemosa, were developed from trees extracted in West Africa. Since no suitable AEs were available for the structural characteristics of the restored site (Mres), regression models were generated using empirical data from R. racemosa individuals collected on site and oven-dried at 60 °C in a Thermo Scientific convection oven until reaching a constant dry weight, as recommended by [26,31]. This method relates dry aboveground biomass (AGB; leaves, branches, and stems) and belowground biomass (BGB; roots) to tree height.
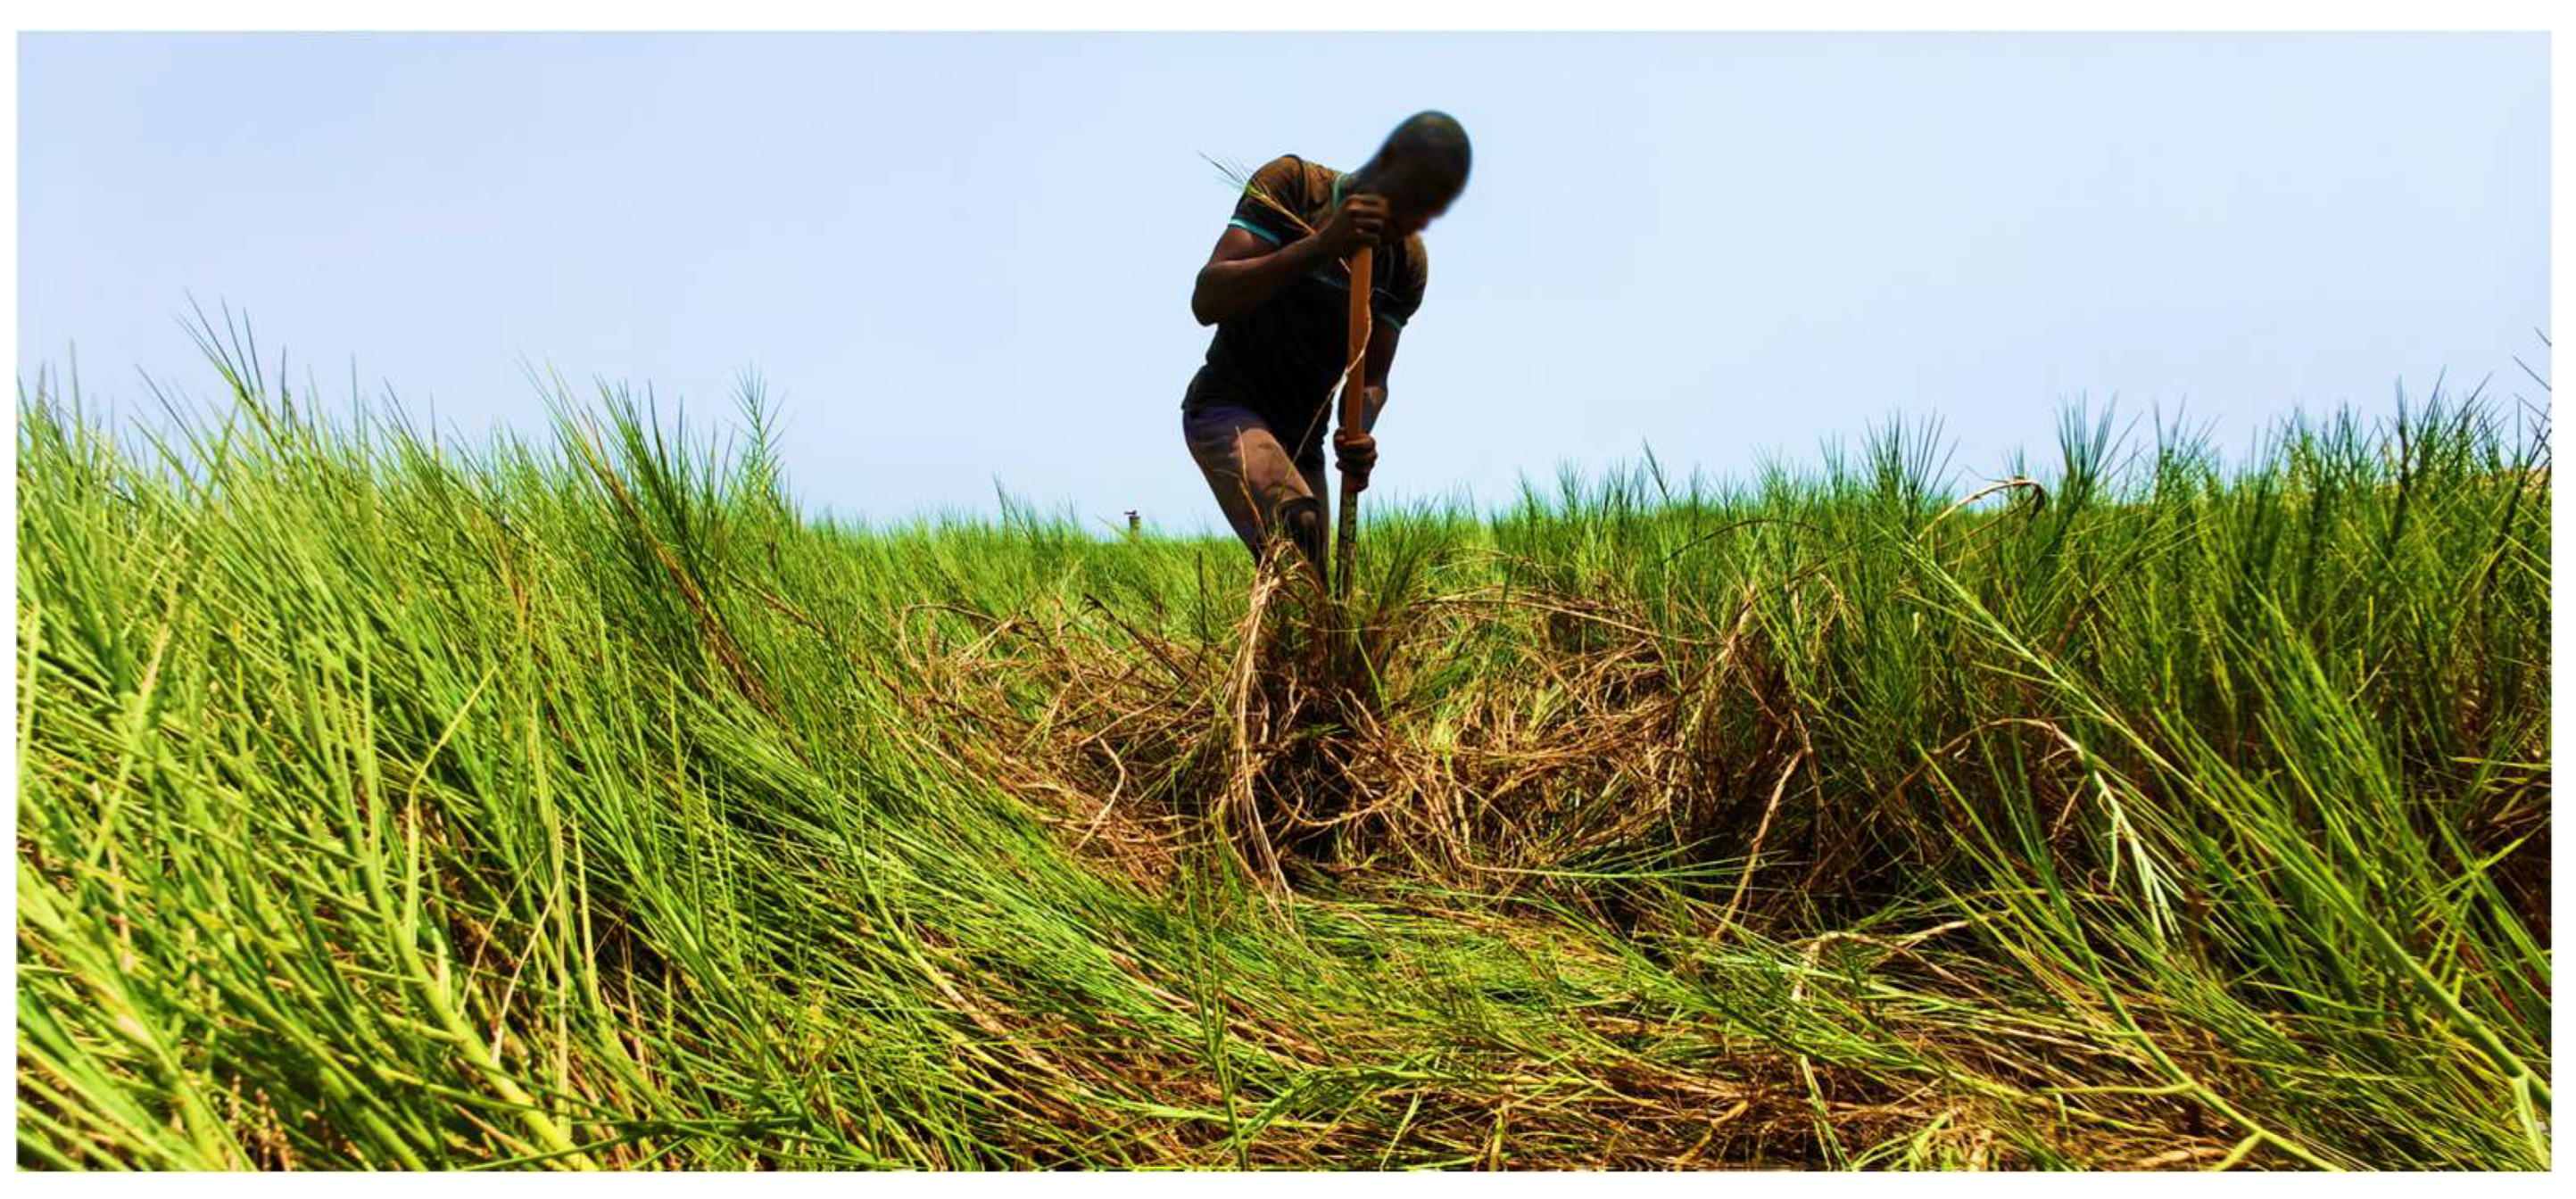
For the invasive species, total dry biomass (DB) of P. vaginatum was collected, including above- and belowground biomass [32], in three 1.00 m2 quadrats placed within the invaded area (Mdeg) (Figure A2). All collected biomass was processed using the same equipment and procedures as the tree biomass, with components separated into above- and belowground fractions.
Total biomass of each aboveground (AGB) and belowground (BGB) component was calculated in Mg DB ha−1. Conversion factors were then applied to estimate carbon content per component in Mg C ha−1. These conversion factors, specific to above- and belowground biomass, were based on the recommendations of [26]. Conversion factors were derived from average C concentrations in tissue samples by species. Three 10.00 g samples (replicates) were taken from each of the following tissues of R. racemosa and P. vaginatum: roots, branches, leaves, and stems.
Each sample was labelled by species and then pulverized by mechanical grinding using a TissueLyser II (Qiagen GmbH, Hilden, Germany) to homogenize particle size and improve analytical precision. From each subsample, 5.0 mg was weighed into tin capsules using a high-precision microbalance (Mettler Toledo XP6; standard deviation: ±1 µg). Capsules were analyzed using a Flash 2000 elemental analyzer (Thermo Fisher Sci. Inc., Waltham, MA, USA), calibrated with certified reference materials, to determine total carbon and nitrogen concentrations.

2.5. Soil Properties and Organic Carbon Content

Three soil cores were extracted at each site using paired PVC tubes: one cylindrical (6.5 cm diameter) and a semicylindrical insert placed inside it. Each core was sectioned into depth intervals of 0–15 cm, 15–30 cm, and 30–50 cm, following protocols for the measurement, monitoring, and reporting of structure, biomass, and carbon stocks in mangrove forests [26].
Sampling was standardized to a depth of –50 cm, since in some areas (such as Mdeg), high soil compaction prevented deeper extraction.
Samples from each interval were oven-dried at 60 °C until reaching constant weight, as recommended in [26]. The dry weight of each sample was recorded to calculate bulk density. Afterwards, samples were manually homogenized, and a 10.00 g subsample per interval was sent to a laboratory in Mexico for mechanical grinding, using the equipment TissuLyser II (Qiagen GmbH, Hilden, Germany).
Following grinding, 5.0 mg of each subsample was weighed into silver capsules using a Mettler Toledo XP6 microbalance. An acidification step with 6.15 M hydrochloric acid was performed to eliminate inorganic carbon. Soil organic carbon content in percentage (SOC, %) was then quantified via dry combustion using a Flash 2000 elemental analyzer (Thermo Fisher Scientific Inc., Waltham, MA, USA), calibrated with certified reference materials (Methionine y Sulfanilamide; Thermo Fisher Scientific Inc.), at the Coastal Wetlands Laboratory of the EPOMEX Institute in Mexico 195 [33]. The elemental analyzer operated with a pre-packed quartz oxidation reactor at 950 °C. High-purity helium was used as the carrier gas at a flow rate of 140 mL min−1, while high-purity oxygen was injected at 250 mL min−1. Separation of the combustion gases was performed using a CHNS/NCS multi-separation PTFE column (6 mm × 5 mm × 2 m), and detection was carried out with a thermal conductivity detector (TCD).
Total soil organic carbon content (SOC, Mg C ha−1) for each depth layer was calculated using the following formula [26]:
SOC (Mg C ha−1) = Bulk density (g cm−3) × SOC (%) × Depth (cm)
Cumulative SOC to −50 cm was obtained by summing all interval values [19]. Bulk density was calculated by dividing the dry weight by sample volume, with volume determined from core diameter and depth.
Separately, total soil nitrogen (Nt) was analyzed in untreated (non-acidified) soil samples. An elemental analyzer was used to measure both C and N concentrations, providing high precision for mangrove and coastal soils [34,35].

2.6. Total Ecosystem Carbon Stock and CO2 Equivalent Emissions

Total Ecosystem Carbon Stock (TECS) was estimated for each site by summing the C stored in total biomass and in soil to a depth of −50 cm (expressed in Mg C ha−1). To evaluate restoration potential for C storage recovery in mangroves, the TECS percentage in the restored site was calculated relative to the reference (undisturbed) site.
The carbon dioxide equivalent (CO2e) removed by the reference and restored sites was estimated by multiplying TECS by 3.67. This conversion factor reflects the molecular weight ratio of CO2 to elemental carbon (44/12) and is widely used to quantify mangrove ecosystems’ contribution to atmospheric carbon removal [26]. Potential net emissions caused by mangrove degradation were estimated by subtracting the CO2e of the degraded site from that of the reference site.

2.7. Soil Gas Fluxes

Soil gases were collected using static PVC cylindrical chambers (15 cm diameter, 77 cm height) fitted with top valves. Only two chambers were installed per site, due to the high cost of gas analysis. Each chamber was inserted −10 cm into the soil with the valve open to equilibrate with the atmosphere. After 15 min, the valve was closed to start gas incubation. The internal gas was mixed using a syringe, and 20 mL were extracted as the initial sample (Ci). After two hours, a second sample was taken to measure the final concentration (Cf).
Samples were transferred from syringes into Tedlar® bags upon arrival at the lab and immediately analyzed for CH4, N2O, and CO2 using a gas chromatograph coupled to a mass spectrometer (Thermo Scientific, Waltham, Massachusetts, USA). The analysis was performed using certified standards and manual injection with precision 1.0 mL syringes, Luer Lock needles, and push-button valves (VICI).
Gas fluxes were calculated from the concentration difference between Ci and Cf, chamber volume and surface area, following the method described by [36]. Only samples in good condition during transport were included, collected during two campaigns in November and February at each site.

2.8. Statistical Analysis

Principal Component Analysis and one-way ANOVA were used to evaluate the influence of physical, physicochemical, and chemical properties of soil and water on carbon capture in the mangroves, both in intact areas (Mref) and those invaded by P. vaginatum (Mdeg). In addition, carbon losses between sites and subsequent recovery after restoration (Mres) were assessed through one-way ANOVA, followed by post hoc Fisher’s LSD tests. To assess differences in the physicochemical characteristics of porewater between Mref and Mdeg, Student’s t-tests were applied. The same analysis was used to compare carbon (C) and nitrogen (N) concentrations and the C/N ratio in plant tissue samples of R. racemosa and P. vaginatum.
Regression analyses were used to build biomass estimation equations. All statistical analyses were performed using Minitab® 19.1, with a significance level of α = 0.05.
Normality was verified using the Shapiro–Wilk test, and transformations were applied where necessary.

3. Results

3.1. Environmental Conditions of Pore Water Between the Reference and Degraded Sites

The conserved mangrove reference site exhibited significantly more reducing conditions, with a redox potential of –342 ± 17 mV, compared to the degraded site invaded by P. vaginatum (Mdeg), which showed more oxidizing conditions (–170 ± 48 mV; p < 0.0001).
Regarding other physicochemical parameters, the reference site (Mref) recorded values of 19.6 ± 0.8 PSU, 0.13 ±0.05 mg NO3 L−1, 0.19 ± 0.02 mg PO43− L−1, and 2313 ± 175 mg SO42− L−1. In comparison, the degraded site (Mdeg) showed higher salinity and nitrate concentrations (21 ± 2.0 PSU, 0.30 ± 0.10 mg NO3 L−1), but lower phosphate (0.15 ± 0.002 mg PO43− L−1) and sulfate (1908 ± 218 mg SO42− L−1). However, differences in these chemical parameters were not statistically significant; only the redox potential differed significantly (Table 1).
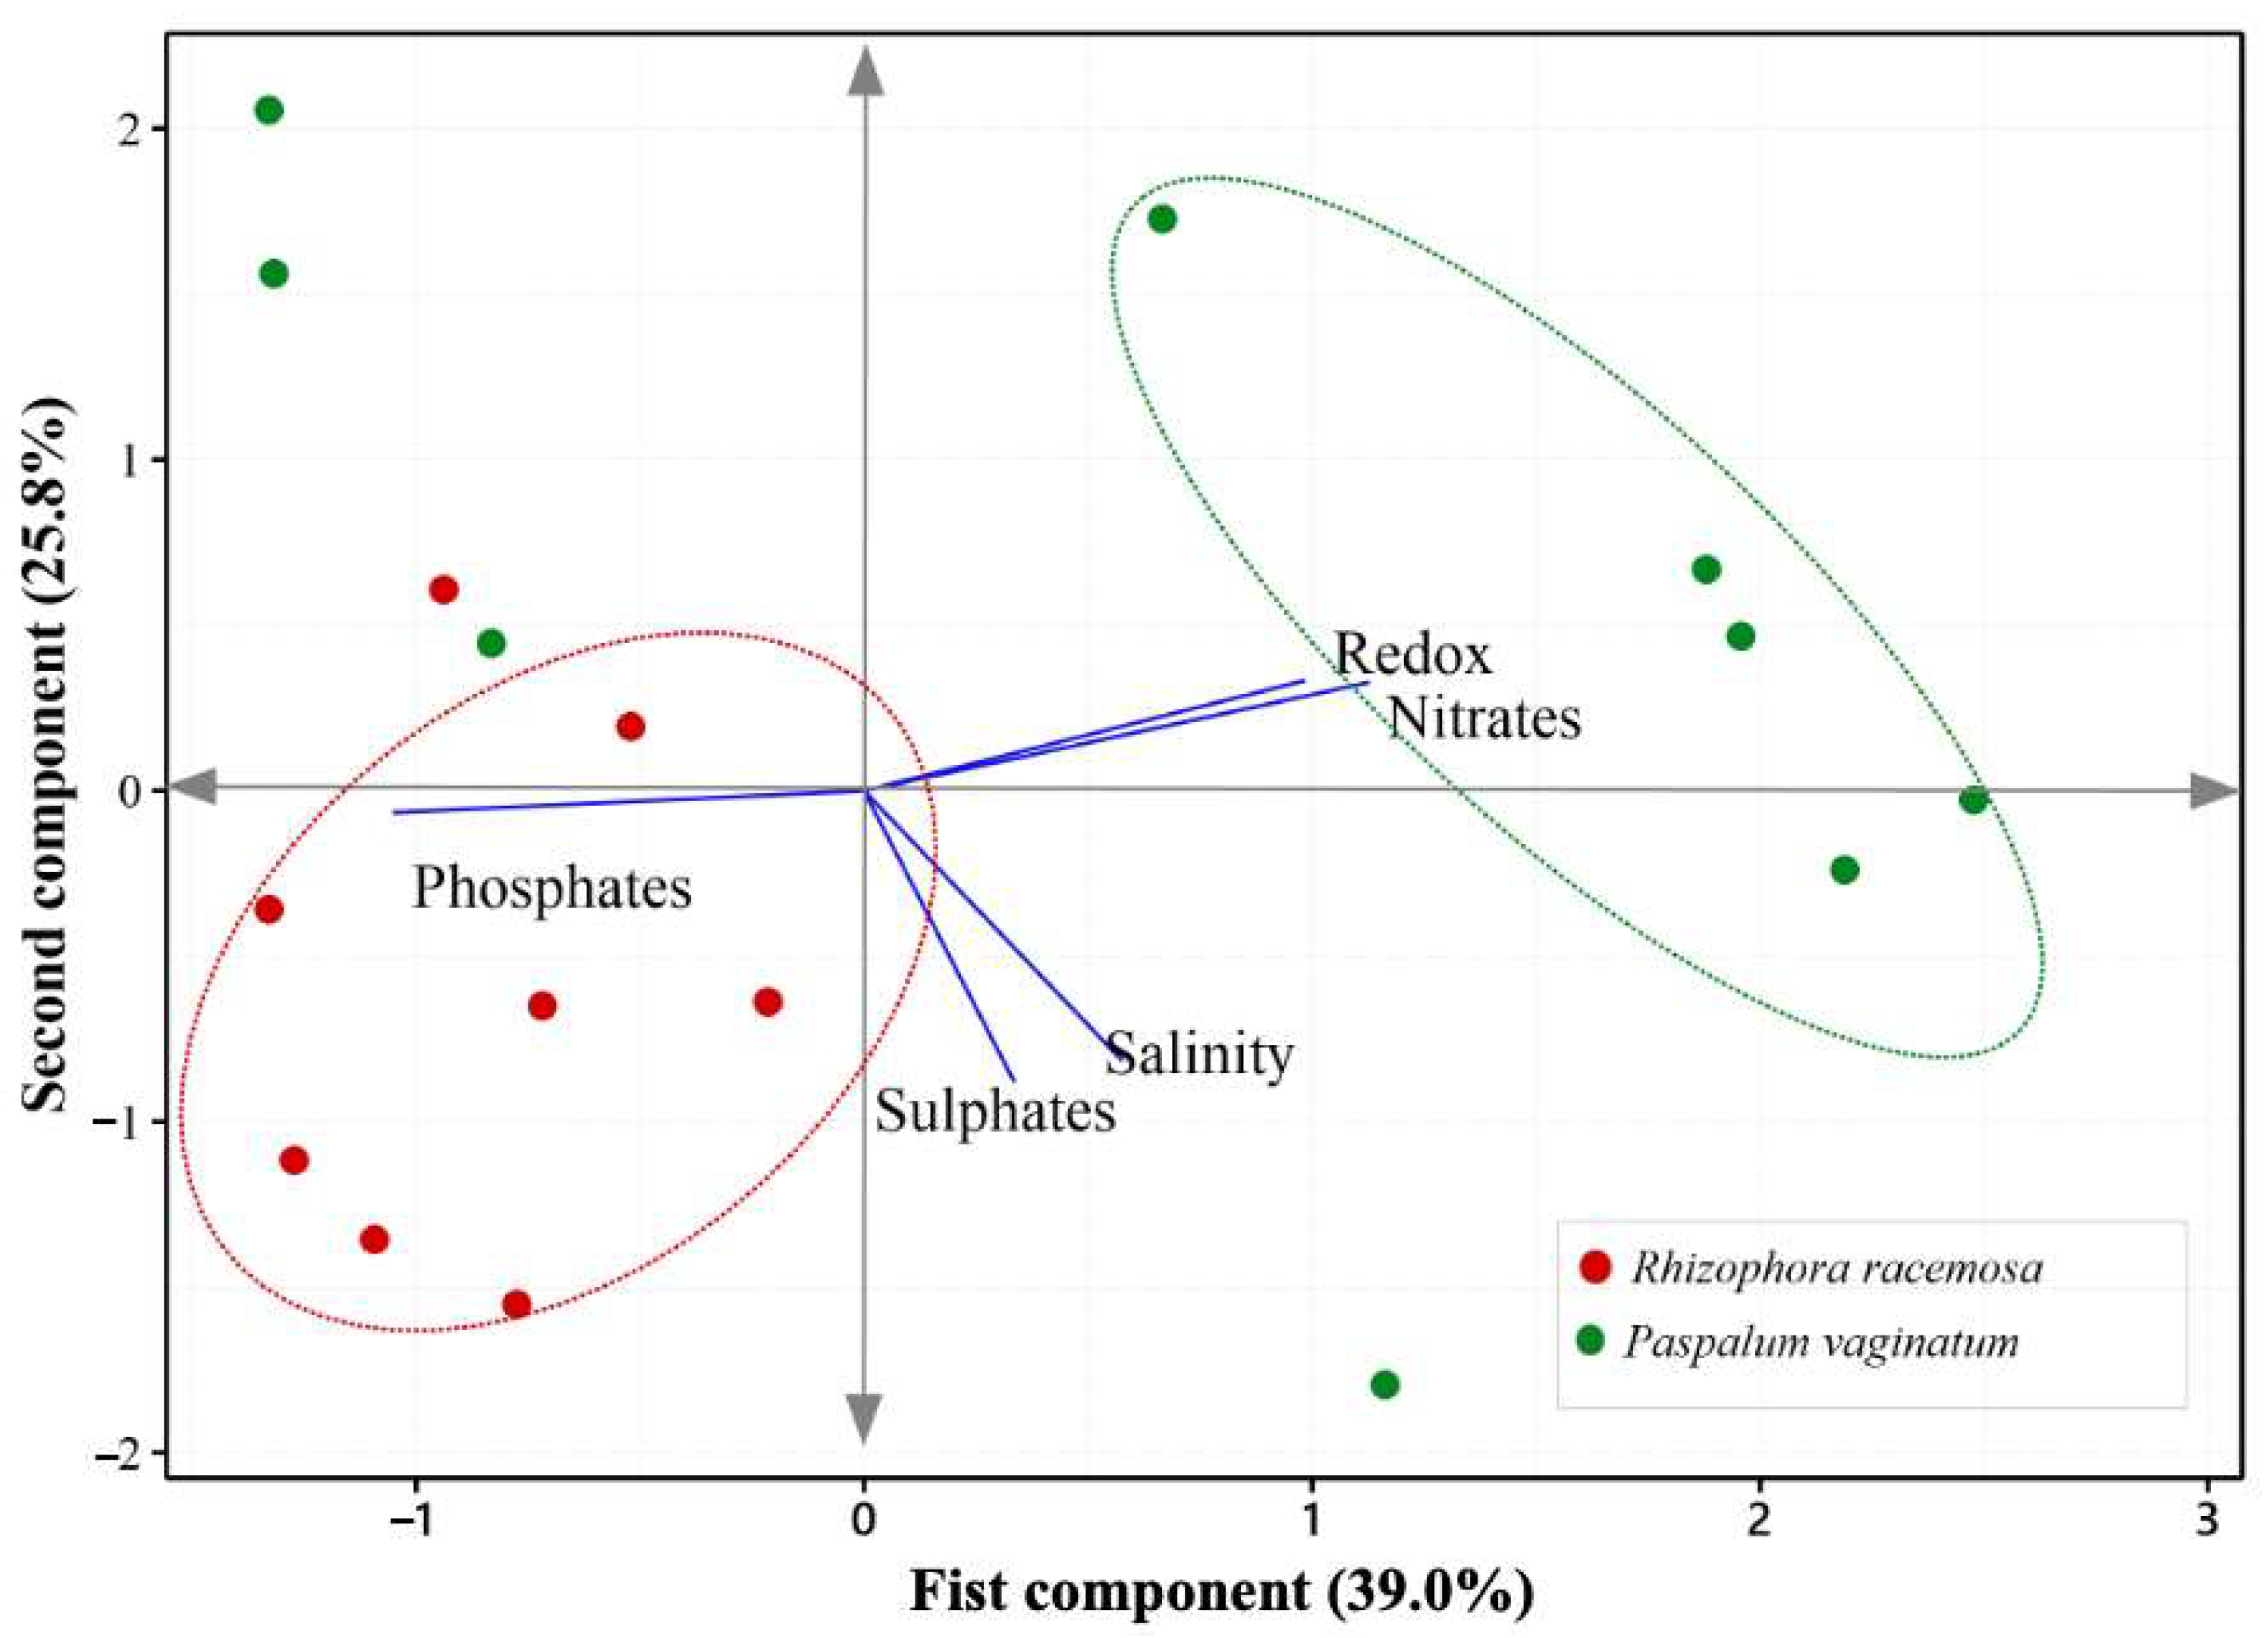
Principal Component Analysis (PCA) revealed that the first principal component (PC1) explained 39% of the total variance, mainly associated with nitrate, phosphate, and redox potential values (Table 2). The second component (PC2) accounted for an additional 25.8%, related to salinity and sulfate concentration. The PCA biplot clearly separated the plots from reference and degraded sites (Figure 2), with redox and nitrate vectors positively aligned with plots from the degraded, P. vaginatum-dominated site. This indicates that P. vaginatum invasion was associated with less reducing soil conditions and increased nitrogen availability compared to the reference mangrove site.

3.2. Biomass Carbon Associated with Invasion and Mangrove Restoration

Total biomass carbon stock was 22 ± 2.8 Mg C ha−1 in Mref, and 3.6 ± 0.5 Mg C ha−1 at invaded sites, a reduction of 83% compared to the reference (Table 3). Following restoration, total biomass carbon storage reached 1.7 ± 1.0 Mg C ha−1, equivalent to 7.8% of the reference site total. At all sites, most of the biomass carbon was stored in the aboveground component, particularly at Mres (83.5%).
Two regression equations were generated to estimate above- and belowground biomass, with tree height serving as the best predictor. Both models showed high coefficients of determination (R2 = 0.86 and R2 = 0.91, respectively; Figure 3). The high values of R2 indicated that these equations could be used with high confidence to estimate the biomass in this research, based on R. racemosa specimens ranging from 0.48 to 2.20 m in height, including individuals from Mres (Table 3).
Species-specific biomass-to-C conversion factors were derived using average C concentrations in stems (AGB) and roots (BGB). R. racemosa exhibited higher C concentrations in all tissues (Table 4): leaves (45.6%), stems (45.0%), and roots (38.0%). In contrast, P. vaginatum had lower C concentrations, particularly in roots (23.0%).
Nitrogen concentrations in R. racemosa leaves (1.6%) were higher than those in P. vaginatum (0.61%), whereas R. racemosa stems and roots had lower N concentrations (0.33% and 0.37%) than P. vaginatum (0.47% y 0.40%). The C/N ratio was significantly higher in R. racemosa stems (140) and roots (101); both species’ leaves had lower ratios, but R. racemosa maintained a lower C/N (28) compared to P. vaginatum (64). According to the Student’s t-tests, N concentrations differed significantly between R. racemosa and P. vaginatum in leaves and stems, but not in roots. Additionally, carbon concentrations and C/N ratios showed significant differences between the two species across all tissues (roots, stems, and leaves) (Table 1; Appendix B Table A1).

3.3. Soil Properties Following Paspalum vaginatum Invasion and Mangrove Restoration

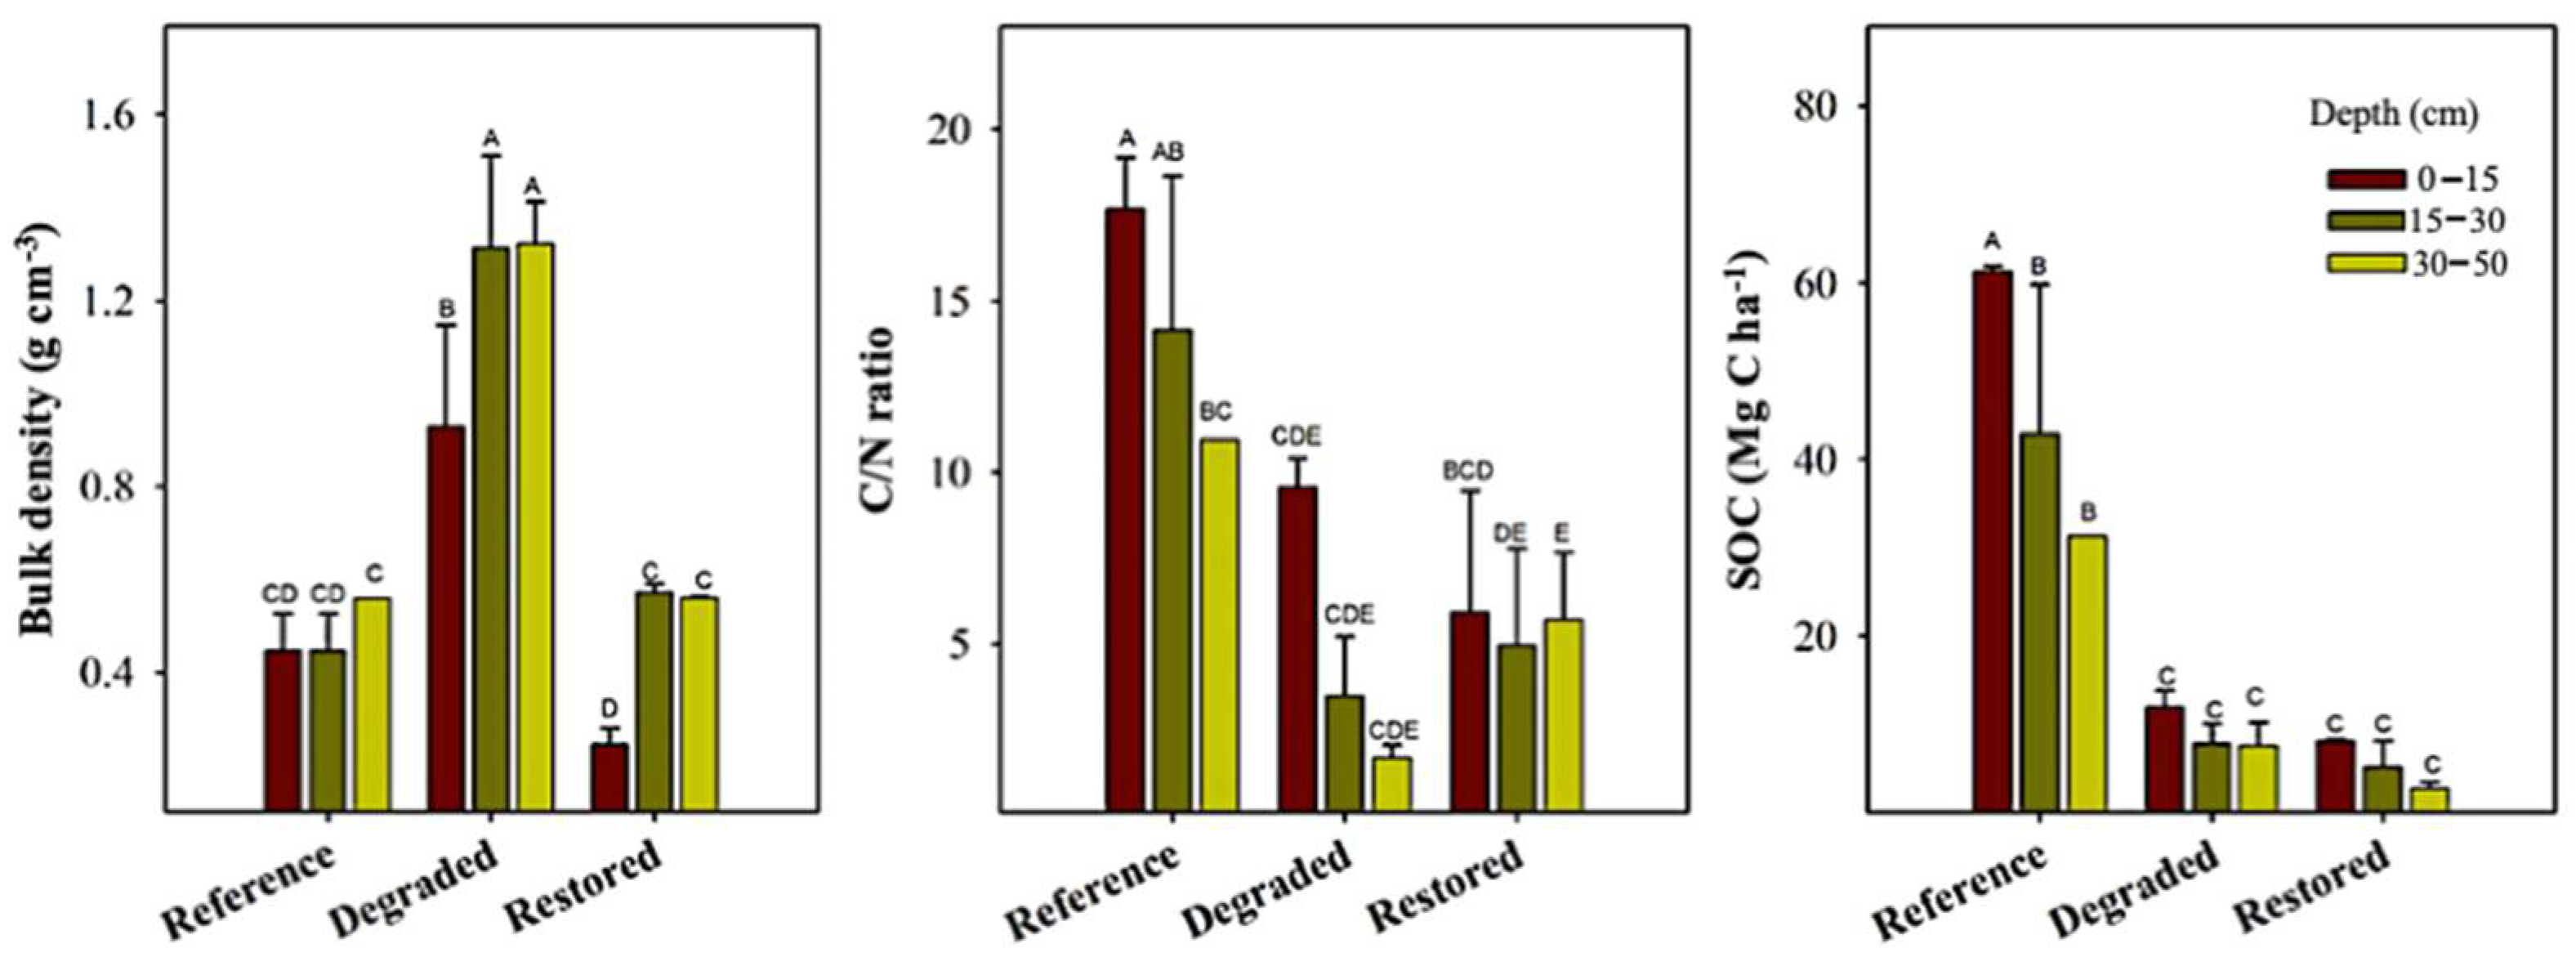
Mean soil bulk density in Mref was 0.48 ± 0.05 g cm−3; the degraded site had significantly higher compaction, with an average of 1.19 ± 0.02 g cm−3. Bulk density decreased following restoration in all soil layers, most notably in the upper 0–15 cm, which dropped to 0.25 ± 0.03 g cm−3 (Figure 4)
All soil physicochemical variables showed significant differences across sites and depths according to two-way ANOVA (Table 5). Soil organic carbon (SOC) and C/N ratios at Mres remained significantly lower than at Mref at all depths (post hoc analysis; Figure 4). C/N ratios were highest in the 0–15 cm layer at Mref (18 ± 1.5), compared to the invaded site (9.6 ± 0.8), paralleling SOC differences that declined from 61.3 ± 0.6 to 12.0 ± 0.9 Mg C ha−1. Following restoration, C/N ratio increased modestly in deeper layers (15–30 cm and 30–50 cm) at Mres (Figure 4).

3.4. Total Carbon Stock and CO2 Equivalent Emissions After Invasion and Restoration

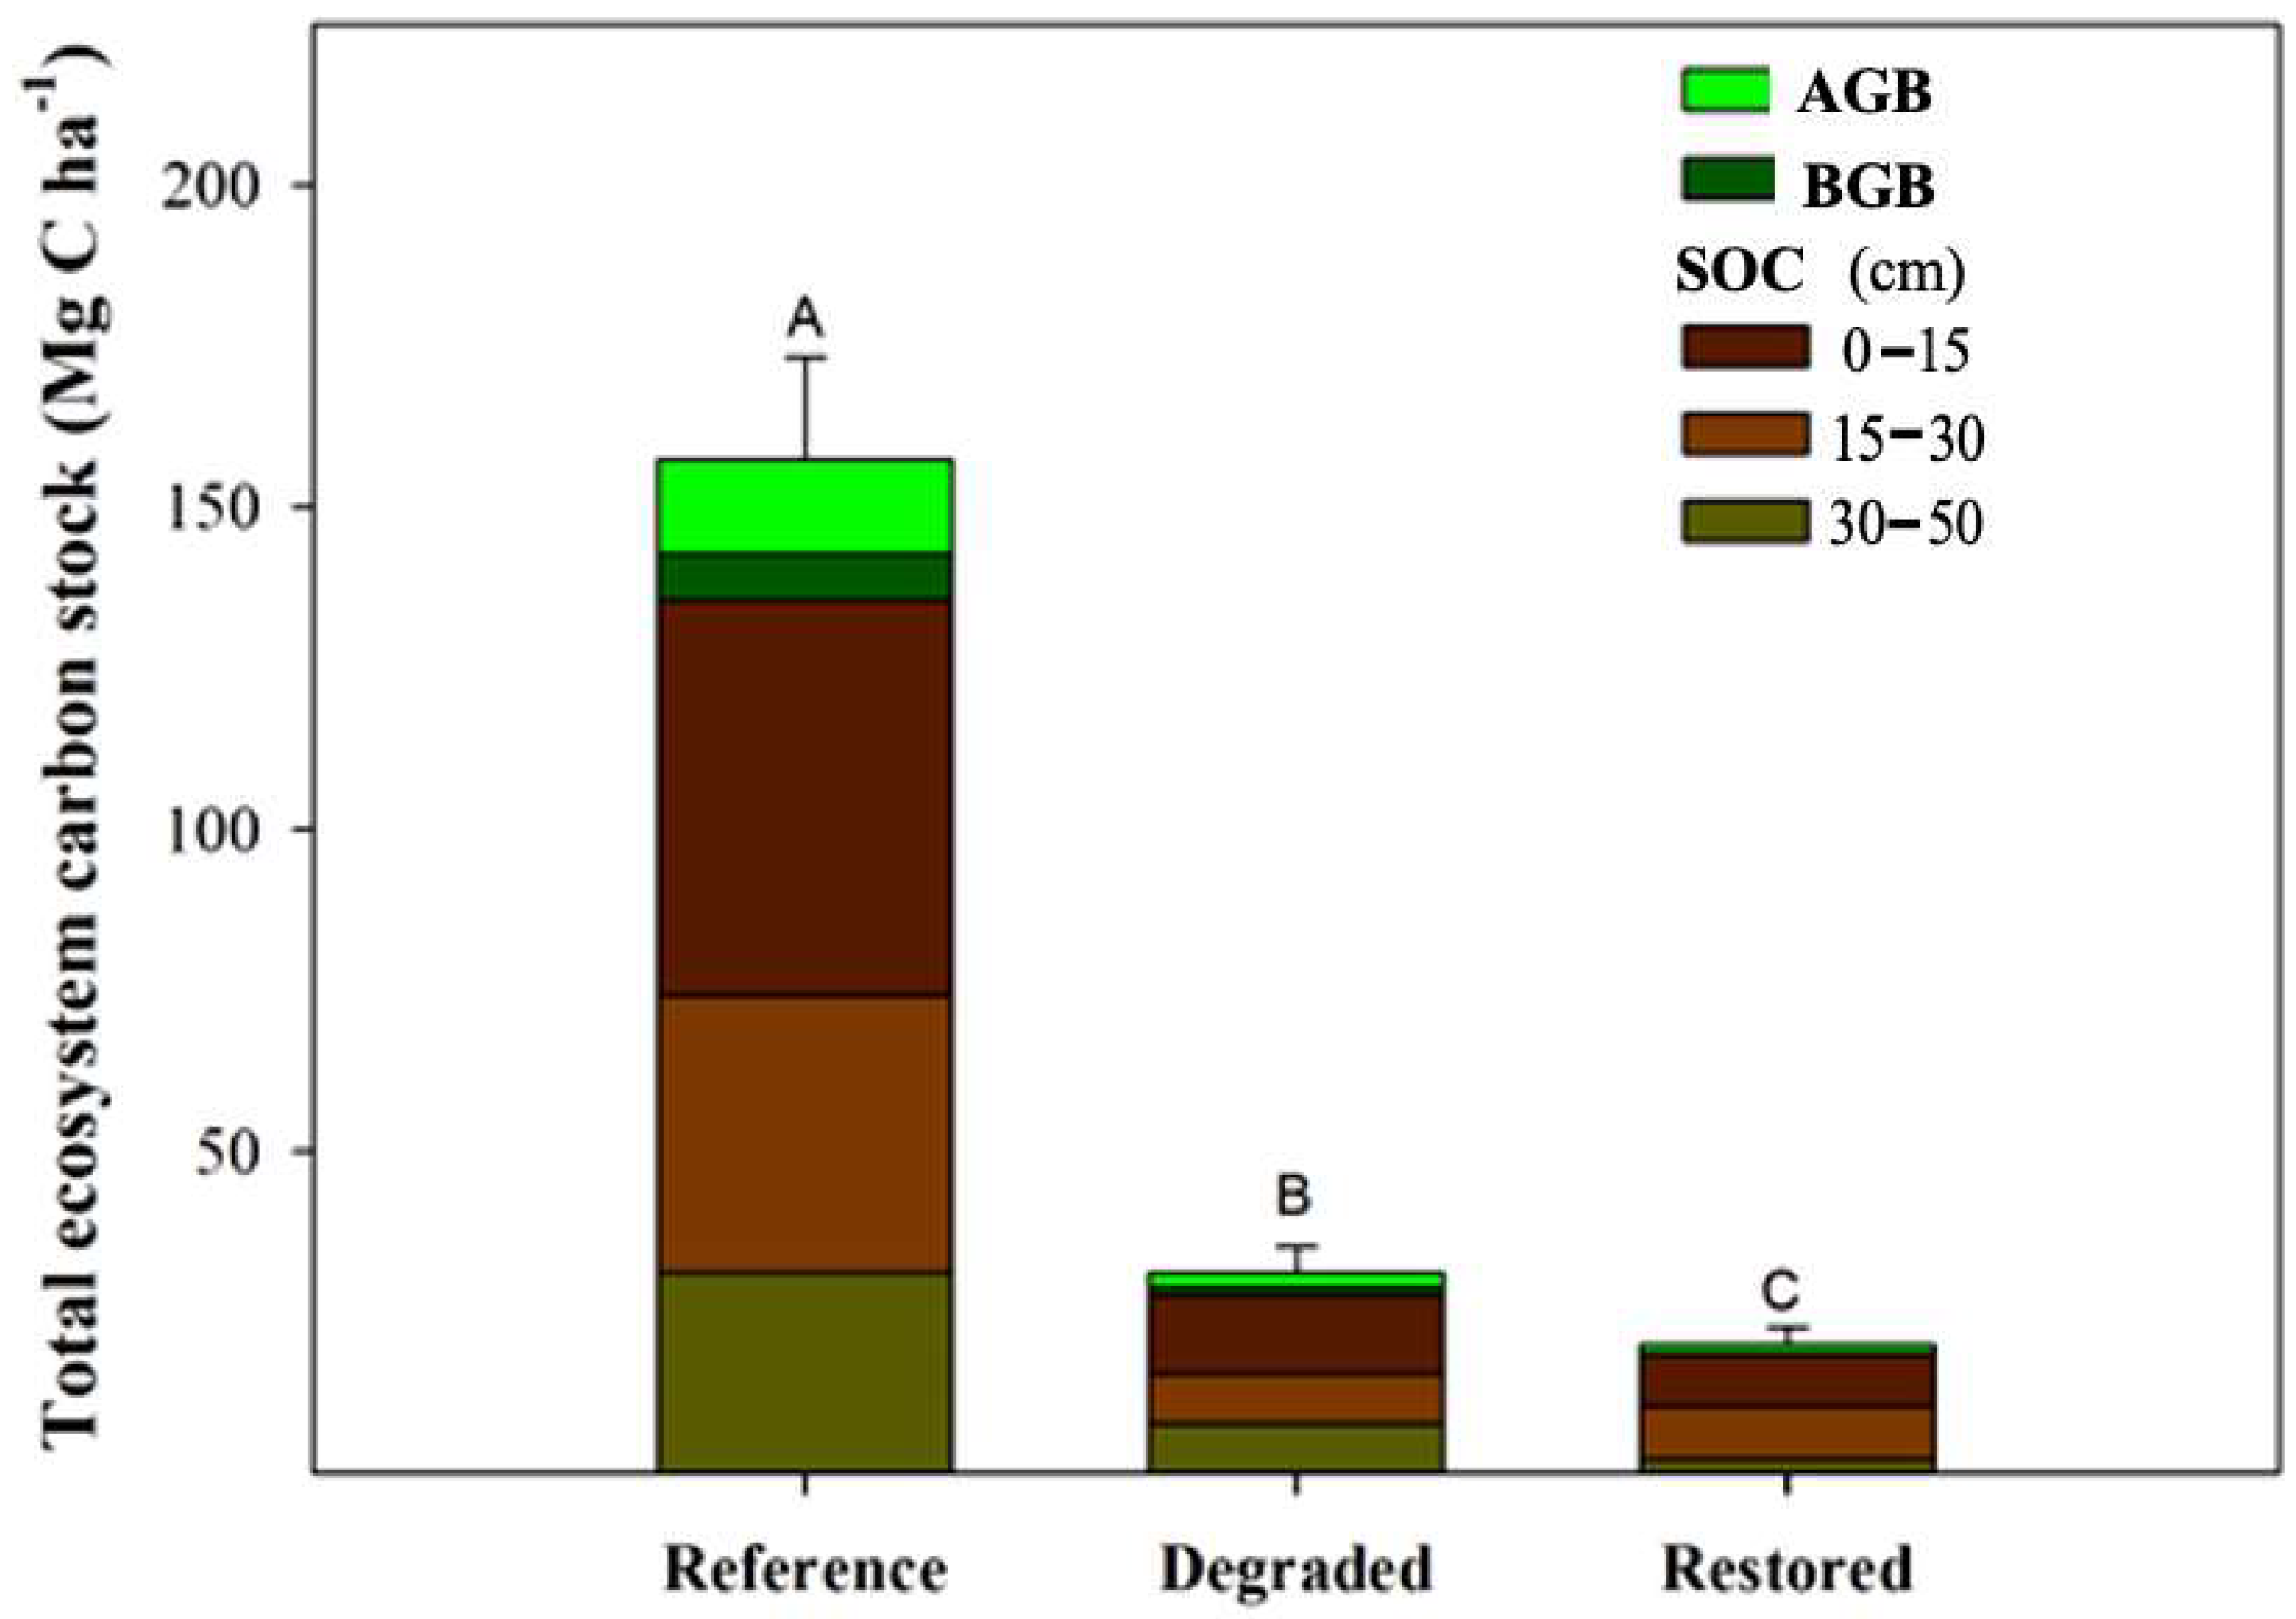
The total carbon stock at the reference mangrove site (Mref) was 157 ± 116.0 Mg C ha−1, with soil contributing on average 86.1% of total ecosystem carbon compared to vegetation biomass (Figure 5). At the degraded site (Mdeg), total carbon stock was 79.7% lower than at Mref (F2,6 = 74.25; p < 0.0001). SOC dropped from 136 ± 17.0 Mg C ha−1 at Mref to 28 ± 3.7 Mg C ha−1 at Mdeg, i.e., a 79.7% decrease.
Four years post-restoration, there were no statistically significant gains in total ecosystem carbon stock (20 ± 2.7 Mg C ha−1; Figure 5).
The reference site’s total carbon stock corresponded to approximately 578 Mg CO2e ha−1; at the degraded and restored sites, stocks were estimated at 114 and 73.7 Mg CO2e ha−1, respectively. These values suggest a net emission of 463 Mg CO2e ha−1 attributable to degradation by P. vaginatum.

3.5. Changes in Soil Gas Fluxes Following Mangrove Restoration

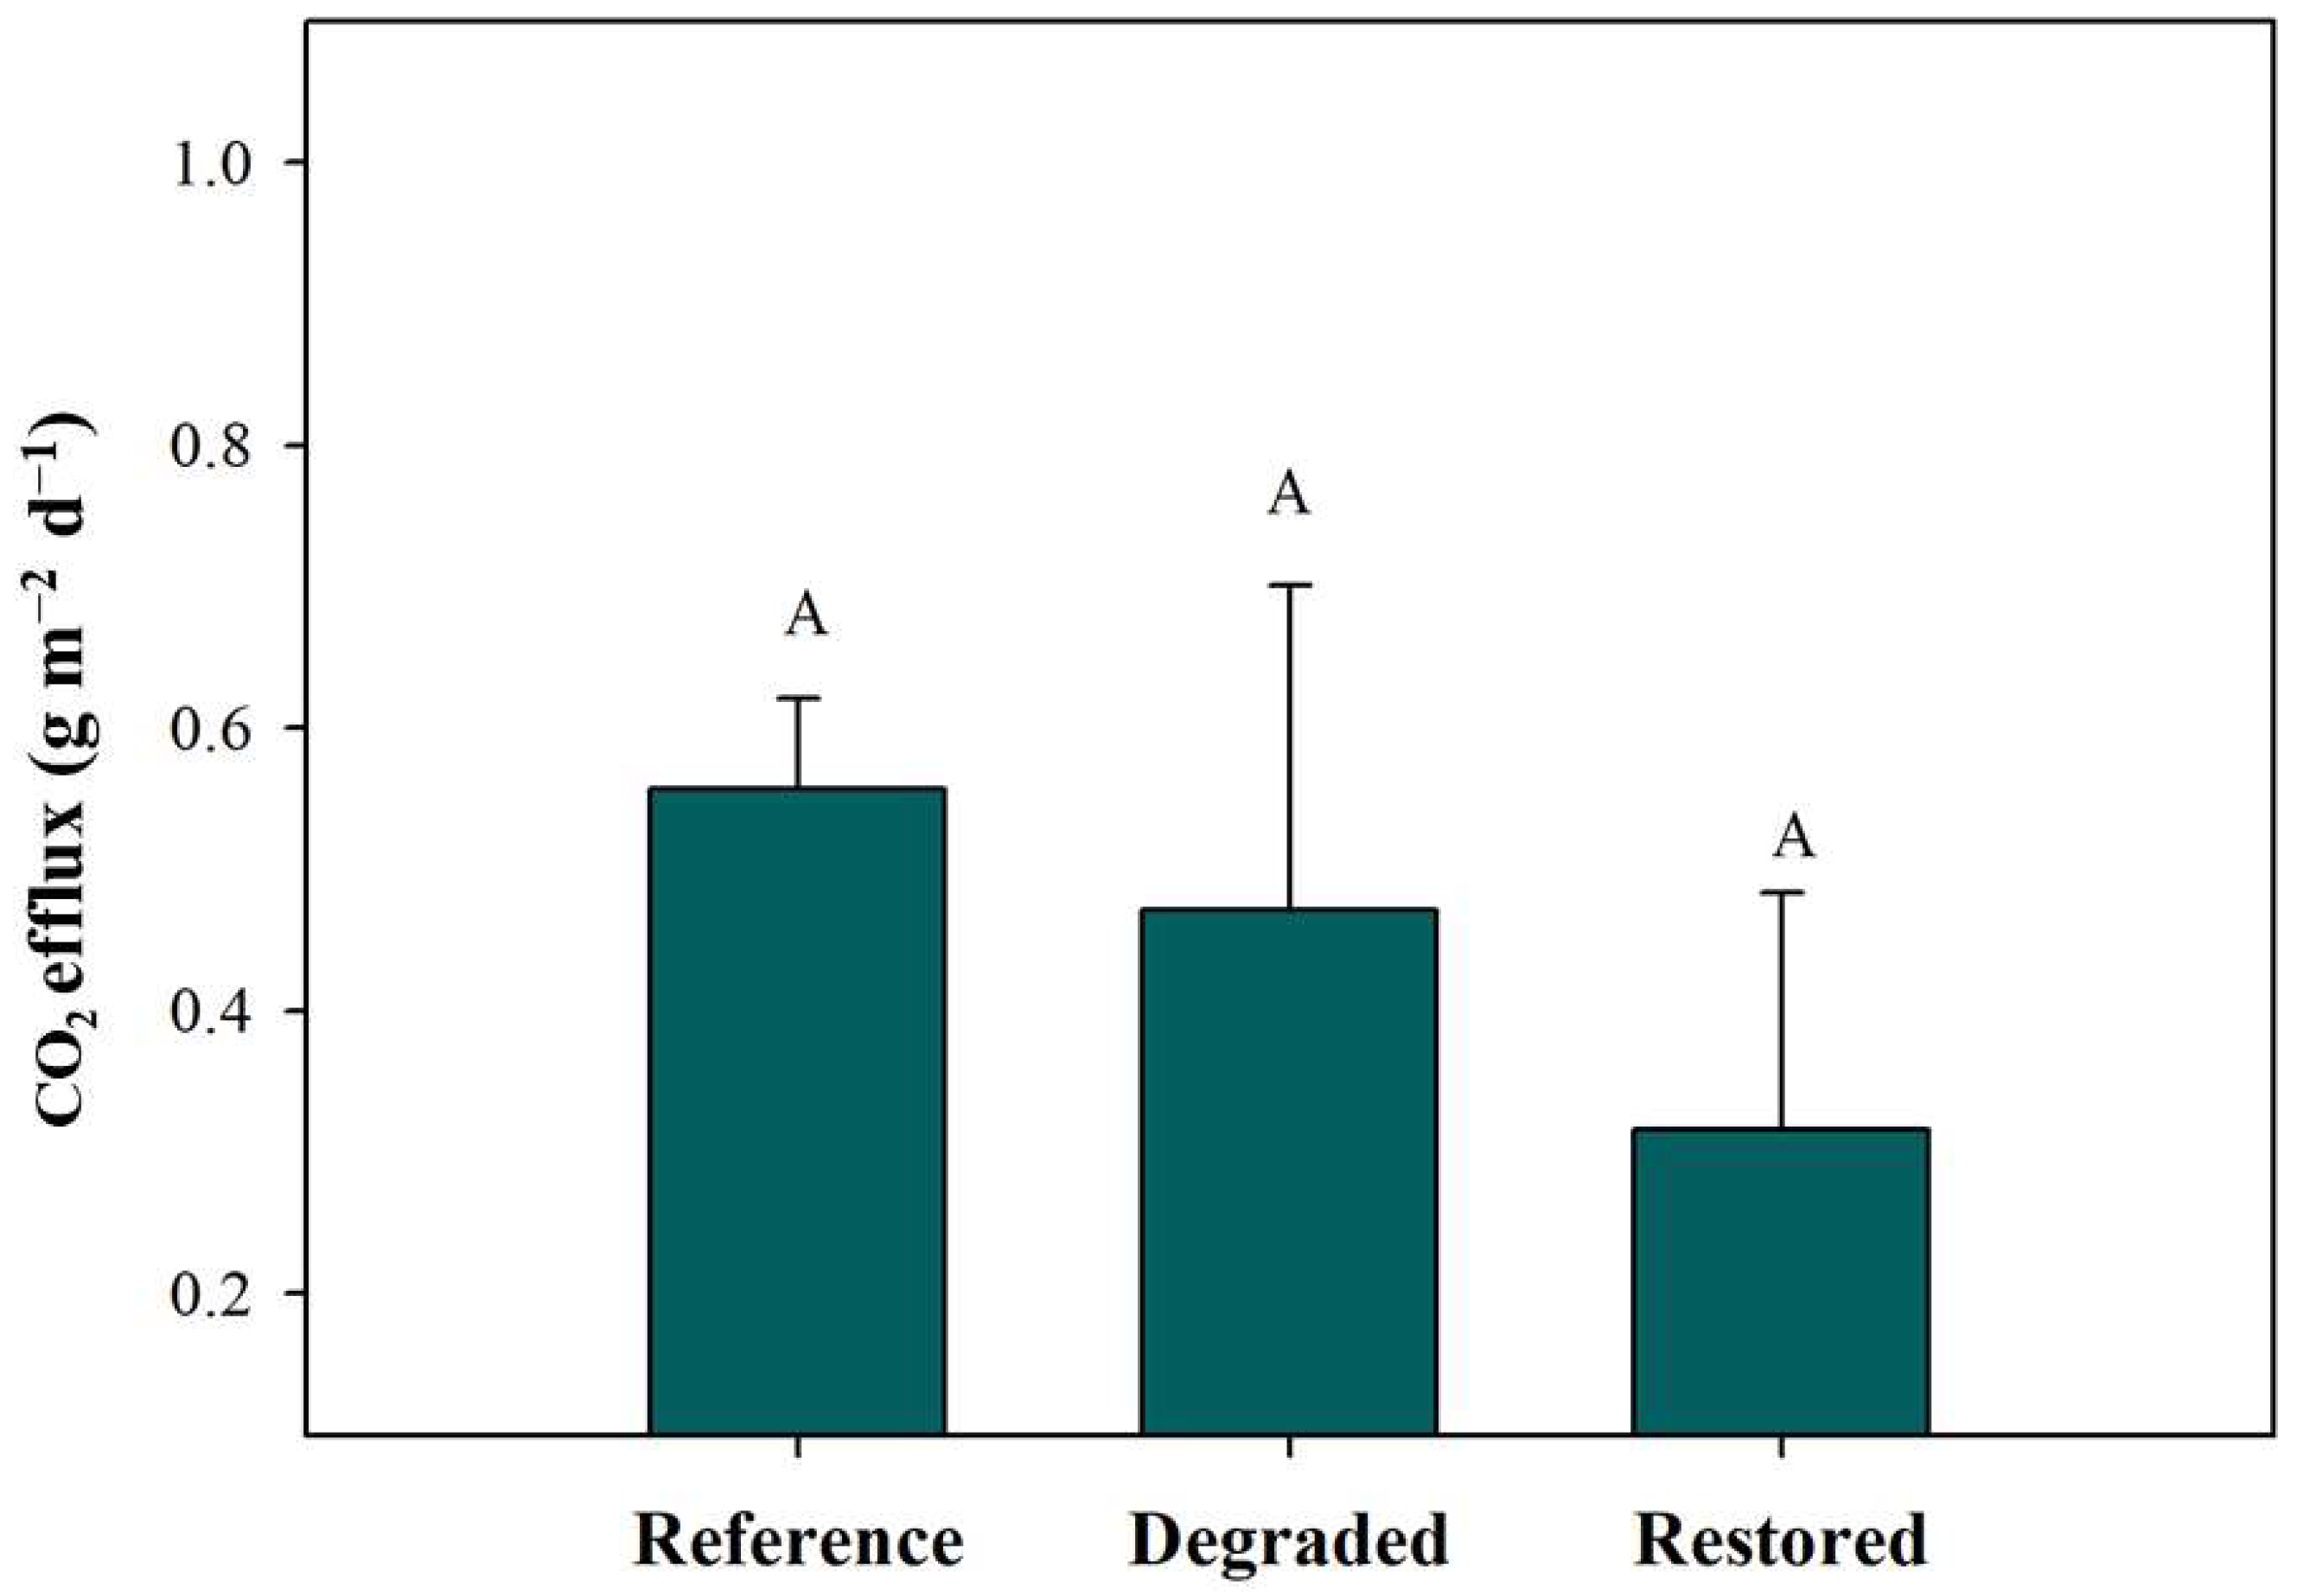
CO2 was the primary soil-emitted greenhouse gas across all study sites, while CH4 and N2O emissions were undetectable. Mean CO2 fluxes were 0.6 ± 0.1 g CO2 m−2 day−1 for Mref and 0.5 ± 0.2 g CO2 m−2 day−1 for Mdeg. In the restored site (Mres), CO2 emissions decreased by 60% to 0.3 ± 0.2 g CO2 m−2 day−1 (Figure 6); however, differences between sites were not statistically significant.

4. Discussion

4.1. Impact of Paspalum vaginatum Invasion on Carbon Storage in Mangroves

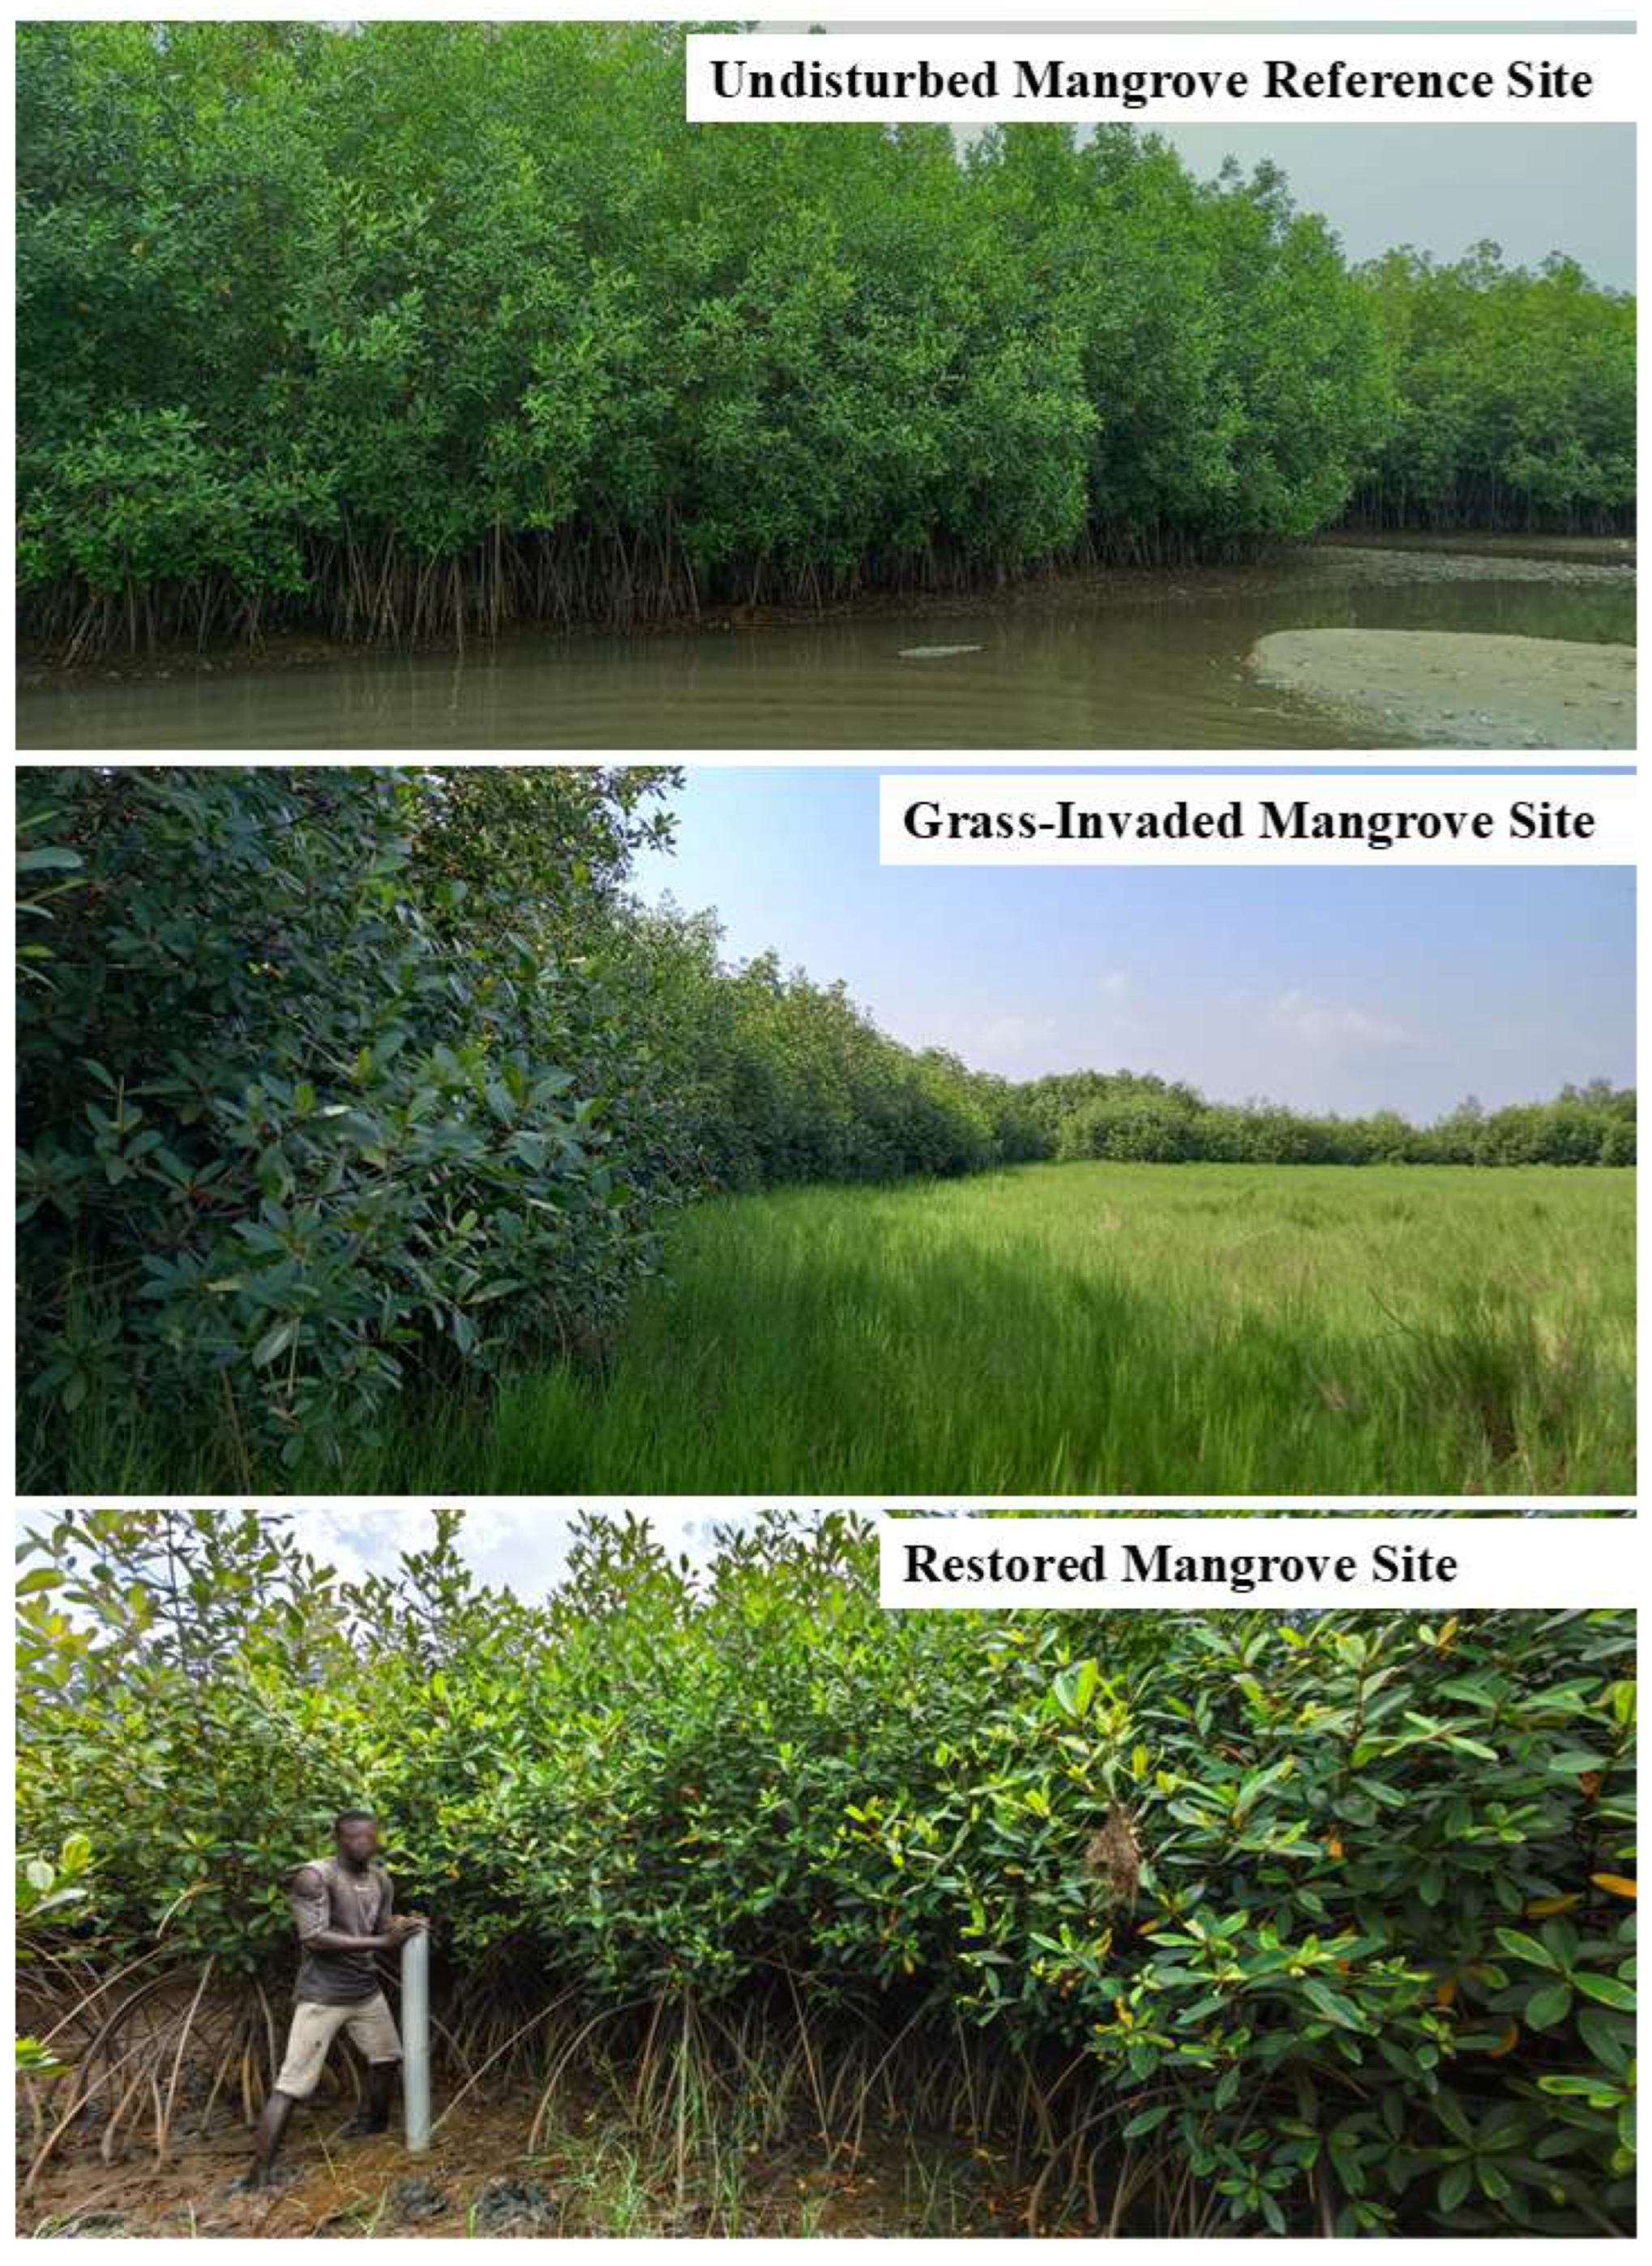
The invasion of P. vaginatum poses a growing threat to the ecological integrity of mangroves in several countries [37]. This species exhibits high phenotypic plasticity and several traits that facilitate its spread, including vegetative reproduction via rhizomes and stolons, and high foliar productivity [38]. In this study, we observed how P. vaginatum formed dense monospecific stands in areas formerly occupied by mangroves. These dense patches reduced light availability and inhibited the natural regeneration of endemic species by altering local environmental conditions at the invaded Benin site (Figure A1 and Figure A2).
In addition, P. vaginatum displayed higher N concentrations in its roots and stems compared to R. racemosa. This may reflect a functional investment in protein and enzyme synthesis (e.g., proline) as part of its response to water stress and salinity tolerance [39].
Principal component analysis (PCA) suggested that the invaded site had higher concentrations of nitrates in porewater (Figure 2), although this correlation should be interpreted cautiously and not taken as evidence of a direct causal link. Nonetheless, coastal ecosystems are particularly vulnerable to N-driven eutrophication from agricultural runoff, urban discharge, and household effluents [40].
Conversion of mangroves to grasslands dominated by P. vaginatum significantly reduced total carbon stocks. The estimated C loss (equivalent to 463 Mg CO2 ha−1) represents a serious compromise to the role of mangroves as strategic C sinks, with implications for climate change mitigation [14]. Similar losses have been documented in southern Mexico, where mangroves converted to livestock pastures also showed drastic reductions in C stocks [32]. By contrast, other invasive grasses such as Spartina alterniflora may increase soil organic carbon (SOC) storage [41]. Still, these invasions disrupt other critical mangrove functions, such as providing habitat for migratory species, particularly birds [42]. Therefore, mangroves invaded by non-native species should be prioritized for invasive species control and ecological restoration, given the high functional risks they face [10,43].

4.2. Soil Effects of Paspalum vaginatum Invasion and Carbon Loss

At the degraded site in Benin, soils were the most affected C pool, with an observed 79% reduction in SOC (Figure 5). This decline may be explained by two complementary processes: (1) lower C accumulation due to the reduced biomass of P. vaginatum compared to R. racemosa, leading to lower organic residue input; and (2) a lower C/N ratio in both the soil and roots of P. vaginatum compared to R. racemosa (Table 4; Figure 4 and Figure 5).
A low C/N ratio in organic residues typically indicates more labile material with fewer recalcitrant compounds like lignin or cellulose, making it more susceptible to mineralization [44,45]. Labile organic residues that reach the soil are more susceptible to decomposition in nutrient enrichment scenarios [46].
The input of nutrients, especially N and P, can alter the composition of soil microbial communities and lead to a 23% reduction in SOC [47]. These findings are particularly relevant in the context of mangroves invaded by P. vaginatum, where the results of this research suggest a trend toward higher nitrate concentrations in porewater (see Section 4.1). This quantitative observation underscores the urgency of directly measuring the contribution of nitrate enrichment to SOC depletion under grass invasion.
Additionally, P. vaginatum invasion increased soil bulk density at the degraded site (Mdeg), indicating compaction (Figure 4; Table 5). Compacted soils retain less moisture, due to reduced permeability, a pattern also documented in wetlands invaded by the grass Echinochloa pyramidalis [48].
At Mdeg, compaction combined with sediment accumulation in natural channels contributed to hydrological disconnection, limiting tidal flow and creating drier, better-oxygenated conditions [16]. These aerobic conditions increase the likelihood of organic residue decomposition and mineralization, accelerating SOC loss and enhancing CO2 emissions [49,50].
Mangrove fragmentation also disrupts hydrological and nutrient flows to adjacent ecosystems [29], thereby affecting seagrass beds and coral reefs, and potentially undermining food security for local fishing communities [51]. These functional interdependencies bolster the case for prioritizing mangrove conservation and restoration.

4.3. Carbon Recovery Following Mangrove Restoration

In recent studies, it has been reported that carbon stocks in biomass reach recovery levels of 71–73% of intact stands approximately 20 years after planting [52]. Four years after implementing restoration measures (hydrological rehabilitation and R. racemosa reforestation), 7.8% of C stored in aboveground and belowground biomass (1.7 Mg C ha−1) was recovered relative to the reference site in Benin (Table 3). Although this value remains low, it represents a key initial phase in ecological restoration. This result, together with the high degree of natural regeneration of R. racemosa, validates the effectiveness of the techniques applied to control the invasion of P. vaginatum. In addition, the recovered mangrove vegetation reached an average height of 1.25 m in four years (Table 3; Appendix A) and the biomass C stock exceeded that reported for 7–10-year-old Rhizophora spp. plantations in Senegal (1.05 Mg C ha−1), in a region located northeast of Benin [53]. Hydrological rehabilitation was essential for the high survival and growth rates of R. racemosa seedlings in Benin, improving key parameters such as salinity and redox potential within 24 months of the restoration [16]. These environmental factors are critical for mangrove establishment and productivity, influencing photosynthesis, nutrient uptake, and primary production [54,55].
SOC did not increase significantly within four years (a result consistent with the slow dynamics of SOC and its positive correlation with forest age) [56]. This finding is consistent with other studies showing that, even after five years, no substantial changes were observed in SOC stocks in reforested mangroves [52]; such studies indicated that, in early stages, planting mainly prevents further SOC losses resulting from prior land-use changes, rather than immediately increasing SOC [52]. In this research, a post hoc analysis confirmed that there were no significant differences in SOC content between pre- and post-restoration conditions at any of the depths evaluated (Figure 4).
However, an increase in the C/N ratio in deeper soil layers (15–30 and 30–50 cm) suggests the gradual replacement of P. vaginatum-derived residues with more recalcitrant inputs from R. racemosa roots (Table 4; Figure 4). Recent studies have shown that mangrove reforestation promotes the accumulation of SOC by providing residues or organic compounds that are intrinsically resistant to decomposition, derived from root growth, exudate production, leaf litter, and increased microbial biomass. These organic residues are usually composed of macromolecules with high aromaticity and abundant phenolic groups, which contribute to their persistence in the soil [57]. Moreover, soil CO2 emissions dropped by 60% at the restored site compared to the degraded site (Figure 6). While this reduction was not statistically significant in the early stages of restoration, the trend aligns with other studies reporting reduced emissions following hydrological restoration in mangroves [58]. This decrease likely reflects greater soil water saturation and reduced exposure to the atmosphere due to restored tidal flows via artificial channel excavation and natural channel dredging (Figure 1). Such conditions suppress aerobic microbial activity, slowing the organic residue decomposition and potentially enhancing C retention, key for generating carbon credits. Long-term and more frequent monitoring will be necessary to confirm these outcomes.

5. Conclusions

This study demonstrates that P. vaginatum invasion poses a significant threat to carbon storage in mangroves, by compacting soils, reducing recalcitrant SOM, and limiting endemic species growth. Four years after hydrological rehabilitation and reforestation with R. racemosa, the first signs of ecosystem recovery were evident through the initial accumulation of carbon in the aboveground and belowground biomass of this native mangrove species, increasing the C/N ratios in the deeper soil layers, and reducing soil CO2 emissions.
These findings underscore the value of invasive species control and hydrological restoration to mitigate carbon losses. We recommend long-term monitoring (beyond five years), including isotopic and metagenomic analyses, to better assess the SOM and microbial processes involved in carbon stabilization. These approaches will improve our understanding of ecological recovery and help optimize nature-based restoration strategies for climate resilience.

Author Contributions

Conceptualization, J.C.C.B. and C.M.A.H.; methodology, J.C.C.B. and C.M.A.H.; formal analysis, J.C.C.B., C.M.A.H., and J.F.G.L.; writing—original draft preparation, J.C.C.B.; writing—review and editing, J.C.C.B., C.M.A.H., J.F.G.L., and R.P.; visualization, J.C.C.B.; project administration, C.M.A.H.; funding acquisition, C.M.A.H. All authors have read and agreed to the published version of the manuscript.

Funding

This research is part of JCCB’s doctoral thesis, conducted at the Universidad Autónoma Metropolitana (UAM, Mexico), thanks to the financial support of scholarships granted by Secretaría de Ciencias, Humanidades, Tecnología e Innovación (SECIHTI) (Number Assigned to the Student: 926434) and the Universidad Autónoma de Campeche (UACAM, Mexico), in collaboration with the French Global Environment Facility (FFEM). Funding for sample collection at the restoration site in Ouidah, Benin, and for laboratory analysis at the Autonomous University of Campeche in Mexico, was provided by the FFEM, code 049/UAC/2017.

Data Availability Statement

Data are available from the authors upon reasonable request.

Acknowledgments

The Coastal Wetlands Laboratory and the EPOMEX Institute (UACAM, Mexico) provided the laboratory facilities and logistical support for sample collection. We would like to thank Jordan Reyes and Adrian Gregorio for their valuable assistance during fieldwork and laboratory analysis.

Conflicts of Interest

The authors declare no conflicts of interest.

Appendix A

Figure A1. Frontal view of the study sites in the Republic of Benin (West Africa), showing: the reference mangrove dominated by Rhizophora racemosa; the site degraded by Paspalum vaginatum grass invasion; and the restored site with reforested R. racemosa vegetation.
Resources 14 00122 g0a1
Figure A2. Biomass collection of Paspalum vaginatum in the degraded mangrove site prior to restoration actions (Benin, West Africa).
Resources 14 00122 g0a2

Appendix B

Table A1. Statistical comparison of carbon (C) and nitrogen (N) concentrations and C/N ratio in plant tissues of juvenile Rhizophora racemosa from the restored site and Paspalum vaginatum from the degraded site in Benin (West Africa), based on independent t-tests. NS = not significant; S = significant; df = degrees of freedom.
ComponentParametersdft-Valuep-ValueSignificance
RootsN (%) 0.530.624NS
C (%)44.240.013S
C/N ratio 4.550.010S
LeavesN (%)436.93<0.0001S
C (%)3.830.019S
C/N ratio9.860.001S
StemsN (%)43.220.032S
C (%)13.21<0.0001S
C/N ratio8.870.001S

References

  1. Donato, D.C.; Kauffman, J.B.; Murdiyarso, D.; Kurnianto, S.; Stidham, M.; Kanninen, M. Mangroves among the most carbon-rich forests in the tropics. Nat. Geosci. 2011, 4, 293–297. [Google Scholar] [CrossRef]
  2. Kida, M.; Fujitake, N. Organic carbon stabilization mechanisms in mangrove soils: A Review. Forests 2020, 11, 981. [Google Scholar] [CrossRef]
  3. Alongi, D.M. Global significance of mangrove blue carbon in climate change mitigation. Science 2020, 2, 67. [Google Scholar] [CrossRef]
  4. Lewis, D.B.; Brown, J.A.; Jimenez, K.L. Effects of flooding and warming on soil organic matter mineralization in Avicennia germinans mangrove forests and Juncus roemerianus salt marshes. Estuar. Coast. Shelf Sci. 2014, 139, 11–19. [Google Scholar] [CrossRef]
  5. Alongi, D.M. Carbon cycling and storage in mangrove forests. Annu. Rev. Mar. Sci. 2014, 6, 195–219. [Google Scholar] [CrossRef]
  6. Agraz, M.; Keb, C.; Chávez Barrera, J.; Osti-Sáenz, J.; Expósito-Díaz, G.; Alonso-Campos, V.; Muñiz-Salazar, R.; Ruiz-Fernández, A.; Pérez-Bernal, L.; Sánchez-Cabeza, J.-A.; et al. Reserva de carbón en un ecosistema de manglar al norte de México: Cambios ambientales durante 35 años. Rev. Mex. Biodivers. 2020, 91, 912910. [Google Scholar] [CrossRef]
  7. Lugo, A.E. Mangrove forests: A tough system to invade but an easy one to rehabilitate. Mar. Pollut. Bull. 1999, 37, 427–430. [Google Scholar] [CrossRef]
  8. Fournier, A.; Penone, C.; Pennino, M.G.; Courchamp, F. Predicting future invaders and future invasions. Proc. Natl. Acad. Sci. USA. 2019, 116, 7905–7910. [Google Scholar] [CrossRef]
  9. Biswas, S.R.; Biswas, P.L.; Limon, S.H.; Yan, E.-R.; Xu, M.-S.; Khan, M.d.S.I. Plant invasion in mangrove forests worldwide. For. Ecol. Manag. 2018, 429, 480–492. [Google Scholar] [CrossRef]
  10. Augusthy, S.; Nizam, A.; Kumar, A. The diversity, drivers, consequences and management of plant invasions in the mangrove ecosystems. Sci. Total Environ. 2024, 945, 173851. [Google Scholar] [CrossRef]
  11. Ehrenfeld, J.G. Effects of exotic plant invasions on soil nutrient cycling processes. Ecosystems 2003, 6, 503–523. [Google Scholar] [CrossRef]
  12. Bu, N.; Qu, J.; Li, Z.; Li, G.; Zhao, H.; Zhao, B.; Li, B.; Chen, J.; Fang, C. Effects of Spartina alterniflora invasion on soil respiration in the Yangtze River Estuary, China. PLoS ONE 2015, 10, e0121571. [Google Scholar] [CrossRef]
  13. Xuehui, Z.; Zhongsheng, Z.; Zhe, L.; Min, L.; Haitao, W.; Ming, J. Impacts of Spartina alterniflora invasion on soil carbon contents and stability in the Yellow River Delta, China. Sci. Total Environ. 2021, 775, 145188. [Google Scholar] [CrossRef]
  14. Xu, X.; Wei, S.; Chen, H.; Li, B.; Nie, M. Effects of Spartina Invasions on Blue Carbon Sequestration in China 2022, 309190 Bytes. Available online: https://figshare.com/articles/dataset/Effects_of_Spartina_invasions_on_blue_carbon_sequestration_in_China/19391063 (accessed on 1 June 2025).
  15. Li, G.; Xu, S.; Tang, Y.; Wang, Y.; Lou, J.; Zhang, Q.; Zheng, X.; Li, J.; Iqbal, B.; Cheng, P.; et al. Spartina alterniflora invasion altered soil greenhouse gas emissions via affecting labile organic carbon in a coastal wetland. Appl. Soil Ecol. 2024, 203, 105615. [Google Scholar] [CrossRef]
  16. Agraz Hernández, C.M.; Houndjinou, E.; Reyes Castellanos, J.E.; Chan Keb, C.A.; Osti Saénz, J.; Chávez Barrera, J.C.; Etienne, J.; Glèlè Kakaï, R.L.; Puschendorf, R. Hydrological repair and invasive grass removal restore Rhizophora racemosa mangrove communities in West Africa. Restor. Ecol. 2025, 32, e70084. [Google Scholar] [CrossRef]
  17. Song, S.; Ding, Y.; Li, W.; Meng, Y.; Zhou, J.; Gou, R.; Zhang, C.; Ye, S.; Saintilan, N.; Krauss, K.W.; et al. Mangrove Reforestation Provides Greater Blue Carbon Benefit than Afforestation for Mitigating Global Climate Change. Nat. Commun. 2023, 14, 756. [Google Scholar] [CrossRef]
  18. Song, W.; Hou, Y.; Zhu, W.; Fan, Y.; Xu, H.; Cai, C.; Li, G.; Huang, L. Enhancement effects of mangrove restoration on blue carbon storage in Qinzhou Bay. Front. For. Glob. Change 2024, 7, 1328783. [Google Scholar] [CrossRef]
  19. Sakai, Y.; Kouyama, T.; Kakinuma, K.; Sakaguchi, Y.; Yuasa, N.; Thongkao, S.; Boonming, S.; Chantrapromma, K.; Kato, S. Recovery of mangrove ecosystem carbon stocks through reforestation at abandoned shrimp pond in Southeast Thailand. Ecosyst. Health Sustain. 2023, 9, 0018. [Google Scholar] [CrossRef]
  20. Yang, F.; Li, R.; Wang, M.; Zhang, L.; Wang, W. Restoration patterns and influencing factors for the vegetation structure and carbon storage in mangroves converted from abandoned ponds. Glob. Ecol. Conserv. 2025, 58, e03430. [Google Scholar] [CrossRef]
  21. Beselly, S.M.; Van Der Wegen, M.; Reyns, J.; Grueters, U.; Dijkstra, J.T.; Roelvink, D. Strategic mangrove restoration increases carbon stock capacity. Commun. Earth Environ. 2025, 6, 422. [Google Scholar] [CrossRef]
  22. Jia, P.; Huang, W.; Zhang, Z.; Cheng, J.; Xiao, Y. The carbon sink of mangrove ecological restoration between 1988–2020 in Qinglan Bay, Hainan Island, China. Forests 2022, 13, 1547. [Google Scholar] [CrossRef]
  23. López-Portillo, J.; Zaldívar-Jiménez, A.; Lara-Domínguez, A.L.; Pérez-Ceballos, R.; Bravo-Mendoza, M.; Núñez Álvarez, N.; Aguirre-Franco, L. Hydrological rehabilitation and sediment elevation as strategies to restore mangroves in terrigenous and calcareous environments in Mexico. In Wetland Carbon and Environmental; Krauss, K.W., Zhu, Z., Stagg, C.L., Eds.; ManagementGeophysical Monograph Series; Wiley: Hoboken, NJ, USA, 2021; pp. 173–190. ISBN 978-1-119-63928-2. [Google Scholar]
  24. Naidoo, G. The Mangroves of Africa: A review. Mar. Pollut. Bull. 2023, 190, 114859. [Google Scholar] [CrossRef]
  25. Zanvo, M.G.S.; Barima, Y.S.S.; Salako, K.V.; Koua, K.A.N.; Kolawole, M.A.; Assogbadjo, A.E.; Glèlè Kakaï, R. Mapping spatio-temporal changes in mangroves cover and projection in 2050 of their future state in Benin. Bois for. Trop. 2022, 350, 29–42. [Google Scholar] [CrossRef]
  26. Kauffman, K.; Donato, D. Protocols for the Measurement, Monitoring and Reporting of Structure, Biomass and Carbon Stocks in Mangrove Forests; Center for International Forestry Research (CIFOR): Bogor, Indonesia, 2012. [Google Scholar]
  27. Agraz-Hernández, C.M.; Chan-Keb, C.A.; Muñiz-Salazar, R.; Pérez-Balan, R.A.; Vanegas, G.P.; Manzanilla, H.G.; Osti-Sáenz, J.; del Río Rodríguez, R. Pore Water Chemical variability and its effect on phenological production in three mangrove species under drought conditions in southeastern Mexico. Diversity 2022, 14, 668. [Google Scholar] [CrossRef]
  28. Agraz-Hernández, C.; Del Río-Rodríguez, R.; Chan-Keb, C.; Osti-Saenz, J.; Muñiz-Salazar, R. Nutrient removal efficiency of Rhizophora mangle (L.) Seedlings exposed to experimental dumping of municipal waters. Diversity 2018, 10, 16. [Google Scholar] [CrossRef]
  29. Chan-Keb, C.A.; Agraz-Hernández, C.M.; Pérez-Balan, R.A.; Expósito-Díaz, G.; Gutiérrez-Alcántara, E.J.; Muñiz-Salazar, R.; Osti-Sáenz, J.; Reyes-Castellano, J.E. Relationship between leaf degradation and pore water chemistry in two mangrove forests of southeastern Mexico. Diversity 2023, 15, 432. [Google Scholar] [CrossRef]
  30. Zanvo, S.M.G.; Mensah, S.; Salako, K.V.; Glèlè Kakaï, R. Tree height-diameter, aboveground and belowground biomass allometries for two west African mangrove species. Biomass Bioenergy 2023, 176, 106917. [Google Scholar] [CrossRef]
  31. Jones, A.R.; Raja Segaran, R.; Clarke, K.D.; Waycott, M.; Goh, W.S.H.; Gillanders, B.M. Estimating Mangrove tree biomass and carbon content: A comparison of forest inventory techniques and drone imagery. Front. Mar. Sci. 2020, 6, 784. [Google Scholar] [CrossRef]
  32. Kauffman, J.B.; Hernandez Trejo, H.; Del Carmen Jesus Garcia, M.; Heider, C.; Contreras, W.M. Carbon stocks of mangroves and losses arising from their conversion to cattle pastures in the Pantanos de Centla, Mexico. Wetl. Ecol. Manag. 2016, 24, 203–216. [Google Scholar] [CrossRef]
  33. Chan-Keb, C.A.; Agraz-Hernández, C.M.; Pérez-Balan, R.A.; Mas-Qui, O.O.; Osti-Sáenz, J.; Reyes-Castellanos, J.E. Relationship between carbon sequestration and soil physicochemical parameters in northern Campeche, Mexico. Land 2024, 13, 139. [Google Scholar] [CrossRef]
  34. Nóbrega, G.N.; Ferreira, T.O.; Artur, A.G.; de Mendonça, E.S.; de OLeão, R.A.; Teixeira, A.S.; Otero, X.L. Evaluation of methods for quantifying organic carbon in mangrove soils from semi-arid region. J. Soils Sediments 2015, 15, 282–291. [Google Scholar] [CrossRef]
  35. Passos, T.R.G.; Artur, A.G.; Nóbrega, G.N.; Otero, X.L.; Ferreira, T.O. Comparison of the quantitative determination of soil organic carbon in coastal wetlands containing reduced forms of Fe and S. Geo-Mar. Lett. 2016, 36, 223–233. [Google Scholar] [CrossRef]
  36. Agraz-Hernández, C.M.; Chan-Keb, C.A.; Muñiz-Salazar, R.; Pérez-Balan, R.A.; Osti-Sáenz, J.; Gutiérrez-Alcántara, E.J.; Reyes-Castellano, J.E.; May-Colli, L.O.; Conde-Medina, K.P.; Ruiz-Hernández, J. Relationship between blue carbon and methane and the hydrochemistry of mangroves in southeast Mexico. Appl. Ecol. Environ. Res. 2020, 18, 1091–1106. [Google Scholar] [CrossRef]
  37. Riefner Jr, R.E.; Columbus, J.T. Paspalum Vaginatum (Poaceae), a new threat to wetland diversity in southern California. J. Bot. Res. Inst. Tex. 2008, 2, 743–759. [Google Scholar]
  38. Saluzzo, H.; Reinoso, P.; Martínez, V. Caracterización y evaluación del crecimiento como césped de Paspalum almum, Paspalum denticulatum y Paspalum vaginatum. Phyton 2015, 84, 51–55. [Google Scholar]
  39. Elansary, H.O.; Yessoufou, K.; Abdel-Hamid, A.M.E.; El-Esawi, M.A.; Ali, H.M.; Elshikh, M.S. Seaweed extracts enhance salam turfgrass performance during prolonged irrigation intervals and saline shock. Front. Plant Sci. 2017, 8, 830. [Google Scholar] [CrossRef]
  40. Pérez, A.; Machado, W.; Sanders, C.J. Anthropogenic and environmental influences on nutrient accumulation in mangrove sediments. Mar. Pollut. Bull. 2021, 165, 112174. [Google Scholar] [CrossRef]
  41. Gu, J.; Wu, J. Blue Carbon Effects of Mangrove Restoration in subtropics where Spartina alterniflora invaded. Ecol. Eng. 2023, 186, 106822. [Google Scholar] [CrossRef]
  42. Okoye, O.K.; Li, H.; Gong, Z. Retraction of invasive Spartina alterniflora and its effect on the habitat loss of endangered migratory bird species and their decline in YNNR using remote sensing technology. Ecol. Evol. 2020, 10, 13810–13824. [Google Scholar] [CrossRef]
  43. Rendón-Hernández, E.; Ayala-Pérez, L.A.; Golubov, J.; Torres-Lara, R. Especies exóticas invasoras y sus implicaciones sobre los bosques de manglar en las reservas de La Biosfera Ría Celestún y Ría Lagartos. MYB 2024, 30, e3042627. [Google Scholar] [CrossRef]
  44. Jacotot, A.; Marchand, C.; Allenbach, M. Increase in growth and alteration of C:N ratios of Avicennia marina and Rhizophora stylosa subject to elevated CO2 concentrations and longer tidal flooding duration. Front. Ecol. Evol. 2019, 7, 98. [Google Scholar] [CrossRef]
  45. Ahmed, I.U.; Assefa, D.; Godbold, D.L. Land-use change depletes quantity and quality of soil organic matter fractions in Ethiopian Highlands. Forests 2022, 13, 69. [Google Scholar] [CrossRef]
  46. Thomson, T.; Pilditch, C.A.; Fusi, M.; Prinz, N.; Lundquist, C.J.; Ellis, J.I. Vulnerability of labile organic matter to eutrophication and warming in temperate mangrove ecosystems. Glob. Change Biol. 2025, 31, e70087. [Google Scholar] [CrossRef]
  47. Palacios, M.M.; Trevathan-Tackett, S.M.; Malerba, M.E.; Macreadie, P.I. Effects of a nutrient enrichment pulse on blue carbon ecosystems. Mar. Pollut. Bull. 2021, 165, 112024. [Google Scholar] [CrossRef]
  48. López Rosas, H.; Moreno-Casasola, P.; Mendelssohn, I.A. Effects of an African grass invasion on vegetation, soil and interstitial water characteristics in a tropical freshwater marsh in La Mancha, Veracruz (Mexico). J. Plant Interact. 2005, 1, 187–195. [Google Scholar] [CrossRef]
  49. Pendleton, L.; Donato, D.C.; Murray, B.C.; Crooks, S.; Jenkins, W.A.; Sifleet, S.; Craft, C.; Fourqurean, J.W.; Kauffman, J.B.; Marbà, N.; et al. Estimating global “Blue carbon” emissions from conversion and degradation of vegetated coastal ecosystems. PLoS ONE 2012, 7, e43542. [Google Scholar] [CrossRef]
  50. Grellier, S.; Janeau, J.-L.; Dang Hoai, N.; Nguyen Thi Kim, C.; Le Thi Phuong, Q.; Pham Thi Thu, T.; Tran-Thi, N.-T.; Marchand, C. Changes in soil characteristics and c dynamics after mangrove clearing (Vietnam). Sci. Total Environ. 2017, 593–594, 654–663. [Google Scholar] [CrossRef]
  51. Nagelkerken, I.; Blaber, S.J.M.; Bouillon, S.; Green, P.; Haywood, M.; Kirton, L.G.; Meynecke, J.-O.; Pawlik, J.; Penrose, H.M.; Sasekumar, A.; et al. The habitat function of mangroves for terrestrial and marine fauna: A Review. Aquat. Bot. 2008, 89, 155–185. [Google Scholar] [CrossRef]
  52. Bourgeois, C.F.; MacKenzie, R.A.; Sharma, S.; Bhomia, R.K.; Johnson, N.G.; Rovai, A.S.; Worthington, T.A.; Krauss, K.W.; Analuddin, K.; Bukoski, J.J.; et al. Four decades of data indicate that planted mangroves stored up to 75% of the carbon stocks found in intact mature stands. Sci. Adv. 2024, 10, eadk5430. [Google Scholar] [CrossRef]
  53. Manga, B.A.B.; Ndour, N.; Diatta, A.A.; Dasylva, M. Assessment of carbon sequestration by mangrove plantations in Casamance (Oussouye, Ziguinchor, Senegal). J. Ecol. Nat. Environ. 2022, 14, 109–120. [Google Scholar] [CrossRef]
  54. Flores-Verdugo, F.; Moreno-Casasola, P.; Agraz-Hernández, C.M.; López-Rosas, H.; Benítez-Pardo, D.; Travieso-Bello, A.C. La topografía y el hidroperíodo: Dos factores que condicionan la restauración de los humedales costeros. Bot. Sci. 2007, 80, S33–S47. [Google Scholar] [CrossRef]
  55. Krauss, K.W.; Lovelock, C.E.; McKee, K.L.; López-Hoffman, L.; Ewe, S.M.L.; Sousa, W.P. Environmental drivers in mangrove establishment and early development: A Review. Aquat. Bot. 2008, 89, 105–127. [Google Scholar] [CrossRef]
  56. Carnell, P.E.; Palacios, M.M.; Waryszak, P.; Trevathan-Tackett, S.M.; Masqué, P.; Macreadie, P.I. Blue carbon drawdown by restored mangrove forests improves with Age. J. Environ. Manag. 2022, 306, 114301. [Google Scholar] [CrossRef]
  57. Jiménez, L.C.Z.; Queiroz, H.M.; Otero, X.L.; Nóbrega, G.N.; Ferreira, T.O. Soil organic matter responses to mangrove restoration: A replanting experience in Northeast Brazil. Int. J. Environ. Res. Public Health 2021, 18, 8981. [Google Scholar] [CrossRef]
  58. Cameron, C.; Hutley, L.B.; Friess, D.A.; Munksgaard, N.C. Hydroperiod, soil moisture and bioturbation are critical drivers of greenhouse gas fluxes and vary as a function of land use change in mangroves of Sulawesi, Indonesia. Sci. Total Environ. 2019, 654, 365–377. [Google Scholar] [CrossRef]
Figure 1. Study area within Ouidah (Benin, West Africa). Top: location of the study sites, including the reference mangrove (Mref) and the restored site (Mres). (a) Community members participating in the excavation of artificial channels as part of the hydrological rehabilitation phase; (b) manual removal of the invasive grass Paspalum vaginatum; (c) reforestation with Rhizophora racemosa propagules; (d) condition of the mangrove vegetation four years after the restoration activities.
Resources 14 00122 g001
Figure 2. Biplot of the principal component analysis (PCA) based on physicochemical parameters of pore water in a Rhizophora racemosa mangrove (reference site) and a site invaded by Paspalum vaginatum in Benin (West Africa). Red and green points represent plots from each site, while blue vectors indicate the direction and contribution of the physicochemical variables.
Resources 14 00122 g002
Figure 3. Regression equations developed for estimating (a) aboveground and (b) belowground biomass in hydrologically rehabilitated and reforested sites with Rhizophora racemosa in Benin (West Africa).
Resources 14 00122 g003
Figure 4. Behavior of soil physical and chemical parameters at a Rhizophora racemosa reference mangrove site, a site invaded by Paspalum vaginatum, and a third site four years after restoration aimed at controlling the invasion in Benin (West Africa). Bars represent the mean values, and lines above each bar indicate the standard error of the mean. Different capital letters denote significant differences between sites according to a post hoc analysis. C/N = Carbon-to-nitrogen ratio; SOC = Soil organic carbon.
Resources 14 00122 g004
Figure 5. Total ecosystem carbon stock at three mangrove sites in Benin (West Africa). The following are compared: (i) a monospecific R. racemosa mangrove used as reference; (ii) a mangrove degraded by the invasion of Paspalum vaginatum; and (iii) a mangrove restored four years after implementing invasion control actions. Bars represent the mean carbon stock value, and lines above each bar indicate the standard error of the mean. Different capital letters denote significant differences between sites according to a post hoc analysis. AGB: Aboveground Biomass. BGB: Belowground Biomass. SOC: Soil Organic Carbon.
Resources 14 00122 g005
Figure 6. Soil carbon dioxide (CO2) flux in a R. racemosa reference mangrove site, a site invaded by Paspalum vaginatum, and a third site four years after restoration aimed at controlling the invasion in Benin (West Africa). Bars represent mean CO2 flux values, and lines above each bar indicate the standard error of the mean. Different capital letters denote significant differences between sites according to a post hoc analysis.
Resources 14 00122 g006
Table 1. Statistical comparison of porewater physicochemical parameters between a conserved mangrove site dominated by Rhizophora racemosa (reference) and a site invaded by Paspalum vaginatum in Benin (West Africa), based on independent t-tests. NS = not significant; S = significant; df = degrees of freedom.
Parametersdft-Valuep-Value Significance
Redox potential (mV)154.370.001S
Salinity (PUS)150.710.488NS
Nitrate (mg NO3 L−1)151.440.171NS
Phosphate (mg PO43− L−1)151.310.210NS
Sulfate (mg SO42− L−1)151.350.197NS
Table 2. Principal component analysis (PCA) of physical and chemical parameters of porewater in a conserved Rhizophora racemosa mangrove site (reference) and a site displaced by Paspalum vaginatum invasion in Benin (West Africa). PC1: Principal Component 1; PC2: Principal Component 2.
VariablesCP1 (39.0%)CP2 (25.8%)
Redox potential (mV)0.5050.258
Salinity (PUS)0.296−0.632
Nitrate (mg NO3 L−1)0.5790.254
Phosphate (mg PO43− L−1)−0.540−0.051
Sulfate (mg SO42− L−1)0.173−0.683
Table 3. Forest structure and above- and belowground biomass in three mangrove sites in Benin (West Africa): a conserved Rhizophora racemosa mangrove (Mref), a site invaded by Paspalum vaginatum (Mdeg), and a site four years after restoration actions were implemented (Mres). N.d. = Not determined.
SitioHeight (m)Density
(Ind. ha−1)
Aboveground
Biomass
(Mg C ha−1)
Belowground
Biomass
(Mg C ha−1)
Total Biomass
(Mg C ha−1)
Mref5.3 ± 1.2 a650 ± 7115 ± 1.8 a7.3 ± 1.0 a22 ± 2.8 a
Mdeg1.1 ± 0.3 cN.d2.3 ± 0.3 c1.4 ± 0.3 c3.6 ± 0.5 c
Mres1.25 ± 0.08 b1045 ± 4451.4 ± 0.2 b0.30 ± 0.02 b1.7 ± 1.0 b
Different lowercase letters mean the values are significantly different at p ≤ 0.05, based on the post hoc test.
Table 4. Carbon (C) and nitrogen (N) concentrations and C/N ratio in plant tissues (leaves, stems, and roots) of juvenile Rhizophora racemosa from the restored site and Paspalum vaginatum from the degraded site in Benin (West Africa).
SpeciesComponentN (%)C (%)C/N Ratio
Rhizophora racemosaRoot0.37 ± 0.0538 ± 1.4 101 ± 26
Leaves1.61 ± 0.0145.64 ± 0.0328 ± 3.1
Stem0.33 ± 0.0245 ± 1.3140 ± 10
Paspalum vaginatumRoot0.40 ± 0.0823 ± 6.754 ± 7.0
Leave0.61 ± 0.0439 ± 2.864 ± 5.0
Stem0.47 ± 0.0425.8 ± 1.255.9 ± 7.5
Table 5. Two-way ANOVA of soil physical and chemical parameters across three mangrove conditions: a reference Rhizophora racemosa site, a site degraded by Paspalum vaginatum invasion, and a site four years after restoration actions. SOC = Soil organic carbon; C/N = Carbon-to-nitrogen ratio; NS = Not significant; S = Significant.
VariableFactordfF-Valuep-ValueSignificance
Bulk density
(g cm−3)
Site (A)1950.56<0.0001S
Depth (B)197.920.003S
Interaction AxB190.560.697NS
C/N ratioSite (A)1916.43<0.0001S
Depth (B)193.780.041S
Interaction AxB190.900.486NS
SOC (Mg C ha−1)Site (A)1947.10<0.000S
Depth (B)194.300.029S
Interaction AxB191.790.172NS
Disclaimer/Publisher’s Note: The statements, opinions and data contained in all publications are solely those of the individual author(s) and contributor(s) and not of MDPI and/or the editor(s). MDPI and/or the editor(s) disclaim responsibility for any injury to people or property resulting from any ideas, methods, instructions or products referred to in the content.