3.1. Soil pH
The pH of the soil used in the incubation experiment indicated that the soil was very acidic (pH
KCl = 4.2), which indicated the need for the proposed fertilizing formulations based on carbonate-clay flour (
Table 1 and
Table 2). When used alone, at a dose calculated according to an extractable acidity of 2.0 EA, carbonate-clay flour increased soil pH
KCl to 6.3, which indicated that liming with this material was effective (
Table 2). The pH of the soil used, after applying the flour, was optimal for most plants, in the range of 6.0–7.5 [
26]. Successively, the use of only carbonate-clay flour, sewage sludge hygienized with lime, calcium sulfate and their mixtures in the soil had an effect on the alkalization of the soil environment, which resulted primarily from the action of the lime supplied in these materials. Therefore, it was important to dose calcium-containing materials correctly to prevent the soil from becoming too alkaline [
26].
Table 2.
Soil pH before and after incubation.
Table 2.
Soil pH before and after incubation.
| No. | Combination * | pH KCl | pH H2O |
|---|
| | | BI ** | AI | Mean | BI | AI | Mean |
|---|
| 1 | C | 4.2 | 4.0 | 4.1 | 5.9 | 5.2 | 5.6 |
| 2 | M | 6.3 | 7.1 | 6.7 | 6.5 | 7.6 | 7.1 |
| 3 | 5%MSS | 10.0 | 7.6 | 8.8 | 9.8 | 7.9 | 8.8 |
| 4 | 10%MSS | 11.3 | 7.9 | 9.6 | 11.5 | 8.2 | 9.9 |
| 5 | 0.2%S | 7.3 | 7.1 | 7.2 | 7.1 | 7.1 | 7.1 |
| 6 | 0.4%S | 8.4 | 7.3 | 7.8 | 7.8 | 7.7 | 7.8 |
| 7 | M5%MSS | 9.9 | 7.5 | 8.7 | 10.1 | 7.9 | 9.0 |
| 8 | M10%MSS | 10.9 | 7.7 | 9.3 | 11.6 | 8.5 | 10.0 |
| 9 | M0.2%S | 6.5 | 7.2 | 6.9 | 7.2 | 7.6 | 7.4 |
| 10 | M0.4%S | 7.7 | 7.4 | 7.6 | 7.9 | 7.7 | 7.8 |
| 11 | M5MSS0.2%S | 10.2 | 7.6 | 8.9 | 10.2 | 7.8 | 9.0 |
| 12 | M5MSS0.4%S | 10.1 | 7.5 | 8.8 | 10.5 | 7.9 | 9.2 |
| 13 | M10MSS0.2%S | 11.7 | 7.9 | 9.8 | 11.6 | 8.1 | 9.9 |
| 14 | M10MSS0.4%S | 11.2 | 7.3 | 9.2 | 11.3 | 8.3 | 9.8 |
| | Mean for date | 9.0 | 7.2 | 8.1 | 9.2 | 7.7 | 8.4 |
| NIRα≤0.01 for date | 0.1 | 0.1 |
| NIRα≤0.01 for combination | 0.3 | 0.2 |
| NIRα≤0.01 for interaction | 0.5 | 0.3 |
Formulations in which larger amounts of sewage sludge were used alkalized the soil to as high as pH ≈ 11. Such a strong alkalization of soil is not advisable because most agricultural plants develop well and provide a good yield with a soil pH ranging from weakly acidic to neutral. In addition, most nutrients are readily available to plants with a soil pH ranging from weakly acidic to neutral [
27].
After the three-month incubation period, it was established that the soil to which only carbonate-clay flour had been introduced (combination 2) had a higher pH value measured in potassium chloride compared to the value determined on the day of setting up the experiment, which pointed to a release of calcium ions responsible for alkalization and the high chemical reactivity of this material [
10]. The addition of sulfate sulfur to the flour (combination 9) had a positive effect on the soil pH value. Calcium sulfate does not deacidify soil, but provides, apart from sulfur, large amounts of calcium. Therefore, even after applying large doses of calcium sulfate, there is no change in pH, but the harmful effects of mobile aluminum in the soil are neutralized [
28,
29]. The appearance of mobile (exchangeable) aluminum in the soil is the result of the disintegration of clay minerals as a result of excessive soil acidification [
29]. In addition, under conditions of strong soil acidity, the concentration of free aluminum ions increases. These ions are toxic to plants [
30]. In other fertilizer treatments, the incubation period reduced the pH value of these materials compared to the value determined on the day of setting up the experiment. This may have been a result of the exchange of calcium cations from the used materials, occurring between the soil solution and the sorption complex, and a release of hydrogen cations in their place into the solution [
31]. The decrease in the pH value in these fertilizing formulations may also have resulted from the release of calcium ions and the transition into insoluble forms that did not enter into chemical reactions [
31]. Similar relationships between fertilizer combinations (components) were found after the pH value in distilled water was determined. When the pH of the control soil (object 1) was measured in distilled water after three months of incubation, a decrease in this parameter was registered. This decrease may have been due to the increased activity of microorganisms under conditions of adequate soil moisture.
3.2. Soil Salinity
The value of electrolytic conductivity (EC) of soil is an indicator of the amount of solutes in a soil solution and is the basis for inferring soil salinity [
21]. In the control soil, without waste additives, an increase in salinity was recorded. This was most likely due to the optimal moisture content and room temperature conditions promoting greater microbial activity [
32].
The application of sewage sludge to the soil, which could contain significant amounts of soluble salts (including salts containing sodium, phosphates and sulfate sulfur), resulted in a large increase in the value of electrolytic conductivity (
Table 3).
Table 3.
Salinity and organic carbon content in soil before and after incubation.
Table 3.
Salinity and organic carbon content in soil before and after incubation.
| No. | Combination * | EC (mS∙cm−1) | C-org (g∙kg−1) |
|---|
| | | BI ** | AI | Mean | BI | AI | Mean |
|---|
| 1 | C | 0.2 | 0.6 | 0.4 | 8.5 | 8.0 | 8.2 |
| 2 | M | 0.7 | 1.4 | 1.0 | 8.8 | 8.2 | 8.5 |
| 3 | 5%MSS | 2.5 | 3.2 | 2.8 | 12.0 | 10.0 | 11.0 |
| 4 | 10%MSS | 2.5 | 3.5 | 3.0 | 16.4 | 12.3 | 14.4 |
| 5 | 0.2%S | 2.7 | 3.5 | 3.1 | 8.8 | 7.9 | 8.3 |
| 6 | 0.4%S | 3.5 | 4.4 | 4.0 | 8.9 | 7.7 | 8.3 |
| 7 | M5%MSS | 1.4 | 3.2 | 2.3 | 13.3 | 9.2 | 11.3 |
| 8 | M10%MSS | 2.3 | 4.1 | 3.2 | 18.9 | 10.9 | 14.9 |
| 9 | M0.2%S | 3.1 | 3.3 | 3.2 | 8.5 | 7.8 | 8.1 |
| 10 | M0.4%S | 3.4 | 4.2 | 3.8 | 10.4 | 7.8 | 9.1 |
| 11 | M5MSS0.2%S | 3.0 | 5.2 | 4.1 | 13.6 | 9.7 | 11.6 |
| 12 | M5MSS0.4%S | 3.6 | 5.3 | 4.5 | 14.1 | 10.1 | 12.1 |
| 13 | M10MSS0.2%S | 3.9 | 4.7 | 4.3 | 17.6 | 10.2 | 13.9 |
| 14 | M10MSS0.4%S | 4.0 | 4.8 | 4.4 | 19.2 | 11.7 | 15.4 |
| | Mean for date | 2.6 | 3.7 | 3.2 | 12.8 | 9.4 | 11.1 |
| NIRα≤0.01 for date | 0.05 | 0.2 |
| NIRα≤0.01 for combination | 0.13 | 0.5 |
| NIRα≤0.01 for interaction | 0.18 | 0.8 |
After incubation, the largest values were recorded in the soil receiving treatments with flour, sewage sludge and sulfate sulfur (combinations 11–14). Our own study indicates that the additives applied to the soil were highly saline and increased the value of this parameter in the soil. The greater electrical conductivity of the substrates was mainly due to the presence of sulfate ions from the waste used [
33]. A study by [
34] showed significantly lower electrolytic conductivity values, ranging from 0.129 to 0.245 mS·cm
−1 in soil with the addition of sewage sludge and sulfur, regardless of the liming used. The introduction of various substances containing readily soluble inorganic compounds subject to dissociation in soil may cause an increase in the concentration of the soil solution to values that may interfere with plant development due to the inability to absorb water and nutrients [
21].
When assessing the value of electrolytic conductivity of the tested substrates, it was established that the salt content in these materials was much higher compared to soils on arable land [
35]. When the electrolytic conductivity of the soil reached a value of 4 mS·cm
−1, this was indicative of salinity in the soil [
36]. A value exceeding 4 mS·cm
−1 was recorded in the presented study, especially in treatments with the addition of sewage sludge and sulfate sulfur. According to the salinity-based categories of soil degradation, plants do not react to salinity if the EC value in the soil does not exceed 2 mS/cm
3. If the EC value ranges from 2 to 4 mS/cm
3, the soil is poorly degraded and some plants, especially those sensitive to salinity, will respond. If the EC value ranges from 4 to 8 mS/cm
3, the soil is moderately degraded and most crops will respond. An EC value above 8 mS/cm
3 indicates severe degradation, which only some species, including halophytes, can tolerate [
37].
3.3. Organic Carbon in Soil
The content of organic carbon in the soil used in the experiment was at a low level compared to the average values for light soils of Central Poland [
38,
39]. Immediately after the application of the carbonate-clay flour, there was a slight increase in the carbon content in the soil, while sewage sludge rich in organic matter increased its content by 0.4 to over 1.2 times compared to the control (
Table 3). This was a consequence of the organic substances contained in it, as some of them were mineralized and some of them were humidified after introduction to the soil [
38]. After the application of doses of sulfate sulfur, the level of organic carbon changed to some extent and was close to the content in the soil of the control plot (combinations 4–5). In contrast, the combined use of sewage sludge, carbonate-clay flour and sulfate sulfur significantly increased the organic carbon content in the soil (combinations 11–14).
After 3 months of incubation, the organic carbon content decreased in all soils receiving treatments in the experiment, and the largest loss was recorded in the soils receiving treatments with the highest dose of sewage sludge. The loss of organic carbon in the soil can be explained by the intensive mineralization of organic matter in the sewage sludge applied to the soil [
40]. Additionally, the loss of organic matter in the soil may have resulted from the leaching of dissolved organic matter [
11].
In the control soil, where no waste materials were added, the loss of organic matter was less intense. However, maintaining optimal moisture and room temperature conditions promoted the faster mineralization of organic matter [
11,
32].
Studies by other authors confirm that various additives, as well as land use, can affect the stability of the carbon pool and sequestration capacity by increasing the amount of organic carbon bound to soil minerals [
41]. Therefore, it is significant that some of the organic carbon in the soil was highly stable and did not mineralize.
3.4. Content of Available Forms of Macroelements in Soil (P, Ca, Mg, K, Na and S)
The content of nutrients determined by the Mehlich 3 method is considered mobile and potentially available to plants. This method was used for this study because it enabled the simultaneous extraction of many nutrients and toxic substances with a single solution while maintaining uniform extraction conditions [
42]. The Mehlich 3 method is widely used to determine the nutrient content of most mineral soils in many European countries.
The source of available forms of P, Ca, Mg and K in the soil was primarily sewage sludge, while the source of S and Na was waste sulfate sulfur (
Table 4,
Table 5 and
Table 6).
Table 4.
Content of available P and Ca in soil before and after incubation.
Table 4.
Content of available P and Ca in soil before and after incubation.
| No. | Combination * | P (mg∙kg−1) | Ca (g∙kg−1) |
|---|
| | | BI ** | AI | Mean | BI | AI | Mean |
|---|
| 1 | C | 153.8 | 96.5 | 125.1 | 1.2 | 0.9 | 1.1 |
| 2 | M | 140.7 | 120.7 | 130.7 | 13.6 | 8.2 | 10.9 |
| 3 | 5%MSS | 364.7 | 288.2 | 326.5 | 14.7 | 10.2 | 12.4 |
| 4 | 10%MSS | 471.4 | 452.2 | 461.8 | 25.7 | 18.1 | 21.9 |
| 5 | 0.2%S | 149.2 | 132.1 | 140.7 | 10.5 | 8.4 | 9.5 |
| 6 | 0.4%S | 130.3 | 123.5 | 126.9 | 15.7 | 11.9 | 13.8 |
| 7 | M5%MSS | 287.4 | 312.8 | 300.1 | 13.6 | 12.3 | 13.0 |
| 8 | M10%MSS | 418.7 | 523.8 | 471.3 | 19.2 | 18.2 | 18.7 |
| 9 | M0.2%S | 125.2 | 121.7 | 123.5 | 11.0 | 10.1 | 10.5 |
| 10 | M0.4%S | 114.9 | 108.5 | 111.7 | 12.9 | 12.4 | 12.6 |
| 11 | M5MSS0.2%S | 197.6 | 257.6 | 227.6 | 15.8 | 11.4 | 13.6 |
| 12 | M5MSS0.4%S | 186.5 | 257.8 | 222.2 | 17.0 | 12.3 | 14.7 |
| 13 | M10MSS0.2%S | 233.1 | 323.5 | 278.3 | 16.6 | 13.4 | 15.0 |
| 14 | M10MSS0.4%S | 232.9 | 318.4 | 275.7 | 17.5 | 14.2 | 15.9 |
| | Mean for date | 229.0 | 245.5 | 237.3 | 14.6 | 11.6 | 13.1 |
| NIRα≤0.01 for date | 3.5 | 0.2 |
| NIRα≤0.01 for combination | 9.3 | 0.7 |
| NIRα≤0.01 for interaction | 13.1 | 0.9 |
Table 5.
Content of available Mg and K in soil before and after incubation.
Table 5.
Content of available Mg and K in soil before and after incubation.
| No. | Combination * | Mg (mg∙kg−1) | K (mg∙kg−1) |
|---|
| | | BI ** | AI | Mean | BI | AI | Mean |
|---|
| 1 | C | 90.8 | 54.5 | 72.6 | 136.1 | 108.4 | 122.2 |
| 2 | M | 130.6 | 55.5 | 93.0 | 156.0 | 128.8 | 142.4 |
| 3 | 5%MSS | 182.8 | 96.9 | 139.8 | 200.8 | 170.1 | 185.4 |
| 4 | 10%MSS | 309.5 | 154.0 | 231.7 | 257.1 | 224.5 | 240.8 |
| 5 | 0.2%S | 106.6 | 47.3 | 77.0 | 160.5 | 139.6 | 150.0 |
| 6 | 0.4%S | 122.8 | 53.0 | 87.9 | 173.3 | 145.4 | 159.4 |
| 7 | M5%MSS | 160.0 | 102.2 | 131.1 | 168.0 | 154.4 | 161.2 |
| 8 | M10%MSS | 222.9 | 175.0 | 199.0 | 175.3 | 168.3 | 171.8 |
| 9 | M0.2%S | 94.3 | 56.1 | 75.2 | 165.3 | 134.5 | 149.9 |
| 10 | M0.4%S | 105.5 | 64.8 | 85.1 | 176.3 | 158.7 | 167.5 |
| 11 | M5MSS0.2%S | 121.2 | 105.1 | 113.2 | 187.3 | 154.5 | 170.9 |
| 12 | M5MSS0.4%S | 137.2 | 118.2 | 127.7 | 188.6 | 176.2 | 182.4 |
| 13 | M10MSS0.2%S | 156.3 | 130.2 | 143.2 | 231.9 | 209.6 | 220.8 |
| 14 | M10MSS0.4%S | 169.8 | 151.3 | 160.5 | 241.8 | 224.9 | 233.3 |
| | Mean for date | 150.7 | 97.4 | 124.1 | 187.0 | 164.1 | 175.6 |
| NIRα≤0.01 for date | 3.5 | 2.8 |
| NIRα≤0.01 for combination | 9.3 | 7.4 |
| NIRα≤0.01 for interaction | 13.1 | 10.4 |
Table 6.
Content of available Na and S in soil before and after incubation.
Table 6.
Content of available Na and S in soil before and after incubation.
| No. | Combination * | Na (mg∙kg−1) | S (mg∙kg−1) |
|---|
| | | BI ** | AI | Mean | BI | AI | Mean |
|---|
| 1 | C | 91.6 | 82.5 | 87.0 | 25.2 | 24.0 | 24.6 |
| 2 | M | 72.8 | 97.3 | 85.1 | 27.5 | 35.6 | 31.5 |
| 3 | 5%MSS | 254.8 | 313.2 | 284.0 | 75.2 | 95.4 | 85.3 |
| 4 | 10%MSS | 470.4 | 505.8 | 488.1 | 125.6 | 157.7 | 141.7 |
| 5 | 0.2%S | 445.8 | 355.8 | 400.8 | 709.7 | 730.9 | 720.3 |
| 6 | 0.4%S | 754.4 | 587.7 | 671.0 | 943.3 | 982.8 | 963.1 |
| 7 | M5%MSS | 524.6 | 277.2 | 400.9 | 89.9 | 112.0 | 101.0 |
| 8 | M10%MSS | 724.3 | 434.8 | 579.5 | 122.7 | 186.0 | 154.3 |
| 9 | M0.2%S | 450.8 | 312.7 | 381.8 | 443.5 | 721.5 | 582.5 |
| 10 | M0.4%S | 727.0 | 482.8 | 604.9 | 749.5 | 1141.1 | 945.3 |
| 11 | M5MSS0.2%S | 466.8 | 414.0 | 440.4 | 450.6 | 754.7 | 602.6 |
| 12 | M5MSS0.4%S | 563.7 | 514.3 | 539.0 | 677.3 | 1107.3 | 892.3 |
| 13 | M10MSS0.2%S | 638.1 | 524.5 | 581.3 | 545.2 | 742.3 | 643.8 |
| 14 | M10MSS0.4%S | 724.9 | 675.6 | 700.2 | 737.8 | 852.3 | 795.1 |
| | Mean for date | 493.6 | 398.4 | 446.0 | 408.8 | 546.0 | 477.4 |
| NIRα≤0.01 for date | 3.5 | 4.2 |
| NIRα≤0.01 for combination | 9.3 | 11.2 |
| NIRα≤0.01 for interaction | 13.1 | 15.8 |
The addition of only carbonate-clay flour and sulfate sulfur, as well as a combination of both products, and combinations including all three components, significantly increased the Ca and Mg content (except for combination 9) in the soil immediately after application. The increase in the content of available Ca in the soil confirms the suitability of using carbonate-clay flour on light, acidic, poorly buffered soils [
10,
31]. Among the studied macronutrients, a slight increase in the content of available K under the influence of the materials used (flour, sewage sludge, and sulfate sulfur) was found compared to the control. In the case of P, it was established that sulfate sulfur, used alone and together with flour, reduced the amount of available forms of this nutrient compared to the control. The application of only sulfate sulfur to the soil as well as in combination with carbonate-clay or flour and sewage sludge increased the available S content compared to the control. With regard to the content of sodium available for plants, only the exclusive use of carbonate-clay flour resulted in a significant reduction in this value (combination 2). For the other combinations, a significant increase in sodium content was recorded.
Incubation of the control soil resulted in a decrease in the bioavailability of P, Ca, Mg and K, which was probably due to these nutrients being permanently retained in the soil sorption complex [
27].
The 3-month incubation period resulted in a reduction in the content of available Ca, Mg, K and, as a rule, Na in the soil with waste compared to the content of these elements on the day of setting up the experiment. A reduction in bioavailable forms of macronutrients can be explained by their possible precipitation into insoluble forms or permanent retention in the soil sorption complex [
27,
43]. In the case of S, it was established that during incubation, the content of this element in the form available to plants increased (except the control), which substantiates the possibility of using this material for enriching soils low in sulfur [
14,
15,
34]. The process of the incubation of soil with the addition of sewage sludge and carbonate flour, as well as flour, sewage sludge and sulfate sulfur, also increased the bioavailable forms of P in the soil, which is beneficial from the point of view of the nutritional needs of plants [
34,
44].
The content of all the studied macroelements increased significantly after the application of the tested additives in relation to the soil of the control plot, both immediately after application and after 3 months of incubation. On the one hand, this is a positive phenomenon because these materials provide nutrients. On the other hand, given the increased electrolytic conductivity, it may prove unfavorable when using fertilizers in agricultural practice [
34]. The most beneficial practice in this respect is the use of carbonate-clay flour, which, while causing a positive change in soil pH, did not cause excessive salinity in the soil or a release of excessive amounts of nutrients in a short time frame. Nutrients are released into the soil through sorption and desorption processes, which are regulated by the pH level and changes in the soil’s physicochemical properties [
27,
44,
45]. Therefore, adding the studied waste alters the pH and properties of the soil.
The optimal dose of the tested waste materials do not cause excessive salinity and can promote the leaching of nutrients and the subsequent contamination of soils and groundwater [
34]. Combining alkaline carbonate–lime meal with sewage sludge probably increases nitrogen losses in the form of ammonia, which is harmful to crops and the environment [
41].
The assessment of the macroelement content in soil before and after incubation, according to the limit values for the Mehlich 3 method, pointed to a high content of P and K and a very high content of Mg recognized for most crops [
42].
The introduction of deficit elements—magnesium and sodium—into the soil can be considered a beneficial feature of sewage sludge. At the same time, a large load of sodium and phosphorus introduced with sewage sludge may have an adverse effect on soil and plant properties [
45]. A large load of sodium may cause salinity in the soil, and a large load of phosphorus may lead to the eutrophication of the environment if fertilizer is applied to soils exposed to erosion, causing a washout of the topsoil [
21,
45]. This is dangerous, especially when, immediately after their application, there is a cloudburst because, then, large amounts of the solid phase of the soil may be washed away with freshly applied soluble phosphates contained within it [
46]. Moreover, in soils with a content of more than 200 mg P·kg
−1, increases in yields of crops under the influence of phosphorus fertilization are rarely observed, and, therefore, this content was considered a good indicator for the preliminary assessment of the risk associated with excess phosphorus in the soil [
42].
3.5. Content of Available Microelements in Soil (Fe, Mn, Zn, Cu, Ni, Cr)
The highest content of available Fe was recorded in the control (
Table 7). The use of the prepared formulations resulted in a reduction in the content of this microelement compared to the control. The content of available Mn in the soil of the control plot and after the use of carbonate-clay flour was at a similar level, and the greatest amount of this microelement was found in the soil receiving combinations with the addition of 0.4% sulfate sulfur (
Table 7). As in the case of Fe, the combined application of carbonate-clay flour with sewage sludge and sulfate sulfur reduced the Mn content compared to the control.
The largest quantities of available Zn, Cu, Ni and Cr were observed in the soil to which municipal sewage sludge had been added, and the addition of sulfate sulfur to the soil decreased the content of these micronutrients compared to the control (
Table 8 and
Table 9). The carbonate-clay flour, used alone and together with other additives, reduced the content of available Zn, Cu and Ni in the soil. The reduction in the content of these microelements resulted primarily from their possible precipitation into carbonate forms, which are insoluble and therefore inaccessible to plants [
45].
Table 7.
Content of available Fe and Mn in soil before and after incubation.
Table 7.
Content of available Fe and Mn in soil before and after incubation.
| No. | Combination * | Fe (mg∙kg−1) | Mn (mg∙kg−1) |
|---|
| | | BI ** | AI | Mean | BI | AI | Mean |
|---|
| 1 | C | 1036.3 | 664.4 | 850.3 | 231.9 | 140.0 | 186.0 |
| 2 | M | 864.8 | 452.9 | 658.9 | 224.8 | 115.0 | 169.9 |
| 3 | 5%MSS | 812.7 | 427.0 | 619.9 | 207.9 | 125.2 | 166.6 |
| 4 | 10%MSS | 712.5 | 360.3 | 536.4 | 223.6 | 137.4 | 180.5 |
| 5 | 0.2%S | 855.1 | 573.6 | 714.4 | 235.3 | 132.6 | 183.9 |
| 6 | 0.4%S | 752.4 | 482.3 | 617.3 | 238.8 | 172.3 | 205.5 |
| 7 | M5%MSS | 652.8 | 462.9 | 557.9 | 168.7 | 148.8 | 158.8 |
| 8 | M10%MSS | 665.8 | 495.6 | 580.7 | 182.9 | 168.6 | 175.8 |
| 9 | M0.2%S | 613.9 | 575.7 | 594.8 | 203.8 | 133.5 | 168.7 |
| 10 | M0.4%S | 574.9 | 545.4 | 560.1 | 218.2 | 196.2 | 207.2 |
| 11 | M5MSS0.2%S | 543.8 | 427.6 | 485.7 | 129.1 | 110.1 | 119.6 |
| 12 | M5MSS0.4%S | 480.1 | 393.8 | 436.9 | 141.8 | 123.3 | 132.5 |
| 13 | M10MSS0.2%S | 412.0 | 327.1 | 369.5 | 164.5 | 159.4 | 162.0 |
| 14 | M10MSS0.4%S | 386.3 | 311.6 | 348.9 | 204.2 | 188.6 | 196.4 |
| | Mean for date | 668.8 | 464.3 | 566.6 | 198.3 | 146.5 | 172.4 |
| NIRα≤0.01 for date | 3.5 | 4.7 |
| NIRα≤0.01 for combination | 9.3 | 12.5 |
| NIRα≤0.01 for interaction | 13.1 | 17.7 |
Table 8.
Content of available Zn and Cu in soil before and after incubation.
Table 8.
Content of available Zn and Cu in soil before and after incubation.
| No. | Combination * | Zn (mg∙kg−1) | Cu (mg∙kg−1) |
|---|
| | | BI ** | AI | Mean | BI | AI | Mean |
|---|
| 1 | C | 36.3 | 32.5 | 34.4 | 8.2 | 5.5 | 6.9 |
| 2 | M | 33.0 | 17.9 | 25.4 | 7.3 | 6.3 | 6.8 |
| 3 | 5%MSS | 48.3 | 33.4 | 40.8 | 11.5 | 7.7 | 9.6 |
| 4 | 10%MSS | 55.2 | 48.7 | 51.9 | 13.7 | 9.7 | 11.7 |
| 5 | 0.2%S | 33.3 | 21.0 | 27.2 | 7.3 | 7.8 | 7.6 |
| 6 | 0.4%S | 28.8 | 19.7 | 24.3 | 6.2 | 7.2 | 6.7 |
| 7 | M5%MSS | 37.3 | 41.5 | 39.4 | 7.7 | 10.3 | 9.0 |
| 8 | M10%MSS | 44.0 | 55.4 | 49.7 | 8.3 | 11.5 | 9.9 |
| 9 | M0.2%S | 26.5 | 19.2 | 22.9 | 5.7 | 8.0 | 6.8 |
| 10 | M0.4%S | 23.2 | 21.3 | 22.2 | 5.2 | 7.5 | 6.3 |
| 11 | M5MSS0.2%S | 25.3 | 42.5 | 33.9 | 5.3 | 10.4 | 7.8 |
| 12 | M5MSS0.4%S | 20.3 | 37.4 | 28.8 | 4.3 | 9.3 | 6.8 |
| 13 | M10MSS0.2%S | 36.5 | 55.3 | 45.9 | 7.6 | 11.2 | 9.4 |
| 14 | M10MSS0.4%S | 31.7 | 36.5 | 34.1 | 5.8 | 10.1 | 7.9 |
| | Mean for date | 34.3 | 34.4 | 34.4 | 7.4 | 8.7 | 8.1 |
| NIRα≤0.01 for date | 3.5 | 1.2 |
| NIRα≤0.01 for combination | 9.3 | 3.0 |
| NIRα≤0.01 for interaction | 13.1 | 4.3 |
Table 9.
Content of available Ni and Cr in soil before and after incubation.
Table 9.
Content of available Ni and Cr in soil before and after incubation.
| No. | Combination * | Ni (mg∙kg−1) | Cr (mg∙kg−1) |
|---|
| | | BI ** | AI | Mean | BI | AI | Mean |
|---|
| 1 | C | 3.1 | 1.8 | 2.5 | 1.5 | 0.5 | 1.0 |
| 2 | M | 2.3 | 1.1 | 1.7 | 1.0 | 0.7 | 0.8 |
| 3 | 5%MSS | 3.2 | 2.2 | 2.7 | 1.8 | 1.5 | 1.6 |
| 4 | 10%MSS | 3.4 | 2.4 | 2.9 | 2.2 | 1.8 | 2.0 |
| 5 | 0.2%S | 1.8 | 1.2 | 1.5 | 1.6 | 1.5 | 1.5 |
| 6 | 0.4%S | 1.5 | 1.1 | 1.3 | 1.3 | 1.0 | 1.2 |
| 7 | M5%MSS | 1.6 | 1.4 | 1.5 | 1.3 | 1.2 | 1.3 |
| 8 | M10%MSS | 1.8 | 1.6 | 1.7 | 1.5 | 1.4 | 1.4 |
| 9 | M0.2%S | 1.7 | 1.5 | 1.6 | 0.9 | 0.9 | 0.9 |
| 10 | M0.4%S | 1.4 | 1.3 | 1.4 | 0.9 | 0.7 | 0.8 |
| 11 | M5MSS0.2%S | 1.9 | 1.1 | 1.5 | 1.6 | 1.2 | 1.4 |
| 12 | M5MSS0.4%S | 1.7 | 1.0 | 1.3 | 1.5 | 1.1 | 1.3 |
| 13 | M10MSS0.2%S | 2.3 | 1.7 | 2.0 | 2.2 | 1.4 | 1.8 |
| 14 | M10MSS0.4%S | 2.1 | 1.3 | 1.7 | 2.1 | 1.2 | 1.6 |
| | Mean for date | 2.1 | 1.5 | 1.8 | 1.5 | 1.1 | 1.3 |
| NIRα≤0.01 for date | 3.5 | 0.04 |
| NIRα≤0.01 for combination | 9.3 | 0.11 |
| NIRα≤0.01 for interaction | 13.1 | 0.16 |
After 3 months of incubation, there was a decrease in the content of Fe, Mn, Ni and Cr in the soil compared to the content before incubation. In the case of Zn and Cu, the incubation period in treatments where municipal sewage sludge was used along with flour, or a combination of flour and sulfur, increased the content of the bioavailable forms of Zn and Cu in the soil.
The assessment of microelement content (Fe, Mn, Zn and Cu) according to the limit values for the Mehlich 3 method indicated that their content in the soil, before and after incubation, was well above the values considered low for all crops [
42]. From the point of view of plant nutrition, the addition of these deacidifying materials to light, acidic soil increased the content of available microelements, which confirms the need for their use as alternative fertilizing agents [
34,
45]. Unpolluted soil contains Zn, Cu, Ni and Cr at levels of no more than 70, 20, 25 and 30 mg∙kg
−1 d.m. of soil, respectively [
47]. This study shows that the materials used did not contaminate the soil with heavy metals and that their levels were acceptable for growing all crops.
3.6. Trace Elements in Soil (Pb, Cd)
The content of available forms of Pb and Cd in the control soil was low, and an even lower content of these elements was recorded in the soil with the addition of carbonate-clay flour (
Table 10). The addition of sewage sludge or sulfate sulfur increased the content of these elements in the soil. The combined use of carbonate-clay flour with sewage sludge and sulfate sulfur resulted in a reduction in Pb and Cd content, compared to the soils receiving sludge and sulfur separately. Studies clearly indicate that the addition of sewage sludge, sulfate sulfur and carbonate-clay flour reduces the content of bioavailable forms of Pb and Cd, which limits the possibility of these potentially toxic elements being taken up by plants [
48]. The addition of alkaline waste immobilizes heavy metals, leading to their precipitation into insoluble carbonate forms that are inaccessible to plants [
33]. Reducing the amount of bioavailable heavy metals in soil decreases the likelihood of ecological and health risks [
7].
Table 10.
Content of available Pb and Cd in soil before and after incubation.
Table 10.
Content of available Pb and Cd in soil before and after incubation.
| No. | Combination * | Pb (mg∙kg−1) | Cd (mg∙kg−1) |
|---|
| | | BI ** | AI | Mean | BI | AI | Mean |
|---|
| 1 | C | 8.0 | 7.0 | 7.5 | 0.37 | 0.32 | 0.35 |
| 2 | M | 1.6 | 1.2 | 1.4 | 0.27 | 0.23 | 0.25 |
| 3 | 5%MSS | 7.8 | 6.5 | 7.1 | 0.85 | 0.78 | 0.82 |
| 4 | 10%MSS | 8.3 | 7.3 | 7.8 | 0.95 | 0.80 | 0.88 |
| 5 | 0.2%S | 8.3 | 7.5 | 7.9 | 0.97 | 0.93 | 0.95 |
| 6 | 0.4%S | 8.7 | 8.0 | 8.3 | 1.10 | 1.06 | 1.08 |
| 7 | M5%MSS | 2.4 | 2.1 | 2.3 | 0.87 | 0.83 | 0.85 |
| 8 | M10%MSS | 3.0 | 2.4 | 2.7 | 0.95 | 0.91 | 0.93 |
| 9 | M0.2%S | 1.9 | 1.7 | 1.8 | 0.75 | 0.70 | 0.73 |
| 10 | M0.4%S | 2.1 | 1.9 | 2.0 | 0.85 | 0.81 | 0.83 |
| 11 | M5MSS0.2%S | 2.6 | 2.5 | 2.5 | 0.59 | 0.52 | 0.55 |
| 12 | M5MSS0.4%S | 2.8 | 2.8 | 2.8 | 0.63 | 0.59 | 0.61 |
| 13 | M10MSS0.2%S | 2.9 | 2.9 | 2.9 | 0.69 | 0.64 | 0.67 |
| 14 | M10MSS0.4%S | 3.0 | 2.9 | 3.0 | 0.91 | 0.89 | 0.90 |
| | Mean for date | 4.5 | 4.0 | 4.3 | 0.77 | 0.72 | 0.74 |
| NIRα≤0.01 for date | 3.5 | 0.1 |
| NIRα≤0.01 for combination | 9.3 | 0.3 |
| NIRα≤0.01 for interaction | 13.1 | 0.4 |
The content of Pb and Cd in the used materials after incubation was slightly lower compared to the content in the starting materials, which could have been due to the low amount of bioavailable forms in the soil solution [
48]. Previous studies have confirmed that carbonate-clay flour is characterized by a low content of metal (loid)s and does not exceed the permissible content for agricultural limestone and other mineral fertilizers and plant growth enhancers of mineral origin [
49]. A low content of potentially toxic elements will not exclude the use of these materials for enriching soil with other elements necessary for plants [
50,
51].
The repeated application of the materials tested would lead to increased soil salinity and heavy metal content. Excessive heavy metal content would prevent plants from being consumed, and high salinity would hinder their growth and development [
35]. Therefore, if the materials are to be applied repeatedly, the chemical composition of the substrate and the plants grown should be monitored [
39].
Based on the results of the incubation experiment, it can tentatively be concluded that carbonate-stabilized flour containing a single dose of sewage sludge and sulfate sulfur can be introduced on a larger scale for agricultural and reclamation management purposes.
3.7. Statistical Analysis
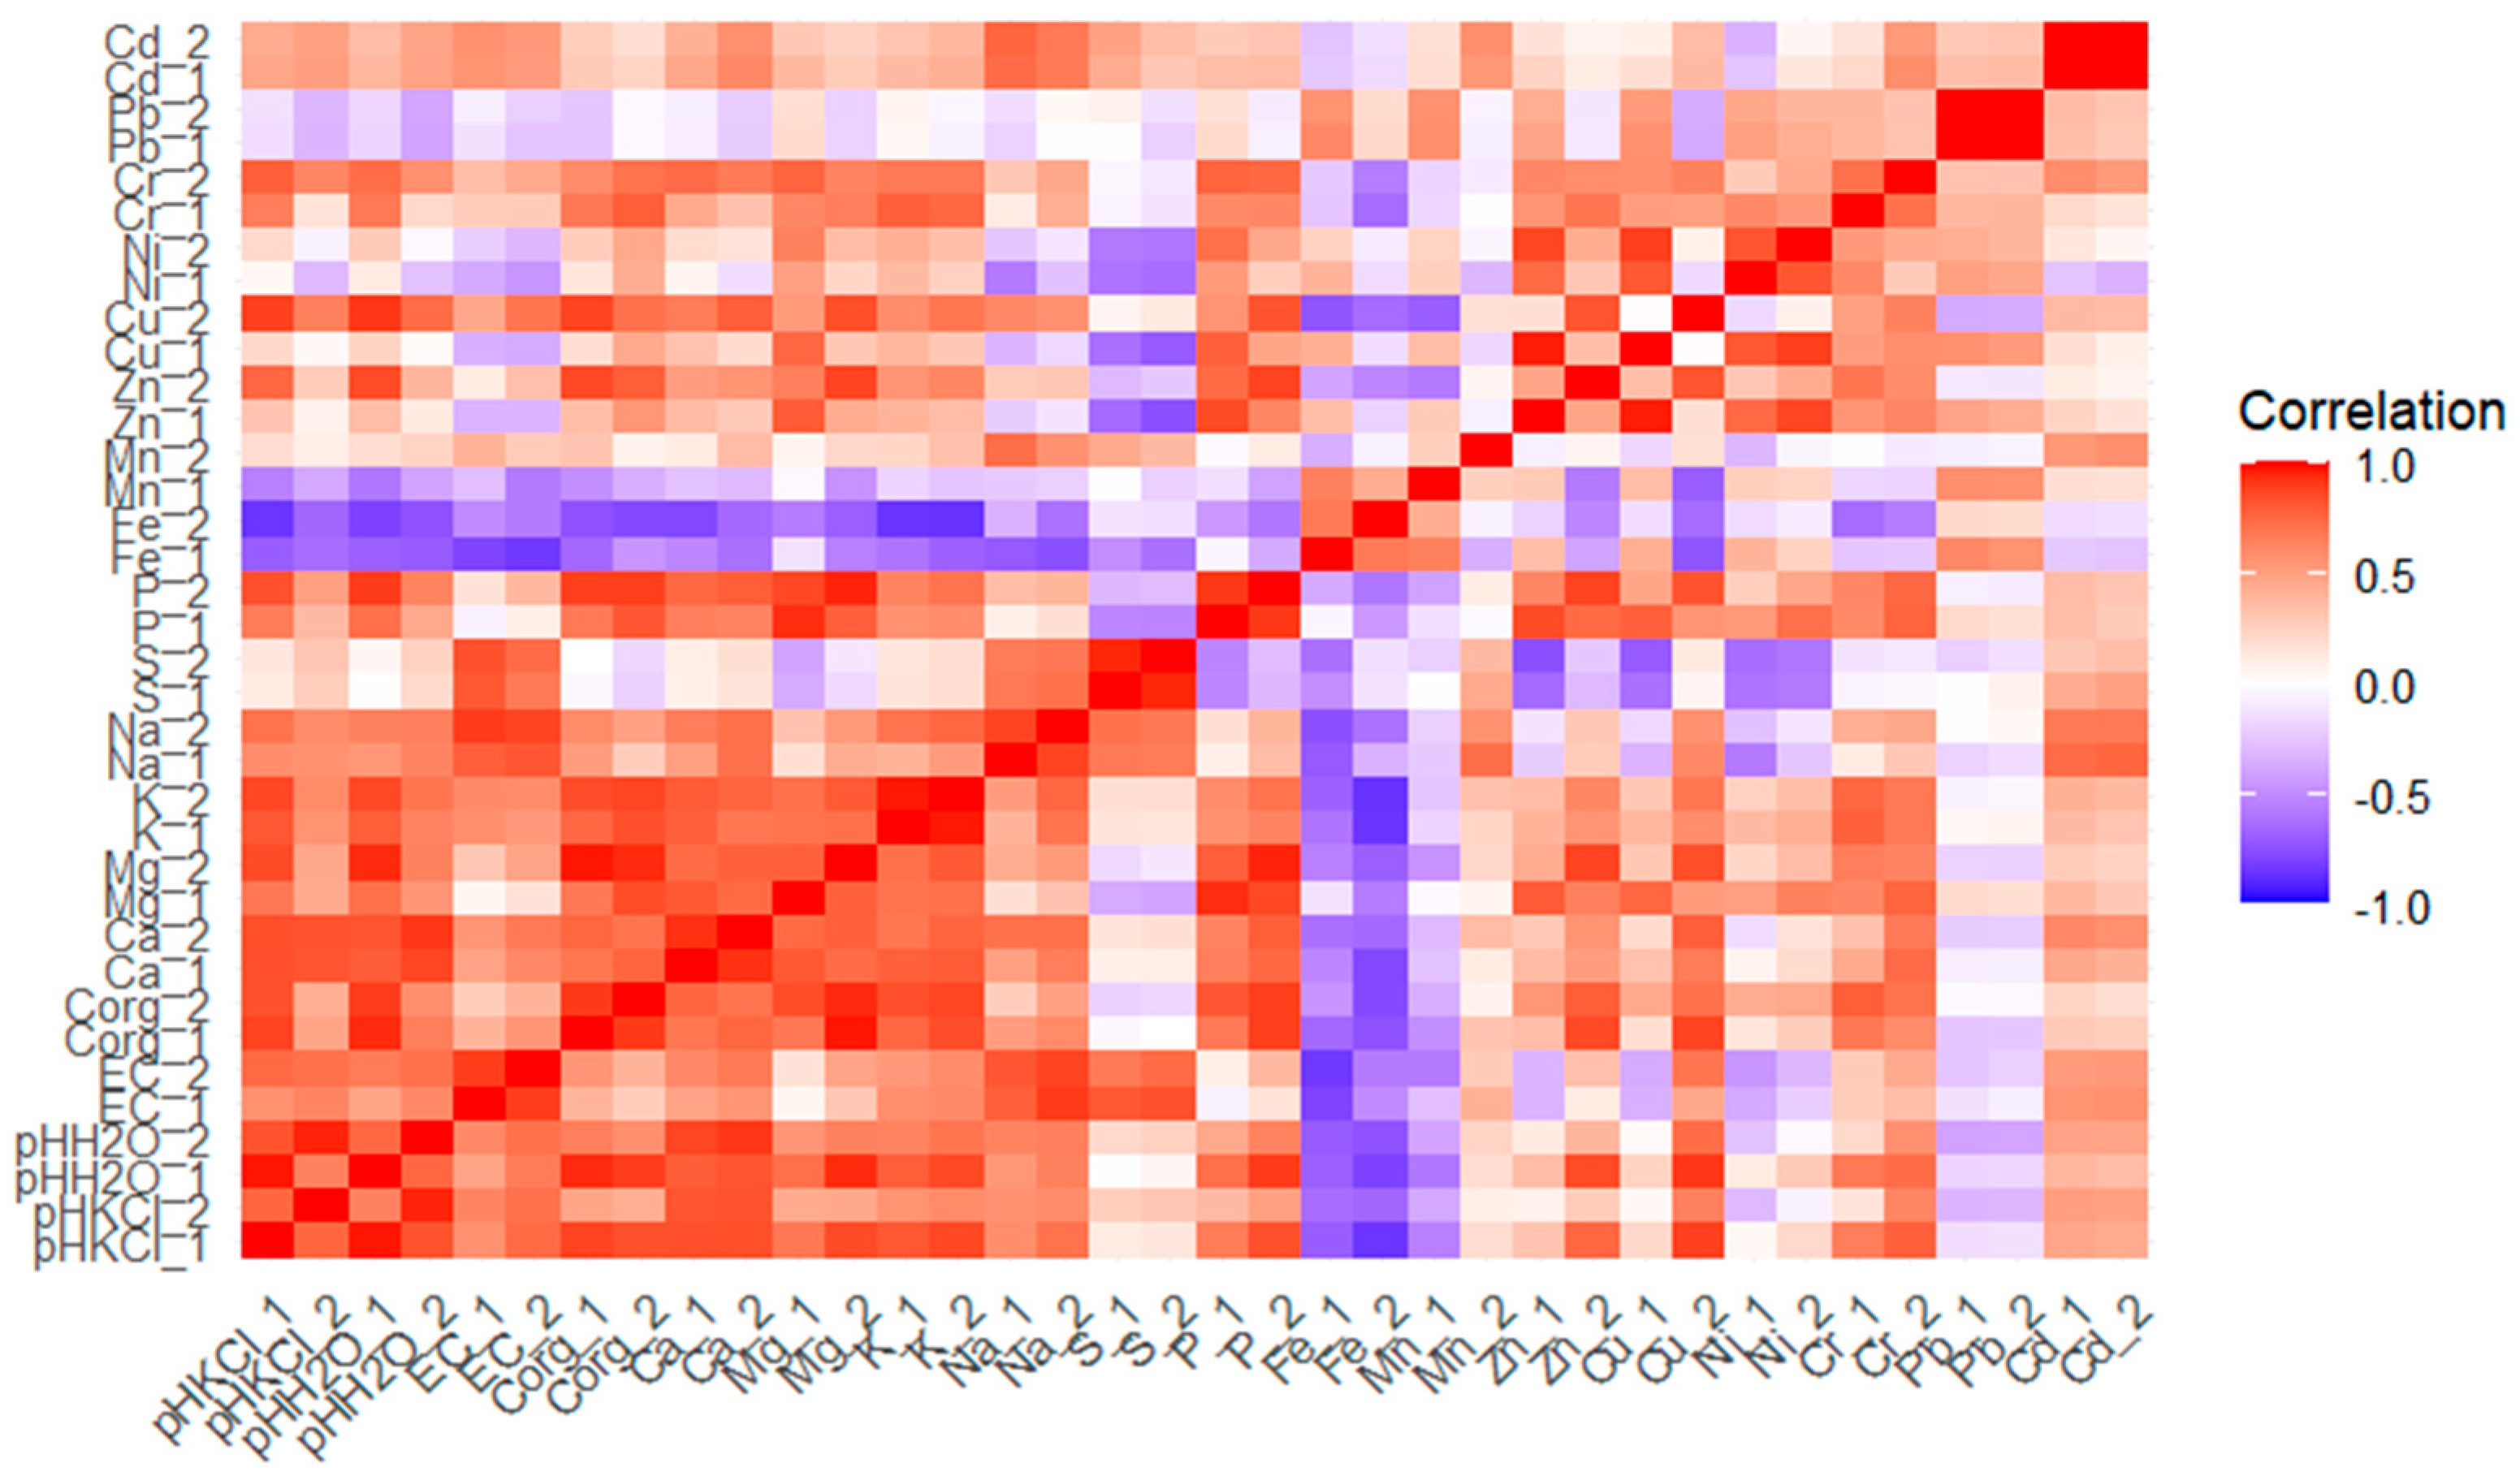
Pearson’s linear correlation analysis, using the Statistica package, allowed us to demonstrate the relationship between selected parameters of soil physicochemical properties and selected waste materials before and after incubation. This analysis shows that the carbonate-clay flour, sewage sludge and calcium sulfate introduced to the soil significantly influenced the change in physicochemical properties of the soil. A significant decrease in soil pH after incubation favored the dissolution of oxides and carbonates from the carbonate-clay flour, which led to the desorption of elements (Ca, Mg, K, Na, Fe, Mn, Ni and Cr) from the soil sorption complex. The higher salinity value in the soils receiving fertilizer formulations also promoted a greater release of macronutrients from the soil sorption complex.
The soil pH value was strictly correlated with salinity, organic carbon content and the available forms of Ca, Mg, K, Na and P in the soil (
Figure 1), indicating a strong influence of this parameter on the availability and bioavailability of soil components. A negative correlation was found between the soil pH value and the available forms of Fe and Mn, which indicates the possible precipitation of micronutrients under the influence of the tested waste materials of an alkaline nature. On the other hand, the positive correlation between soil pH and the content of Zn, Cu, Cr and Cd (0.435 < r <0.898) confirms the significant impact of this parameter on increasing the amount of their bioavailable forms. The above correlations point to a significant impact of the materials used on the physicochemical properties of soil, assessed in terms of the possibility of their improvement and the environmental management of nutrients.
Hierarchical cluster analysis allowed us to recognize patterns among the 28 experimental waste combinations (14 before incubation and 14 after incubation). The plots studied were always grouped by incubation date and mostly by combinations. Four clusters were identified (
Figure 2). The first one consisted of the pre-incubation combinations in which sewage sludge was applied. These combinations were further grouped with respect to the combination of waste used. The second cluster included controls and combinations after the introduction of carbonate-clay flour, with the same incubation dates that were the basis for forming the groups. The use of sulfate sulfur in both doses alone and in the mixtures with flour resulted in the grouping in the third cluster. It was further divided into groups based on similarities due to the same incubation date and type of components. The fourth cluster comprised the combinations after incubation, following sewage sludge application. The same doses of sewage sludge in flour–sludge–sulfur combinations, and sludge applied alone and in a mixture with flour, showed greater similarity to each other.


