
Investigating Attributes of Oil Source Rocks by Combining Geochemical Approaches and Basin Modelling (Central Gulf of Suez, Egypt)

 ,
,  ,
,  and
and 
Abstract
1. Introduction
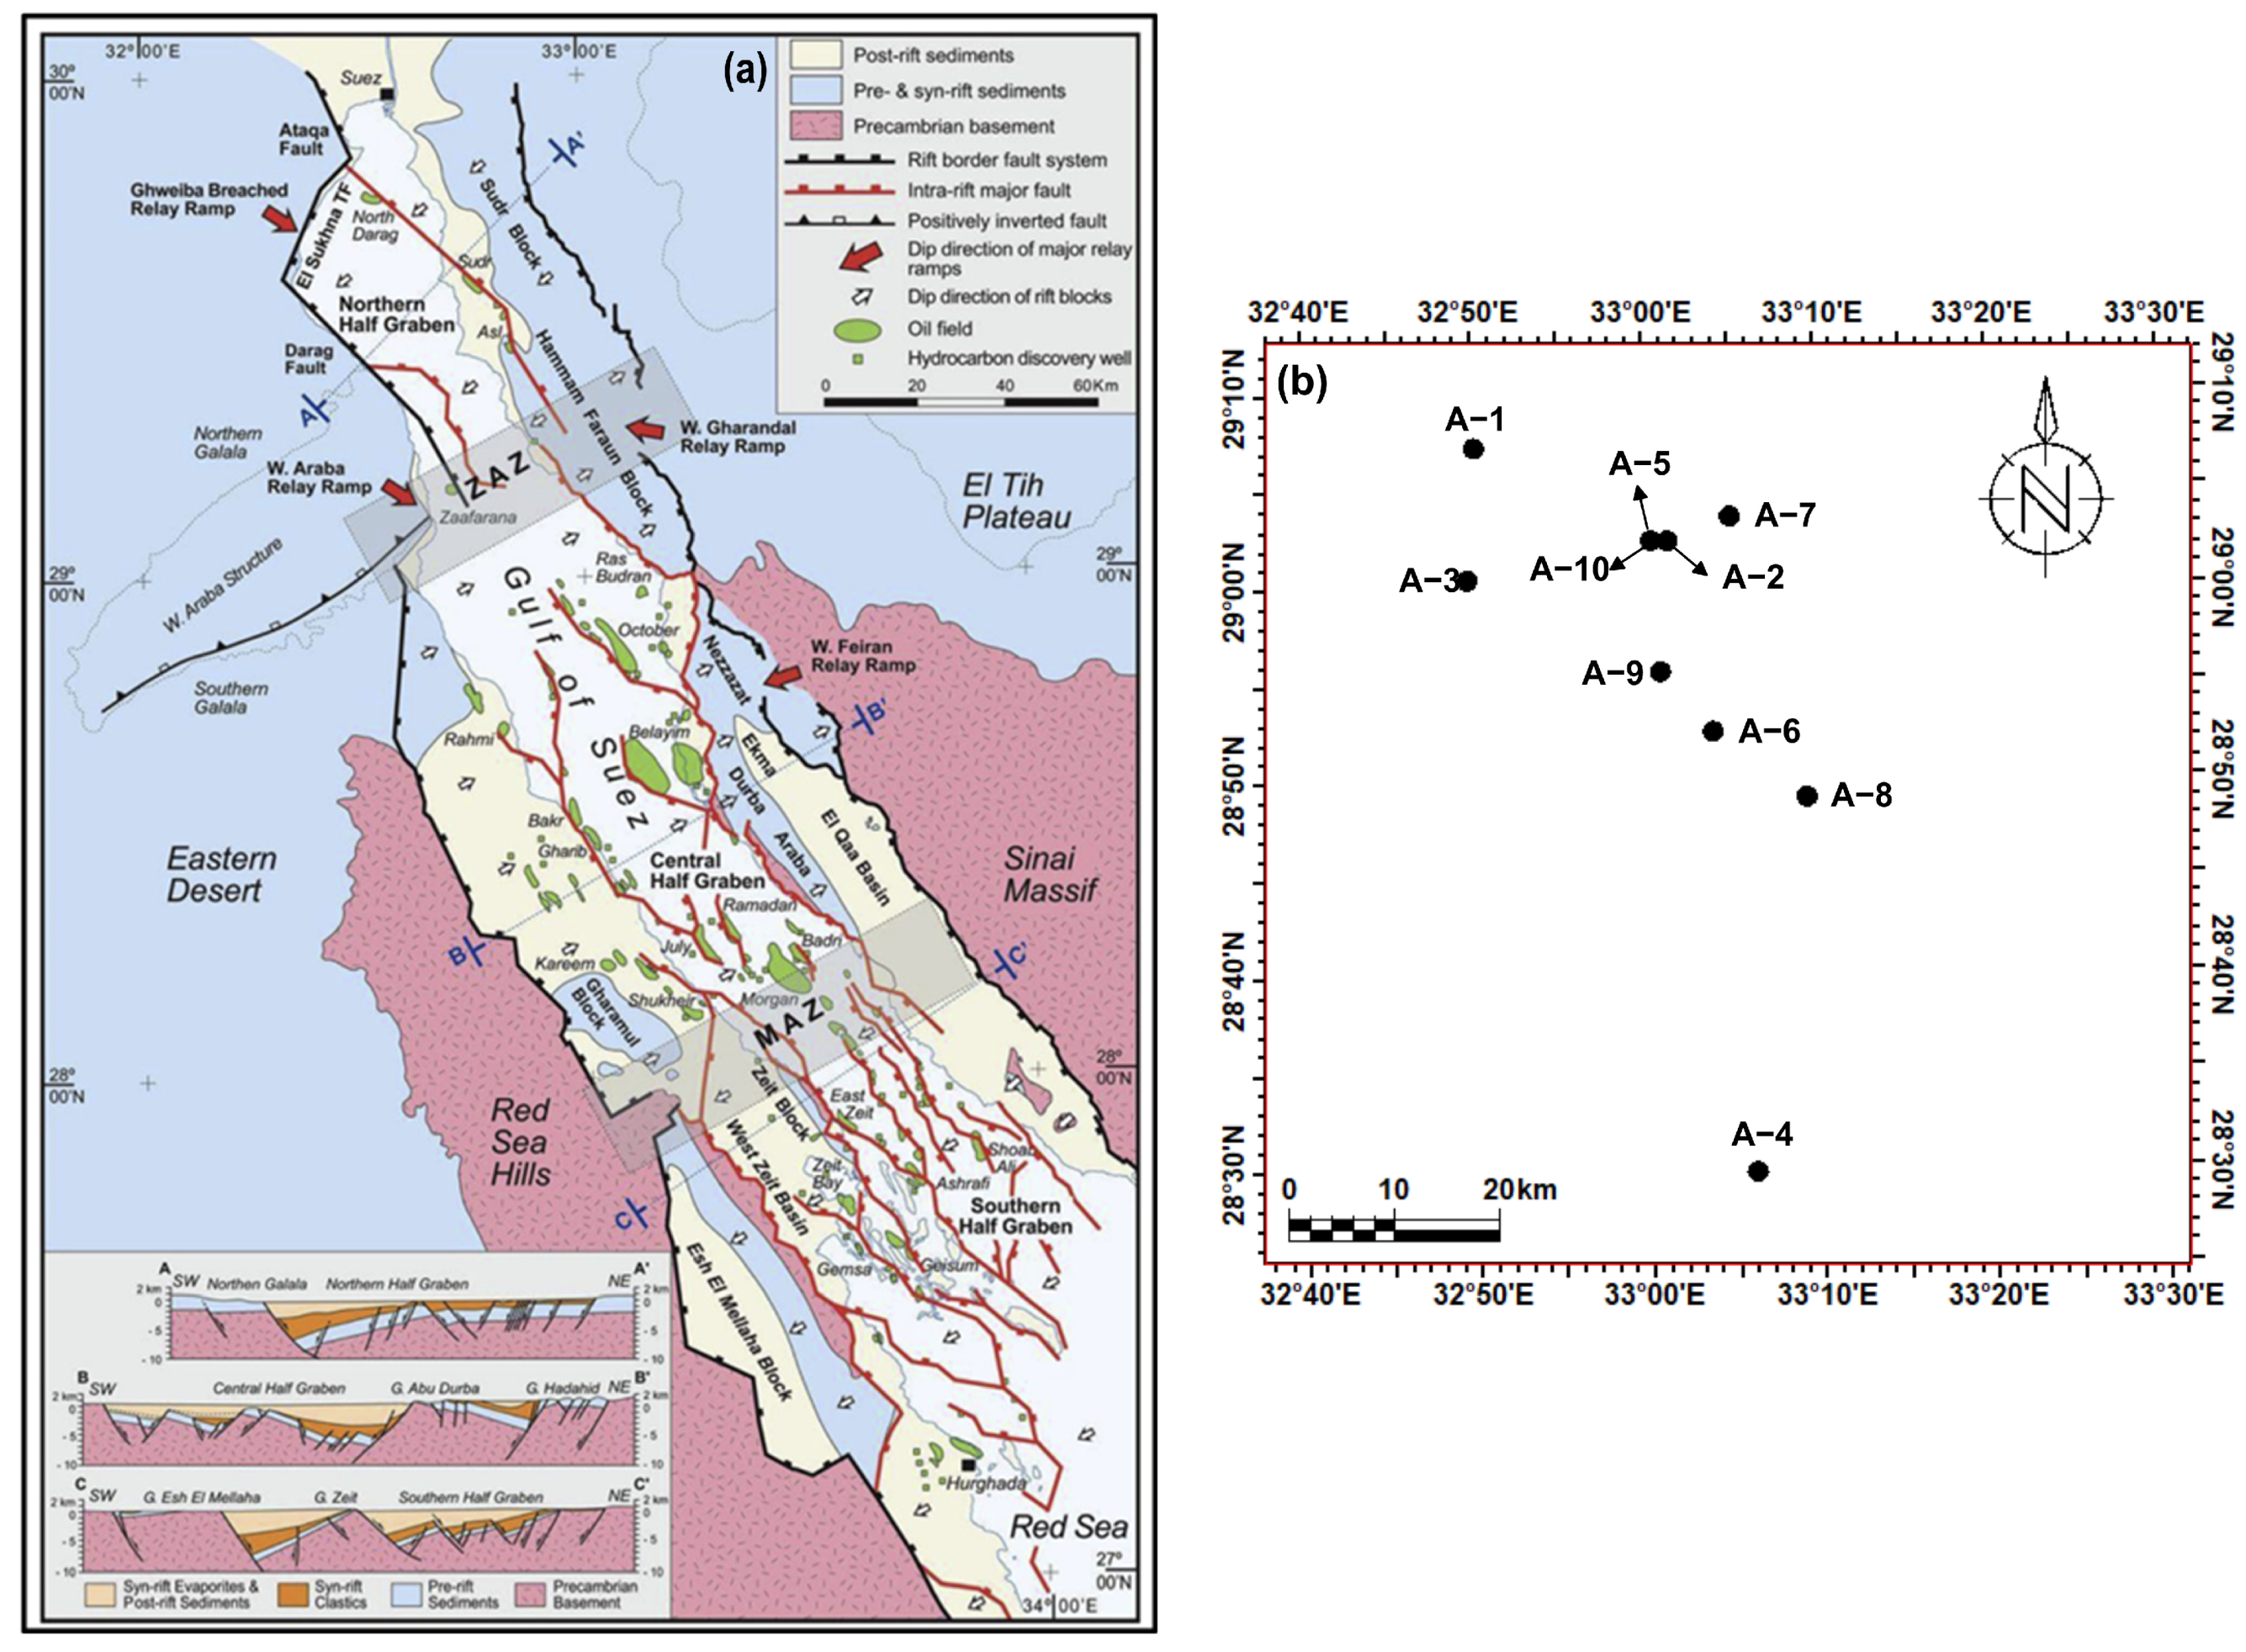
2. General Geology
2.1. Structure
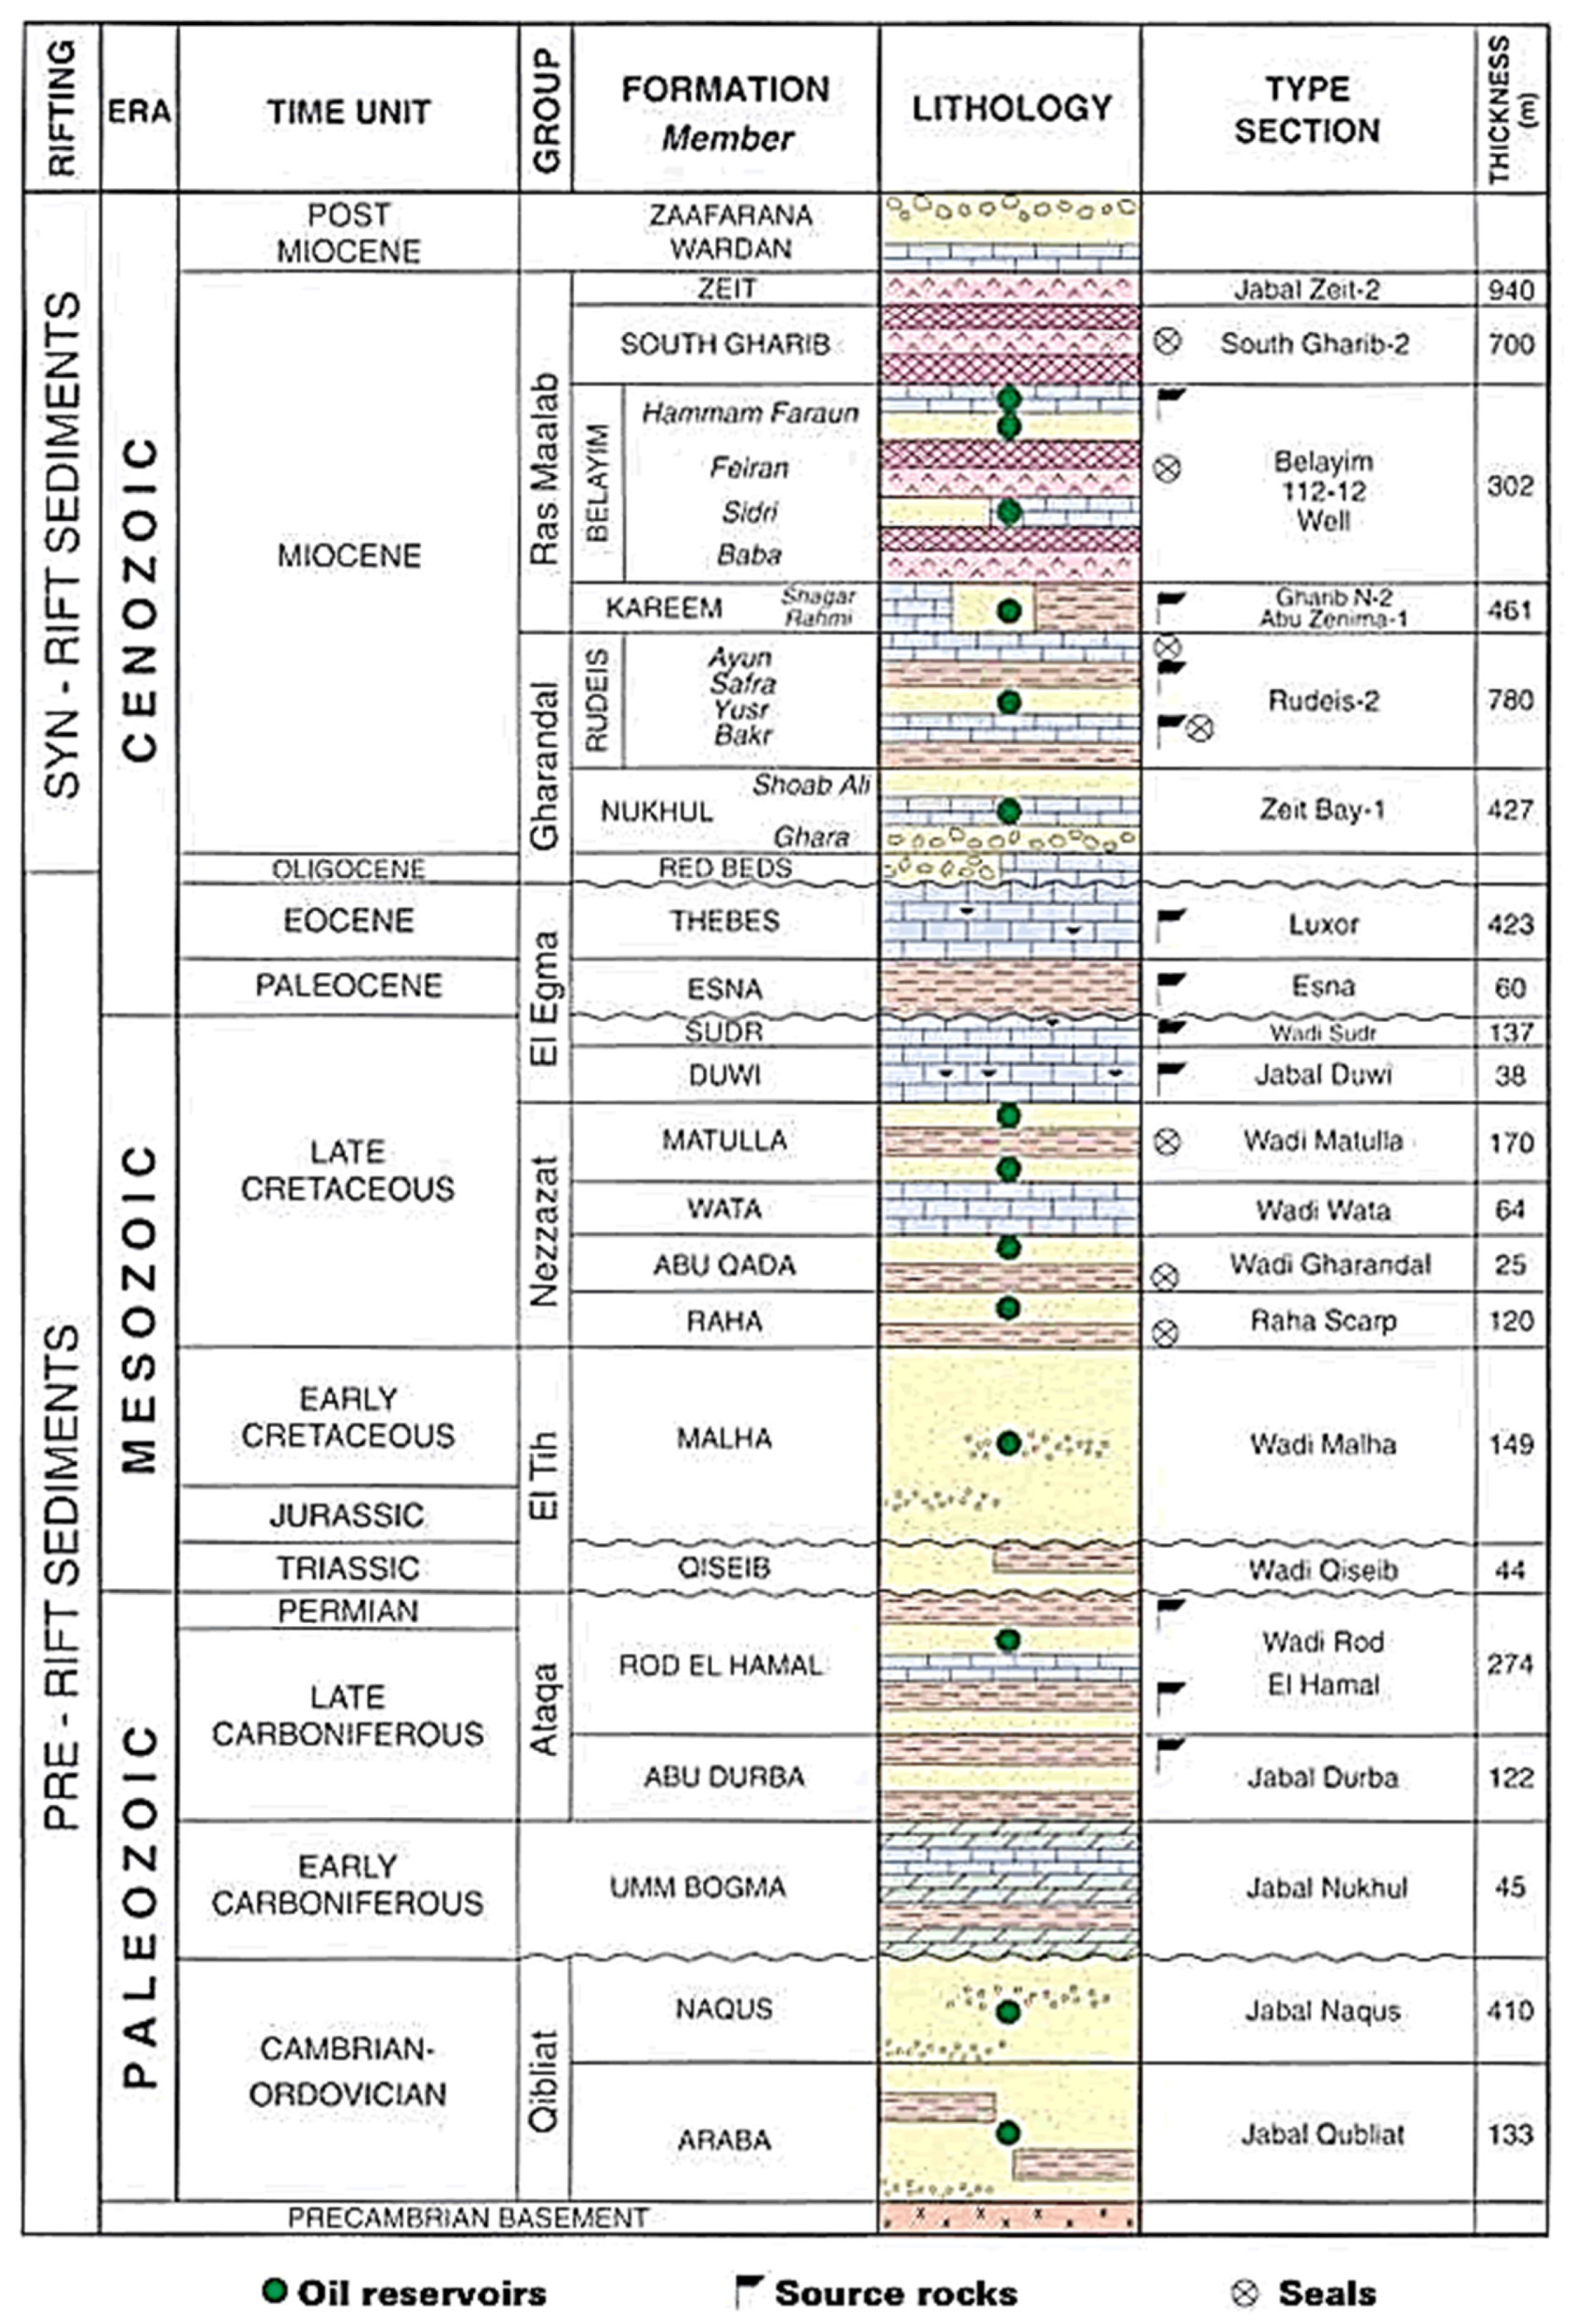
2.2. Stratigraphy
3. Materials and Methods
3.1. TOC and Rock-Eval Pyrolysis
3.2. Calibration Data
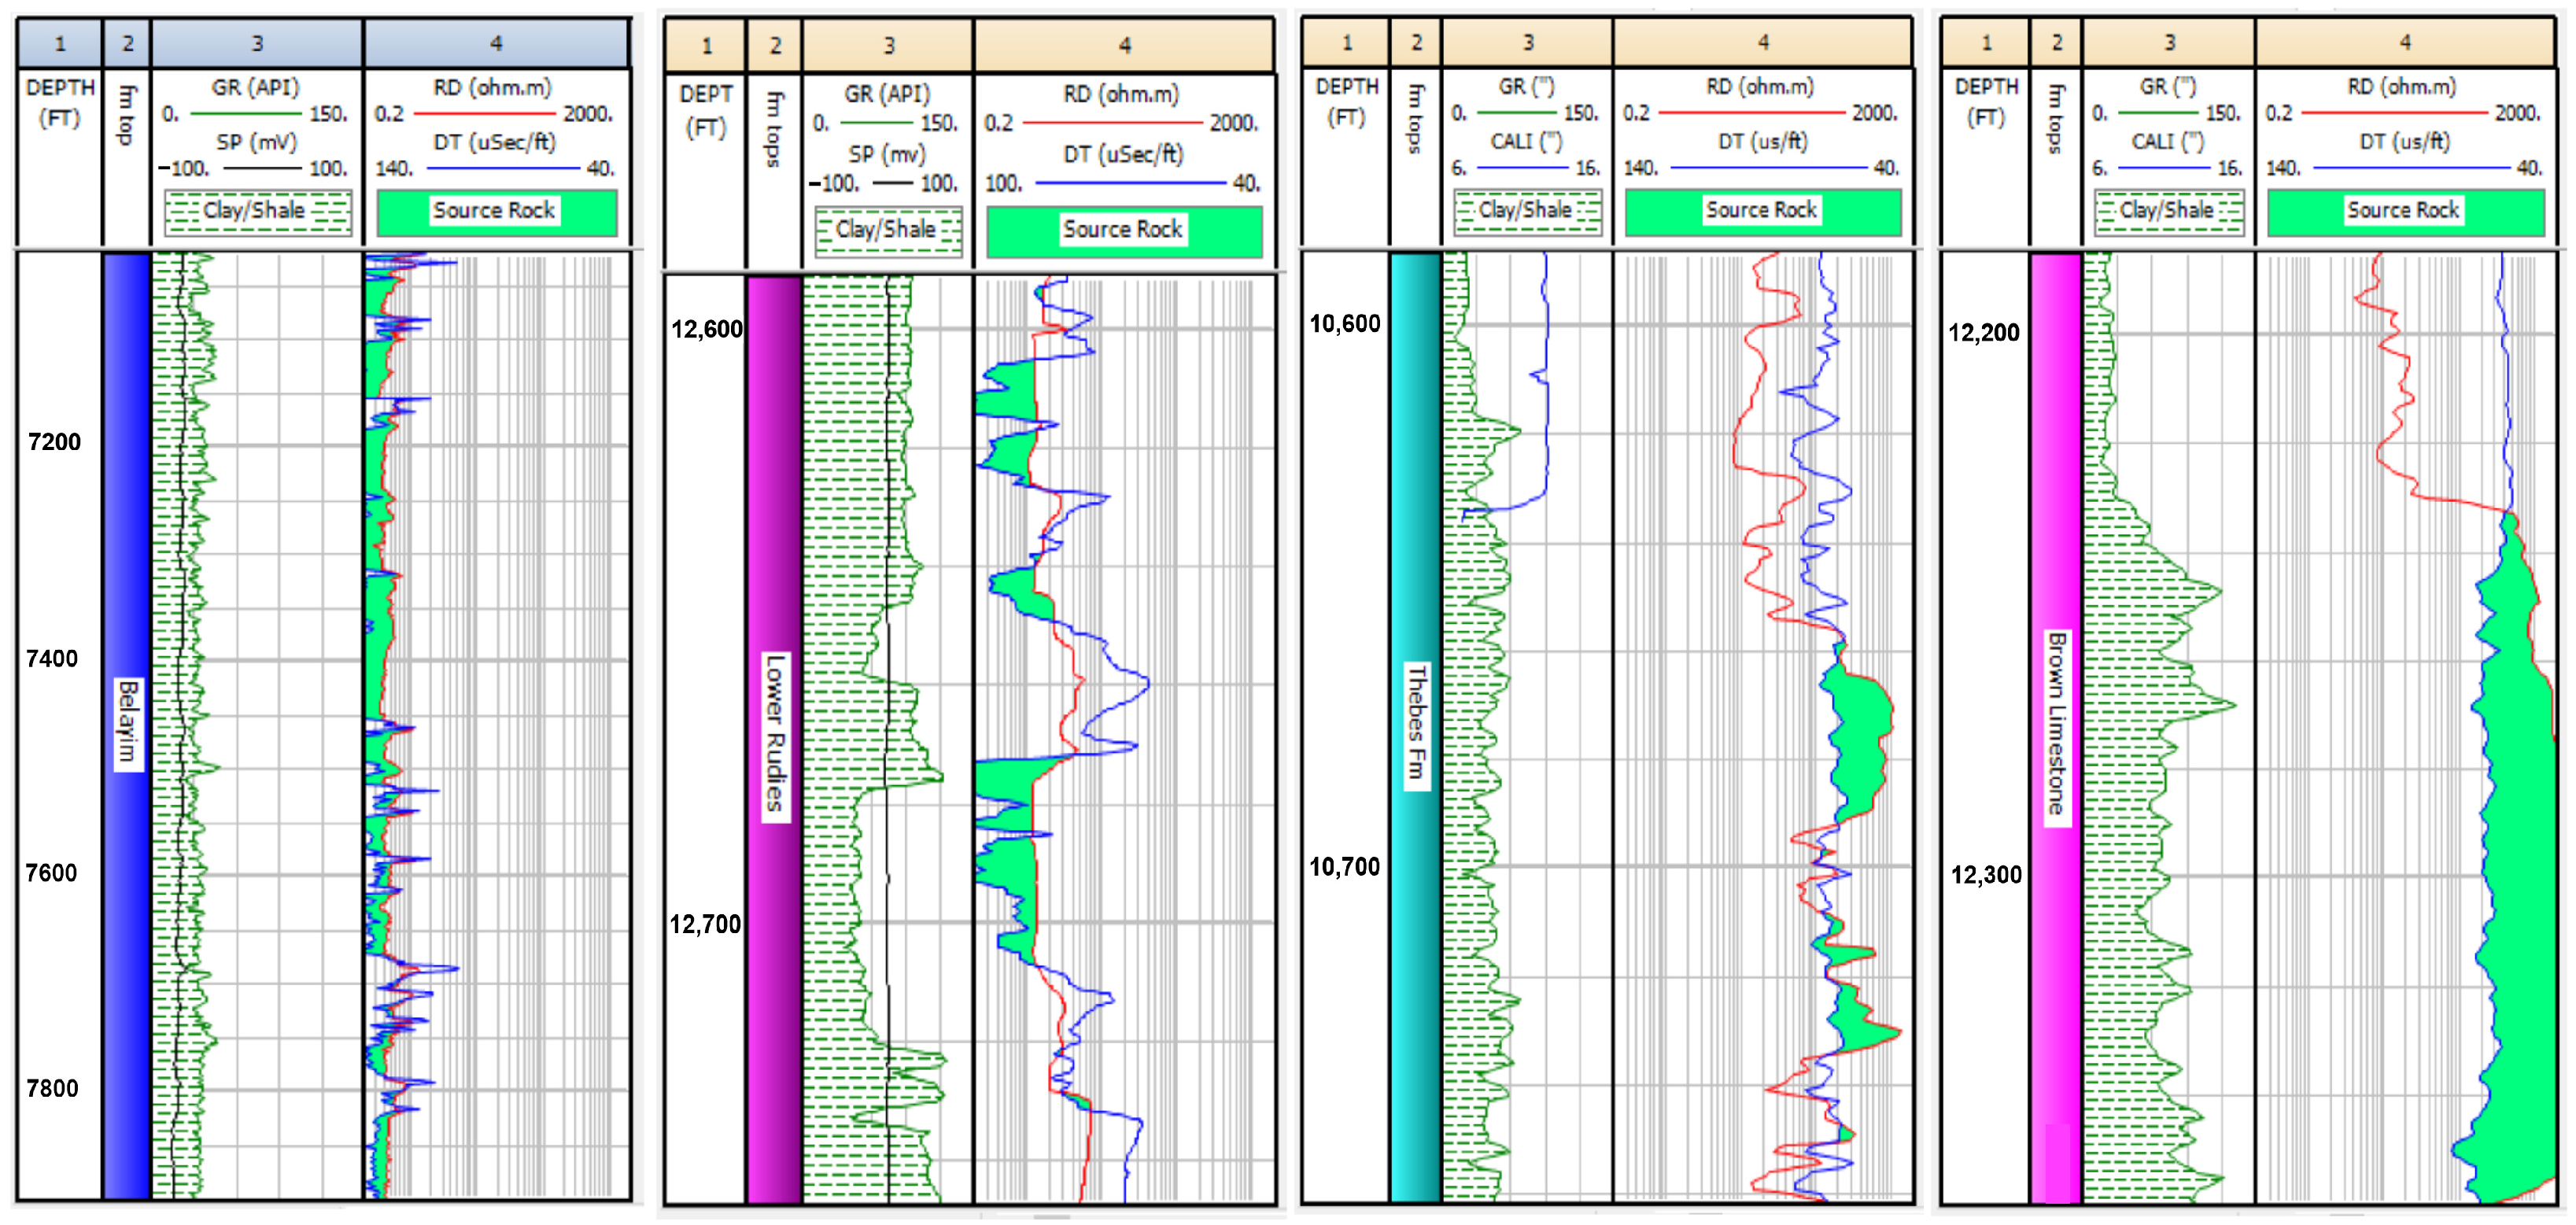
3.3. Well Log Response
3.4. Basin Modeling–Approach and Data
4. Results
4.1. Well Log Responses
4.2. Basin Modeling
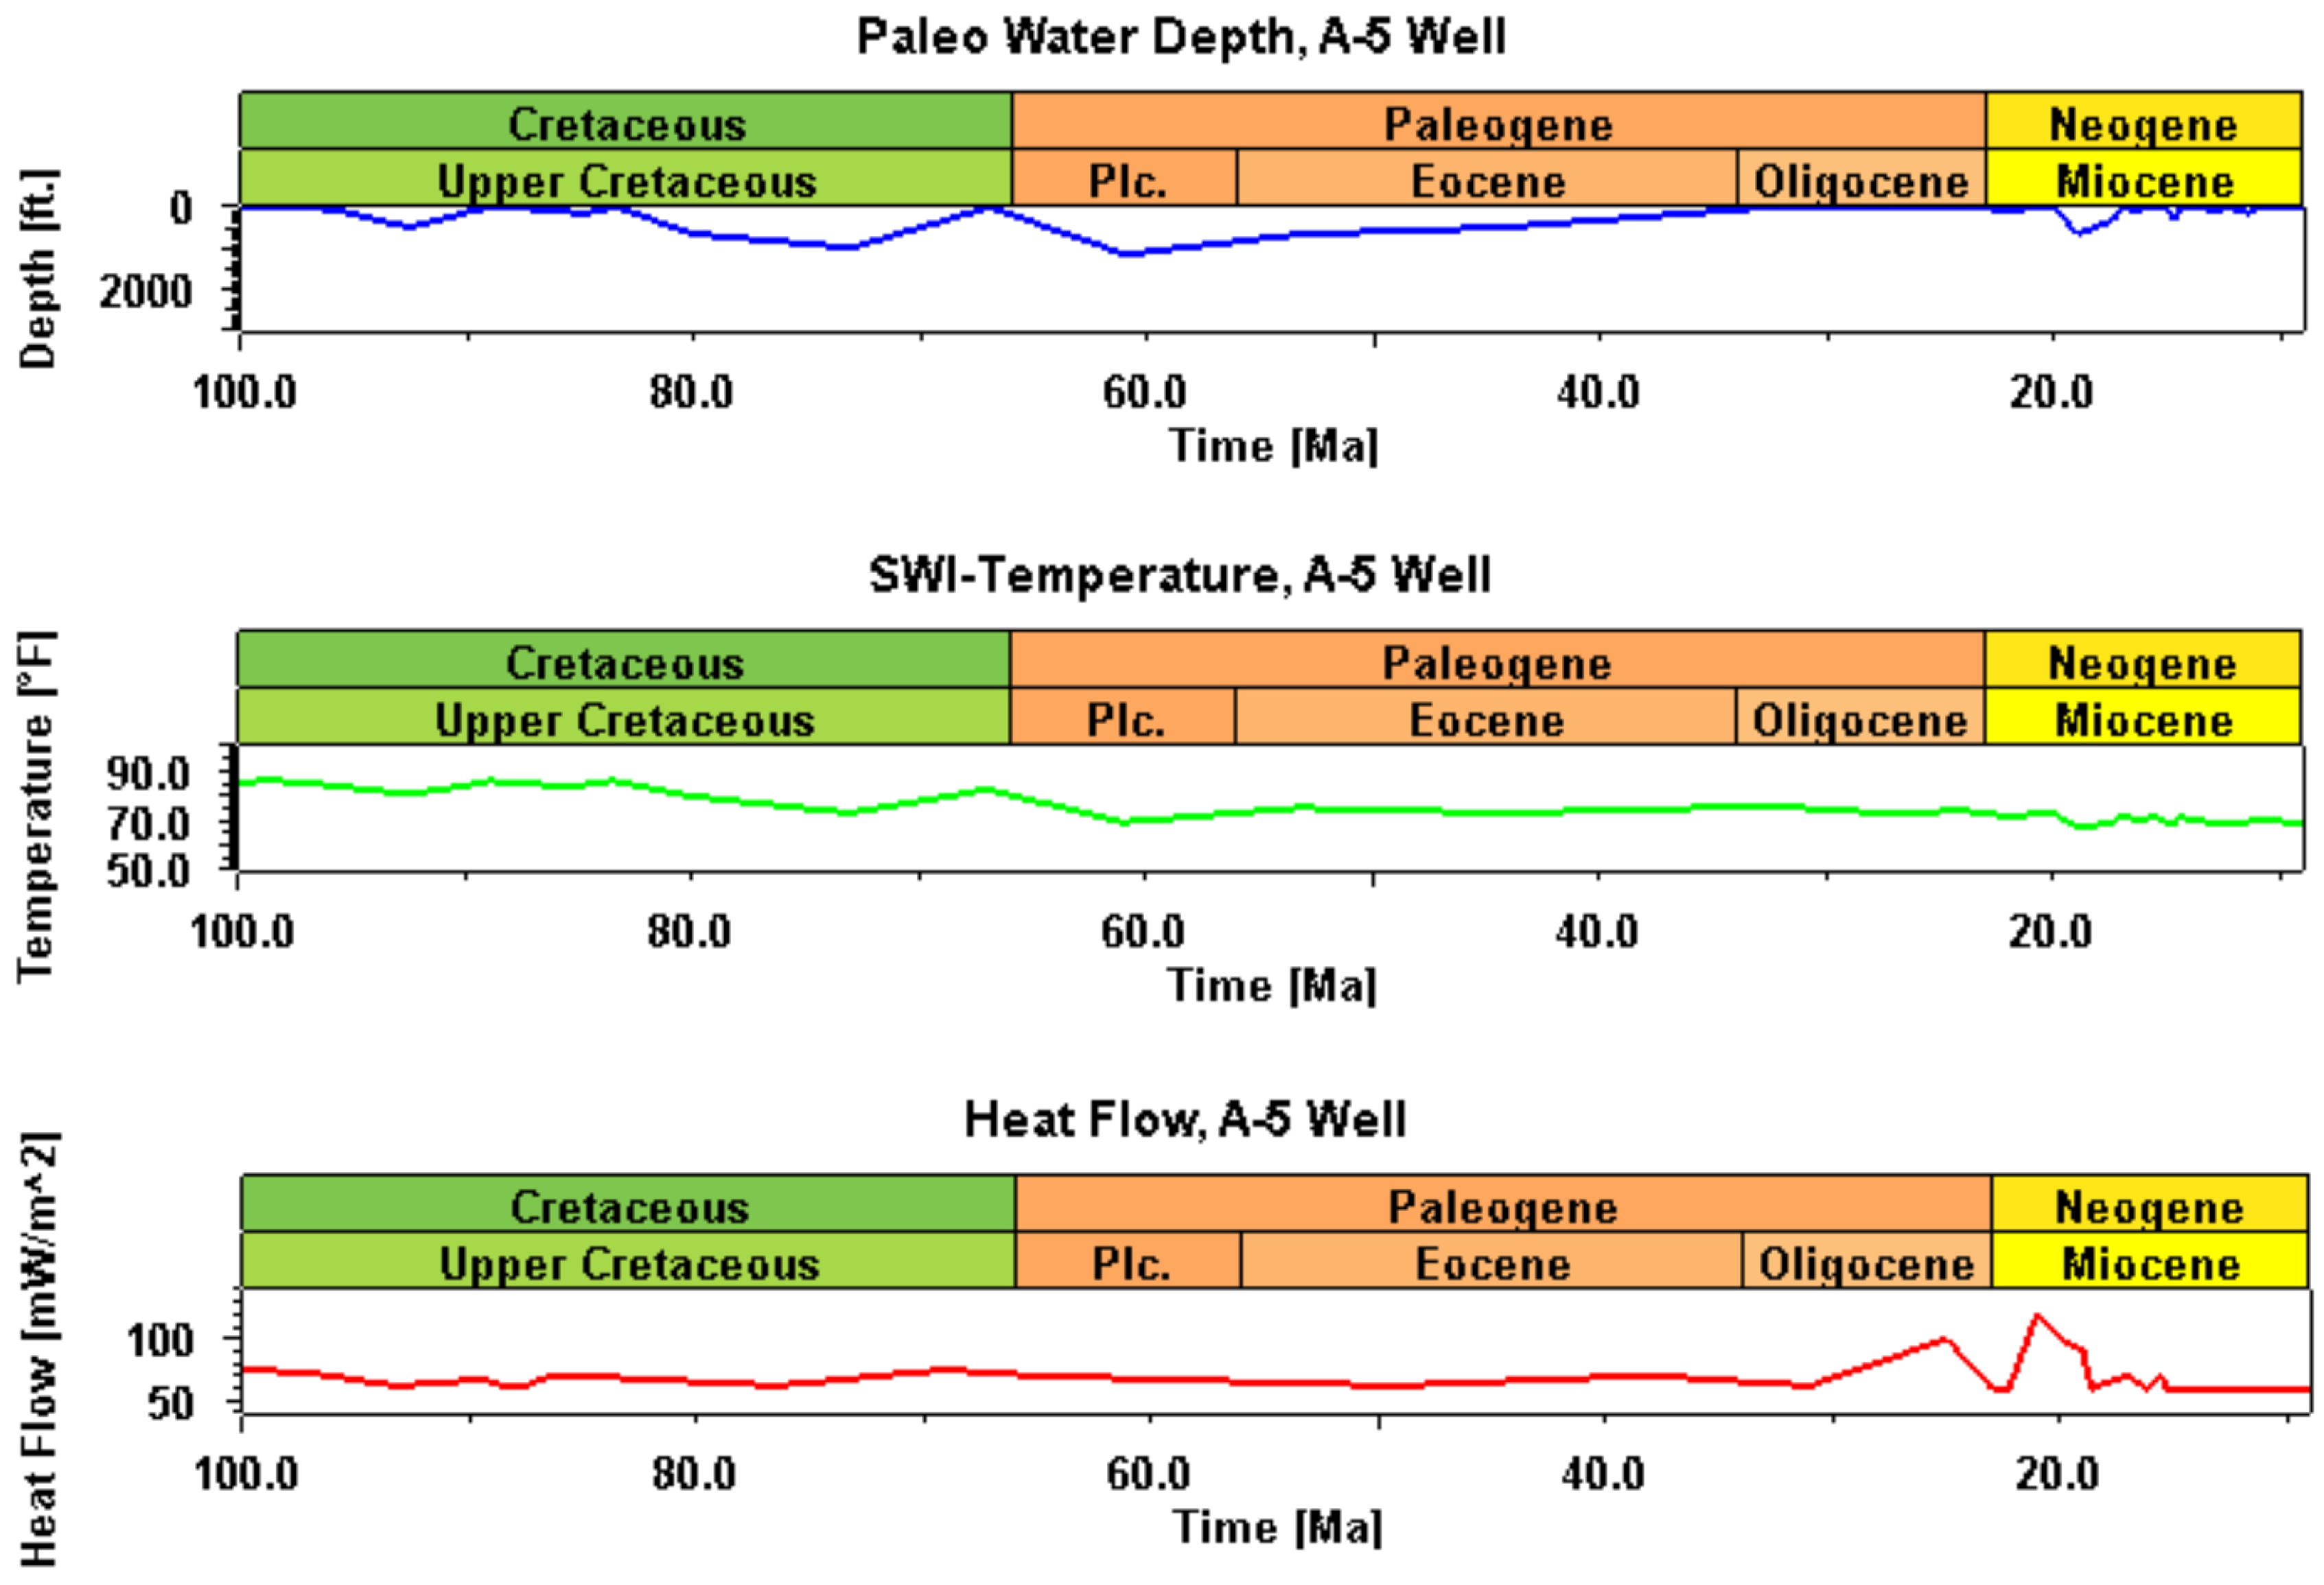
4.2.1. Thermal Boundary Conditions
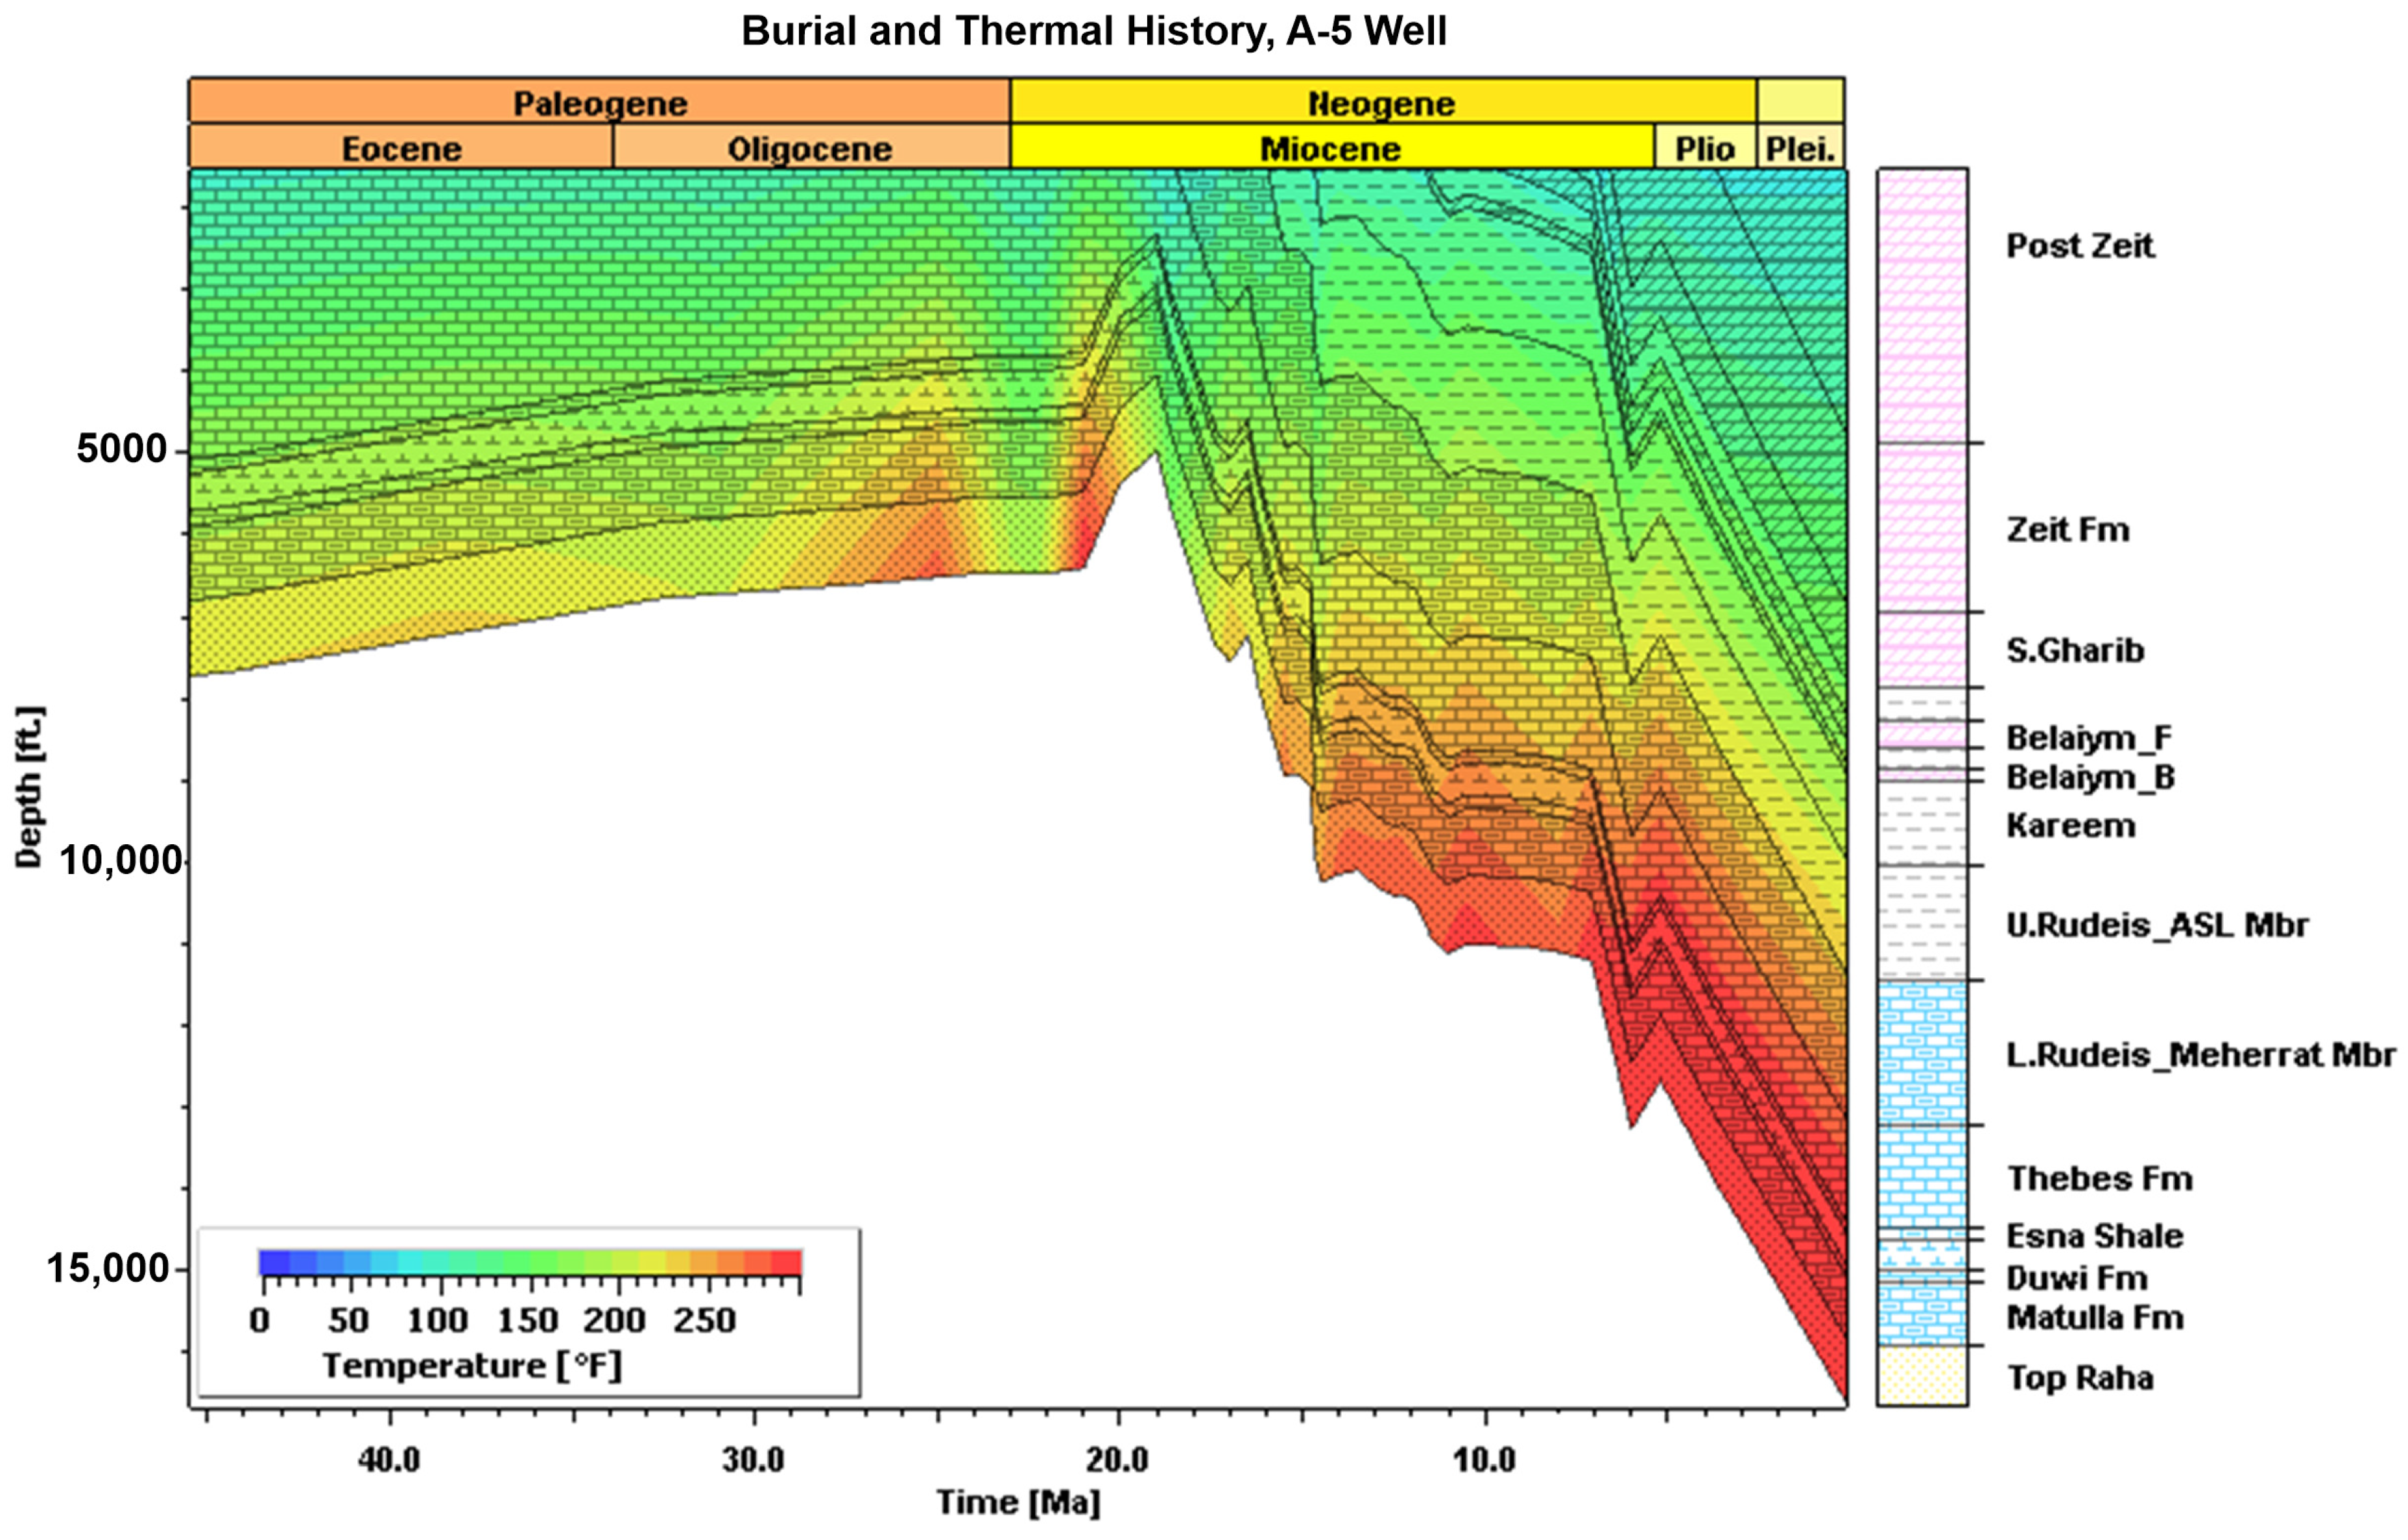
4.2.2. Burial and Thermal History
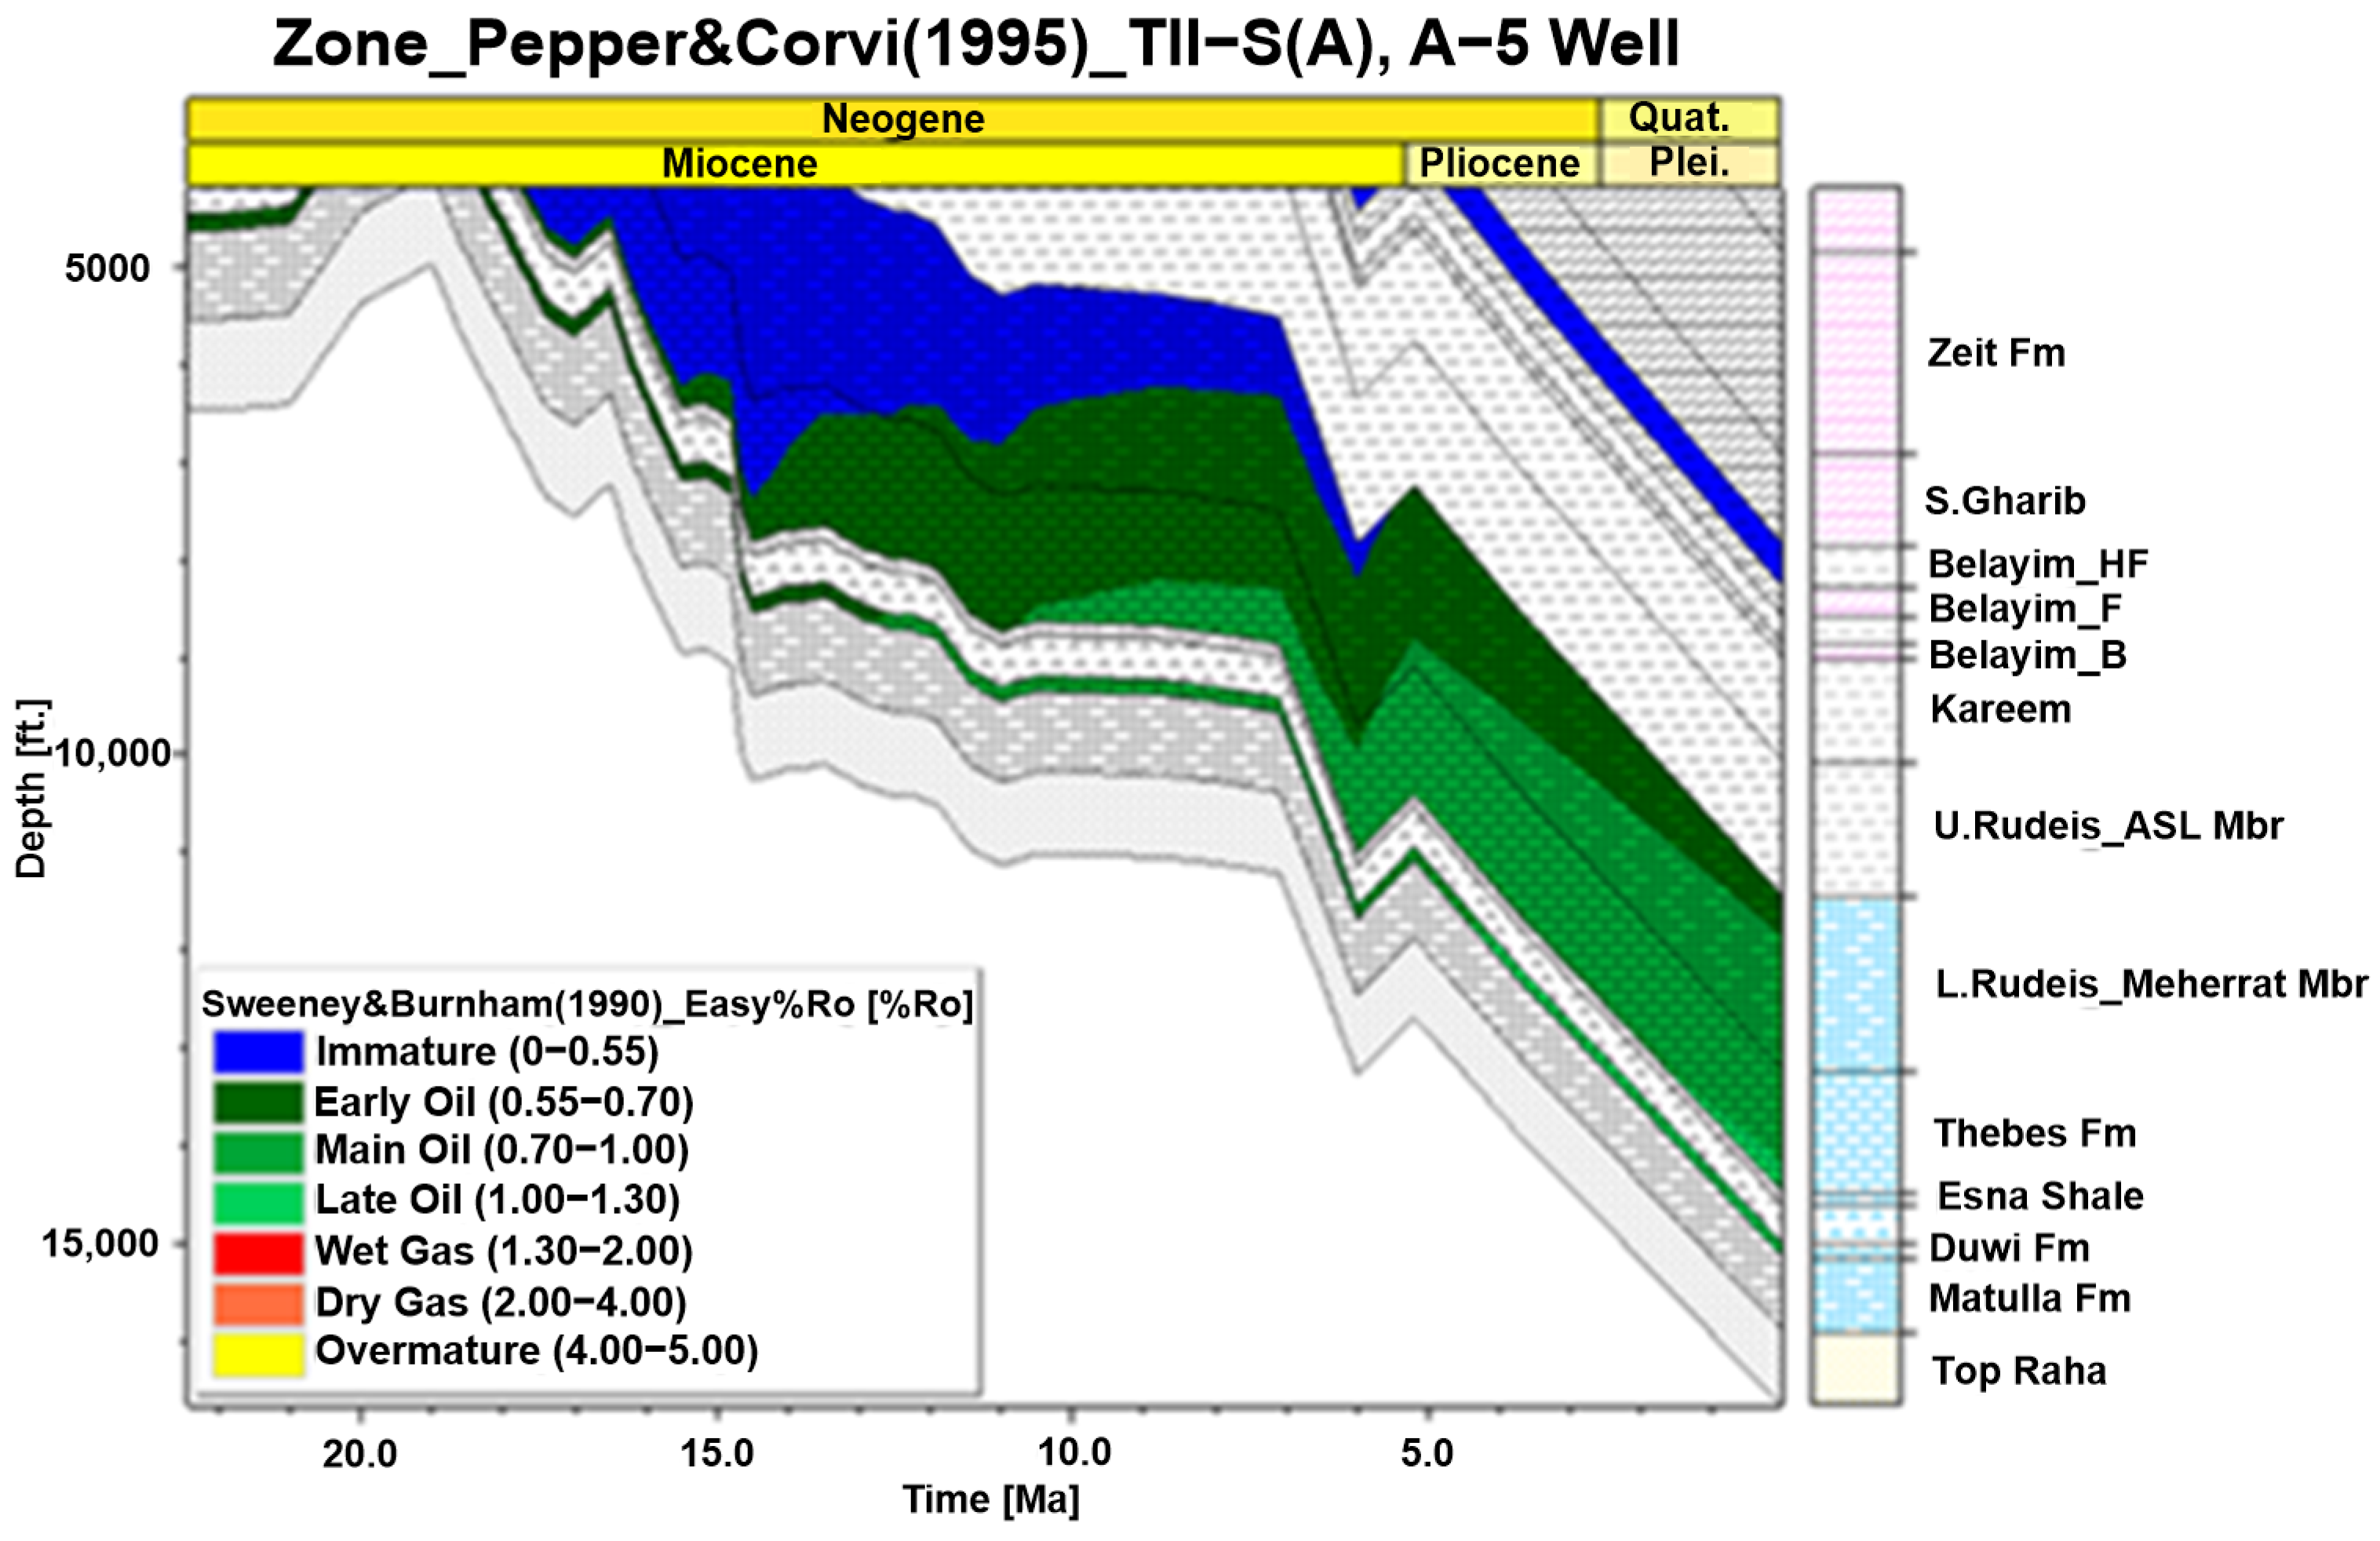
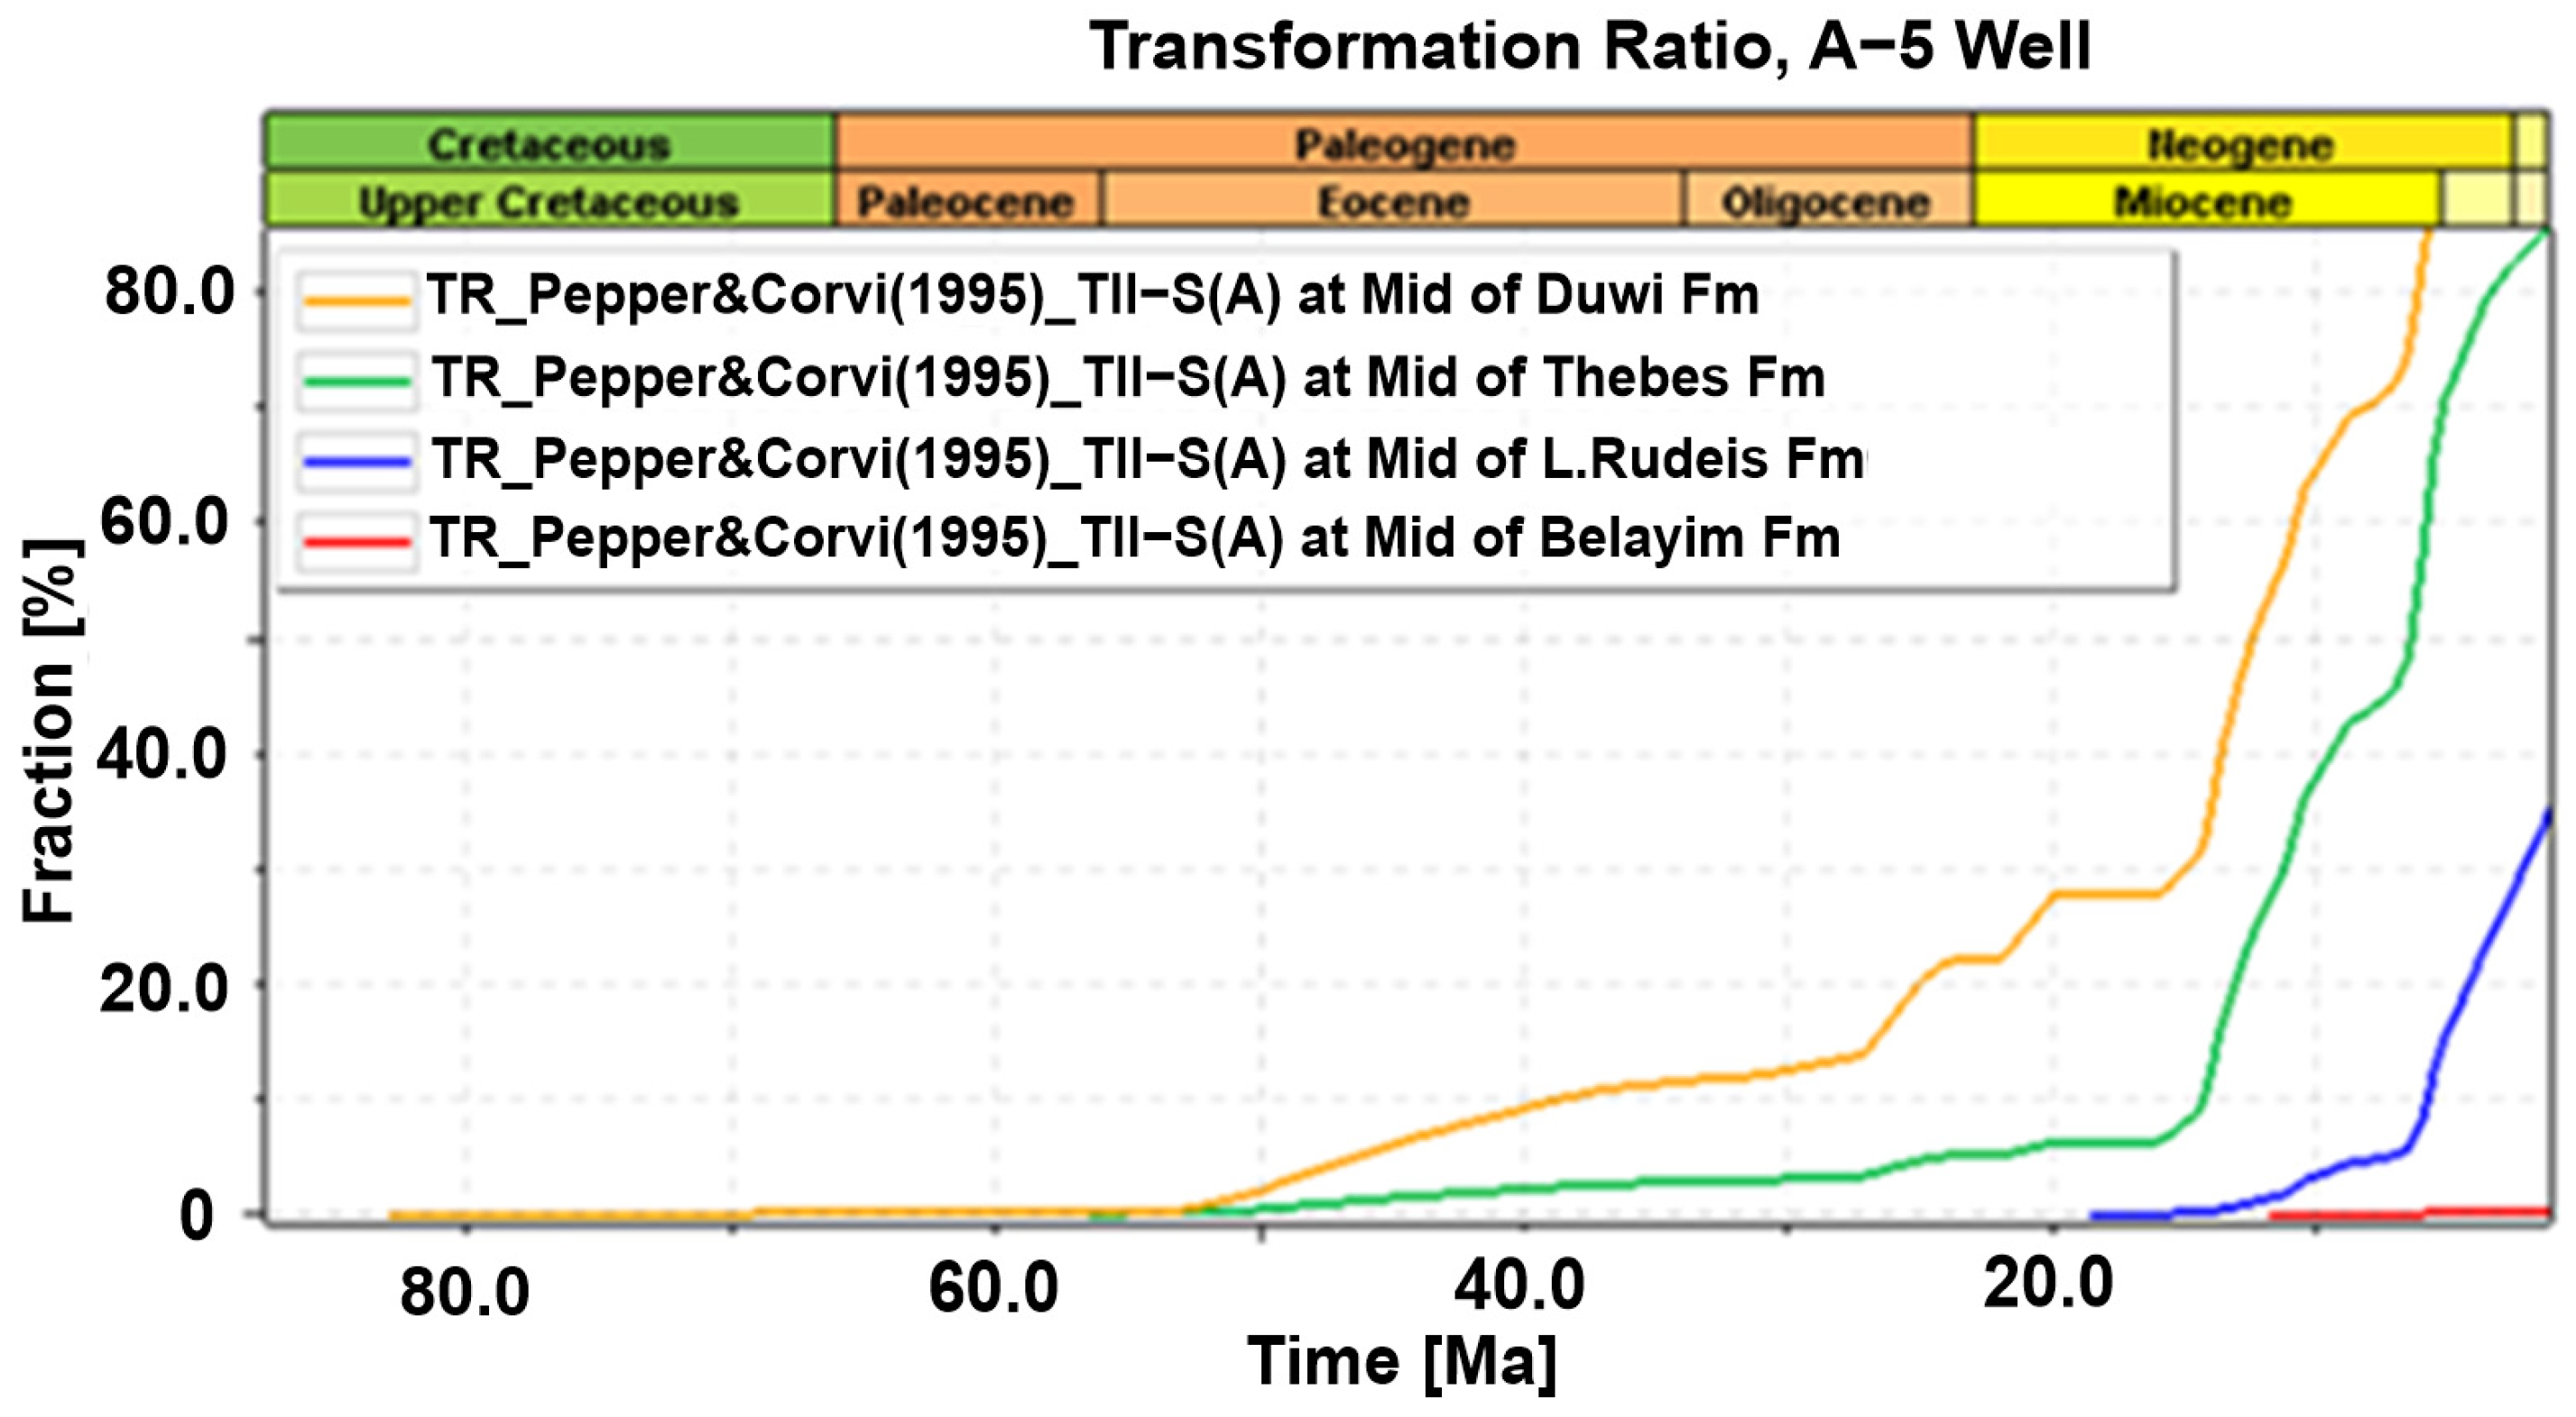
4.2.3. Hydrocarbon Generation
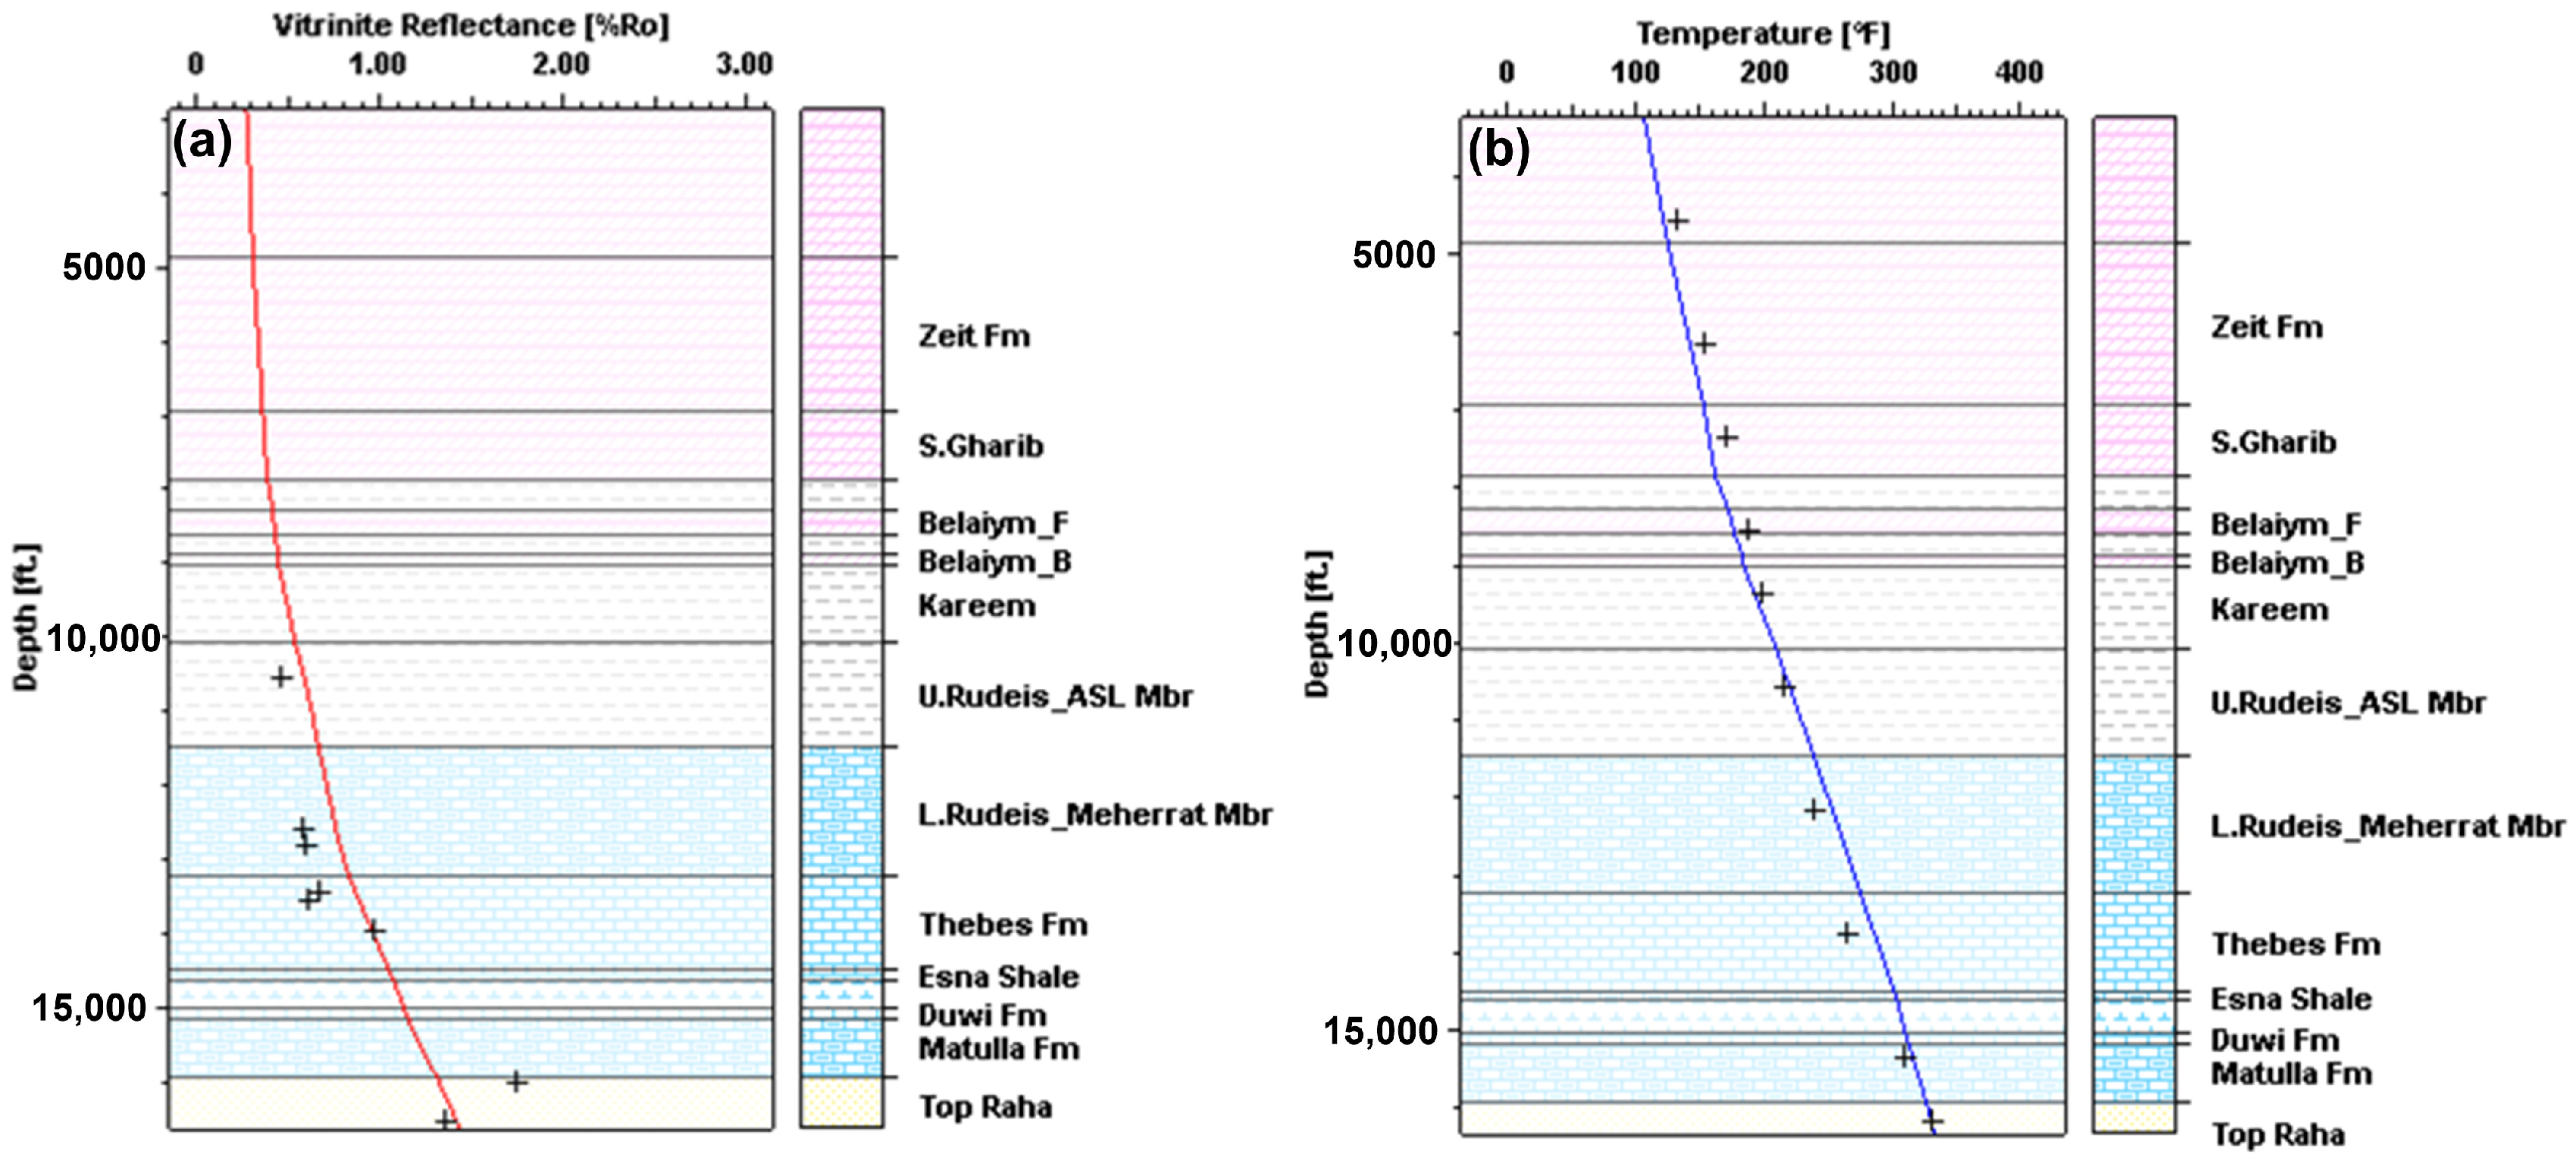
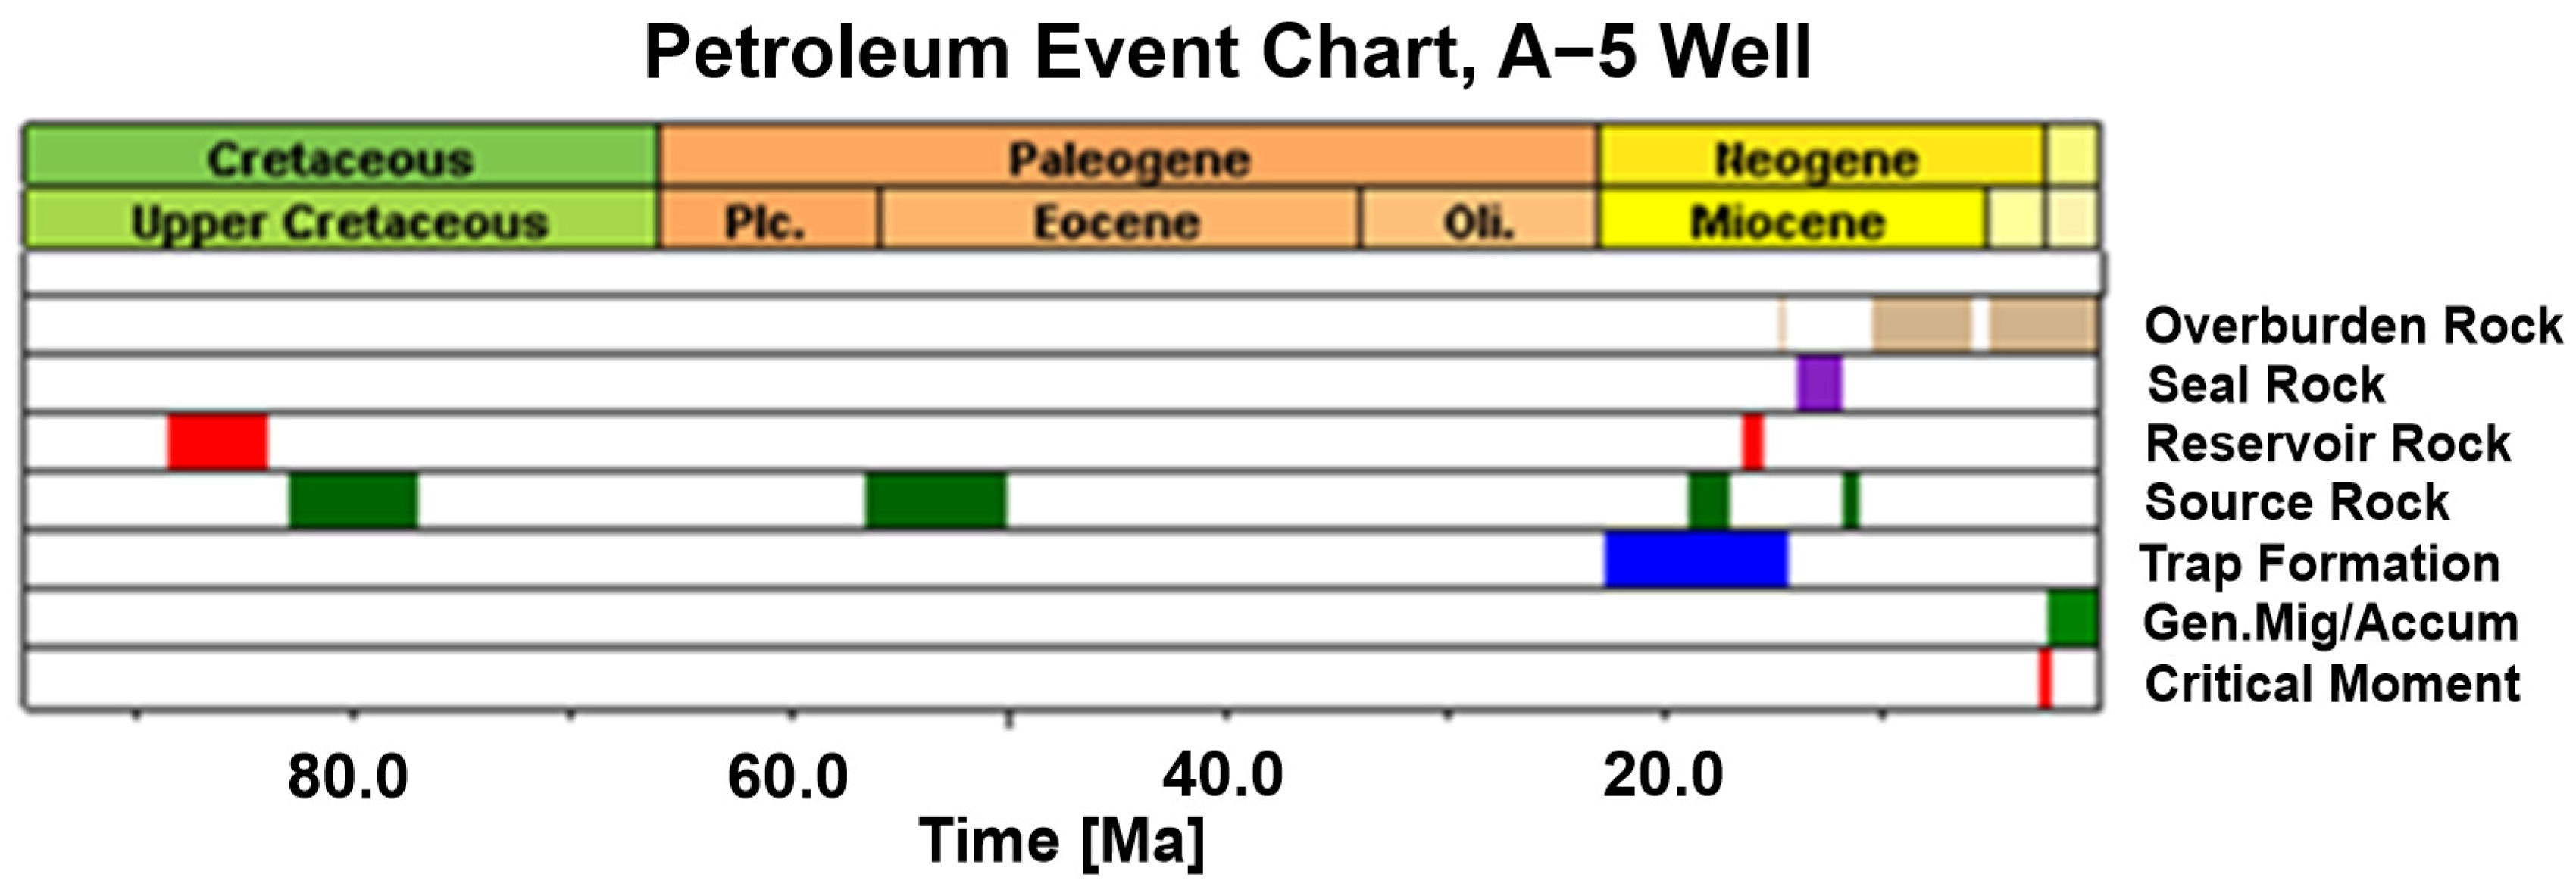
- The Middle Miocene Belayim source rock has not yet entered the early oil window (0.55–0.70 %Ro) and is classified as immature (0.00–0.55 %Ro).
- The Middle Miocene Lower Rudeis source rock reached the early oil window (0.55–0.70 %Ro) at 12.64 Ma at 6514 feet, entered the main oil window (0.70–1.00 %Ro) at 5.69 Ma at 9458 feet, and continues to remain in this window.
- The Eocene Thebes source rock entered the early oil window (0.55–0.70 %Ro) at 21 Ma at 3763 feet, shifted to the main oil window (0.7–1.0 %Ro) at 10.80 Ma at 8690 feet, and has been in the late oil window (1.00–1.30 %Ro) since 1.60 Ma at 13,236 feet.
- The Upper Cretaceous (Upper Senonian) Brown Limestone source rock entered the early oil window (0.55–0.7 %Ro) at 39 Ma at a depth of 5416 feet, transitioned to the main oil window (0.7–1.0 %Ro) at 13 Ma at 8594 feet, and remains in this window to the present.
4.2.4. Petroleum System Event Chart
5. Discussion
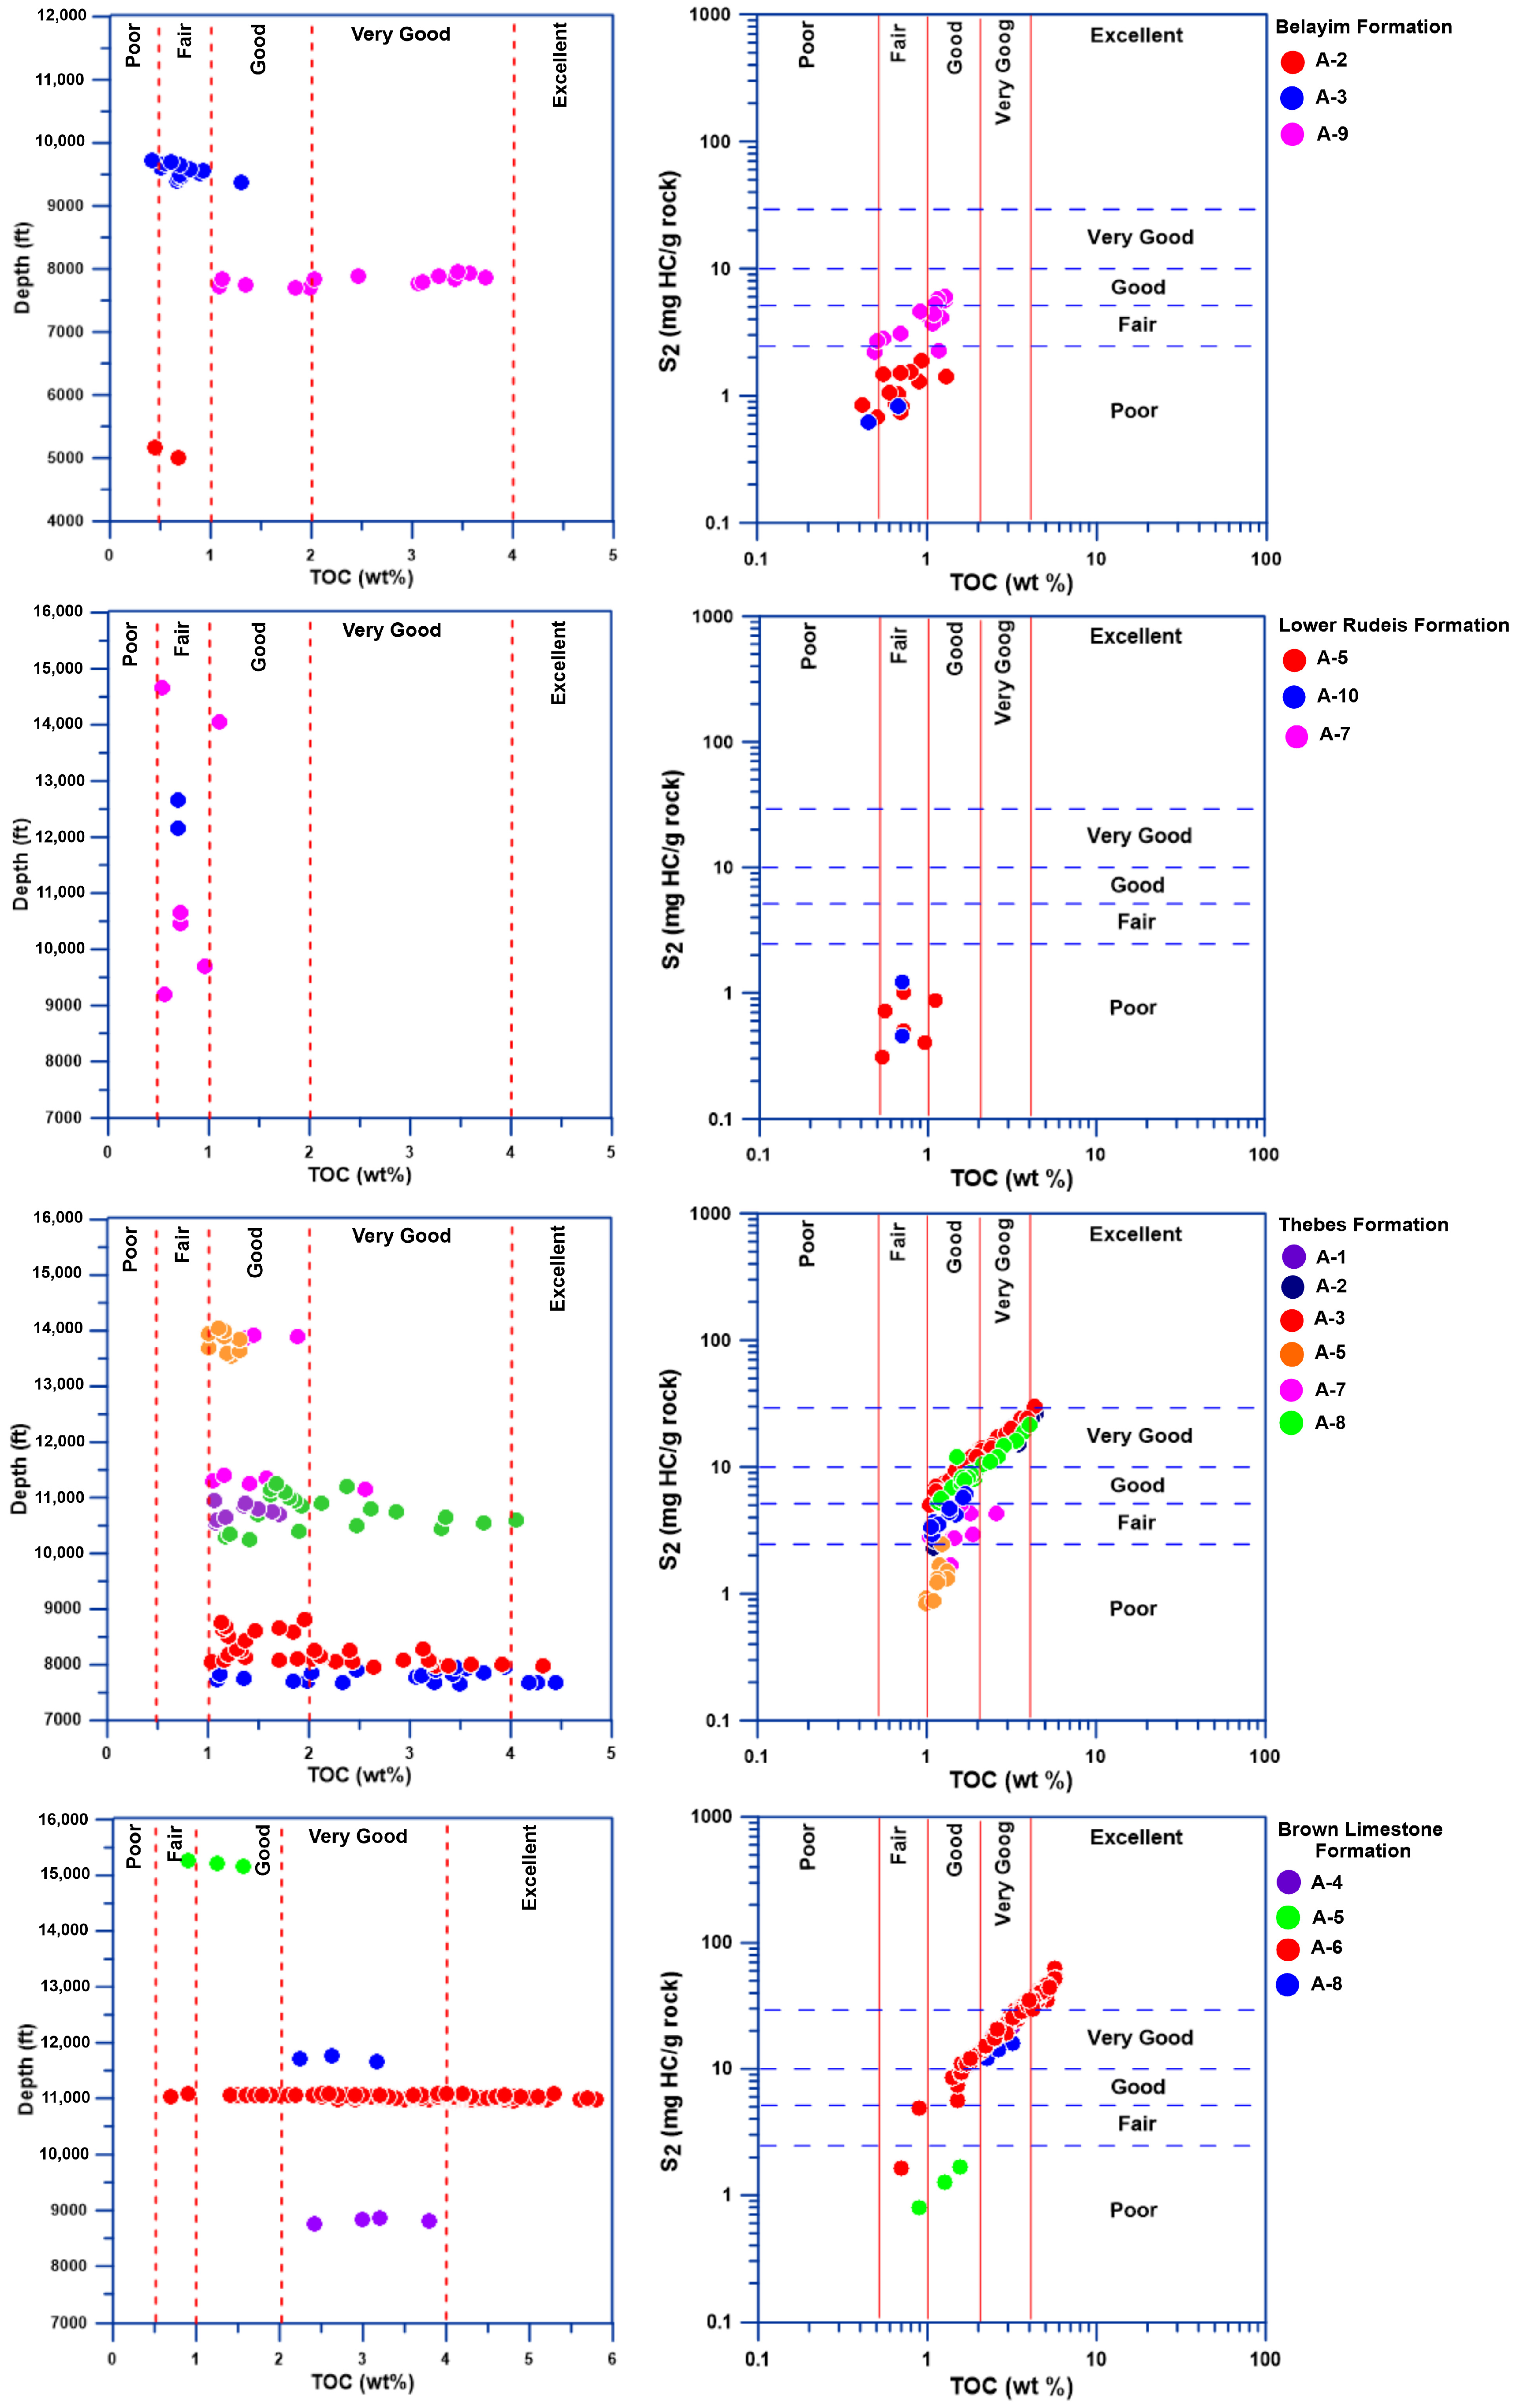
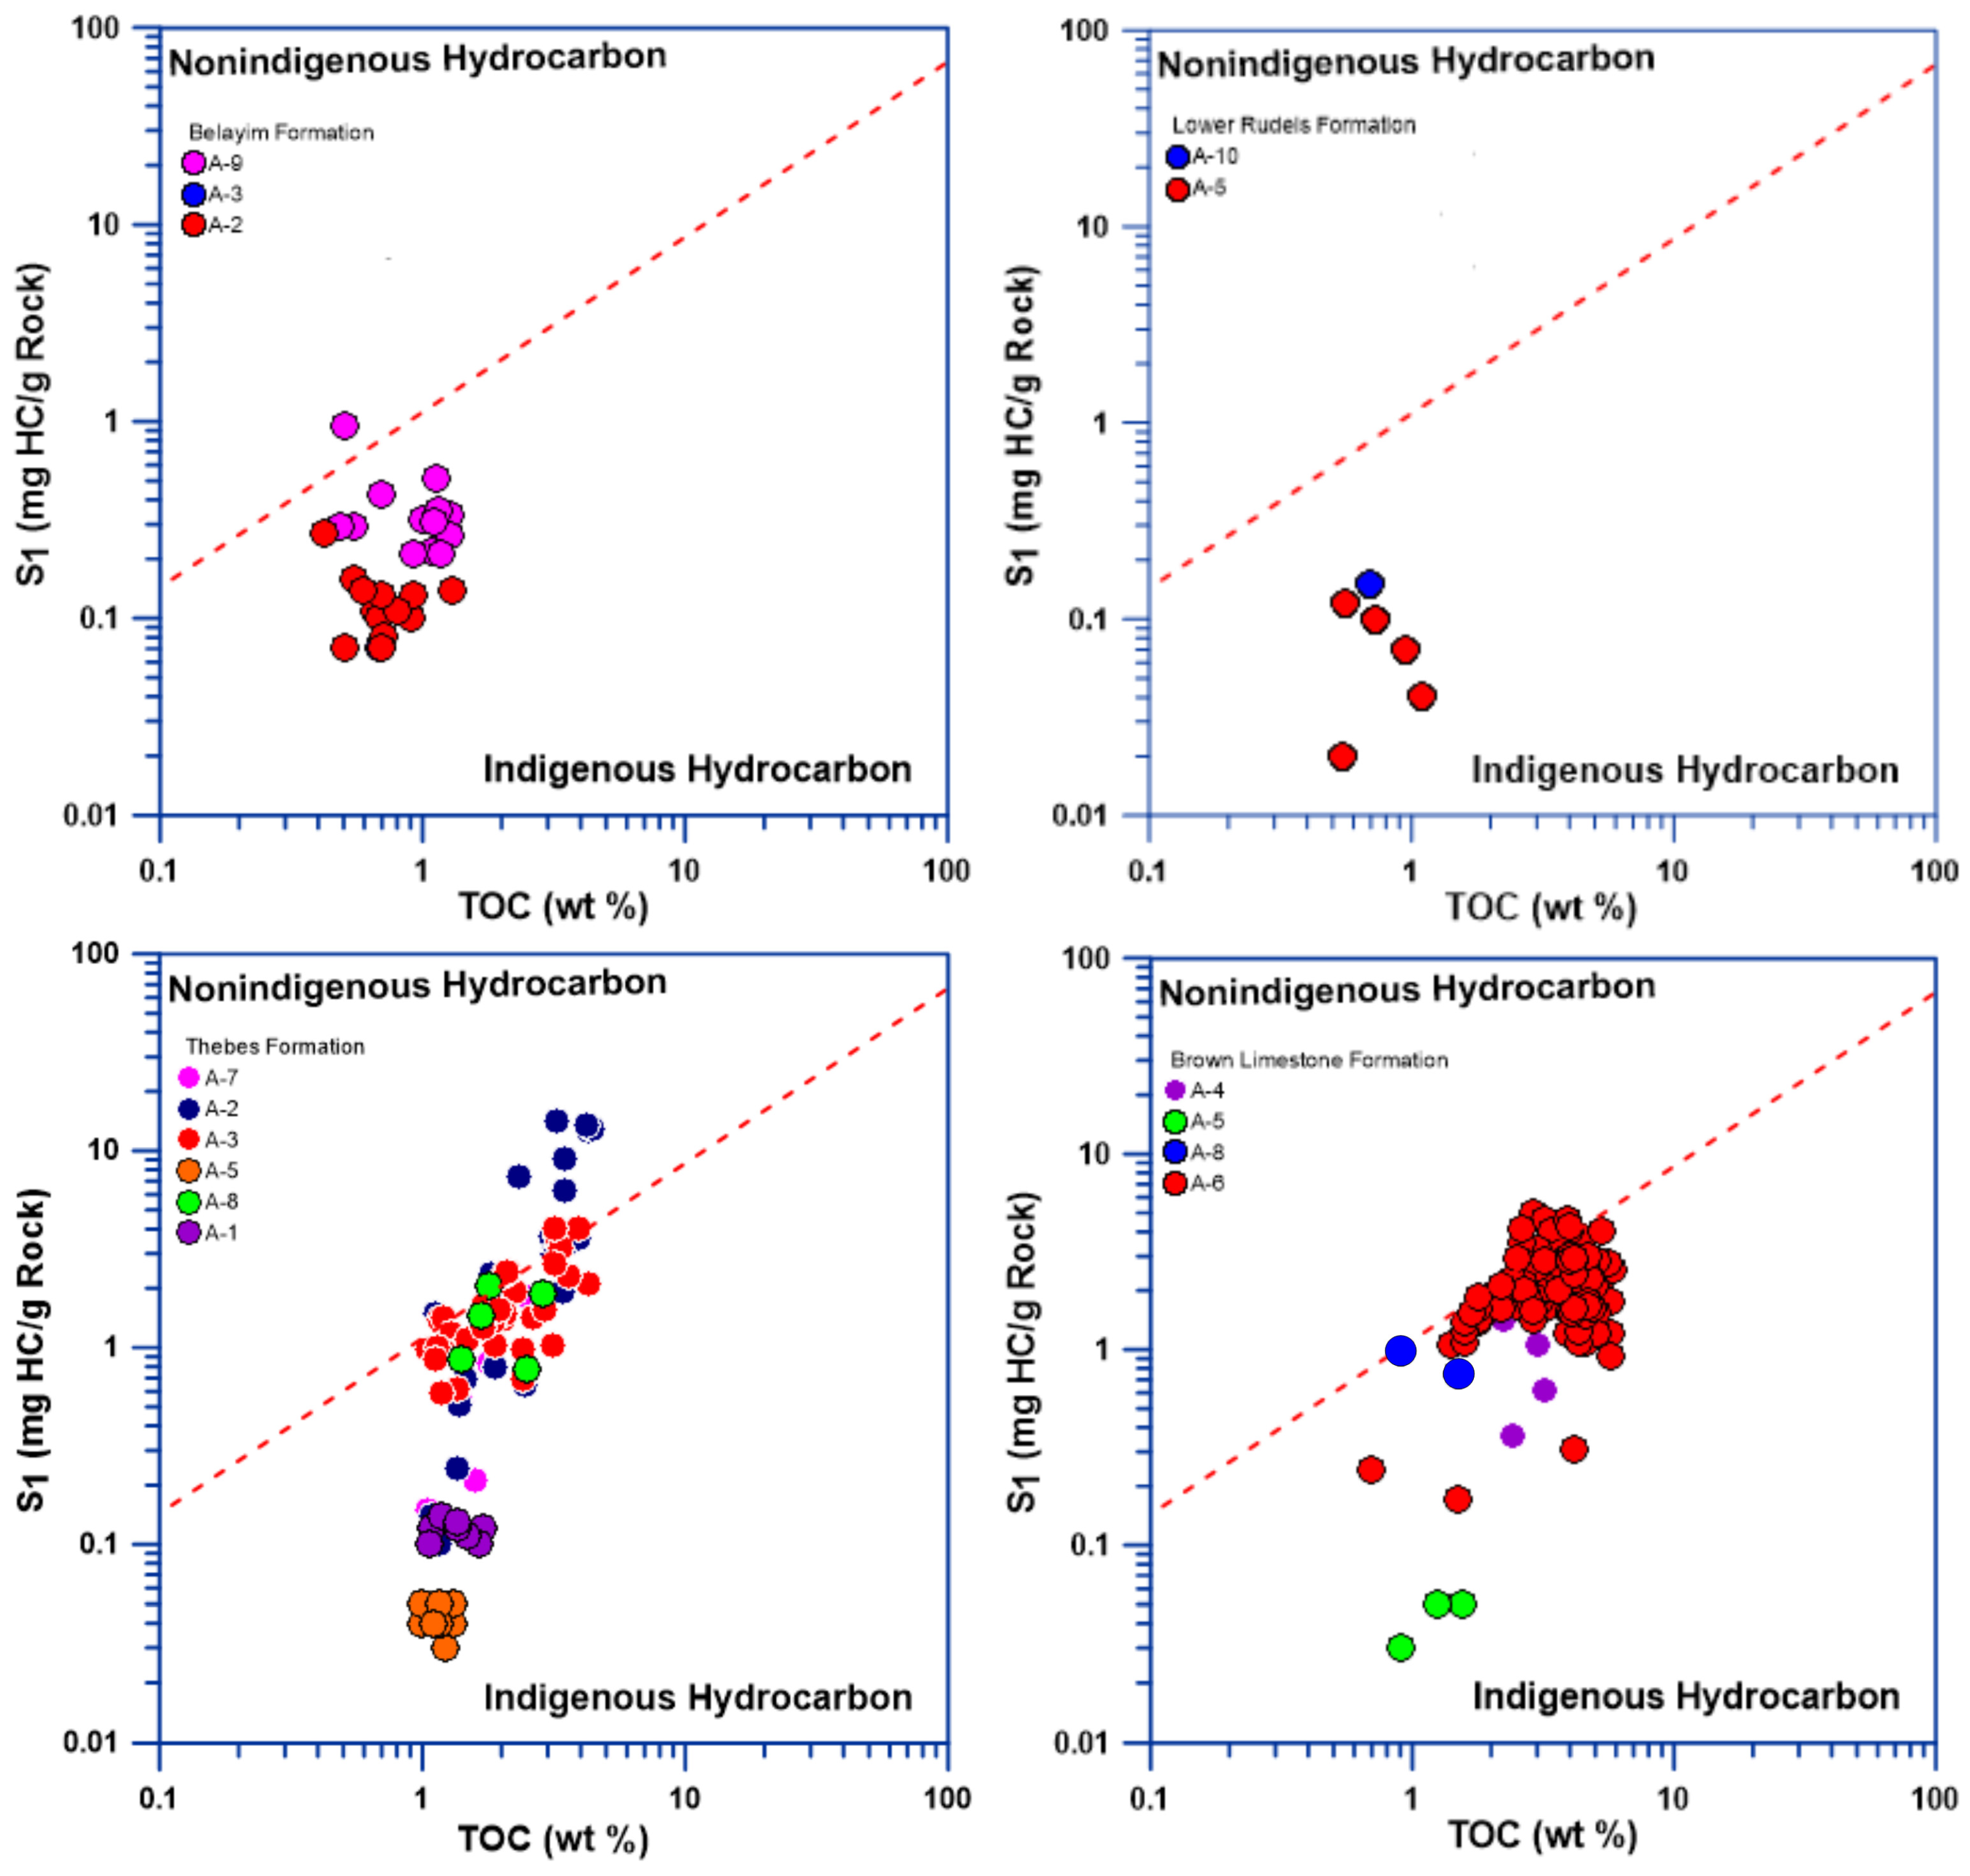
5.1. Source Rock Characteristics and Hydrocarbon Potential
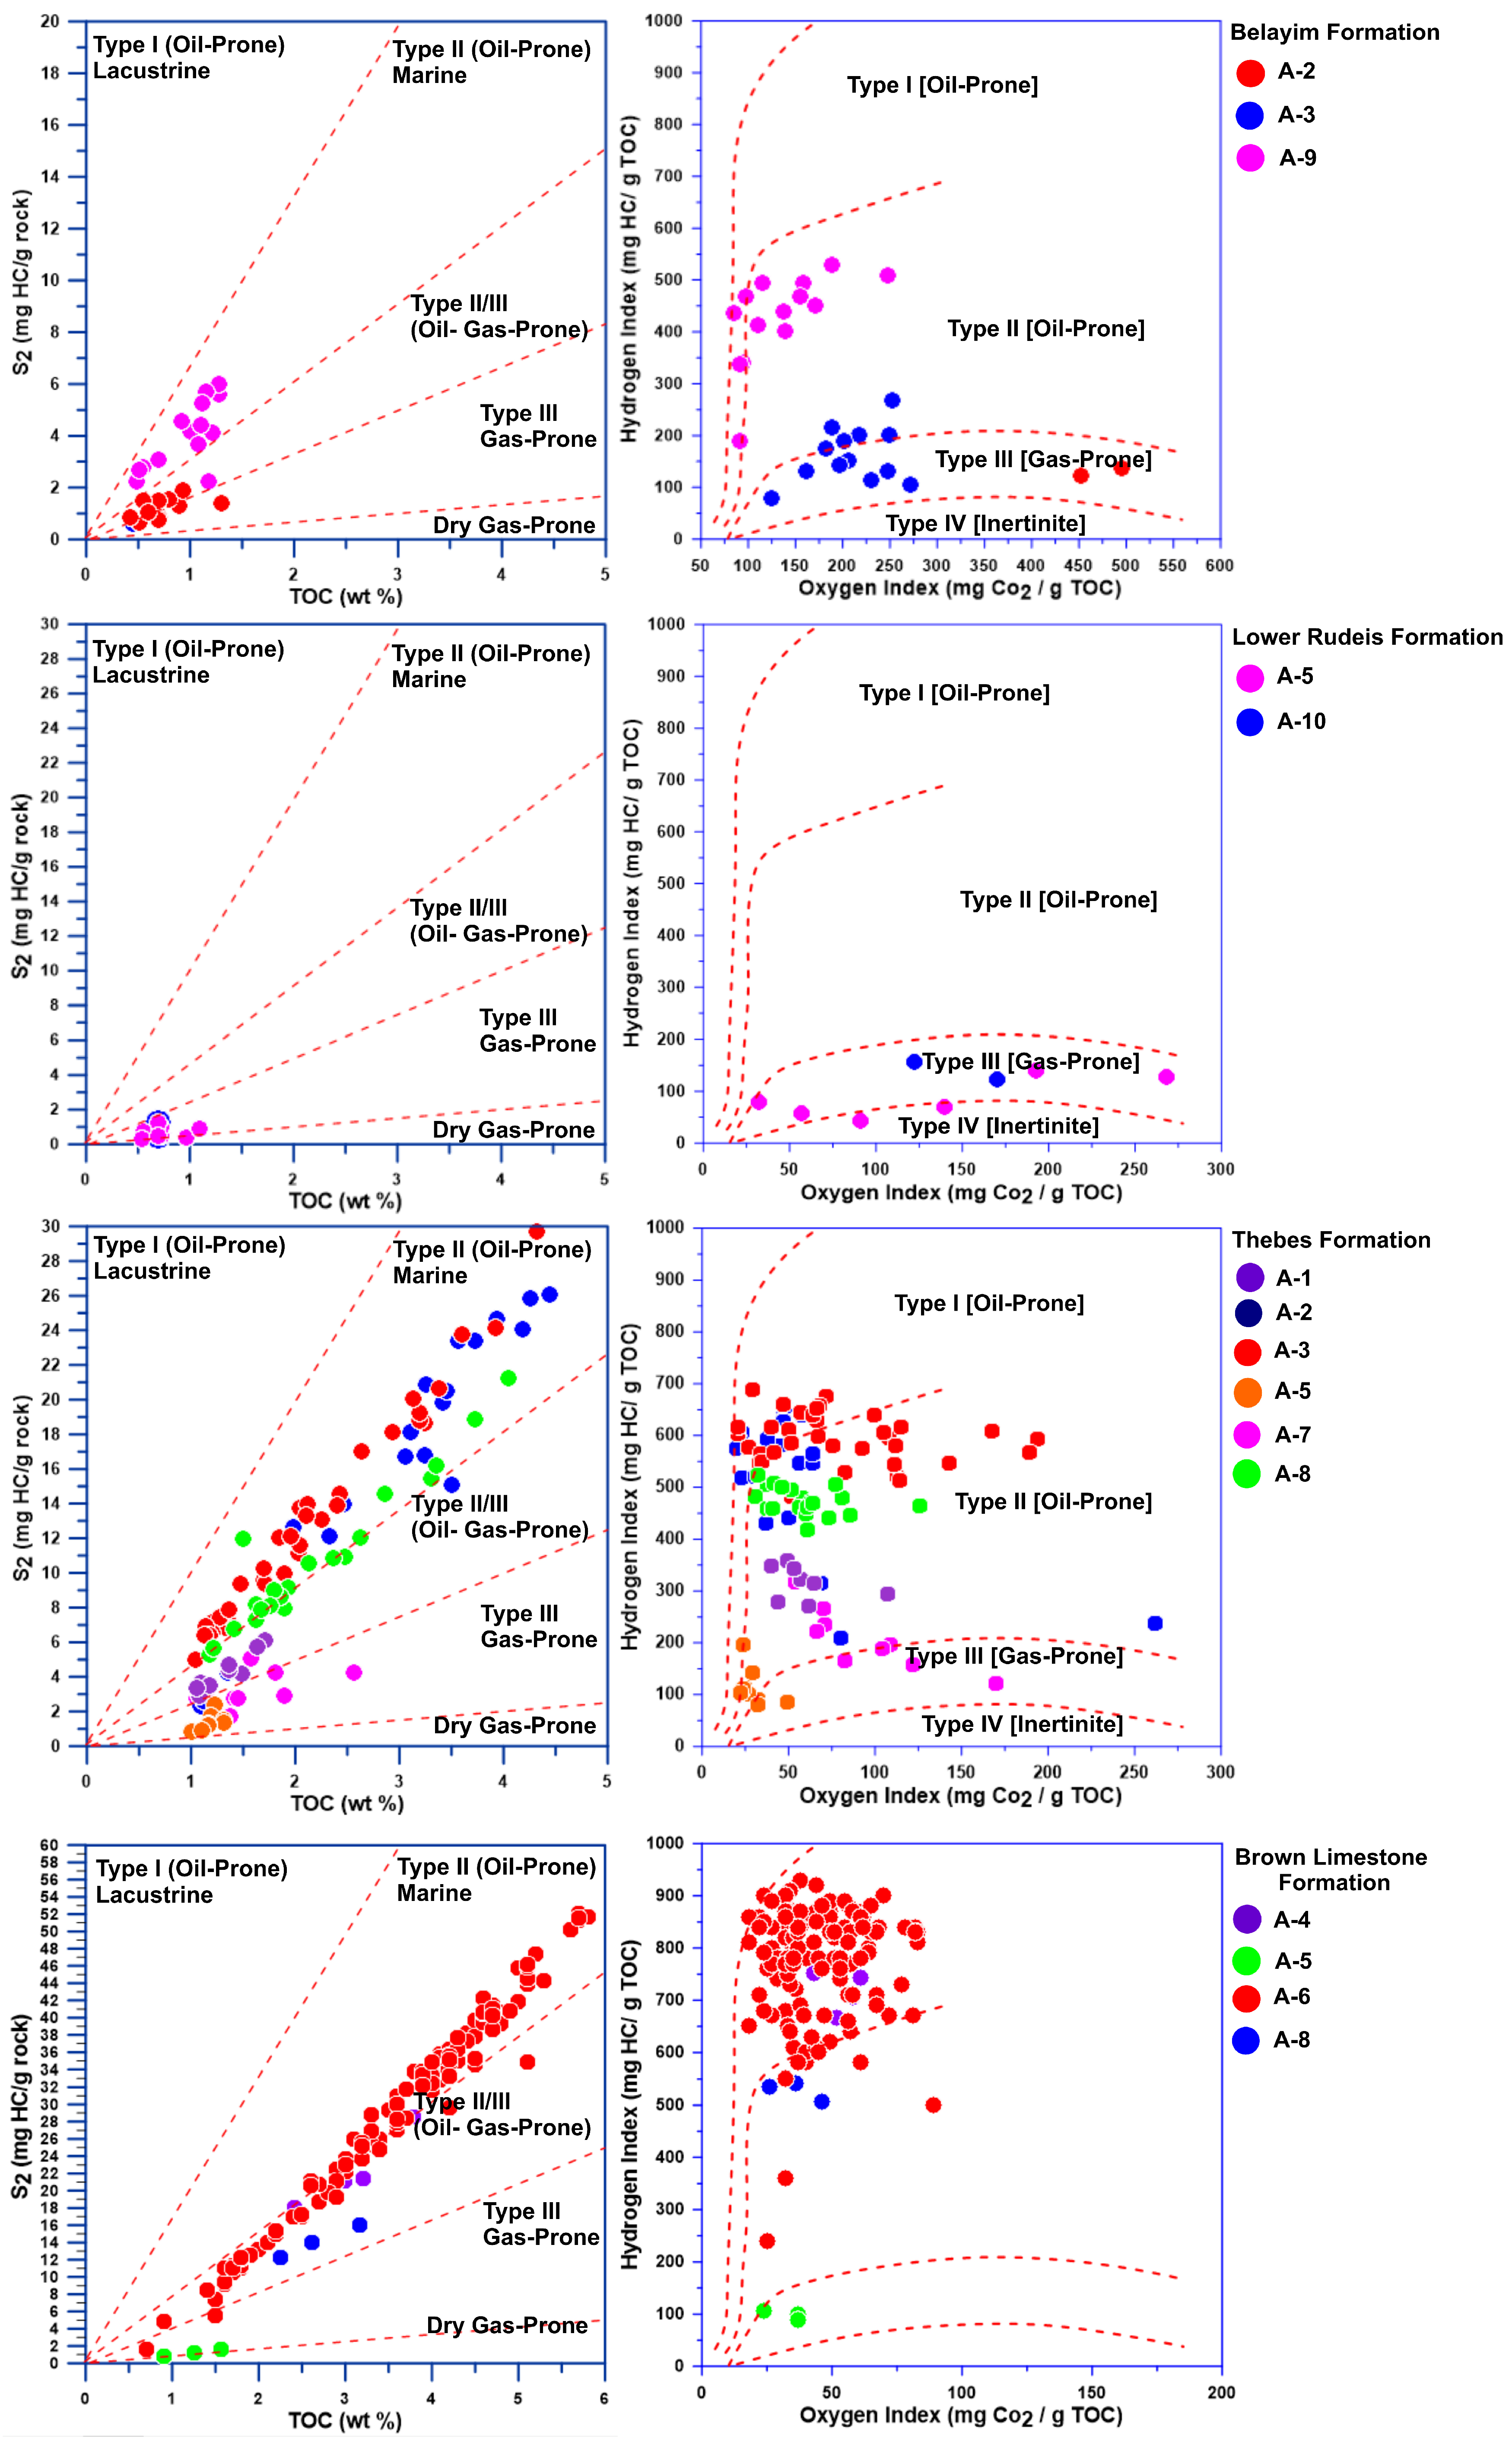
5.2. Organic Matter Type
5.3. Thermal Maturity and Hydrocarbon Generation Potential
6. Conclusions
Supplementary Materials
Author Contributions
Funding
Data Availability Statement
Acknowledgments
Conflicts of Interest
References
- Jackson, C.A.; Gawthorpe, R.L.; Sharp, I.R. Style and sequence of deformation during extensional fault-propagation folding: Examples from the Hammam Faraun and El-Qaa fault blocks, Suez Rift, Egypt. J. Struct. Geol. 2006, 28, 519–535. [Google Scholar] [CrossRef]
- Wescott, W.A.; Atta, M.; Dolson, J.C. PS A brief history of the exploration history of the Gulf of Suez, Egypt. In Proceedings of the AAPG/SEG International Conference & Exhibition, Cancun, Mexico, 6–9 September 2016. [Google Scholar]
- Alsharhan, A.S. Petroleum geology and potential hydrocarbon plays in the Gulf of Suez rift basin, Egypt. AAPG Bull. 2003, 87, 143–180. Available online: https://www.researchgate.net/publication/264738874_Petroleum_geology_and_potential_hydrocarbon_plays_in_the_Gulf_of_Suez_rift_basin_Egypt (accessed on 7 July 2025).
- Hamouda, A.Z.; El-Gendy, N.; El-Gharabawy, S.; Salah, M.; Barakat, M.K. Marine Geophysical Surveys and Interpretations on the Ancient Eunostos Harbor Area, Mediterranean Coast, Egypt. Egypt. J. Pet. 2023, 32, 47–55. [Google Scholar] [CrossRef]
- Nabawy, B.S.; Barakat, M.K. Formation evaluation using conventional and special core analysis: Belayim Formation as a case study, Gulf of Suez, Egypt. Arab. J. Geosci. 2017, 10, 25. [Google Scholar] [CrossRef]
- Gawad, E.A.; Fathy, M.; Reda, M.; Ewida, H. Petroleum geology: 3D reservoir modelling in the central Gulf of Suez, Egypt, to estimate the hydrocarbon possibility via petrophysical analysis and seismic data interpretation. Geol. J. 2021, 56, 5329–5342. [Google Scholar] [CrossRef]
- Khattab, M.A.; Radwan, A.E.; El-Anbaawy, M.I.; Mansour, M.H.; El-Tehiwy, A.A. Three-dimensional structural modelling of structurally complex hydrocarbon reservoir in October Oil Field, Gulf of Suez, Egypt. Geol. J. 2023, 58, 4146–4164. [Google Scholar] [CrossRef]
- Azab, A.A.; Nabawy, B.S.; Mogren, S.; Saqr, K.; Ibrahim, E.; Qadri, S.T.; Barakat, M.K. Structural Assessment and Petrophysical Evaluation of the pre-Cenomanian Nubian Sandstone in the October Oil Field, Central Gulf of Suez, Egypt. J. Afr. Earth Sci. 2024, 218, 105351. [Google Scholar] [CrossRef]
- Zahran, M.E. Geology of October oilfield. In Proceedings of the EGPC 8th Exploration Conference, Cairo, Egypt, 7–9 November 1986; pp. 52–53. [Google Scholar]
- Barakat, M.K.; El-Gendy, N.H.; EL-Shishtawy, A.M.; Shawaf, F.M. Application of well log analysis to estimate the petrophysical parameters of the Lower Rudeis Formation in July Oilfield, Gulf of Suez, Egypt. Al-Azhar Bull. Sci. 2022, 33, 127–143. [Google Scholar] [CrossRef]
- Barakat, M.K. Modern Geophysical Techniques for Constructing a 3D Geological Model on the Nile Delta, Egypt. PhD Thesis, Technical University of Berlin, Berlin, Germany, 2010. [Google Scholar] [CrossRef]
- Askar, M.; Abdallah, A.; Gad, I. Downhole scales associated with October Field formation waters and water injection using a shallow aquifer. In Proceedings of the SPE International Conference and Exhibition on Formation Damage Control, Lafayette, LA, USA, 19–21 February 2020. SPE-199300. [Google Scholar] [CrossRef]
- Atef, A. Source rock evaluation of the Brown Limestone (upper Senonian), Gulf of Suez. In Proceedings of the 9th Egyptian General Petroleum Corporation, Petroleum Exploration and Production Conference, Cairo, Egypt, 6–9 November 1988. [Google Scholar]
- Lashin, A.; Mogren, S. Total organic caron enrichment and source rock evaluation of the Lower Miocene rocks based on well logs: October oil field, Gulf of Suez-Egypt. Int. J. Geosci. 2012, 3, 683–695. [Google Scholar] [CrossRef]
- Diasty, W.S.E.; Beialy, S.E.; Mostafa, A.R.; Ghonaim, A.A.; Peters, K.E. Crude oil geochemistry and source rock potential of the upper Cretaceous–Eocene succession in the Belayim oilfields, Central Gulf of Suez, Egypt. J. Pet. Geol. 2015, 38, 193–215. [Google Scholar] [CrossRef]
- Abdelwahab, F.M.; El Gendy, N.H.; Barakat, M.K.; El Terb, R.A.; El Feky, M.G. Radionuclide Content and Radiation Dose Rates of Uraniferous and Mineralized Granites at GV Occurrence in Gabal Gattar, Northeastern Desert, Egypt. J. Phys. Conf. Ser. 2022, 2305, 012006. [Google Scholar] [CrossRef]
- Moustafa, A.R.; Khalil, S.M. Control of compressional transfer zones on syntectonic and post-tectonic sedimentation: Implications for hydrocarbon exploration. J. Geol. Soc. 2017, 174, 336–352. [Google Scholar] [CrossRef]
- El-Shahat, W.; Villinski, J.C.; El-Bakry, G. Hydrocarbon potentiality, burial history and thermal evolution for some source rocks in October oil field, northern Gulf of Suez, Egypt. J. Pet. Sci. Eng. 2009, 68, 245–267. [Google Scholar] [CrossRef]
- Ahmed, M.A.; Hegab, O.A.; Awadalla, A.S.; Farag, A.E.; Hassan, S. Hydrocarbon generation, in-source conversion of oil to gas and expulsion: Petroleum system modeling of the Duwi Formation, Gulf of Suez, Egypt. Nat. Resour. Res. 2019, 28, 1547–1573. [Google Scholar] [CrossRef]
- Afife, M.M.; Al-Atta, M.A.; Ahmed, M.A.; Issa, G.I. Thermal maturity and hydrocarbon generation of the Dawi Formation, Belayim Marine Oil Field, Gulf of Suez, Egypt: A 1D basin modeling case study. Arab. J. Geosci. 2016, 9, 331. [Google Scholar] [CrossRef]
- Awadallah, A.; Hegab, O.A.; Ahmed, M.A.; Hassan, S. Burial and thermal history simulation of the Abu Rudeis-Sidri oil field, Gulf of Suez-Egypt: A 1D basin modeling study. J. Afr. Earth Sci. 2018, 138, 86–101. [Google Scholar] [CrossRef]
- Elmaadawy, K.G.; Bayan, M.F.; El-Shayeb, H.M. Source rock maturity and hydrocarbon potential of Abu Rudeis-Sidri area, central province, Gulf of Suez, Egypt. Arab. J. Geosci. 2021, 14, 2813. [Google Scholar] [CrossRef]
- El-Ghamri, M.A.; Warburton, I.C.; Burley, S.D. Hydrocarbon Generation and Charging in the October Field, Gulf of Suez, Egypt. J. Pet. Geol. 2002, 25, 433–464. [Google Scholar] [CrossRef]
- Sercombe, W.J.; Golob, B.R.; Kamel, M.; Stewart, J.W.; Smith, G.W.; Morse, J. D Significant structural reinterpretation of the subsalt, giant October Field, Gulf of Suez, Egypt, Using SCAT, isogon-based sections and maps, and 3-D seismic. Lead Edge 1997, 6, 1089–1208. [Google Scholar] [CrossRef]
- Sercombe, W.J.; Thurmon, L.; Morse, J. Advanced reservoir modeling in poor seismic; October field, Northern Gulf of Suez, Egypt. In Proceedings of the AAPG International Conference and Exhibition, Milan, Italy, 23–26 October 2012. [Google Scholar]
- Reda, M.; El-Gendy, N.H.; Raef, A.; Elmashaly, M.; AlArifi, N.; Barakat, M.K. Advancing Neogene-quaternary reservoir characterization in offshore Nile Delta, Egypt: High-resolution seismic insights and 3D modeling for new prospect identification. Environ. Earth Sci. 2024, 83, 581. [Google Scholar] [CrossRef]
- Kassem, A.A.; Sharaf, L.M.; Baghdady, A.R.; El-Naby, A.A. Cenomanian/Turonian oceanic anoxic event 2 in October oil field, central Gulf of Suez, Egypt. J. Afr. Earth Sci. 2020, 165, 103817. [Google Scholar] [CrossRef]
- El-Gendy, N.; Barakat, M.; Abdallah, H. Reservoir assessment of the Nubian sandstone reservoir in South Central Gulf of Suez Egypt. J. Afr. Earth Sci. 2017, 129, 596–609. [Google Scholar] [CrossRef]
- Gawad, E.A.; Fathy, M.; Reda, M.; Ewida, H. Re-evaluation of the Oil Potentiality of Matulla Formation in October Oil Field, Gulf of Suez, Egypt, Using the 3D Static Reservoir Modeling of Well Logs and Seismic Data. Egypt. J. Appl. Geophys. 2019, 18, 21–34. [Google Scholar]
- Gawad, E.A.; Fathy, M.; Reda, M.; Ewida, H. 3D Static Reservoir Modeling, Using Well Logs and Seismic Data, to Re-evaluate the Oil Potentiality of the Upper Rudeis Formation (Asl Member) in October Oil Field, Gulf of Suez, Egypt. In Annals of the Geological Survey of Egypt; The Egyptian Mineral Resources Authority: Cairo, Egypt, 2020; Volume XXXIIV, pp. 216–237. Available online: https://www.researchgate.net/publication/336848190_3D_STATIC_RESERVOIR_MODELING_USING_WELL_LOGS_AND_SEISMIC_DATA_TO_RE-EVALUATE_THE_OIL_POTENTIALITY_OF_THE_UPPER_RUDEIS_FORMATION_ASL_MEMBER_IN_OCTOBER_OIL_FIELD_GULF_OF_SUEZ_EGYPT (accessed on 15 July 2024).
- El Bahr, M.; Patchett, J.G.; Wiley, R. Modeling the effects of glauconite on some openhole logs from the Lower Senonian in Egypt. In Proceedings of the 11th EGPC Petroleum Exploration and Production Conference, Cairo, Egypt, 7–10 November 1992; Volume 1, pp. 494–514. [Google Scholar]
- Martilla, R.K.; El Bahr, M. Evaluation of a lithology complex reservoir (Nezzazat Group) in the Gulf of Suez. In Proceedings of the 12th EGPC Exploration and Production Conference, Cairo, Egypt, 12–15 November 1994; Volume 2, pp. 472–482. [Google Scholar]
- Abd Elhady, M.A.; Fathy, M.; Hamed, T.; Reda, M. Petroleum evaluation through subsurface and petrophysical studies of Hammam Faraun Member of Belayim Formation, Bakr Oil Field, Gulf of Suez, Egypt. Nat. Sci. 2015, 13, 59–78. [Google Scholar]
- El Sharawy, M.S.; Nabawy, B. Geological and petrophysical characterization of the Lower Senonian Matulla Formation in Southern and Central Gulf of Suez, Egypt. Arab J. Sci. Eng. 2016, 41, 281–300. [Google Scholar] [CrossRef]
- Gandino, A.I.G.; Milad, A.G. Magnetic interpretation is controlled by interactive 3D modelling in the southern Gulf of Suez. In Proceedings of the 10th Exploration and Production Conference, Cairo, Egypt, 7–20 November 1990; Egyptian General Petroleum Corporation: Cairo, Egypt, 1990; Volume 1, pp. 740–786. [Google Scholar]
- IHS. Gulf of Suez Basin Monitor. (Iris21 ID: 410900); IHS Energy: Englewood, CO, USA, 2006. [Google Scholar]
- Khalil, B.J.; Meshref, W.M. Hydrocarbon occurrences and structural style of the southern Gulf of Suez rift basin. In Proceedings of the 9th Exploration and Production Conference, Cairo, Egypt, 8–22 November 1988; Egyptian General Petroleum Corporation: Cairo, Egypt, 1988. [Google Scholar]
- Dolson, C.J.; Shaan, V.M.; Matbouly, S.; Harwood, C.; Rashed, R.; Hammouda, H. The petroleum potential of Egypt. In Petroleum Proviences of the Twenty-First Century; Downey, W.M., Threet, C.J., Morgan, A.W., Eds.; AAPG Memoir: Tulsa, OK, USA, 2001; Volume 74, pp. 453–482. [Google Scholar]
- Farouk, S.; Fagelnour, M.; Zaky, A.S.; Arafat, M.; Salama, A.; Al-Kahtany, K.; Gentzis, T.; Jovane, L. Petroleum System Evaluation: Hydrocarbon Potential and Basin Dynamics in Abu Darag Sub-Basin, Northern Gulf of Suez (Egypt). Minerals 2024, 14, 1154. [Google Scholar] [CrossRef]
- Fahmi, A.; Attia, A.; El-Tokhy, M.; Saber, S.; Madkour, A. Enhance oil recovery by discovering a new potential hydrocarbon from the unconventional reservoir in Abu Rudeis/Sidri Field, Gulf of Suez-Egypt. In Proceedings of the Offshore Mediterranean Conference and Exhibition, OMC 2015, 2015: Offshore Mediterranean Conference, Ravena, Italy, 25–27 March 2015. [Google Scholar]
- Elhussein, M.; Barakat, M.K.; Alexakis, D.E.; Alarifi, N.; Mohamed, E.S.; Kucher, D.E.; Shokr, M.S.; Youssef, M.A. Aeromagnetic Data Analysis for Sustainable Structural Mapping of the Missiakat Al Jukh Area in the Central Eastern Desert: Enhancing Resource Exploration with Minimal Environmental Impact. Sustainability 2024, 16, 8764. [Google Scholar] [CrossRef]
- Zahra, S.H.; Nakhla, A. Deducing the subsurface geological conditions and structural framework of the NE Gulf of Suez area, using 2D and 3D seismic data. NRIAG J. Astron. Geophys. 2015, 4, 64–85. [Google Scholar] [CrossRef]
- Zahra, S.H.; Nakhla, A. Structural interpretation of seismic data of Abu Rudeis-Sidri area, northern Central Gulf of Suez, Egypt. NRIAG J. Astron. Geophys. 2016, 5, 435–450. [Google Scholar] [CrossRef]
- Reda, M.; Mostafa, T.; Raef, A.; Fathy, M.; Alshehri, F.; Ahmed, M. Hydrocarbon Reservoir Characterization in the Challenging Structural Setting of Southern Gulf of Suez: Synergistic Approach of Well Log Analyses and 2D Seismic Data Interpretation. Preprint 2024. Available online: https://www.preprints.org/manuscript/202401.0529/v1 (accessed on 10 July 2024).
- Plaziat, J.C.; Montenat, C.; Barrier, P.; Janin, M.-C.; Orszag-Sperber, F.; Philobbos, E. Stratigraphy of the Egyptian syn-rift deposits: Correlations between axial and peripheral sequences of the north-western Red Sea and Gulf of Suez and their relations with tectonics and eustacy. In Sedimentation and Tectonics in Rift Basins Red Sea: -Gulf of Aden; Purser, B.H., Bosence, D.W.J., Eds.; Springer: Berlin, Germany, 1998; pp. 211–222. [Google Scholar] [CrossRef]
- Haddad, A.; El Aissaoui, D.M.; Soliman, M.A. Mixed carbonate-siliciclastic sedimentation on a Miocene Fault block, Gulf of Suez, Egypt. Sed. Geol. 1984, 27, 183–202. [Google Scholar] [CrossRef]
- Hughes, G.W.; Abdine, S.; Girgis, M.H. Miocene biofacies development and geological history of the Gulf of Suez, Egypt. J. Mar. Pet. Geol. 1992, 9, 2–28. [Google Scholar] [CrossRef]
- Mcclay, K.R.; Nichols, G.; Khalil, S.M.; Darwish, M.; Bosworth, W. Extensional tectonics and sedimentation, eastern Gulf of Suez. In Sedimentation and Tectonics of Rift Basins: Red Sea-Gulf of Aden; Purser, B.H., Bosence, D.W.J., Eds.; Chapman and Hall: London, UK, 1998; pp. 223–238. [Google Scholar]
- Young, M.J.; Gawthorpe, R.L.; Sharp, I.R. Architecture and evolution of syn-rift clastic depositional systems towards the tip of a major fault segment, Suez rift, Egypt. Basin Res. 2002, 14, 1–23. [Google Scholar] [CrossRef]
- Younis, M. The oil occurrence and hydrocarbon potentialities of the Pre-Upper Cretaceous subsurface rocks of the Gulf of Suez. Ph.D. Thesis, Alexandria University, Alexandria, Egypt, 1991; 222p. [Google Scholar]
- Hassouba, M.; Shafy, A.; Mohamed, A. Nezzazat Group reservoir geometry and rock types in the October Field area, Gulf of Suez. In Proceedings of the 11th Egyptian General Petroleum Corporation Petroleum Exploration and Production Conference (EGPC), Cairo, Egypt, 7–10 November 1992; pp. 298–317. [Google Scholar]
- Zico, A. Late Cretaceous-early Tertiary stratigraphy of the Thermal area, East Central Egypt. Neues Jahrb. Geol. Paleont. 1993, 3, 135–149. [Google Scholar] [CrossRef]
- Steckler, M.S.; Berthlot, F.; Lyberis, N.; Le Pichon, X. Subsidence in the Gulf of Suez: Implications for rifting and plate kinematics. Tectonophysics 1988, 153, 249–270. [Google Scholar] [CrossRef]
- Abdine, S.; Homossani, A.; Lelek, J. October Field: The latest giant under development in the Gulf of Suez. In International Conference on Geology of the Arab World; Cairo University: Giza, Egypt, 1992; pp. 61–86. [Google Scholar]
- Daggett, P.H.; Morgan, P.; Boulos, F.K.; Hennins, F.; El-Sherif, A.A.; El-Sayed, A.A.; Basta, N.Z.; Melek, Y.S. Seismicity and active tectonics on the Egyptian Red Sea margin and northern Read Sea. Tectonophysics 1986, 125, 313–324. [Google Scholar] [CrossRef]
- Steckler, M.S. Uplift and extension in the Gulf of Suez, indications of induced mantle convection. Nature 1985, 317, 135–139. [Google Scholar] [CrossRef]
- Knot, S.D.; Beach, A.; Welbourn, A.I.; Brockbank, P.J. Basin inversion in the Gulf of Suez: Implications for exploration and development in failed rift sequences. In Basin Inversion; Buchannan, J.G., Buchannan, P.G., Eds.; Geological Society London Special Publications: London, UK, 1994; Volume 88, pp. 59–81. [Google Scholar] [CrossRef]
- Alsharhan, A.S.; Salah, M.G. Lithostratigraphy, sedimentology and hydrocarbon habitat of the pre-Cenomanian Nubian Sandstone in the Gulf of Suez Oil Province, Egypt. GeoArabia 1997, 2, 385–400. [Google Scholar] [CrossRef]
- Mostafa, A.R. Organic Geochemistry of Source Rocks and Related Crude Oils in the Gulf of Suez area, Egypt. Berl. Geowiss. Abh. 1993, A147, 163. [Google Scholar]
- Schutz, K.I. Structure and stratigraphy of the Gulf of Suez, Egypt. In Interior Rift Basins; London, M.S., Ed.; AAPG Memoir: Tulsa, OK, USA, 1994; Volume 59, pp. 57–96. [Google Scholar] [CrossRef]
- Al-Atta, M.A.; Issa, G.I.; Ahmed, M.A.; Afife, M.M. Source rock evaluation and organic geochemistry of Belayim marine oil field, Gulf of Suez, Egypt. Egypt. J. Pet. 2014, 23, 285–302. [Google Scholar] [CrossRef]
- Smale, J.L.R.; Thunell, C.; Schamel, S. Sedimentologic evidence for early Miocene fault reactivation in the Gulf of Suez. Geology 1988, 16, 113–116. [Google Scholar] [CrossRef]
- EGPC. Miocene rock stratigraphy of Egypt. Egypt. J. Geol. 1974, 18, 1–59. [Google Scholar]
- Waples, W. Modern approaches in source-rock evaluation. In Hydrocarbon Source Rocks of the Greater Rocky Mountain Region; Woodward, J., Meissner, F., Clayston, L., Eds.; (IHRD) International Human Resources Development Corporation: Denver, CO, USA, 1984; pp. 35–50. [Google Scholar]
- El Atfy, H.; Ghassal, B.I.; Littke, R. Petroleum Source Rocks of Egypt: An Integrated Spatio-Temporal Palynological and Organic Geochemical Studies Within the Phanerozoic. In The Phanerozoic Geology and Natural Resources of Egypt; Hamimi, Z., Khozyem, H., Adatte, T., Nader, F.H., Oboh-Ikuenobe, F., Zobaa, M.K., El Atfy, H., Eds.; Advances in Science, Technology & Innovation; Springer International Publishing: Cham, Switzerland, 2023; pp. 649–6743. [Google Scholar] [CrossRef]
- Abdel-Fattah, M.I.; Reda, M.; Fathy, M.; Saadawi, D.A.; Alshehri, F.; Ahmed, M.S. Oil-source correlation and Paleozoic source rock analysis in the Siwa Basin, Western Desert: Insights from well-logs, Rock-Eval pyrolysis, and biomarker data. Energy Geosci. 2024, 5, 100298. [Google Scholar] [CrossRef]
- Chen, J.-Q.; Jiang, F.-J.; Pang, X.-Q.; Yang, H.-J.; Shi, K.-Y.; Pang, B.; Pang, H.; Chen, J.-F.; Chen, Z.-H.; Zhang, X.-G. Characteristics and Origin of Low-Organic-Matter Carbonate Source Rocks in the Middle-Upper Ordovician, Tarim Basin, Northwestern China. J. Palaeogeogr. 2024, 13, 594–619. [Google Scholar] [CrossRef]
- Mamdouh, M.; Reda, M.; Zein El Din, M.Y.; Abdelhafeez, T.H. 3D petroleum reservoir modelling using seismic and well-log data to assess hydrocarbon potential in Abu Roash (G) Member, Karama Oil Field, North? Western Desert, Egypt. Geol. J. 2023, 59, 313–324. [Google Scholar] [CrossRef]
- Farouk, S.; Saada, S.A.; Fagelnour, M.; Tawfik, A.Y.; Arafat, M.; El-Kahtany, K. Geochemical evaluation and basin modelling of the Cretaceous succession in the Azhar Oil field, West Beni Suef Basin, Egypt. Geol. J. 2024, 59, 1949–1967. [Google Scholar] [CrossRef]
- Manga, W.G.O.; Hatcherian, J.J.; Hackley, P.C.; Bessong, M.; Bapowa, C.L.; Pougue, H.E.; Meying, A. Novel Insights about Petroleum Systems from Source and Reservoir Rock Characterization, Cretaceous Deposits, Babouri-Figuil Basin, Northern Cameroon. Int. J. Coal Geol. 2024, 285, 104491. [Google Scholar] [CrossRef]
- Ghassal, B.I.; Littke, R.; El Atfy, H.; Sindern, S.; Scholtysik, G.; El Beialy, S.; El Khoriby, E. Source rock potential and depositional environment of Upper Cretaceous sedimentary rocks, Abu Gharadig Basin, Western Desert, Egypt: An integrated palynological, organic and inorganic geochemical study. Int. J. Coal Geol. 2018, 186, 14–40. [Google Scholar] [CrossRef]
- Horner, D.R. Pressure build-up in wells. In Proceedings of the Third World Petroleum Congress, The Hague, The Netherlands, 28 May–6 June 1951; Section II. pp. 503–523. [Google Scholar]
- Pepper, S.A.; Corvi, J.P. Simple kinetic models of petroleum formation. Part I: Oil and gas generation from kerogen. Mar. Pet. Geol. 1995, 12, 291–319. [Google Scholar] [CrossRef]
- Passey, Q.R.; Bohacs, K.M.; Esch, W.L.; Klimentidis, R.; Sinha, S. A practical model for organic richness from porosity and resistivity logs. AAPG Bull. 1990, 74, 1777–1794. [Google Scholar] [CrossRef]
- Shalaby, M.R.; Hakimi, M.H.; Abdullah, W.H. Petroleum system analysis of the Khatatba formation in the Shoushan basin, north western desert, Egypt. Arab. J. Geosci. 2014, 7, 4303–4320. [Google Scholar] [CrossRef]
- Hakimi, M.H.; Alaug, A.S.; Kahal, A.Y.; Rahim, A.; Radwan, A.E.; Qadri, S.M.T.; Khan, W. Organic Matter Characteristics and Gas Generation Prospect of the Late Cretaceous Fluvial Deltaic Organic-rich Shale in the Offshore JIZA-QAMAR Basin, Yemen based on Organic Geochemical, Macerals Composition, and Biomarker Results Combined with 1-D Basin Modelling. Geol. J. 2023, 58, 4035–4056. [Google Scholar]
- Cheng, M.; Li, C.; Yin, J.; Wang, P.; Hu, C.; Yu, Y.; Lei, Y.; Zhang, L. Modeling of Burial History, Source Rock Maturity, and Hydrocarbon Generation of Marine-Continental Transitional Shale of the Permian Shanxi Formation, Southeastern Ordos Basin. ACS Omega 2024, 9, 20532–20546. [Google Scholar] [CrossRef]
- Broichhausen, H. Mudstone Compaction and Overpressure Calculation in a 3D Petroleum Systems Analysis Tool: Development of the Software and Application to the North Sea. Ph.D. Thesis, Institute of Geology and Geophysics of Petroleum and Coal, RWTH-Aachen University, Aachen, Germany, 2004; 233p. [Google Scholar]
- Hantschel, T.; Kauerauf, I.A. Fundamentals of Basin and Petroleum Systems Modeling; Springer: Berlin, Germany, 2009; 476p. [Google Scholar] [CrossRef]
- Wygrala, B.P. Integrated Study of an Oil Field in the Southern Po Basin, Northern Italy. Ph.D. Thesis, University of Köln, Cologne, Germany, 1989; 217p. [Google Scholar]
- Jarvis, G.T.; McKenzie, D.P. Sedimentary basin formation with finite extension rates. Rev. Earth Planet. Sci. Lett. 1980, 48, 42–52. [Google Scholar] [CrossRef]
- Moawad, S.K.; Baghdady, A.R.; Moustafa, A.R.; Helmy, H.M.; El-Hadidy, S.M. Structural control on basin architecture and hydrocarbon play types of the Miocene carbonate reservoirs, southern Gulf of Suez rift, Egypt. Mar. Pet. Geol. 2025, 177, 107365. [Google Scholar] [CrossRef]
- El-Gendy, N.H.; Mabrouk, W.M.; Waziry, M.A.; Dodd, T.J.; Abdalla, F.A.; Alexakis, D.E.; Barakat, M.K. An Integrated Approach for Saturation Modeling Using Hydraulic Flow Units: Examples from the Upper Messinian Reservoir. Water 2023, 15, 4204. [Google Scholar] [CrossRef]
- Othman, A.; Ahmed, A.M.; Korrat, I.; Sherief, R.M. Thermal maturity evaluation and hydrocarbon generation of carbonate organic rich intervals of Sudr formation, Shoab Ali oilfield, Gulf of Suez, Egypt. J. Environ. Sci. 2013, 42, 569–605. [Google Scholar]
- Bi, J.; Zhou, P.; Xiao, X.; Zhang, Y.; Kou, H.; Tang, T.; Chen, L. General impurity gas blanket effect mechanism and elimination strategies for hydrogen storage materials. Chem. Eng. J. 2024, 481, 148517. [Google Scholar] [CrossRef]
- Sweeney, J.J.; Burnham, A.K. Evaluation of a Simple Model of Vitrinite Reflectance Based on Chemical Kinetics. AAPG Bull. 1990, 74, 1559–1570. [Google Scholar] [CrossRef]
- Khavari-Khorasani, G.; Dolson, C.J.; Michelsen, J.K. The factors controlling the abundance and migration of heavy versus light oils, as constrained by data from the Gulf of Suez. Part I. The effect of expelled petroleum composition, PVT properties and petroleum system geometry. Org. Geochem. 1998, 29, 255–282. [Google Scholar] [CrossRef]
- Meshref, W.M.; Abu El Karamat, M.S.; El Gindi, M.K. Exploration concepts for oil in the Gulf of Suez. In Proceedings of the 9th Exploration and Production Conference, Cairo, Egypt, 8–11 November 1988; Egyptian General Petroleum Corporation: Cairo, Egypt, 1988; Volume 1, pp. 1–23. [Google Scholar]
- El Ayouty, M.K. Petroleum geology. In Geology of Egypt; Said, R., Ed.; Balkema: Rotterdam, The Netherlands, 1990; pp. 567–599. [Google Scholar]
- Poelchau, H.S.; Baker, D.R.; Hantschel, T.; Horsfield, B.; Wygrala, B.P. Basin simulation and the design of the conceptual basin model. In Petroleum and Basin Evolution; Welte, D.H., Horsfield, B., Baker, D.R., Eds.; Springer: Berlin, Germany, 1997; pp. 3–70. [Google Scholar] [CrossRef]
- Selley, C.R. Applied Sedimentology, 2nd ed.; Academic Press: San Diego, CA, USA, 2000. [Google Scholar] [CrossRef]
- Elhossainy, M.M.; El-Shafeiy, M.; Al-Areeq, N.M.; Hamdy, D. Petroleum Generation Modelling of the Middle-Late Cretaceous Sediments in the Abu Gharadig Field, Northwestern Desert, Egypt. Geol. J. 2022, 57, 3851–3880. [Google Scholar] [CrossRef]
- Peters, K.E.; Cassa, M.R. Applied Source Rock Geochemistry: Chapter 5: Part II. Essential Elements. In The Petroleum System from Source to Trap; Magoon, L.B., Dow, W.G., Eds.; AAPG Memoir: Tulsa, OK, USA, 1994; Volume 60, pp. 93–120. [Google Scholar] [CrossRef]
- Tissot, B.P.; Welte, D.H. Petroleum Formation and Occurrence; Springer Science & Business Media: Berlin/Heidelberg, Germany, 2013. [Google Scholar]
- Jackson, K.S.; Hawkins, P.J.; Bennett, A.J.R. Regional facies and geochemical, evaluation of southern Denison Trough. J. Aust. Petrol. Prod. Explor. Assoc. (APPEA) 1985, 20, 143–158. [Google Scholar] [CrossRef]
- Huo, Z.; Pang, X.; Chen, J.; Zhang, J.; Song, M.; Guo, K.; Li, P.; Li, W.; Liang, Y. Carbonate Source Rock with Low Total Organic Carbon Content and High Maturity as Effective Source Rock in China: A Review. J. Asian Earth Sci. 2019, 176, 8–26. [Google Scholar] [CrossRef]
- Dahl, B.; Bojesen-Koefoed, J.; Holm, A.; Justwan, H.; Rasmussen, E.; Thomsen, E.A. New Approach to Interpreting Rock-Eval S2 and TOC Data for Kerogen Quality Assessment. Org. Geochem. 2004, 35, 1461–1477. [Google Scholar] [CrossRef]
- Hamdy, D.; Farouk, S.; Qteishat, A.; Ahmad, F.; Al-Kahtany, K.; Gentzis, T.; Luigi, J.; Zaky, A.S. Source Rock Assessment of the Permian to Jurassic Strata in the Northern Highlands, Northwestern Jordan: Insights from Organic Geochemistry and 1D Basin Modeling. Minerals 2024, 14, 863. [Google Scholar] [CrossRef]
- Hunt, J.H. Petroleum Geochemistry and Geology; W. H. Freeman: New York, NY, USA, 1995; 743p, Available online: https://drive.google.com/file/d/11ZEpTHywGIYPPyhJC1sSQnLf50iuQ5CJ/view?usp=drive_link (accessed on 20 May 2025).
- Peters, K.E.; Moldowan, J.M.; Schoell, M.; Hempkins, W.B. Petroleum isotopic and biomarker composition related to source rock organic matter and depositional environment. Org. Geochem. 1986, 10, 17–27. [Google Scholar] [CrossRef]
- Baskin, D.K. Atomic H/C ratio of kerogen as an estimate of thermal maturity and organic matter conversion. AAPG Bull. 1997, 81, 1437–1450. [Google Scholar] [CrossRef]
- Carvajal-Ortiz, H.; Gentzis, T. Critical considerations when assessing hydrocarbon plays using Rock-Eval pyrolysis and organic petrology data: Data quality revisited. Int. J. Coal Geol. 2015, 152, 113–122. [Google Scholar] [CrossRef]
- Makeen, Y.M.; Hakimi, M.H.; Abdullah, W.H.; Mustapha, K.A.; Hassan, M.H.A.; Shushan, I.E.; Garba, T.E.; Abujaish, Y.A.; Lashin, A.A. Basin Modelling and Bulk Kinetics of Heterogeneous Organic-Rich Nyalau Formation Sediments of the Sarawak Basin, Malaysia. J. Pet. Sci. Eng. 2020, 195, 107595. [Google Scholar] [CrossRef]
- Al-Hajeri, M.; Sauerer, B.; Furmann, A.; Amer, A.; Al-Khamiss, A.; Abdallah, W. Organic Petrography and Geochemistry of the Prolific Source Rocks from the Jurassic Najmah and Cretaceous Makhul Formations in Kuwait-Validation and Expansion of Raman Spectroscopic Thermal Maturity Applications. Int. J. Coal Geol. 2021, 236, 103654. [Google Scholar] [CrossRef]
- Espitalie, J.; Madec, M.; Tissot, B.; Mennig, J.J.; Leplat, P. Source rock characterization method for petroleum exploration. In Proceedings of the Offshore Technology Conference, Houston, TX, USA, 2 May 1977. [Google Scholar] [CrossRef]
- Dembicki, H. Three common source rock evaluation errors made by geologists during prospect or play appraisals. AAPG Bull. 2009, 93, 341–356. [Google Scholar] [CrossRef]
- Malki, M.L.; Rasouli, V.; Mehana, M.; Mellal, I.; Saberi, M.R.; Sennaoui, B.; Chellal, H.A. The Impact of Thermal Maturity on the Organic-Rich Shales Properties: A Case Study in Bakken. In Proceedings of the SPE/AAPG/SEG Unconventional Resources Technology Conference (URTEC), Denver, CO, USA, 13–15 June 2023; p. D031S054R003. [Google Scholar] [CrossRef]
- Lotfy, N.M.; Farouk, S.; Hakimi, M.H.; Ahmad, F.; El Shennawy, T.; El Nady, M.M.; Salama, A.; Shehata, A. Biomarker and Isotopic Characteristics of Miocene Condensates and Natural Gases, West Delta Deep Marine Concession, Eastern Mediterranean, Egypt. Sci. Rep. 2024, 14, 235. [Google Scholar] [CrossRef]

| Well Name | Depth (ft) | TOC (wt%) | S1 (mg HC/g Rock) | S2 (mg HC/g Rock) | Tmax (°C) | HI (mg HC/g TOC) | OI (mg CO2/g TOC) | PI (S1/(S1 + S2)) |
|---|---|---|---|---|---|---|---|---|
| A-5 | 9200 | 0.56 | 0.12 | 0.71 | 422 | 127 | 268 | 0.14 |
| 9700 | 0.96 | 0.07 | 0.4 | 428 | 42 | 91 | 0.15 | |
| 10,450 | 0.72 | 0.1 | 0.5 | 432 | 69 | 140 | 0.17 | |
| 10,650 | 0.72 | 0.1 | 1 | 432 | 139 | 193 | 0.09 | |
| 14,050 | 1.1 | 0.04 | 0.87 | 444 | 79 | 32 | 0.04 | |
| 14,650 | 0.54 | 0.02 | 0.31 | 433 | 57 | 57 | 0.06 | |
| A-10 | 12,150 | 0.7 | 0.15 | 1.23 | 433 | 170 | - | 0.11 |
| 12,650 | 0.7 | 0.04 | 0.45 | 436 | 70 | - | 0.08 |
| Well Name | Depth (ft) | TOC (wt%) | S1 (mg HC/g Rock) | S2 (mg HC/g Rock) | Tmax (°C) | HI (mg HC/g TOC) | OI (mg CO2/g TOC) | PI (S1/(S1 + S2)) |
|---|---|---|---|---|---|---|---|---|
| A-3 | 5010 | 0.68 | 0.07 | 0.82 | 424 | 121 | 453 | 0.08 |
| 5170 | 0.45 | 0.07 | 0.62 | 425 | 138 | 496 | 0.1 | |
| A-9 | 6550 | 1.21 | 0.28 | 4.12 | 428 | 340 | 95 | 0.06 |
| 6600 | 1.01 | 0.32 | 4.17 | 438 | 413 | 110 | 0.07 | |
| 6650 | 1.08 | 0.22 | 3.65 | 432 | 338 | 91 | 0.06 | |
| 6700 | 1.28 | 0.33 | 5.59 | 426 | 437 | 85 | 0.06 | |
| 6750 | 1.28 | 0.26 | 6 | 422 | 469 | 97 | 0.04 | |
| 6800 | 1.15 | 0.35 | 5.69 | 425 | 495 | 159 | 0.06 | |
| 6850 | 1.12 | 0.51 | 5.24 | 427 | 468 | 155 | 0.09 | |
| 6900 | 1.1 | 0.31 | 4.41 | 424 | 401 | 139 | 0.07 | |
| 6950 | 0.55 | 0.29 | 2.8 | 442 | 509 | 247 | 0.09 | |
| 7000 | 1.18 | 0.21 | 2.23 | 431 | 189 | 91 | 0.09 | |
| 7050 | 0.92 | 0.21 | 4.55 | 435 | 495 | 115 | 0.04 | |
| 7100 | 0.49 | 0.29 | 2.21 | 438 | 451 | 171 | 0.12 | |
| 7150 | 0.7 | 0.43 | 3.07 | 435 | 439 | 137 | 0.12 | |
| 7200 | 0.51 | 0.96 | 2.7 | 446 | 529 | 188 | 0.26 | |
| A-2 | 9380 | 1.3 | 0.14 | 1.4 | 429 | 80 | 124 | 0.12 |
| 9400 | 0.66 | 0.11 | 0.87 | 429 | 132 | 247 | 0.11 | |
| 9430 | 0.68 | 0.1 | 1.03 | 430 | 151 | 207 | 0.09 | |
| 9460 | 0.71 | 0.08 | 0.82 | 433 | 115 | 230 | 0.09 | |
| 9490 | 0.7 | 0.07 | 0.74 | 432 | 106 | 271 | 0.09 | |
| 9520 | 0.9 | 0.1 | 1.3 | 432 | 144 | 197 | 0.07 | |
| 9550 | 0.93 | 0.13 | 1.88 | 430 | 202 | 217 | 0.06 | |
| 9580 | 0.8 | 0.11 | 1.52 | 434 | 190 | 201 | 0.07 | |
| 9610 | 0.51 | 0.07 | 0.67 | 430 | 131 | 161 | 0.09 | |
| 9640 | 0.7 | 0.13 | 1.5 | 429 | 214 | 189 | 0.08 | |
| 9670 | 0.55 | 0.16 | 1.48 | 430 | 269 | 253 | 0.1 | |
| 9700 | 0.6 | 0.14 | 1.05 | 428 | 175 | 182 | 0.12 |
| Well Name | Depth (ft) | Vitrinite (%Ro) |
|---|---|---|
| A-5 | 9200 | 1.03 |
| 9700 | 1.08 | |
| 10,450 | 0.95 | |
| 10,650 | 0.46 | |
| 11,250 | 1.06 | |
| 11,900 | 0.93 | |
| 12,700 | 0.57 | |
| 12,900 | 0.59 | |
| 13,550 | 0.66 | |
| 13,650 | 0.61 | |
| 14,050 | 0.96 | |
| 14,650 | 1.62 | |
| 16,100 | 1.75 | |
| 16,600 | 1.35 |
| Well Name | Depth (ft) | BHT (°F) |
|---|---|---|
| A-5 | 5222 | 140 |
| 11,085 | 200 | |
| 13,566 | 256 | |
| 15,575 | 270 | |
| 16,392 | 321 | |
| 16,517 | 328 | |
| 16,740 | 330 |
Disclaimer/Publisher’s Note: The statements, opinions and data contained in all publications are solely those of the individual author(s) and contributor(s) and not of MDPI and/or the editor(s). MDPI and/or the editor(s) disclaim responsibility for any injury to people or property resulting from any ideas, methods, instructions or products referred to in the content. |
© 2025 by the authors. Licensee MDPI, Basel, Switzerland. This article is an open access article distributed under the terms and conditions of the Creative Commons Attribution (CC BY) license (https://creativecommons.org/licenses/by/4.0/).
Share and Cite
Barakat, M.; Reda, M.; Gamvroula, D.E.; Ondrak, R.; Alexakis, D.E. Investigating Attributes of Oil Source Rocks by Combining Geochemical Approaches and Basin Modelling (Central Gulf of Suez, Egypt). Resources 2025, 14, 114. https://doi.org/10.3390/resources14070114
Barakat M, Reda M, Gamvroula DE, Ondrak R, Alexakis DE. Investigating Attributes of Oil Source Rocks by Combining Geochemical Approaches and Basin Modelling (Central Gulf of Suez, Egypt). Resources. 2025; 14(7):114. https://doi.org/10.3390/resources14070114
Chicago/Turabian StyleBarakat, Moataz, Mohamed Reda, Dimitra E. Gamvroula, Robert Ondrak, and Dimitrios E. Alexakis. 2025. "Investigating Attributes of Oil Source Rocks by Combining Geochemical Approaches and Basin Modelling (Central Gulf of Suez, Egypt)" Resources 14, no. 7: 114. https://doi.org/10.3390/resources14070114
APA StyleBarakat, M., Reda, M., Gamvroula, D. E., Ondrak, R., & Alexakis, D. E. (2025). Investigating Attributes of Oil Source Rocks by Combining Geochemical Approaches and Basin Modelling (Central Gulf of Suez, Egypt). Resources, 14(7), 114. https://doi.org/10.3390/resources14070114