Article

Carbon, Water, and Light Use Efficiency Under Conservation Practice on Sloped Arable Land

1
Institute of Soil Science, Agrotechnologies and Plant Protection “Nikola Poushkarov”, Agricultural Academy, 1331 Sofia, Bulgaria
2
Department of Agricultural Machinery, Agrarian and Industrial Faculty, University of Ruse “Angel Kanchev”, 7017 Ruse, Bulgaria
3
Department of Heat, Hydraulics and Environmental Engineering, Agrarian and Industrial Faculty, University of Ruse “Angel Kanchev”, 7017 Ruse, Bulgaria
4
National Research—Development Institute for Machines and Installations Designed to Agriculture and Food Industry, 013813 Bucharest, Romania
5
Department of Plant Protection, Botany and Zoology, Faculty of Natural Sciences, Konstantin Preslavsky University of Shumen, 9700 Shumen, Bulgaria
*
Author to whom correspondence should be addressed.
Resources 2025, 14(6), 87; https://doi.org/10.3390/resources14060087
Submission received: 21 March 2025 / Revised: 16 May 2025 / Accepted: 21 May 2025 / Published: 23 May 2025

Abstract

:
Agroecosystems play a key role in the global carbon cycle, with CO2 exchange driven by photosynthesis and respiration. Indicators such as gross primary productivity (GPP), net primary productivity (NPP), and carbon, water, and light use efficiency (CUE, WUE, LUE) are essential for assessing resource use in agricultural systems. Conventional tillage depletes carbon, water, and nutrients, negatively impacting the environment, while conservation practices aim to improve soil health and biodiversity. This study evaluated the effects of a cover crop in a wheat–maize rotation on sloped arable land prone to water erosion. The experiment involved minimum contour tillage combined with cover cropping, and its impact on carbon balance components and resource use efficiency was assessed. The results demonstrated that the inclusion of a cover crop significantly improved GPP and NPP. Water and light use efficiency also increased, particularly in 2022 and 2023, which were characterized by summer drought. However, carbon use efficiency remained unchanged over the study period. These findings highlight the potential of conservation practices, such as cover cropping and reduced tillage, to enhance productivity and resource efficiency in sloped agricultural landscapes under water stress conditions.

1. Introduction

Agroecosystems cover approximately 30% of the Earth’s surface [1] and provide essential ecosystem services related to the cycling of elements, water, and carbon [2,3]. The environmental impact of these systems is largely determined by the agricultural practices employed [4]. Conventional farming techniques, although productive, are highly resource-intensive and contribute to soil degradation, loss of organic matter, compaction, erosion, and biodiversity decline.
Climate change further amplifies these issues by altering hydrological cycles, including shifts in precipitation patterns, temperature, and radiation levels [5,6,7,8,9]. These factors increase drought and erosion risks [10], with erosion being one of the main drivers of soil degradation globally [11]. Climate projections suggest intensified water erosion across various future scenarios [12].
The interconnection between carbon and water cycles is central to agroecosystem functioning [13], with plant transpiration accounting for roughly 60% of terrestrial evapotranspiration [14], second only to precipitation [15]. Meanwhile, photosynthesis is the primary flux of the carbon cycle. These processes are often modeled together through stomatal conductance, linking evapotranspiration and carbon assimilation [16,17]. Water use efficiency (WUE), defined as the biomass produced per unit of water used, serves as a key indicator of these linkages [18].
Resource use efficiency—including water, nutrients, light, and carbon—is critical in agricultural systems [19,20]. However, rising temperatures and atmospheric CO2, along with reduced water availability, increasingly challenge these efficiencies [21,22,23,24]. Some studies suggest that under certain conditions, agroecosystems can adjust to maintain or even improve resource use efficiency [25,26].
Agricultural practices have a profound impact on resource efficiency [27], and the development of integrated indicators is vital for sustainable production [28]. Conservation tillage, for instance, has shown promise in improving soil structure, yield, and WUE [29]. Carbon dynamics in agroecosystems are also heavily influenced by management strategies and local environmental conditions [30,31]. Because of this complexity, multi-year measurements across diverse landscapes are essential.
Plant production not only regulates the input of organic matter formed during the photosynthetic process into the soil but also plays a crucial role in reducing atmospheric carbon levels through sequestration. This process is a key factor in mitigating global warming [32,33]. Understanding the efficiency of resource use in agricultural systems is essential for optimizing productivity while minimizing environmental impacts.
Light use efficiency (LUE), WUE, and carbon use efficiency (CUE) are commonly analyzed at the ecosystem level, but there remains a lack of studies examining these indicators in different cropping systems, particularly in relation to conservation practices. Most of the previous research has focused on flat or less erosion-prone terrains and has emphasized yield, soil quality, and carbon sequestration outcomes. However, such settings often underestimate the compounded impact of water and soil losses found in sloped landscapes. Given the increased vulnerability of sloping terrain to erosion and runoff, understanding how cover cropping and reduced tillage affect resource use efficiencies in such settings is both timely and necessary.
This study addresses this gap by examining a wheat–maize rotation system under conservation agriculture on sloped arable land. It evaluates how cover crops and minimum tillage influence key components of the carbon balance, along with water, light, and carbon use efficiencies. In doing so, it also contrasts these findings with established results from flatter landscapes, adding a comparative dimension to the analysis. By incorporating carbon use efficiency—a less commonly addressed but equally important metric—this study offers new insights into why some conservation benefits may plateau, as seen in our results (where CUE remained unchanged). These findings have important implications for sustainable land management, particularly in erosion-prone environments under climate stress.

2. Materials and Methods

2.1. Site Description

This experiment was conducted under rainfed conditions in a field designated for erosion control at ISSAPP Nikola Pushkarov. The experimental field is located in the Danube Plain, northern Bulgaria, on moderately eroded Calcic Chernozem [34] (with a slope of 5° (8.7%), near the village of Trastenik, Ruse District (43.478° N, 25.901° E, H = 114 m a.s.l). The topography of the area varies from flat to hilly. In the Ruse District, the largest proportion of land (48%) consists of areas with slopes ranging from 3–6° to 6–9°. The erosion rate for 91% of precipitation in the region exceeds 601 MJ mm ha−1 [35,36], indicating a high potential risk of sheet water erosion. The basic soil properties of the Epicalcic Chernozem are presented in (Table 1), including both physical (sand, silt, and clay content) and chemical characteristics (CaCO3 content and pH). Based on the particle size distribution, the soil texture is classified as silty loam (SiL) according to the USDA soil texture classification.
The climate is temperate continental, characterized by strong continental influences.

2.2. Experimental Design

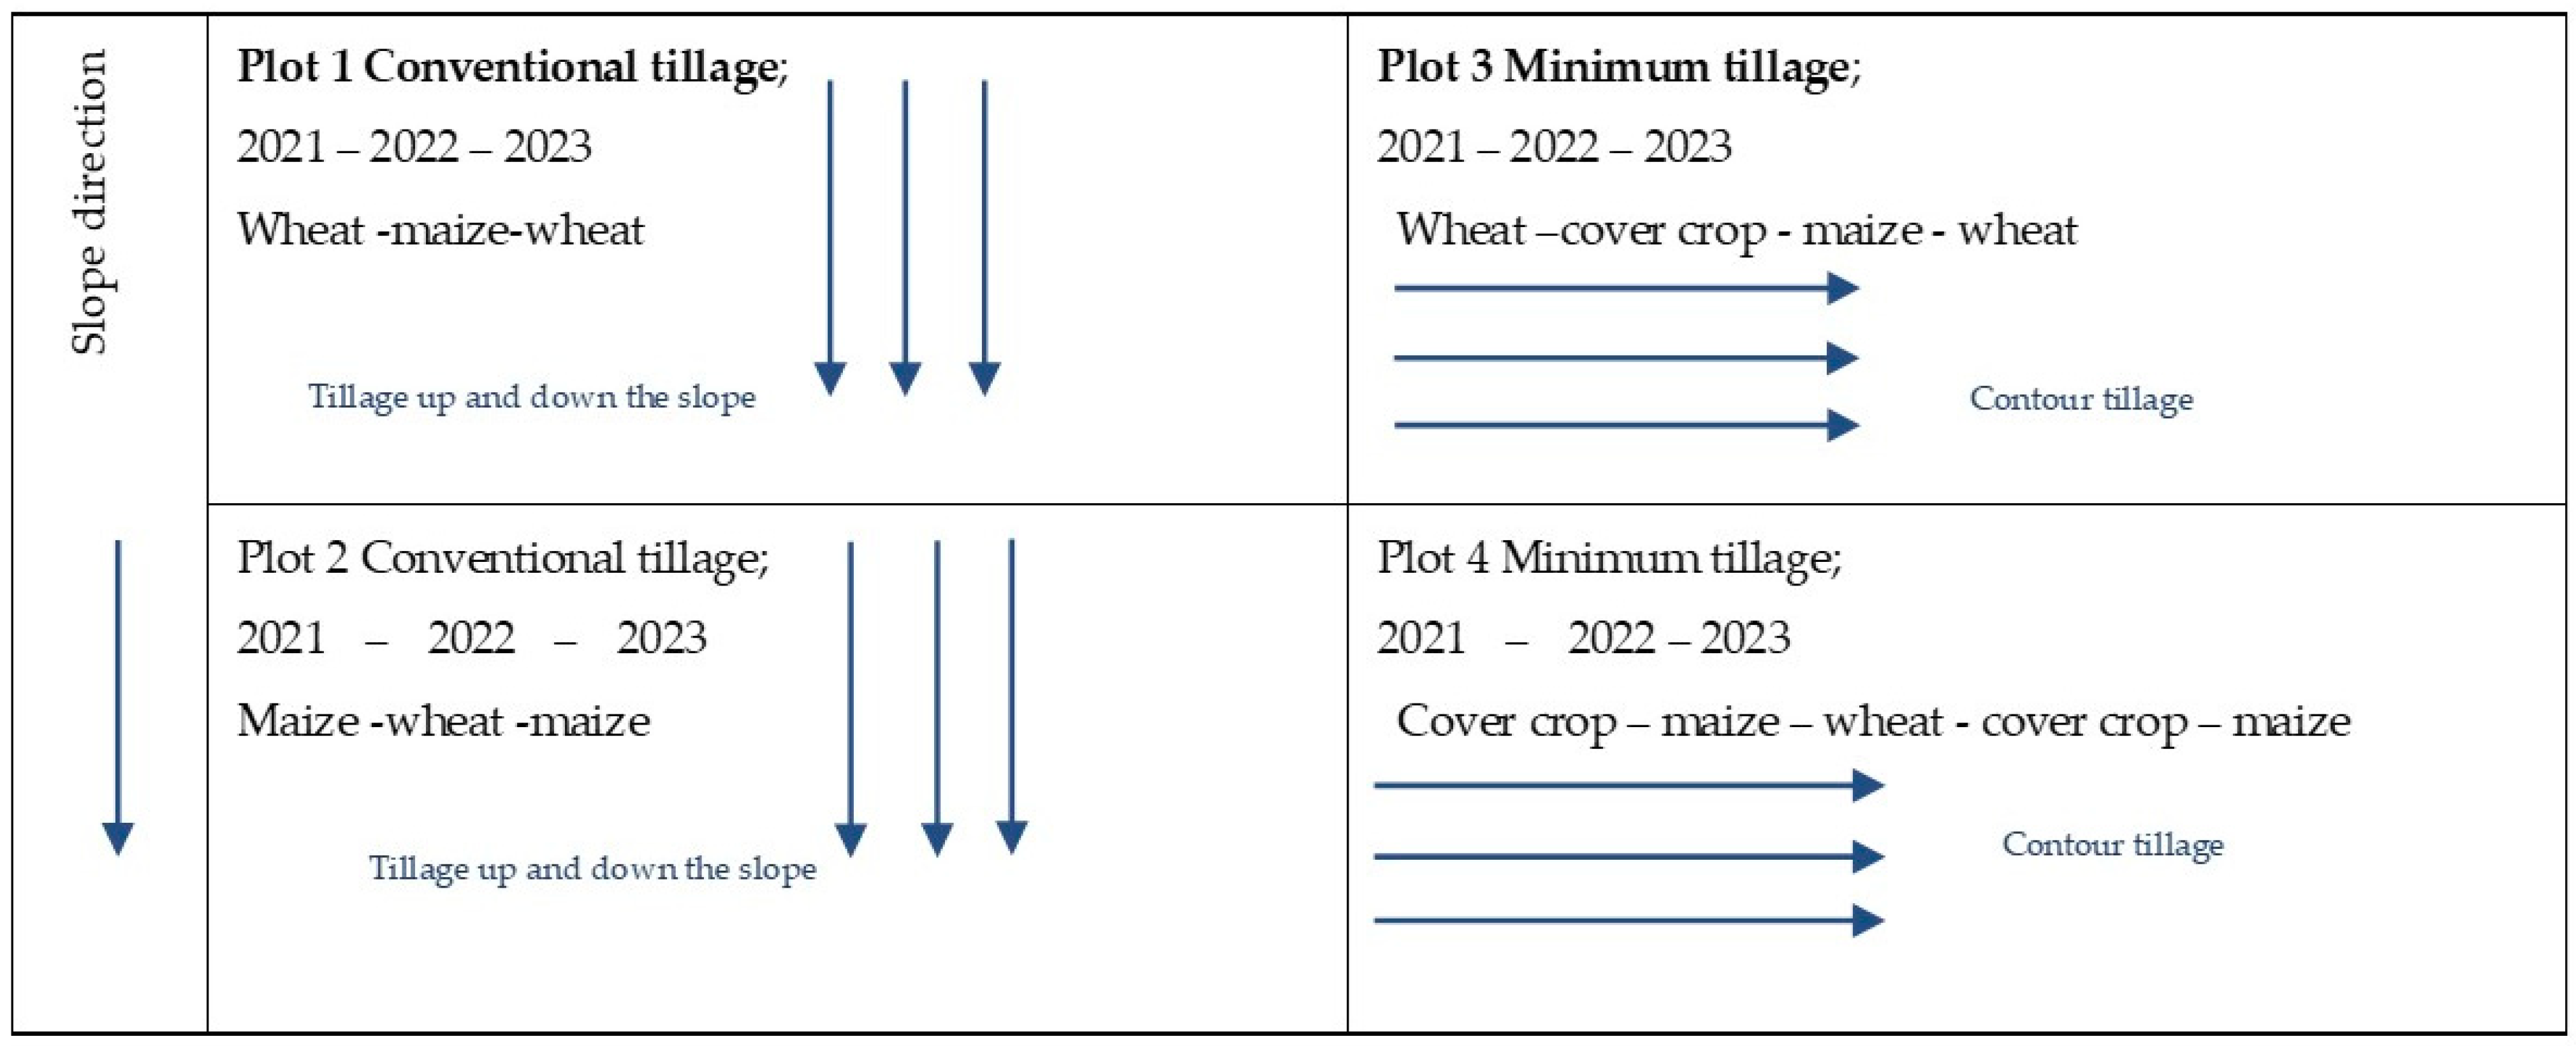
This study assessed the effects of two tillage systems within a winter wheat–maize crop rotation over three consecutive years. This experiment was conducted on field plots with a total area of 4800 m2 and consisted of four replicated treatments arranged along the slope. Each replicate included two tillage systems as follows:
  • Conventional tillage (CT)
    Wheat: three disking operations (10–12 cm depth), with the final pass at 6–8 cm, performed along the slope.
    Maize: moldboard plowing at 20–25 cm depth.
  • Minimum tillage (MT)/conservation practice
    Included a cover crop (barley) grown after wheat and before maize, incorporated as green manure.
    Tillage was performed transversely to the slope (contour tillage).
    Wheat: single disking followed by direct seeding (10–12 cm).
    Maize: cover crop sprayed with glyphosate, then disked and directly seeded.
    Shallow harrowing (6–8 cm) was conducted before cover crop establishment.
Runoff measurement plots were installed in the first replicate of each treatment to monitor water runoff and soil loss. All treatments were applied simultaneously under identical agronomic and climatic conditions.
The layout of the experimental plots, including crop rotations and tillage directions, is illustrated in Figure 1.

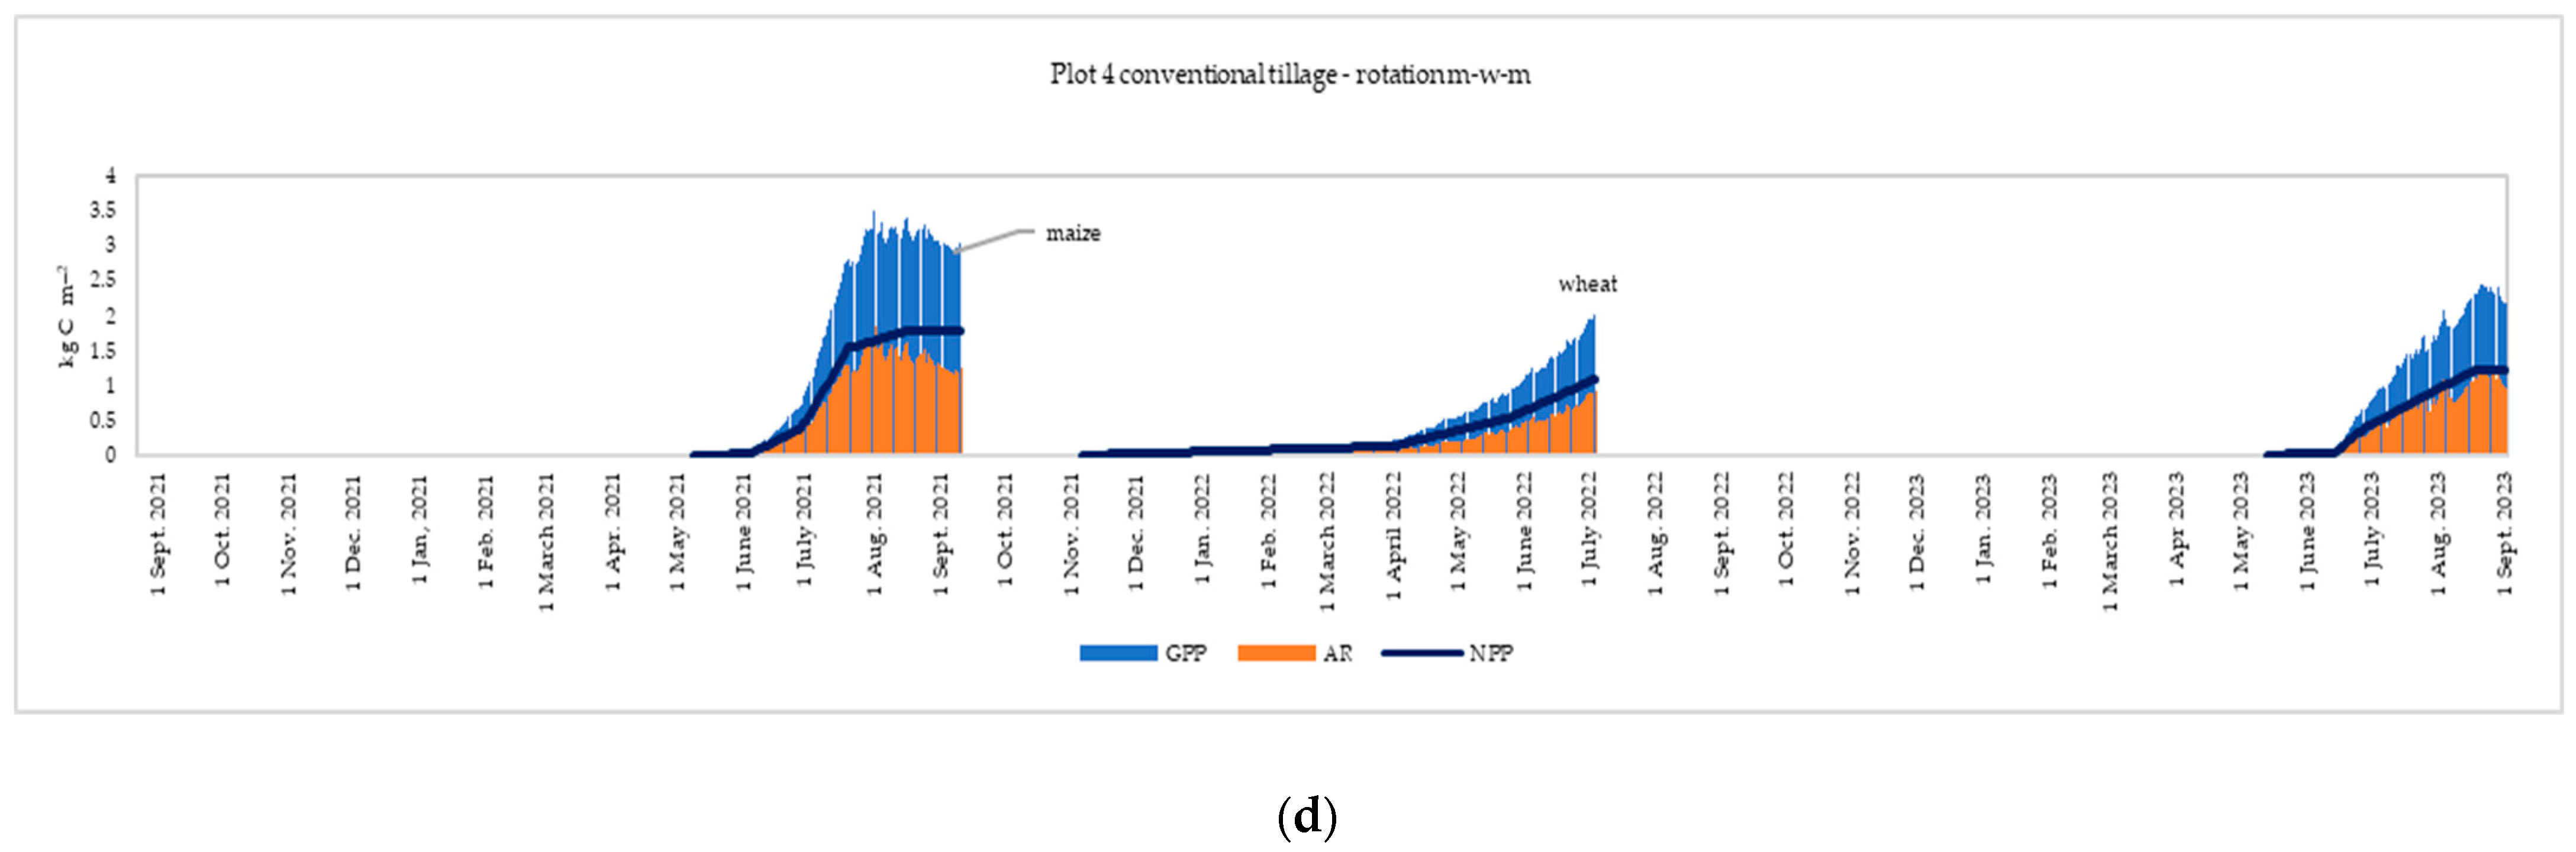
2.3. Runoff Measurements, Evapotranspiration Assessment, and Water Use Efficiency

Surface water runoff and soil erosion were measured using a stationary method with runoff sites covering an area of 40 m2 and runoff collection chambers.
Reference evapotranspiration (ETo) was calculated using the Penman–Monteith method, as described in the FAO 56 methodology [37]. The FAO 56 procedure was applied to estimate evapotranspiration based on the daily soil–water balance approach.
The components of the soil–water balance were computed daily following the methodology outlined in FAO 56. Under rainfed conditions, the depletion of soil moisture in the root zone ( r ) on day ( i ) was calculated as follows:
D r , i = D r , i 1 P R O i + D P i + E T a , i
where D r , i 1 (mm) is the soil moisture depletion on day i 1 , P (mm) is the rainfall, R O   (mm) is the run-off, D P (mm) is the deep percolation, and E T a (mm) is the actual crop evapotranspiration.

2.4. Estimation of Net Primary Productivity, Gross Primary Productivity, and Carbon Use Efficiency

For the estimation of net primary productivity (NPP) and gross primary productivity (GPP), we followed the approach described in [38] and the STICS model.
Net primary productivity (NPP) was calculated as the daily change in the total carbon content (TCC) of both the aboveground and belowground plant biomass [39]. Biomass was multiplied by the carbon content coefficient:
TCC = aboveground biomass × 0.42 + roots biomass × 0.38
Belowground NPP was derived using a constant coefficient based on shoot-to-root ratios and harvest indices. Various approaches exist, such as the method described in [38], which incorporates a root + rhizodeposition coefficient: 0.59 for maize; 1.5 for winter wheat before the maximal rate of leaf growth (end of the juvenile phase); 0.43 between the maximal rate of leaf growth and flowering; 0.33 after flowering; and 1.5 for cover crops terminated before booting. However, in this study, we applied a coefficient of 2.46, as proposed by [40].
G P P = N P P + A R
where   G P P is gross primary productivity (kg C m−2),   N P P   is net primary productivity (kg C m−2), and A R is autotrophic respiration (kg C m−2).
Autotrophic respiration (AR) was calculated following the procedure described in [38,41]:
A R = G R + M R
where G R is growth respiration and M R is maintenance respiration.
Growth respiration (GR) represents the CO2 emitted as a byproduct of growth processes. Based on the amount of glucose required to synthesize 1 g of plant material, ref. [41] proposed a coefficient of 0.28 (within the range of [0.25, 0.29]).
G R i = ( G P P i 1 M R i )     0.28
G R was calculated on day i as a function of GPP on day i − 1 [36].
Initial values GPP1 and GR1 are null, for each crop, before sowing.
M R = a N + b Q 10 T 25 10 W
A R = 0.28 G P P + 1 0.28 a N + b Q 10 T 25 10 W
where Q 10 is the temperature coefficient of respiration, equal to 2;   A R is the aboveground autotrophic respiration; a ,   b are the empirical coefficients, with values of 2.16 and −0.66, respectively; T is the temperature (°C); N is the nitrogen content of the plant tissue (%); W is the aboveground biomass (kg m−2 day−1) [38].
Carbon use efficiency was calculated as [42]:
C U E = N P P / G P P

2.5. Estimation of Water Use Efficiency

Water Use Efficiency ( W U E kg m−2 mm−1) expresses the relationship between biomass production and water consumption. In this study, WUE was calculated as the ratio between gross primary production ( G P P ) and actual evapotranspiration ( E T a ), according to Equation (9) [42]:
W U E = G P P / E T a
where G P P is the gross primary production (kg m−2), estimated based on aboveground biomass accumulation, and   E T a is the actual evapotranspiration (mm), representing the total water loss from the system through both evaporation and plant transpiration.
To estimate GPP, aboveground biomass was sampled at the beginning of each phenological stage. Biomass was collected using wooden frames of known dimensions. All vegetation within each frame was harvested, oven-dried at 105 °C until a constant weight was achieved, and weighed to determine dry matter. Three replicates were collected per sampling event to ensure accuracy.

2.6. Estimation of Light Use Efficiency

We employed the equation of Hargreaves [43] (Equation (10)) to calculate the day/night sums of total solar radiation ( R s ) :
  R s H g v s   = k R s ( T m a x T m i n ) R a
where R a is the total solar radiation in the absence of the atmosphere (MJ m−2 day−1), T m a x and T m i n are the maximum and minimum air temperatures (°C), and k R s is the empirical coefficient. The calculation was performed using the equation with an average coefficient k R s = 0.14 °C−1/2, which was obtained for the period 2010–2015 from an automatic meteorological station.
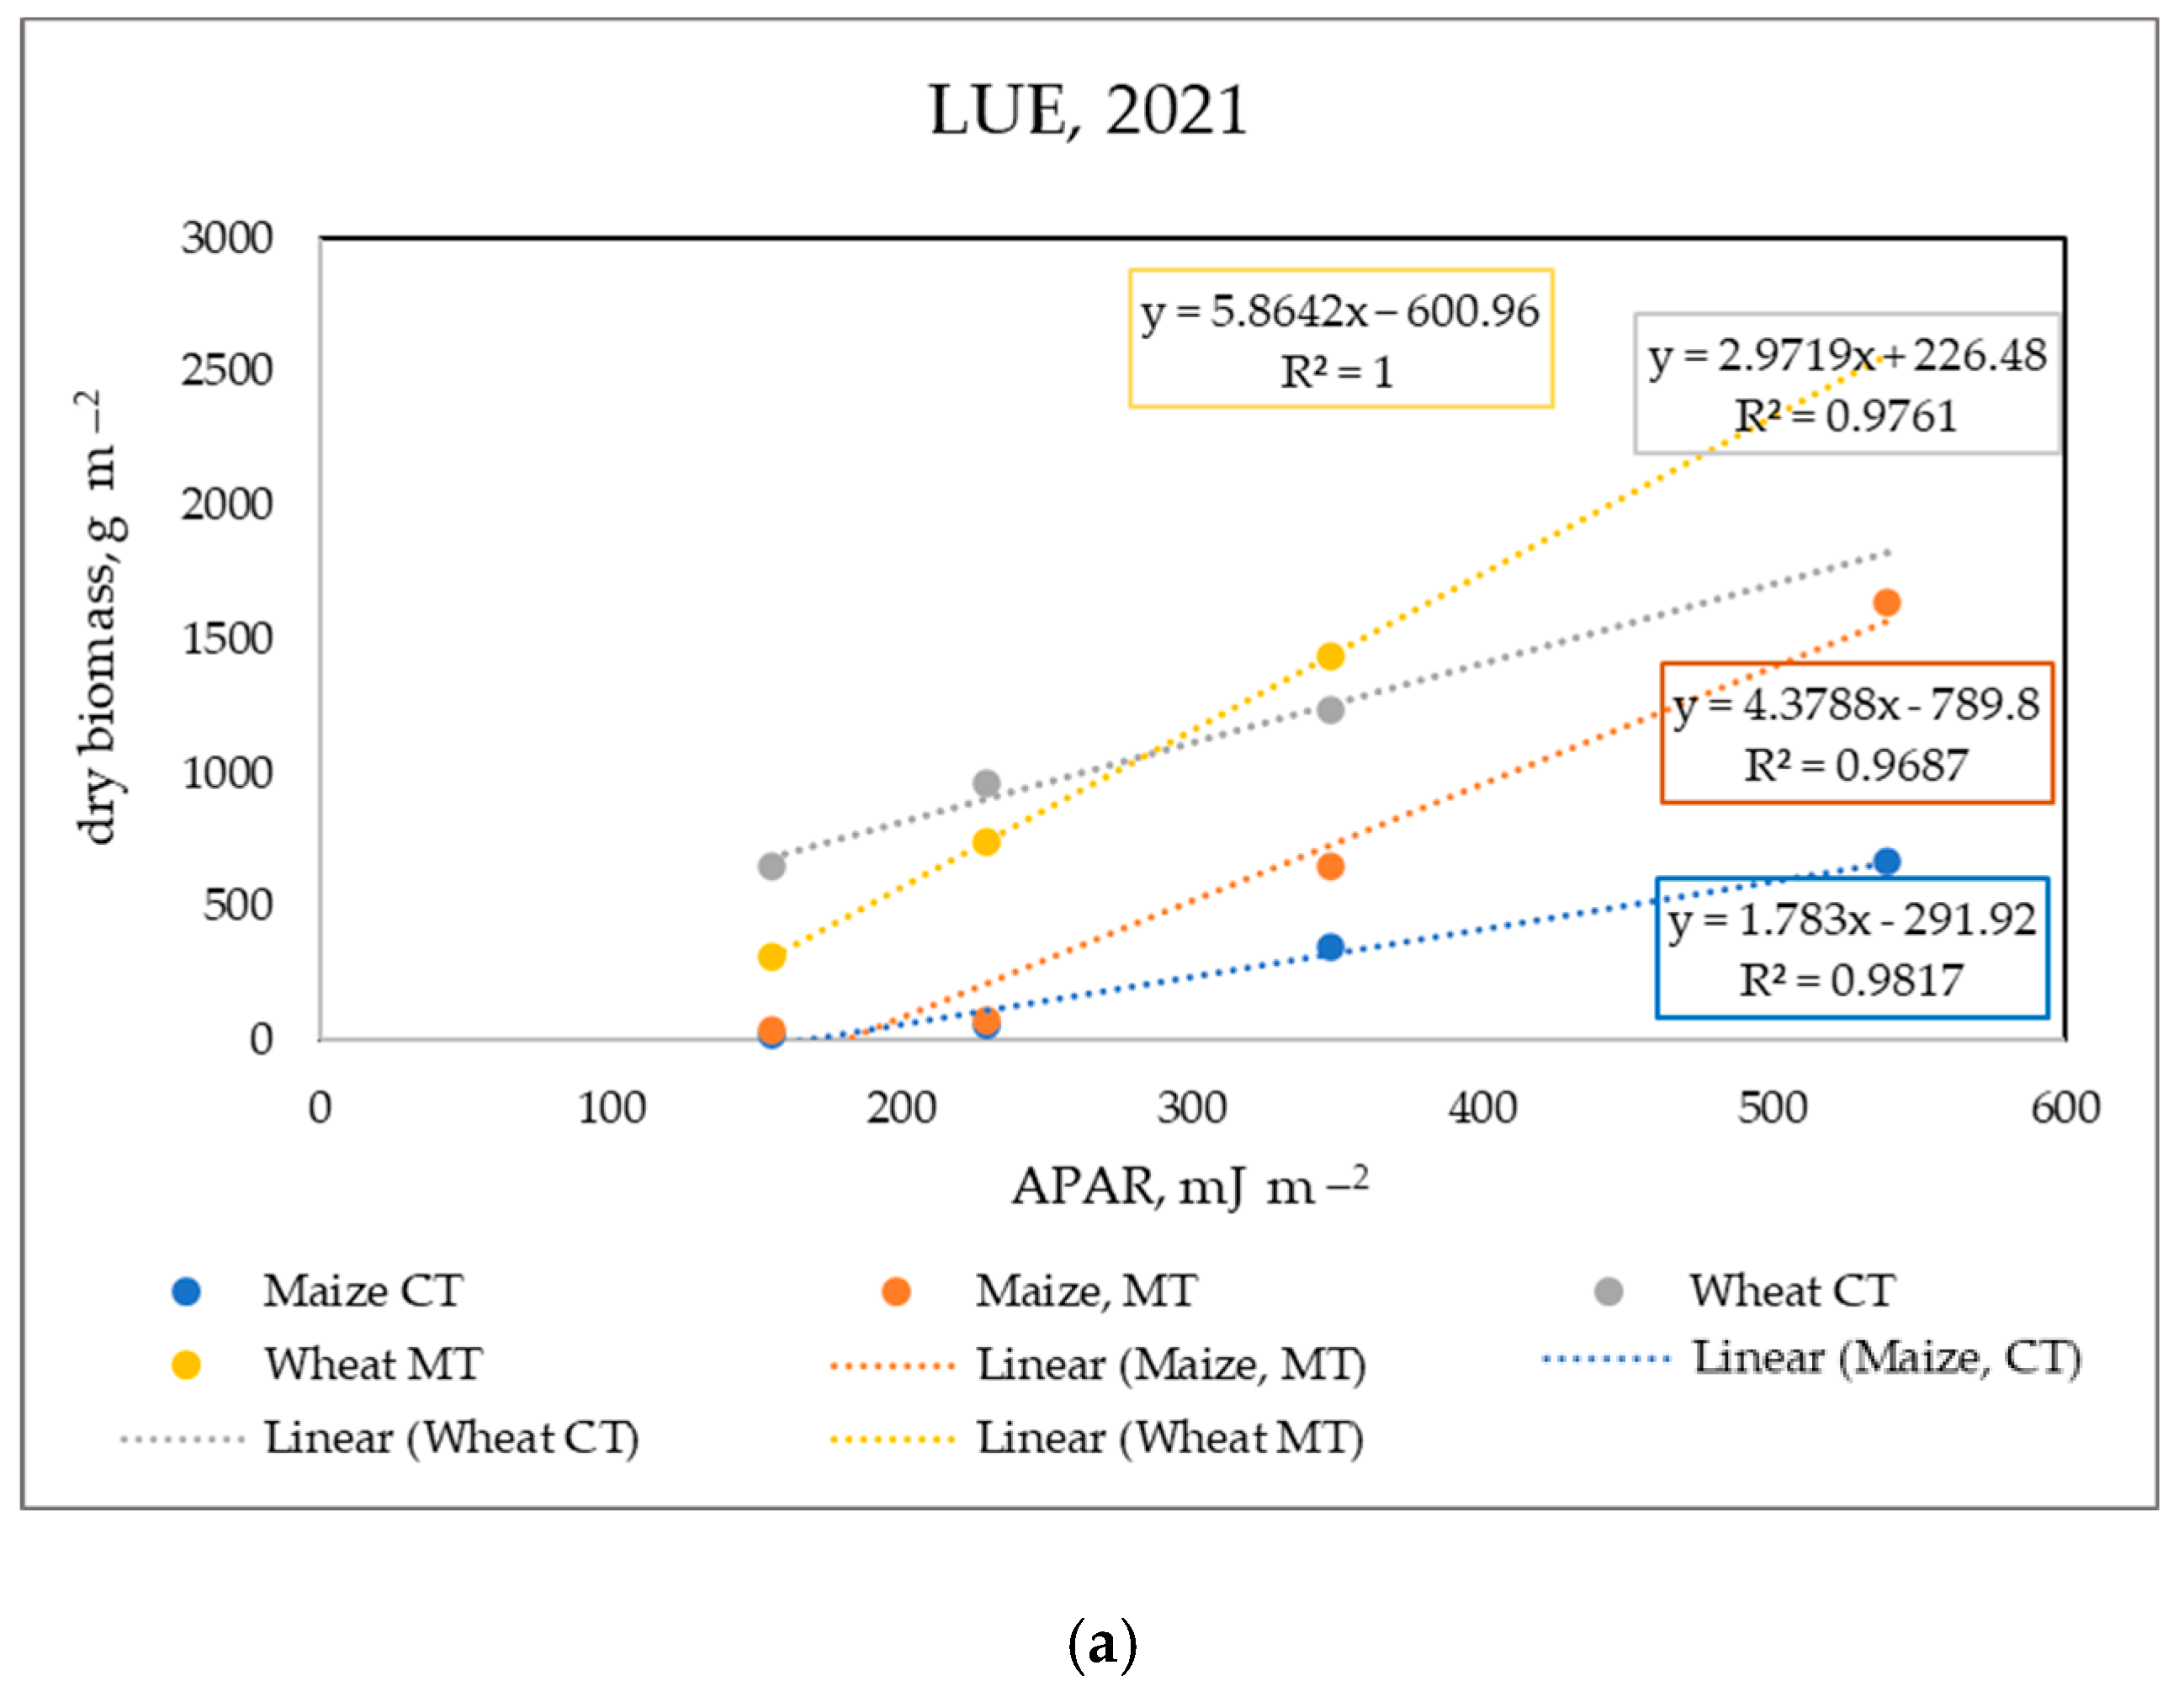
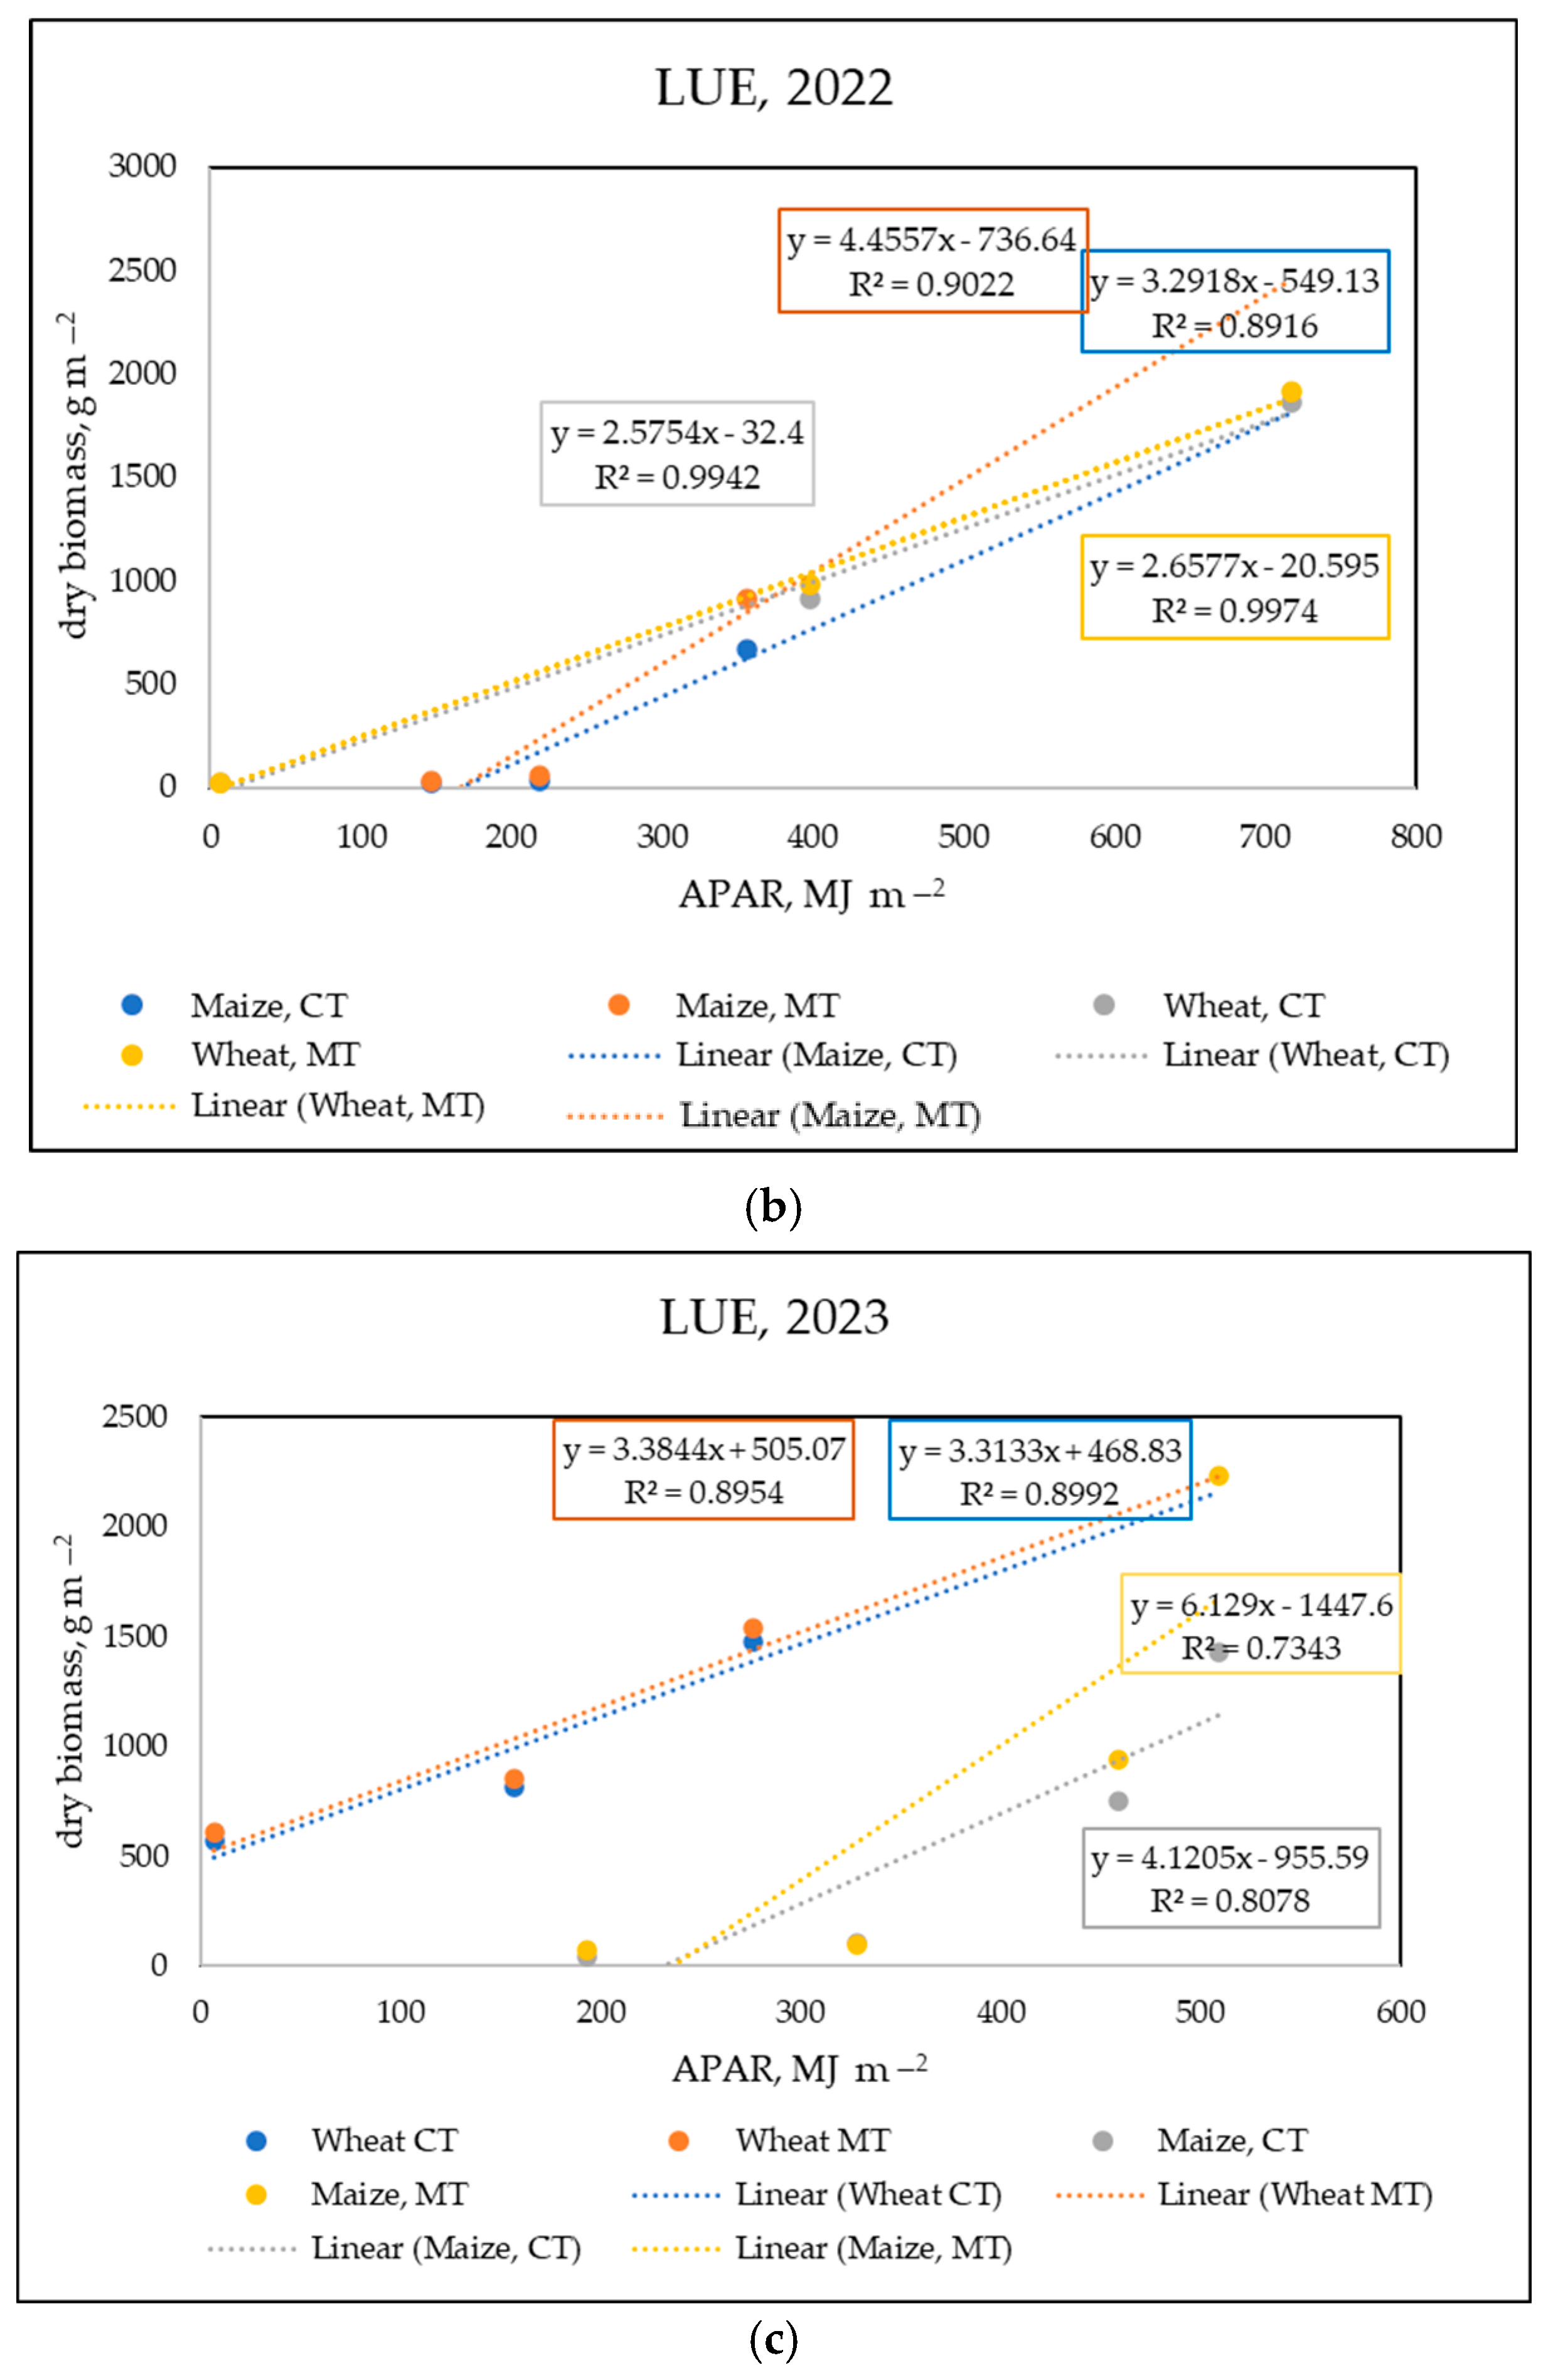
The efficiency of solar radiation use during the vegetation period (LUE, g MJ−1) is defined as the slope of the linear regression of aboveground biomass accumulated across developmental phases versus the incident of photosynthetically active radiation (PAR) in cumulative form. Available data allow the calculation of light use efficiency (LUE) in terms of the absorbed fraction of photosynthetically active radiation (APAR) within the 400–700 nm spectrum. Given that chlorophyll primarily absorbs in the blue and red regions, the fraction of PAR absorbed by leaves is estimated as APAR = 0.85 PAR [44].
A P A R = 0.425 R s H g v s
The efficiency of solar radiation use for the growing season (LUE, gMJ−1) was determined as the slope of a linear regression dependence of aboveground biomass accumulated by development phases on APAR in cumulative form.

2.7. Statistical Analysis

A one-way analysis of variance (ANOVA) was conducted to assess significant differences in water runoff, soil loss, and data from entire crop rotations. Additionally, a multifactor ANOVA was applied to evaluate other parameters, with tillage, year, and crop type considered as controlling factors. Principal component analysis (PCA) and Spearman correlation analysis were employed to identify interactions among the analyzed parameters. To determine the statistical significance of the observed correlations, Spearman rank correlation coefficients were calculated for each pair of variables, followed by significance testing using p-values. All analyses were performed using STATGRAPHICS Plus.

3. Results

3.1. Surface Water Runoff and Loss of Soil

The ecological focus of the agrotechnological practices applied to sloping agricultural land under rainfed conditions is centered on water conservation and soil quality preservation by reducing surface water runoff and soil loss. The use of cover crops can improve the hydrological regime by reducing physical evaporation from bare soil, particularly in late summer [45]. During the growing season of 2021, seven erosive precipitation events with a total volume of 132 mm were recorded; in 2022, three erosive precipitation events with a total volume of 68.1 mm; and, in 2023, two events, with a total volume of 18.9 mm. The effects of erosion control agrotechnology on soil water erosion parameters were as expected (Table 2). On average, the relative decrease in measured runoff and soil loss during the warm period was more pronounced for maize under minimum tillage and cover crops (−29% and −39%, respectively). Surface water runoff decreased by 39% in the MT variant under wheat compared with the CT variant. Reduced runoff led to better water availability for crops and improved nutrient retention in the soil, which, in turn, contributed to increased crop biomass. Additionally, it reduced soil loss, surface compaction, and crust formation.

3.2. Net Primary Productivity, Gross Primary Productivity, and Carbon Use Efficiency

Biomass samples were collected during the study period at key stages of development for both crops. Belowground biomass, net primary productivity (NPP), gross primary productivity (GPP), and autotrophic respiration (AR) were calculated, as described in Section 2.4.
To assess the effect of incorporating a cover crop into the rotation while minimizing operations and treatments along the contour, we estimated the average biomass accumulated in the rotations over a three-year period. The total biomass accumulated in the wheat–cover crop–maize rotation with minimum tillage was, on average, 37% (ANOVA, p = 0.0381) greater than the biomass accumulated in the standard wheat–maize rotation, implemented up and down the slope (Table 3). As a result of the conservation management approach, the average gross primary productivity (GPP) over the three-year period was 39% higher (6.59 ± 0.35 kg C m−2 year−1) compared with the conventional rotation (4.73 ± 0.39 kg C m−2 year−1), with the difference being statistically significant (ANOVA, p = 0.0072). Similar trends were observed for net primary productivity (NPP) and autotrophic respiration (AR), both of which exhibited statistically significant increases under the conservation treatment.
GPP, NPP, and AR are graphically presented by rotation in Figure 2a–d. Moisture supply and nutrient storage, resulting from fertilization during erosion control practices, contribute to the increase in GPP and NPP, along with autotrophic respiration. Carbon use efficiency (CUE) is typically considered a dimensionless constant by most authors [46]; however, some studies suggest that it varies depending on the temperature and moisture regime [47]. In maize grown after a cover crop and along the contour, a decrease in carbon use efficiency (CUE) was observed, with values declining from 0.60 in 2021 to 0.55 in 2022 and 0.44 in 2023. In conventionally grown maize, CUE ranged from 0.59 to 0.52 over the same period (Table 4). Although the differences in CUE were not statistically significant, it is noteworthy that maize—the crop most affected by the summer droughts of 2022 and 2023—exhibited a decline in CUE under both management treatments. In contrast, CUE in wheat remained stable, as the drought periods occurred after the crop’s active growing season had ended.

3.3. Water Use Efficiency

The three years of this study showed substantial differences in annual precipitation. Total precipitation amounted to 682 mm in 2021, 413 mm in 2022, and 404 mm in 2023. The year 2021 was classified as wet, with the probability of exceeding the recorded annual precipitation total estimated at 27%, and only 4% for the autumn–winter period (October–April). The distribution of precipitation and reference evapotranspiration (ETo) clearly indicates that 2022 and 2023 were significantly drier than 2021 (Figure 3a,b), with the most severe drought conditions occurring between July and October.
Actual evapotranspiration (ETa) decreased for both wheat and maize in 2022 and 2023, with the reduction being particularly pronounced in maize. Water use efficiency (WUE) exhibited a significant increase during the years with reduced summer precipitation, as shown in Table 5. Although accumulated biomass was lower during this period due to limited moisture availability, WUE increased relative to evapotranspiration, with the most substantial improvement observed in maize (Table 5).

3.4. Light Use Efficiency

The efficiency of solar radiation use during the growing season, expressed as light use efficiency (LUE, g MJ−1), was defined as the slope of the linear regression between accumulated aboveground biomass across developmental phases and the corresponding cumulative absorbed photosynthetically active radiation (APAR). Figure 4a–c illustrate these regression relationships for the three study years. Both LUE and water use efficiency (WUE) showed significant increases during the years with limited water availability (Table 6), with the increase being more pronounced in maize.
The distribution of precipitation over the three-year period revealed that drought conditions predominantly affected the summer months, which coincided with the maize growing season. This observation aligns with the findings of Eskelinen and Harrison (2015) [25].

3.5. Interaction Between Carbon, Water, and Light Use Efficiency

Correlation and principal component analyses were performed to investigate the relationships among the studied indicators. Gross primary productivity (GPP), net primary productivity (NPP), autotrophic respiration (AR), and light use efficiency (LUE) were derived from accumulated biomass data, explaining the strong correlations observed among the first three indicators (Table 7). The calculations of actual evapotranspiration (ETa), GPP, and AR incorporate temperature-dependent components, contributing further to their mutual correlations. However, LUE did not show any significant correlation with the other variables. A moderate positive correlation was identified between carbon use efficiency (CUE) and ETa (r = 0.50).
Principal component analysis (PCA) was conducted to identify the primary relationships among the studied parameters (Figure 5, Table 8). The analysis resulted in two principal components, which together explain 86.50% of the total variance in the dataset. Component 1 alone accounts for 65.65% of the variation in the indicators. The biplot illustrates a strong positive association among net primary productivity (NPP), gross primary productivity (GPP), water use efficiency (WUE), and light use efficiency (LUE). In contrast, carbon use efficiency (CUE) was negatively correlated with LUE and WUE. These findings suggest that, under the experimental conditions, improvements in water and light use efficiency were not associated with enhanced carbon assimilation efficiency.

4. Discussion

Soils today are greatly impacted by human activities such as deforestation, industrial agriculture, urbanization, and pollution. These anthropogenic pressures have led to widespread soil degradation, erosion, salinization, and desertification, thereby undermining essential ecosystem services [48]. This leads to various environmental issues, including soil degradation, loss of organic matter, compaction, intensified erosion, deterioration of soil structure, and a decline in biodiversity [49]. Among conservation measures, cover crops are increasingly recognized for their multifunctional role in improving soil health and delivering ecosystem services [50]. They reduce erosion, mitigate compaction, enhance soil structure, and increase organic carbon, microbial activity, and nutrient cycling. Despite their potential, studies remain divided on their impact on subsequent crop yields and water use efficiency (WUE) [51], with some reporting positive [52,53] and others negative effects [54].
Minimizing tillage, early sowing, no-till practices, etc., can positively influence water use efficiency (WUE) [55]. Our results support findings that cover crops can improve subsequent crop development and resource use, particularly in erosion-prone sloping terrains—a context less frequently studied in the literature. Specifically, we observed enhanced WUE in maize after cover cropping, especially in the drier years (2022–2023), suggesting that conservation practices may stabilize yields under water-limited conditions. This is consistent with previous findings that improved water retention due to organic residues and erosion control may offset early-season moisture depletion caused by cover crops [56,57].
However, the effect varied by crop and tillage intensity. While maize benefited significantly, wheat showed a weaker response to conservation tillage, confirming earlier studies that highlight variable responses across crop types and climates [55,58]. Our observations underscore the need to consider crop-specific and terrain-related dynamics when evaluating conservation strategies.
Regarding carbon use efficiency (CUE), our study observed no statistically significant variation across treatments or years, even under markedly different climatic conditions (wet in 2021 vs. drought in 2023). This result aligns with the earlier research indicating that CUE can remain stable despite environmental variability due to internal plant regulatory mechanisms and carbon allocation strategies that prioritize maintenance respiration under stress [45,46,59]. Although ecosystem-level studies have reported seasonal CUE variation in response to soil moisture and temperature [60], our findings suggest that in annual cropping systems, such as maize and wheat, this response may be buffered by management practices like residue retention and minimized tillage.
The unchanged CUE across treatments may also reflect a trade-off between carbon assimilation and autotrophic respiration. Under conservation systems, improved soil conditions can support higher microbial and root activity, potentially increasing autotrophic respiration and counterbalancing gains in gross primary productivity. This supports the hypothesis that CUE stability under different agricultural practices may not indicate inefficiency but rather a dynamic equilibrium within the carbon cycle [60].
While previous research has emphasized WUE and LUE in conservation agriculture, fewer studies have incorporated CUE as a metric of resource efficiency. Our findings thus contribute new insights by showing that, even when biomass and WUE increase under conservation practices, CUE may remain stable—highlighting the importance of including all three metrics for a holistic understanding of agroecosystem functioning.
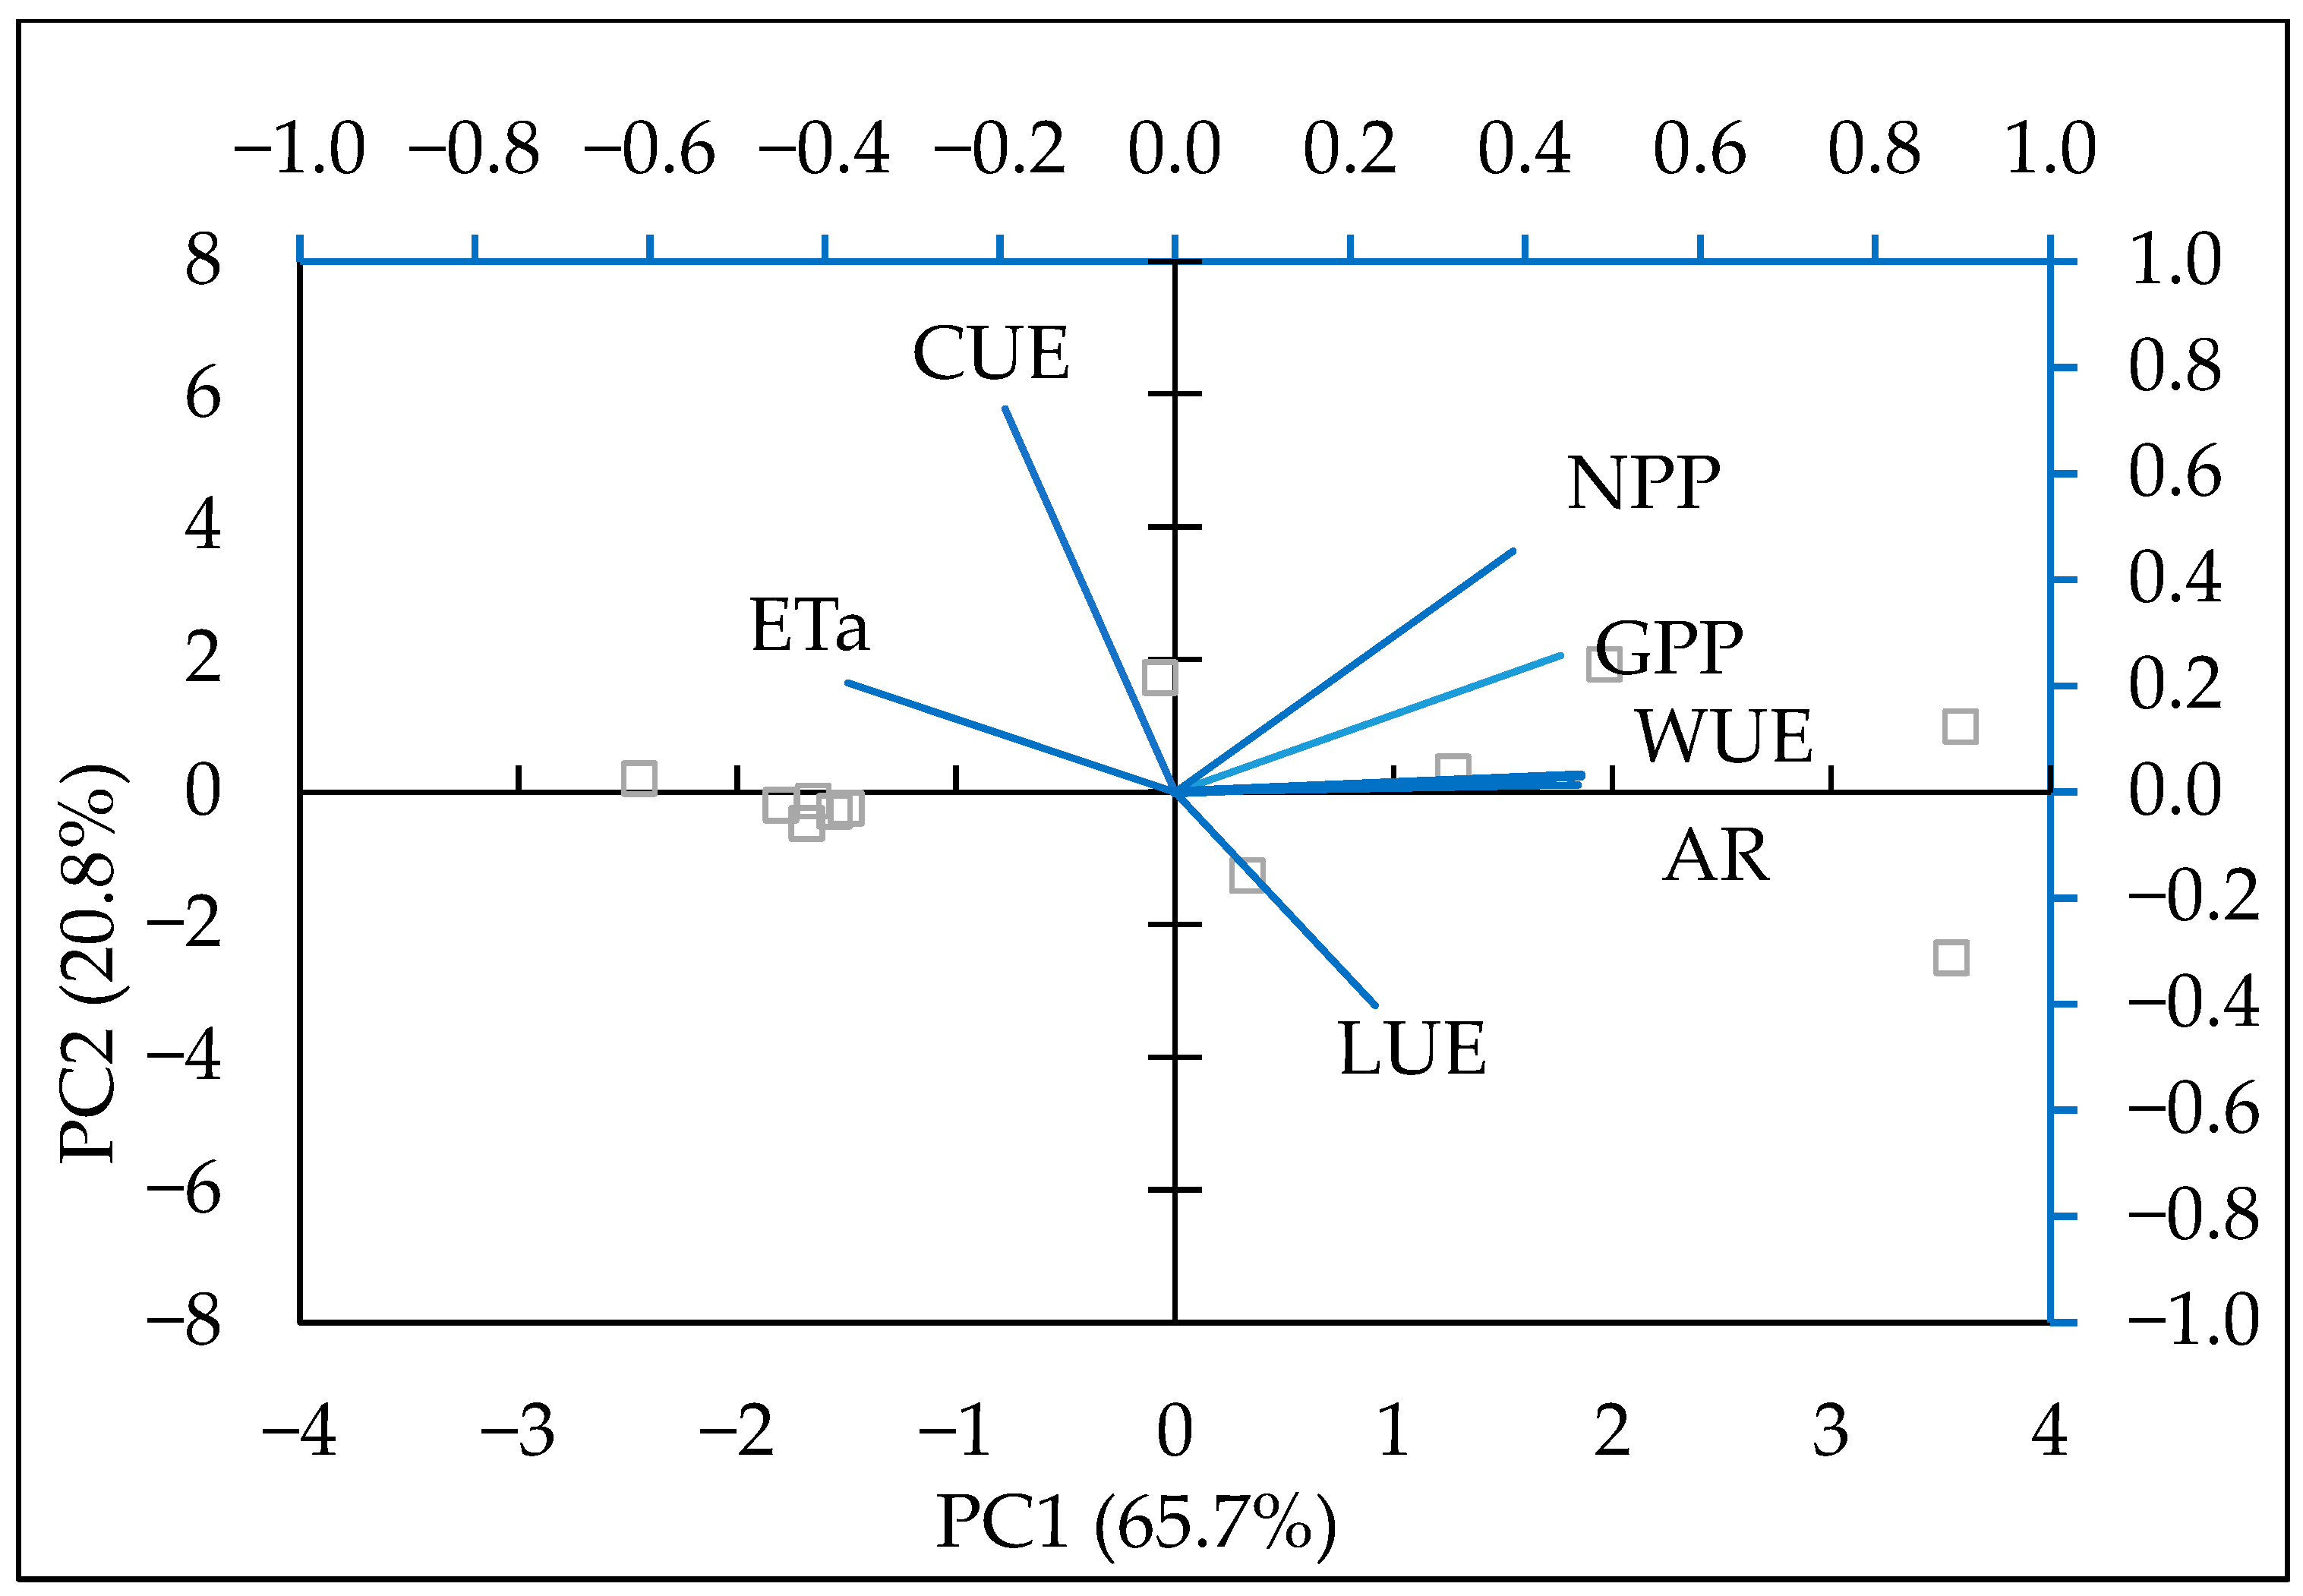
CUE and WUE often respond differently to environmental changes and land management, as also shown in spatial and temporal studies [61]. While a weak but positive correlation between WUE and LUE was found in our study, PCA further revealed a synergistic interaction between the two. This supports previous assertions that optimizing one resource use efficiency may indirectly influence another, though not always linearly [20,62]. Moreover, the superior WUE of maize (a C4 crop) compared with wheat (a C3 crop) aligns with established physiological differences [63].
Overall, our results emphasize that conservation practices on sloping terrain not only mitigate erosion but also enhance biomass accumulation and WUE, especially in maize, while maintaining CUE stability. These findings provide a deeper understanding of resource use dynamics in vulnerable landscapes and advance the current knowledge by incorporating terrain sensitivity and CUE analysis into the broader context of sustainable agricultural intensification.
Nevertheless, the observed year-to-year variability in crop yield and resource use efficiency highlights the influence of climatic fluctuations and crop-specific responses. Future studies should aim to incorporate multi-year data across diverse agroecosystems to better capture the spatial and temporal dynamics of carbon fluxes and resource efficiency.
Moreover, given the relatively short three-year duration of this study, the long-term sustainability impact on soil fertility, microbial communities, and ecosystem stability remains uncertain and warrants further investigation through long-term monitoring [64].

5. Conclusions

In the current study, we observed that planting a cover crop on sloping arable land exposed to water erosion processes significantly improves biomass accumulation in the subsequent crop while reducing surface water runoff and soil losses. The inclusion of a cover crop in the wheat–maize rotation leads to a substantial increase in assimilated carbon, enhancing both aboveground and belowground biomass. This process aids in carbon sequestration, keeping the soil surface covered during the fallow periods between main crops. Moreover, when combined with minimum contour tillage, this approach results in more efficient water management for both maize and wheat crops, particularly improving water and light use efficiency in the dry years of 2022 and 2023.
While our study demonstrated that these conservation practices can enhance resource use efficiency, it is important to note that carbon use efficiency (CUE) did not show significant differences in relation to tillage systems or climatic conditions during the course of this experiment. This suggests that, while the system improves biomass and resource efficiency, further investigation is needed to better understand the complex factors influencing carbon cycling under varying management practices.
There are several limitations to our study that should be addressed in future research. First, this study was conducted over a limited number of years, and longer term monitoring is necessary to assess the sustainability of these practices over time. Additionally, this research was focused on a single agroecosystem with specific climatic and soil conditions. To draw more generalized conclusions, similar studies should be conducted in different geographic regions and under various climate scenarios.
The practical applications of our findings are significant for sustainable agricultural practices in sloping terrains prone to erosion. Our results suggest that the integration of cover crops and minimum tillage can be a viable strategy to improve soil conservation, enhance water and light use efficiency, and increase carbon sequestration in agroecosystems. This approach could be particularly beneficial for farmers in regions affected by soil erosion and water scarcity.
Future research should focus on a deeper exploration of the underlying mechanisms that regulate carbon cycling and use efficiency in different agricultural systems. It would also be valuable to study the long-term effects of these practices on soil fertility, biodiversity, and overall ecosystem services. Further experiments could explore the potential of other cover crop species, varying tillage practices, and the impact of climate change on the efficacy of these conservation techniques.

Author Contributions

Conceptualization, G.K., A.Z.A. and M.K.; methodology, G.K.; software, G.K.; validation, G.K., A.Z.A., V.V. and M.K.; formal analysis, G.K. and M.F.; investigation, G.K.; resources, A.Z.A.; data curation, G.K.; writing—original draft preparation, G.K., A.Z.A. and M.K.; writing—review and editing, A.Z.A., V.V. and V.D.; visualization, P.D.N. and P.N.; supervision, G.K.; project administration, G.K.; funding acquisition, A.Z.A. All authors have read and agreed to the published version of the manuscript.

Funding

This research was funded by the Scientific Research Fund under grant agreement № KP-06-N76/2 2023 (project “Integration of satellite and ground-based data on the components of the soil water balance and vegetation cover in models for assessing agro-ecological risks and agricultural practices for their reduction”).

Informed Consent Statement

Not applicable.

Data Availability Statement

The data presented in this study are available on request from the corresponding author.

Conflicts of Interest

The authors declare no conflicts of interest.

Abbreviations

The following abbreviations are used in this manuscript:
GPPGross primary productivity, g C m−2 day−1
NPPNet primary productivity, g C m−2 day−1
ARAutotrophic respiration, g C m−2 day−1
MRMaintenance respiration, g C m−2 day−1
GRGrowth respiration, g C m−2 day−1
TCCTotal carbon content g C m−2
CUECarbon use efficiency
LUELight use efficiency, g MJ−1
WUEWater use efficiency, kg C mm−1
CTConventional tillage
MTMinimum tillage
EToReference evapotranspiration, mm
ETaActual evapotranspiration, mm
Dr,iSoil moisture depletion in the root zone (r) on day (i), mm
RORunoff, mm
PPrecipitation, mm
APARAbsorbed photosynthetically active radiation, MJ m−2
PARPhotosynthetically active radiation, MJ m−2
RsDaily sum of total solar radiation, MJ m−2 day−1
RaDaily sum of solar radiation in the absence of an atmosphere, MJ m−2 day−1
Rs HgrvsThe day/night sums of total solar radiation, estimated by equation of Hargreaves, MJ m−2 day−1

References

  1. Alhameid, A.; Tobin, C.; Maiga, A.; Kumar, S.; Osborne, S.; Schumacher, T. Chapter 9—Intensified Agroecosystems and Changes in Soil Carbon Dynamics; Al-Kaisi, M.M., Lowery, B., Eds.; Soil Health and Intensification of Agroecosytems; Academic Press: Cambridge, MA, USA, 2017; pp. 195–214. ISBN 9780128053171. [Google Scholar] [CrossRef]
  2. Dornbush, M.E.; von Haden, A.C. Chapter 8—Intensified Agroecosystems and Their Effects on Soil Biodiversity and Soil Functions; Al-Kaisi, M.M., Lowery, B., Eds.; Soil Health and Intensification of Agroecosytems; Academic Press: Cambridge, MA, USA, 2017; pp. 173–193. ISBN 9780128053171. [Google Scholar]
  3. Pramanick, B.; Kumar, M.; Mahesh Naik, B.; Kumar Singh, S.; Kumar, M.; Vendra Singh, S. Soil carbon-nutrient cycling, energetics, and carbon footprint in calcareous soils with adoption of long-term conservation tillage practices and cropping systems diversification. Sci. Total Environ. 2024, 912, 169421. [Google Scholar] [CrossRef] [PubMed]
  4. Tilman, D.; Cassman, K.; Matson, P.; Naylor, R.; Polasky, S. Agricultural sustainability and intensive production practices. Nature 2002, 418, 671–677. [Google Scholar] [CrossRef]
  5. Trenberth, K.E. Changes in Precipitation with Climate Change. Clim. Res. 2011, 47, 123–138. [Google Scholar] [CrossRef]
  6. Deutscher Wetterdienst Annual Report. 2019. Available online: https://www.dwd.de/EN/ourservices/annual_reports_dwd/annual_reports_pdf/annual_report_2019.html (accessed on 27 August 2020).
  7. Nearing, M.A.; Pruski, F.F.; O’Neal, M.R. Expected climate change impacts on soil erosion rates: A review. J. Soil Water Conserv. 2004, 59, 43–50. [Google Scholar] [CrossRef]
  8. Li, Z.; Fang, H. Impacts of climate change on water erosion: A review. Earth Sci. Rev. 2016, 163, 94–117. [Google Scholar] [CrossRef]
  9. Trenberth, K.; Dai, A.; van der Schrier, G.; Jones, P.D.; Barichivich, J.; Briffa, K.R.; Sheffield, J. Global warming and changes in drought. Nat. Clim. Chang. 2014, 4, 17–22. [Google Scholar] [CrossRef]
  10. Eekhout, J.P.C.; de Vente, J. Global impact of climate change on soil erosion and potential for adaptation through soil conservation. Earth-Sci. Rev. 2022, 226, 103921. [Google Scholar] [CrossRef]
  11. Seleiman, M.F.; Al-Suhaibani, N.; Ali, N.; Akmal, M.; Alotaibi, M.; Refay, Y.; Dindaroglu, T.; Abdul-Wajid, H.H.; Battaglia, M.L. Drought Stress Impacts on Plants and Different Approaches to Alleviate Its Adverse Effects. Plants 2021, 10, 259. [Google Scholar] [CrossRef]
  12. Borrelli, P.; Robinson, D.A.; Panagos, P.; Lugato, E.; Yang, J.E.; Alewell, C.; Wuepper, D.; Montanarella, L.; Ballabio, C. Land use and climate change impacts on global soil erosion by water (2015–2070). Proc. Natl. Acad. Sci. USA 2020, 117, 21994–22001. [Google Scholar] [CrossRef]
  13. Wang, Y.-P.; Zhang, L.; Liang, X.; Yuan, W. Coupled models of water and carbon cycles from leaf to global: A retrospective and a prospective. Agric. For. Meteorol. 2024, 358, 110229. [Google Scholar] [CrossRef]
  14. Good, S.P.; Noone, D.; Bowen, G. Hydrologic connectivity constrains partitioning of global terrestrial water fluxes. Science 2015, 349, 175–177. [Google Scholar] [CrossRef] [PubMed]
  15. Jasechko, S.; Sharp, Z.D.; Gibson, J.J.; Birks, S.J.; Yi, Y.; Fawcett, P. Terrestrial water fluxes dominated by transpiration. Nature 2013, 496, 347–350. [Google Scholar] [CrossRef] [PubMed]
  16. Verstraeten, W.W.; Veroustraete, F.; Feyen, J. Assessment of Evapotranspiration and Soil Moisture Content Across Different Scales of Observation. Sensors 2008, 8, 70–117. [Google Scholar] [CrossRef]
  17. Bonan, G.B.; Patton, E.G.; Finnigan, J.J.; Baldocchi, D.D.; Harman, I.N. Moving beyond the incorrect but useful paradigm: Reevaluating big-leaf and multilayer plant canopies to model biosphere-atmosphere fluxes—A review. Agric. For. Meteorol. 2021, 306, 108435. [Google Scholar] [CrossRef]
  18. Gentine, P.; Green, J.K.; Guérin, M.; Humphrey, V.; Seneviratne, S.I.; Zhang, Y.; Zhou, S. Coupling between the terrestrial carbon and water cycles—A review. Environ. Res. Lett. 2019, 14, 083003. [Google Scholar] [CrossRef]
  19. Hodapp, D.; Hillebrand, H.; Striebel, M. “Unifying” the concept of resource use efficiency in ecology. Front. Ecol. Evol. 2019, 6, 233. [Google Scholar] [CrossRef]
  20. Kukal, M.S.; Irmak, S. Interrelationships between water use efficiency and light use efficiency in four row crop canopies. Agrosyst. Geosci. Environ. 2020, 3, e20110. [Google Scholar] [CrossRef]
  21. Liu, L.; Zhou, W.; Guan, K.; Peng, B.; Xu, S.; Tang, J.; Zhu, Q.; Till, J.; Jia, X.; Jiang, C.; et al. Knowledge-guided machine learning can improve carbon cycle quantification in agroecosystems. Nat. Commun. 2024, 15, 357. [Google Scholar] [CrossRef]
  22. Zhao, M.; Geruo, A.; Liu, Y.; Konings, A.G. Evapotranspiration frequently increases during droughts. Nat. Clim. Chang. 2022, 12, 1024–1030. [Google Scholar] [CrossRef]
  23. Yu, G.-R.; Zhuang, J.; Yu, Z.-L. An attempt to establish a synthetic model of photosynthesis-transpiration based on stomatal behavior for maize and soybean plants grown in field. J. Plant Physiol. 2001, 158, 861–874. [Google Scholar] [CrossRef]
  24. Bush, M.B. Ecology of a Changing Planet Tsinghua; University Publishing House Co., Ltd.: Upper Saddle River, NJ, USA, 2003. [Google Scholar]
  25. Eskelinen, A.; Harrison, S. Biotic context and soil properties modulate native plant responses to enhanced rainfall. Ann. Bot. 2015, 116, 963–973. [Google Scholar] [CrossRef] [PubMed] [PubMed Central]
  26. Zhang, T.; Tang, Y.; Shan, B.; Xu, M.; Cong, N.; Chen, N.; Ji, X.; Zhao, G.; Zheng, Z.; Zhu, J.; et al. Drought-induced resource use efficiency responses in an alpine meadow ecosystem of northern Tibet. Agric. For. Meteorol. 2023, 342, 109745. [Google Scholar] [CrossRef]
  27. Liu, Q.; Sun, X.; Wu, W.; Liu, Z.; Fang, G.; Yang, P. Agroecosystem services: A review of concepts, indicators, assessment methods and future research perspectives. Ecol. Indic. 2022, 142, 109218. [Google Scholar] [CrossRef]
  28. Hoover, D.L.; Abendroth, L.J.; Browning, D.M.; Saha, A.; Snyder, K.; Wagle, P.; Witthaus, L.; Baffaut, C.; Biederman, J.A.; Bosch, D.D.; et al. Indicators of water use efficiency across diverse agroecosystems and spatiotemporal scales. Sci. Total Environ. 2023, 864, 160992. [Google Scholar] [CrossRef]
  29. Du, C.; Li, L.; Xie, J.; Effah, Z.; Luo, Z.; Wang, L. Long-Term Conservation Tillage Increases Yield and Water Use Efficiency of Spring Wheat (Triticum aestivum L.) by Regulating Substances Related to Stress on the Semi-Arid Loess Plateau of China. Agronomy 2023, 13, 1301. [Google Scholar] [CrossRef]
  30. Paustian, K.; Lehmann, J.; Ogle, S.G.; Robertson, P.; Smith, P. Climate-smart soils. Nature 2016, 532, 49–57. [Google Scholar] [CrossRef]
  31. Liebig, M.A.; Saliendra, N.Z.; Archer, D.W. Carbon fluxes from a spring wheat–corn–soyben crop rotation under no-tillage management. Agrosyst. Geosci. Environ. 2022, 5, e20291. [Google Scholar] [CrossRef]
  32. Smith, B.W.; Dalen, J.; Wiggins, K.; Tooley, E.; Christopher, P.; Bernard, J. The brief resilience scale: Assessing the ability to bounce back. Int. J. Behav. Med. 2008, 15, 194–200. [Google Scholar] [CrossRef] [PubMed]
  33. Costantini, E.A.C.; Lorenzetti, R. Soil degradation processes in the Italian agricultural and forest ecosystems. Ital. J. Agron. 2013, 8, e28. [Google Scholar] [CrossRef]
  34. IUSS Working Group WRB. World Reference Base for Soil Resources. International Soil Classification System for Naming Soils and Creating Legends for Soil Maps, 4th ed.; International Union of Soil Sciences (IUSS): Vienna, Austria, 2022. [Google Scholar]
  35. Rousseva, S.; Kercheva, M.; Blum, W.; Lair, G.; Shishkov, T.; Regelink, I.; van Gaans, P.; Ilieva, R.; Bloem, J. Dataset on Soil Physical, Geochemical and Biological Properties, Characterizing the CZOs; Deliverable D 1.1. Project 244118 SoilTrEC—Soil Transformations in European Catchments; European Commission: Brussels, Belgium, 2010. [Google Scholar]
  36. Rousseva, S.; Malinov, I.; Stefanova, V. Soil erosion risk assessments using GIS technologies—Bulgarian experience. Bulg. J. Agric. Sci. 2016, 22, 205–208. [Google Scholar]
  37. Allen, R.G.; Pereira, L.S.; Raes, D.; Smith, M. Crop Evapotranspiration. Guidelines for Computing Crop Water Requirements; FAO Irrig. Drain. Pap. 56; FAO: Rome, Italy, 1998; 300p. [Google Scholar]
  38. Delandmeter, M.; Léonard, J.; Ferchaud, F.; Heinesch, B.; Manise, T.; Faurès, A.; Bindelle, J.; Dumont, B. A comprehensive analysis of CO2 exchanges in agro-ecosystems based on a generic soil-crop model-derived methodology. Agric. For. Meteorol. 2023, 340, 109621. [Google Scholar] [CrossRef]
  39. Brisson, N.; Mary, B.; Ripoche, D.; Jeuffroy, M.H.; Ruget, F.; Nicoullaud, B.; Gate, P.; Devienne-Barret, F.; Antonioletti, R.; Durr, C.; et al. STICS: A generic model for the simulation of crops and their water and nitrogen balances. I. Theory and parameterization applied to wheat and corn. Agronomie 1998, 18, 311–346. [Google Scholar] [CrossRef]
  40. Bolinder, M.A.; Janzen, H.H.; Gregorich, E.G.; Angers, D.A.; VandenBygaart, A.J. An approach for estimating net primary productivity and annual carbon inputs to soil for common agricultural crops in Canada. Agric. Ecosyst. Environ. 2007, 118, 29–42. [Google Scholar] [CrossRef]
  41. Ruimy, A.; Dedieu, G.; Saugier, B. TURC: A diagnostic model of continental gross primary productivity and net primary productivity. Glob. Biogeochem. Cycles 1996, 10, 269–285. [Google Scholar] [CrossRef]
  42. Wang, Y.; Gao, G.; Huang, Y.; Wang, Z.; Fu, B. Ecosystem water use efficiency and carbon use efficiency respond oppositely to vegetation greening in China’s Loess Plateau. Sci. Total Environ. 2025, 964, 178575. [Google Scholar] [CrossRef]
  43. Hargreaves, G.L.; Hargreaves, G.H.; Riley, J.P. Irrigation water requirement for Senegal River Basin. J. Irrig. Drain. Eng. 1985, 111, 265–275. [Google Scholar] [CrossRef]
  44. Monteith, J.L. Solar radiation and productivity in tropical ecosystems. In Proceedings of IBP/UNESCO Meeting on Productivity of Tropical Ecosystems, 1972; Makerere University: Kampala, Uganda, 1970. [Google Scholar]
  45. Bodner, G.; Loiskandl, W.; Kaul, H.-P. Cover crop evapotranspiration under semi-arid conditions using FAO dual crop coefficient method with water stress compensation. Agric. Water Manag. 2007, 93, 85–98. [Google Scholar] [CrossRef]
  46. Manzoni, S.; Čapek, P.; Porada, P.; Thurner, M.; Winterdahl, M.; Beer, C.; Brüchert, V.; Frouz, J.; Herrmann, A.M.; Lindahl, B.D.; et al. Reviews and syntheses: Carbon use efficiency from organisms to ecosystems—Definitions, theories, and empirical evidence. Biogeosciences 2018, 15, 5929–5949. [Google Scholar] [CrossRef]
  47. Liu, Y.; Yang, Y.; Wang, Q.; Du, X.; Li, J.; Gang, C.; Zhou, W.; Wang, Z. Evaluating the responses of net primary productivity and carbon use efficiency of global grassland to climate variability along an aridity gradient. Sci. Total Environ. 2019, 652, 671–682. [Google Scholar] [CrossRef]
  48. Telo da Gama, J. The Role of Soils in Sustainability, Climate Change, and Ecosystem Services: Challenges and Opportunities. Ecologies 2023, 4, 552–567. [Google Scholar] [CrossRef]
  49. Blanco-Canqui, H.; Lal, R. Principles of Soil Conservation and Management; Springer: Berlin/Heidelberg, Germany, 2008. [Google Scholar]
  50. Zhang, H.; Ghahramani, A.; Ali, A.; Erbacher, A. Cover cropping impacts on soil water and carbon in dryland cropping system. PLoS ONE 2023, 18, e0286748. [Google Scholar] [CrossRef] [PubMed]
  51. Wang, J.; Zhang, S.; Sainju, U.M.; Ghimire, R.; Zhao, F. A meta-analysis on cover crop impact on soil water storage, succeeding crop yield, and water-use efficiency. Agric. Water Manag. 2021, 256, 107085. [Google Scholar] [CrossRef]
  52. Peng, Y.; Wang, L.; Jacinthe, P.-A.; Ren, W. Global synthesis of cover crop impacts on main crop yield. Field Crops Res. 2024, 310, 109343. [Google Scholar] [CrossRef]
  53. Snapp, S.; Surapur, S. Rye cover crop retains nitrogen and doesn’t reduce corn yields. Soil Tillage Res. 2018, 180, 107–115. [Google Scholar] [CrossRef]
  54. Flohr, B.M.; Hunt, J.R.; Kirkegaard, J.A.; Rheinheimer, B.; Swan, T.; Goward, L.; Evans, J.R.; Bullock, M. Deep soil water-use determines the yield benefit of long-cycle wheat. Front. Plant Sci. 2020, 11, 548. [Google Scholar] [CrossRef] [PubMed]
  55. Ma, Y.; Li, Q. Carbon emission and water use efficiency response to tillage methods and planting patterns of winter wheat in the North China Plain. PeerJ 2020, 8, e9912. [Google Scholar] [CrossRef] [PubMed] [PubMed Central]
  56. Leuthold, S.J.; Salmerón, M.; Wendroth, O.; Poffenbarger, H. Cover crops decrease maize yield variability in sloping landscapes through increased water during reproductive stages. Field Crops Res. 2021, 265, 108111. [Google Scholar] [CrossRef]
  57. Krstić, Đ.; Vujić, S.; Jaćimović, G.; D’Ottavio, P.; Radanović, Z.; Erić, P.; Ćupina, B. The Effect of Cover Crops on Soil Water Balance in Rain-Fed Conditions. Atmosphere 2018, 9, 492. [Google Scholar] [CrossRef]
  58. Yu, L.; Gao, X.; Zhao, X. Global synthesis of the impact of droughts on crops’ water-use efficiency (WUE): Towards both high WUE and productivity. Agric. Syst. 2020, 177, 102723. [Google Scholar] [CrossRef]
  59. Quan, Q.; Ma, F.; Wang, J.; Tian, D.; Zhou, Q.; Niu, S. Contextualized response of carbon-use efficiency to warming at the plant and ecosystem levels. Sci. Total Environ. 2023, 885, 163777. [Google Scholar] [CrossRef]
  60. Blanco-Canqui, H.; Shaver, T.M.; Lindquist, J.L.; Shapiro, C.A.; Elmore, R.W.; Francis, C.A.; Hergert, G.W. Cover Crops and Ecosystem Services: Insights from Studies in Temperate Soils. Agron. J. 2015, 107, 2449–2474. [Google Scholar] [CrossRef]
  61. Hua, L.; Zhang, F.; Sun, R.; Yu, X.; Ma, H. Synergy of carbon and water use efficiencies in the Huai River Basin. Ecol. Indic. 2024, 160, 111874. [Google Scholar] [CrossRef]
  62. Kukal, M.S.; Irmak, S. Evidence of Arithmetical Uncertainty in Estimation of Light and Water Use Efficiency. Sustainability 2020, 12, 2271. [Google Scholar] [CrossRef]
  63. Kukal, M.S.; Irmak, S. Characterization of water use and productivity dynamics across four C3 and C4 row crops under optimal growth conditions. Agric. Water Manag. 2020, 227, 105840. [Google Scholar] [CrossRef]
  64. Montgomery, D.R. Soil erosion and agricultural sustainability. Proc. Natl. Acad. Sci. USA 2007, 104, 13268–13272. [Google Scholar] [CrossRef]
Figure 1. Schematic representation of the experimental design (2021–2023), showing crop rotations and tillage directions for each treatment. Plots 1 and 2 represent conventional tillage (CT) performed up and down the slope, while Plots 3 and 4 represent minimum tillage (MT) with contour tillage and a cover crop (barley) incorporated as green manure between wheat and maize. Arrows indicate tillage direction. Each plot followed a specific crop sequence to reflect practical rotations.
Resources 14 00087 g001
Figure 2. Cumulative GPP—gross primary productivity (kgC m−2), NPP—net primary productivity (kg C m−2), AR—autotrophic respiration (kg C m−2), simulated on the basis of measured aboveground biomass; (a) plot 1—conventional tillage, rotation w-m-w; (b) plot 2—minimum tillage, rotation m-w-m; (c) plot 3—minimum tillage w-m-w; (d) plot 4—conventional tillage, rotation w-m-w; m—maize, w—wheat.
Resources 14 00087 g002aResources 14 00087 g002b
Figure 3. Actual evapotranspiration (mm), reference evapotranspiration (mm), precipitation (mm), 2021–2023. Rotations: (a) wheat–maize–wheat and (b) maize–wheat–maize.
Resources 14 00087 g003aResources 14 00087 g003b
Figure 4. Accumulated dry biomass (g m−2), in the different cultivation options of the studied crops, energy in biomass (MJ m−2), and efficiency (LUE, g MJ−1) of using photosynthetically active radiation (APAR) for (a) 2021, (b) 2022, (c) 2023.
Resources 14 00087 g004aResources 14 00087 g004b
Figure 5. Principal component analysis of CUE, LUE (g MJ−1), WUE (kg C mm−1), NPP (kg C m−2), GPP (kg C m−2), AR (kg C m−2), and ETa (mm). The grey dots at the ends of the blue vectors represent the contributions (loadings) of various variables to the first two principal components (PC1 and PC2).
Resources 14 00087 g005
Table 1. Basic soil properties, Epicalcic Chernozem.
Depth, cmSand, %Silt, %Clay, %TextureCaCO3, %pH
0–206.068.026.0SiL7.28.0
Table 2. Total volume of surface water runoff (m3 ha−1) and amount of eroded soil (t ha−1) annually, for the period 2021–2023.
CropTillage202120222023
Surface water runoff, m3 ha−1maizeCT821.7305.8136.8
MT465.6208.9103.15
wheatCT603.377.752.5
MT375.962.238.1
Soil loss t ha−1maizeCT10.93.12.4
MT4.41.90.5
wheatCT7.70.90.6
MT2.70.40.2
ANOVA: surface water runoff; wheat significance p = 0.00013, maize significance p = 0.00020; eroded soil wheat significance p = 0.00000; maize p = 0.00000.
Table 3. Average accumulated values for the period 2021–2023: measured aboveground biomass (kg m−2), belowground biomass (kg m−2), and simulated net primary productivity (NPP), gross primary productivity (GPP), and autotrophic respiration (AR) (all in kg m−2) across crop rotations.
RotationAbovegroundBelowgroundNPPGPPAR
MT, wheat–cover crop–maize6.17 ± 0.652.53 ± 0.303.62 ± 0.386.59 ± 0.352.97 ± 0.22
CT, wheat–maize4.50 ± 0.421.84 ± 0.232.63 ± 0.254.73 ± 0.392.10 ± 0.18
ANOVA: aboveground, belowground biomass, and NPP, significance p = 0.0381; GPP significance p = 0.0072; AR significance p = 0.0115.
Table 4. Cumulative GPP—gross primary productivity (kg C m−2), NPP—net primary productivity (kg C m−2), AR—autotrophic respiration (kg C m−2), averaged for 2021–2023, CUE—carbon use efficiency.
Crops/VariantsGPPNPPARCUE
Maize CT1.57 ± 0.312.83 ± 0.441.26 ± 0.150.55 ± 0.03
Maize MT2.13 ± 0.454.01 ± 0.361.88 ± 0.220.53 ± 0.08
Wheat CT1.06 ± 0.031.91 ± 0.110.84 ± 0.080.56 ± 0.02
Wheat MT1.13 ± 0.022.03 ± 0.050.90 ± 0.050.56 ± 0.02
ANOVA: GPP tillage significance p = 0.026, crop significance p = 0.004, year NS; AR tillage significance p = 0.0313, crop significance p = 0.0009, year NS; CUE tillage NS, crop NS, year NS.
Table 5. Actual evapotranspiration (mm), water use efficiency (g C mm−1).
Crops/VariantsETaWUE
202120222023202120222023
Maize CT396.4312.6289.27.6510.008.03
Maize MT403.4323.4289.79.9613.5012.55
Wheat CT497.6424.3432.73.634.764.38
Wheat MT513.2434.9435.93.944.784.56
ANOVA: Eta—year significance p = 0.0000, crop significance p = 0.0000, tillage NS; WUE—year NS, crop significance p = 0.0427, tillage significance p = 0.0001.
Table 6. Light use efficiency (g MJ −1).
Variant/Crop202120222023
Maize CT1.783.294.12
Maize MT4.384.466.13
Wheat CT2.972.583.31
Wheat MT5.872.663.38
ANOVA: tillage, significance p = 0.0635.
Table 7. Spearman correlation matrix of CUE, LUE (g MJ−1), WUE (kg C mm−1), NPP (kg C m−2), GPP (kg C m−2), AR (kg C m−2), and ETa (mm).
GPPNPPARGUEETaWUELUE
GPP1
NPP0.951
AR0.960.871
CUE−0.130.12−0.301
ETa−0.70−0.60−0.790.501
WUE0.930.810.97−0.38−0.851
LUE0.410.340.37−0.14−0.180.331
Resources 14 00087 i001p < 0.001Resources 14 00087 i003p < 0.01Resources 14 00087 i005p < 0.05
Resources 14 00087 i002 Resources 14 00087 i004 Resources 14 00087 i006
Table 8. Component weights of PCA of CUE, LUE (g MJ−1), WUE (kg C mm−1), NPP (kg C m−2), GPP (kg C m−2), AR (kg C m−2), and ETa (mm).
ParametersComponent 1Component 2
Eigenvalues4.601.46
Percent of variance65.6520.86
AR0.4610.014
CUE−0.1940.722
ETa−0.3730.206
GPP0.4400.258
LUE0.229−0.403
NPP0.3860.454
WUE0.4630.031
Disclaimer/Publisher’s Note: The statements, opinions and data contained in all publications are solely those of the individual author(s) and contributor(s) and not of MDPI and/or the editor(s). MDPI and/or the editor(s) disclaim responsibility for any injury to people or property resulting from any ideas, methods, instructions or products referred to in the content.

