1. Introduction
The transition to a low-carbon economy has become one of the primary global challenges in mitigating climate change, driving the decarbonization of various productive sectors, including the oil and gas industry [
1]. This sector, historically carbon-intensive, faces increasing regulatory and socio-economic pressures to reduce its greenhouse gas (GHG) emissions, particularly during the exploitation process, which accounts for approximately half of the total emissions in the hydrocarbon production chain [
2]. These emissions are primarily generated by the local electricity production required to power Floating Production, Storage and Offloading (FPSO), with natural gas extracted on-site serving as the main energy source, supplemented by diesel oil in emergency situations [
3,
4].
Among the technological alternatives for reducing the carbon footprint of offshore operations, offshore wind power has emerged as a promising solution [
5,
6]. According to the Global Wind Energy Council (GWEC) [
7], global offshore wind power’s installed capacity is expected to reach 105.5 GW by 2025, reflecting the continuous advancement of this technology. Furthermore, the International Energy Agency’s (IEA) World Energy Outlook [
8] forecasts a fifteen-fold increase in global offshore wind installed capacity by 2040, preventing over 7 Gt of CO
2 emissions within the same period. This growth is largely driven by favorable public policies and the increasing economic competitiveness of the technology. In some countries, such as Denmark and the United Kingdom, offshore wind energy already represents a significant share of electricity production, surpassing that of solar photovoltaic energy, supplying 16% and 8% of the total electricity demand, respectively [
9,
10].
The ongoing advancement of offshore wind technology has significantly broadened its prospects for implementation in deeper maritime environments, particularly through the utilization of Floating Offshore Wind Turbines (FOWTs) [
11]. Since the inaugural installation of a floating wind turbine in Norway in 2009, the adoption of this technology has surged exponentially, underscoring the feasibility of offshore wind energy in intricate maritime contexts [
12].
Several nations have made considerable progress in the development of floating wind power capacity. Norway presently possesses an installed capacity of 94 MW, whereas the European Union collectively registered 27 MW by the conclusion of 2022. Despite lacking specific capacity data, France has established an ambitious target of 20 GW by the year 2050, supported by ongoing initiatives such as Floatgen. Italy achieved an installed capacity of 30 MW by the year 2022, while Portugal successfully installed 25 MW through the WindFloat Atlantic project, which is recognized as the first floating wind farm within the European Union, commencing operations in 2020. Although specific capacity figures are not provided in Spain, the DemoSATH floating wind project has recently commenced its operations. Japan is making commendable progress in the field of renewable energy. Although specific capacity figures are unavailable, the nation has set an ambitious objective of installing 10 GW of offshore wind capacity by 2030, with a long-term potential of 60 GW by 2050. Similarly, despite the absence of precise current data, the United States possesses significant potential, particularly in deep-water locations, where approximately two-thirds of its offshore wind resources are located. In China, the Qingzhou Four Project has witnessed its inaugural offshore wind turbine installation, designed to achieve a target capacity of 500 MW. Additionally, there are plans for a 1 GW floating wind farm to be established off the coast of Wanning in Hainan Province by the year 2027. Similarly, South Korea is advancing with the 99 MW Jeonnam 1 floating wind project. It aspires to reach a cumulative capacity of 14.3 GW of offshore wind power by the year 2030, which includes intentions for a 1.3 GW floating wind farm to be developed in multiple phases [
13].
As shallow-water wind resources become increasingly constrained, the industry is shifting from fixed-bottom offshore wind turbines to floating structures, allowing wind energy exploitation in deeper regions, such as the Santos Basin in Brazil [
14,
15].
However, the integration of offshore wind energy into FPSO units presents both operational and economic challenges. From a technical standpoint, the variable nature of wind power generation requires advanced solutions to ensure the stability and reliability of the FPSO unit’s electrical grid. Economically, the high capital and operational costs associated with offshore wind farms—particularly floating wind turbines—raise concerns about financial feasibility [
9].
In this context, carbon pricing mechanisms arise as a pivotal instrument for facilitating the financial viability of renewable energy integration, thereby enabling the internalization of the environmental costs associated with thermal power generation and augmenting the competitiveness of clean energy sources [
1,
5].
Worldwide, carbon pricing has been instituted through carbon taxes and cap-and-trade systems, with the objective of incentivizing emissions reductions across various sectors. The European Union Emissions Trading System stands as one of the most well-established cap-and-trade programs, establishing a benchmark for carbon markets on a global scale. Nations such as Canada, China and South Korea have similarly embraced pricing mechanisms to promote industrial decarbonization. Although carbon prices exhibit significant regional variation, elevated carbon costs typically expedite the transition to cleaner energy sources by diminishing the competitiveness of fossil fuel-based generation. In emerging markets, particularly Brazil, the development of a structured carbon market is anticipated to play a pivotal role in shaping future energy investments and advancing climate commitments [
16,
17].
Given this scenario, this study evaluates the technical and economic feasibility of integrating a floating offshore wind farm into the energy matrix of an FPSO unit operating in the Santos Basin, Brazil. Scenario modeling is conducted using the HOMER (Hybrid Optimization Model for Electric Renewables) Pro software, considering different levels of renewable energy penetration (ranging from 30% to 120% of electricity demand) and varying carbon pricing values, based on Brazilian regulations and international market trends. For each scenario, reductions in CO2 emissions resulting from wind power integration, the economic impacts of carbon credit trading (including credit purchases and sales) and key financial indicators such as Net Present Cost (NPC), Levelized Cost of Energy (LCOE), Internal Rate of Return (IRR), Return on Investment (ROI) and payback are analyzed.
The principal aim of this study is to identify the optimal configuration for reducing CO
2 emissions in FPSO operations while adhering to operational constraints and considering the distinct characteristics of the Brazilian carbon market. Furthermore, this study assesses the economic viability of decarbonizing FPSO operations. It investigates the impact of carbon pricing mechanisms on its feasibility and the incorporation of renewable energy sources. The originality of this study lies in its comprehensive assessment of floating wind power as a viable decarbonization solution for FPSO units in Brazil, a topic that is notably underexplored in the current literature. Scholars are investigating the implementation of carbon capture technologies to aid in the decarbonization of petroleum platforms [
18] and post-combustion capture [
19]. In contrast to prior research, which primarily highlights the incorporation of onshore renewable energy [
20,
21,
22,
23], this study examines the distinct technical and economic challenges related to the deployment of floating offshore wind energy within the oil and gas industry. Research demonstrates the synergistic relationship between the carbon market and renewable energy sources [
23,
24,
25,
26,
27,
28]. The novelty of this study is further emphasized by the incorporation of carbon pricing mechanisms into the financial analysis, illustrating how carbon penalties can substantially enhance the economic viability of hybrid energy systems. Moreover, the examination of offshore wind power as a specialized market for FPSO unit energy supply provides significant insights into how Brazil might leverage this technology to promote the development of a domestic offshore wind industry, consequently positioning the nation for broader adoption as the technology becomes increasingly cost-competitive.
Thus, this study seeks to identify the most effective configuration for minimizing CO2 emissions in FPSO operations, while meticulously considering operational constraints and the unique characteristics of the Brazilian carbon market. In addition to evaluating decarbonization pathways, this research thoroughly assesses the economic feasibility of integrating renewable energy sources under differing carbon pricing scenarios. The novelty of this work resides in its comprehensive, scenario-based assessment of floating offshore wind power as a decarbonization strategy for FPSO units in Brazil—a subject that remains predominantly overlooked in the existing literature. In contrast to previous studies, which predominantly focus on carbon capture technologies or the integration of onshore renewables, this research addresses the specific technical and economic challenges associated with deploying floating wind energy in offshore oil and gas operations. Furthermore, it contributes to the field by integrating a national carbon pricing mechanism within a detailed techno-economic analysis, elucidating how carbon costs can significantly enhance the financial attractiveness of hybrid energy systems. By employing HOMER Pro to simulate various decarbonization scenarios, the study quantitatively measures emissions reductions and evaluates how policy instruments such as carbon pricing influence investment decisions. These findings not only enrich the academic discourse on energy system optimization and carbon markets but also provide strategic insights for stakeholders aiming to foster a domestic offshore wind industry in Brazil and advance the country’s energy transition objectives.
2. Literature Review
The decarbonization of offshore oil and gas operations has received heightened attention as industries strive to achieve global climate targets. A primary strategy for reducing GHG emissions from offshore facilities, particularly FPSO units, entails the incorporation of renewable energy sources, such as offshore wind.
Zhou performed a comprehensive analysis of the key technologies utilized in floating offshore wind power, emphasizing their suitability for deeper aquatic environments and their economic advantages when compared to fixed structures [
29].
Lau observed that a solitary FPSO unit has the potential to emit up to 0.8 MtCO
2 annually in areas such as West Africa. He contended that the implementation of decarbonization strategies leveraging established technologies, such as offshore wind, was crucial for sustaining the social license to operate within the industry [
30].
In the context of Brazil, Carvalho estimated that wind energy projects in the states of Ceará and Rio Grande do Norte have the potential to generate 17 TWh annually, while also being capable of avoiding 8 million tonnes of CO
2 emissions each year. Furthermore, these projects could generate carbon credits valued at approximately USD 83 million per annum [
31].
Dos Santos conducted an analysis of the mechanisms governing carbon credit accounting in Brazilian wind farms operating under the Clean Development Mechanism (CDM). He emphasized the necessity for more transparent fiscal regulations and policies to incentivize increased investment in low-carbon projects [
32].
Fonseca et al. undertook a life cycle assessment of wind turbines in Northeast Brazil, revealing an energy payback time of 0.494 years and a GHG payback time of 0.755 years. This analysis exemplifies the environmental efficiency of wind technology [
33].
In conclusion, Bassey advocates for a comprehensive decarbonization strategy for offshore oil platforms, which encompasses renewable energy sources, hybrid systems, carbon capture technologies and operational enhancements. Furthermore, he emphasizes the critical role of economic and regulatory frameworks [
34].
3. Materials and Methods
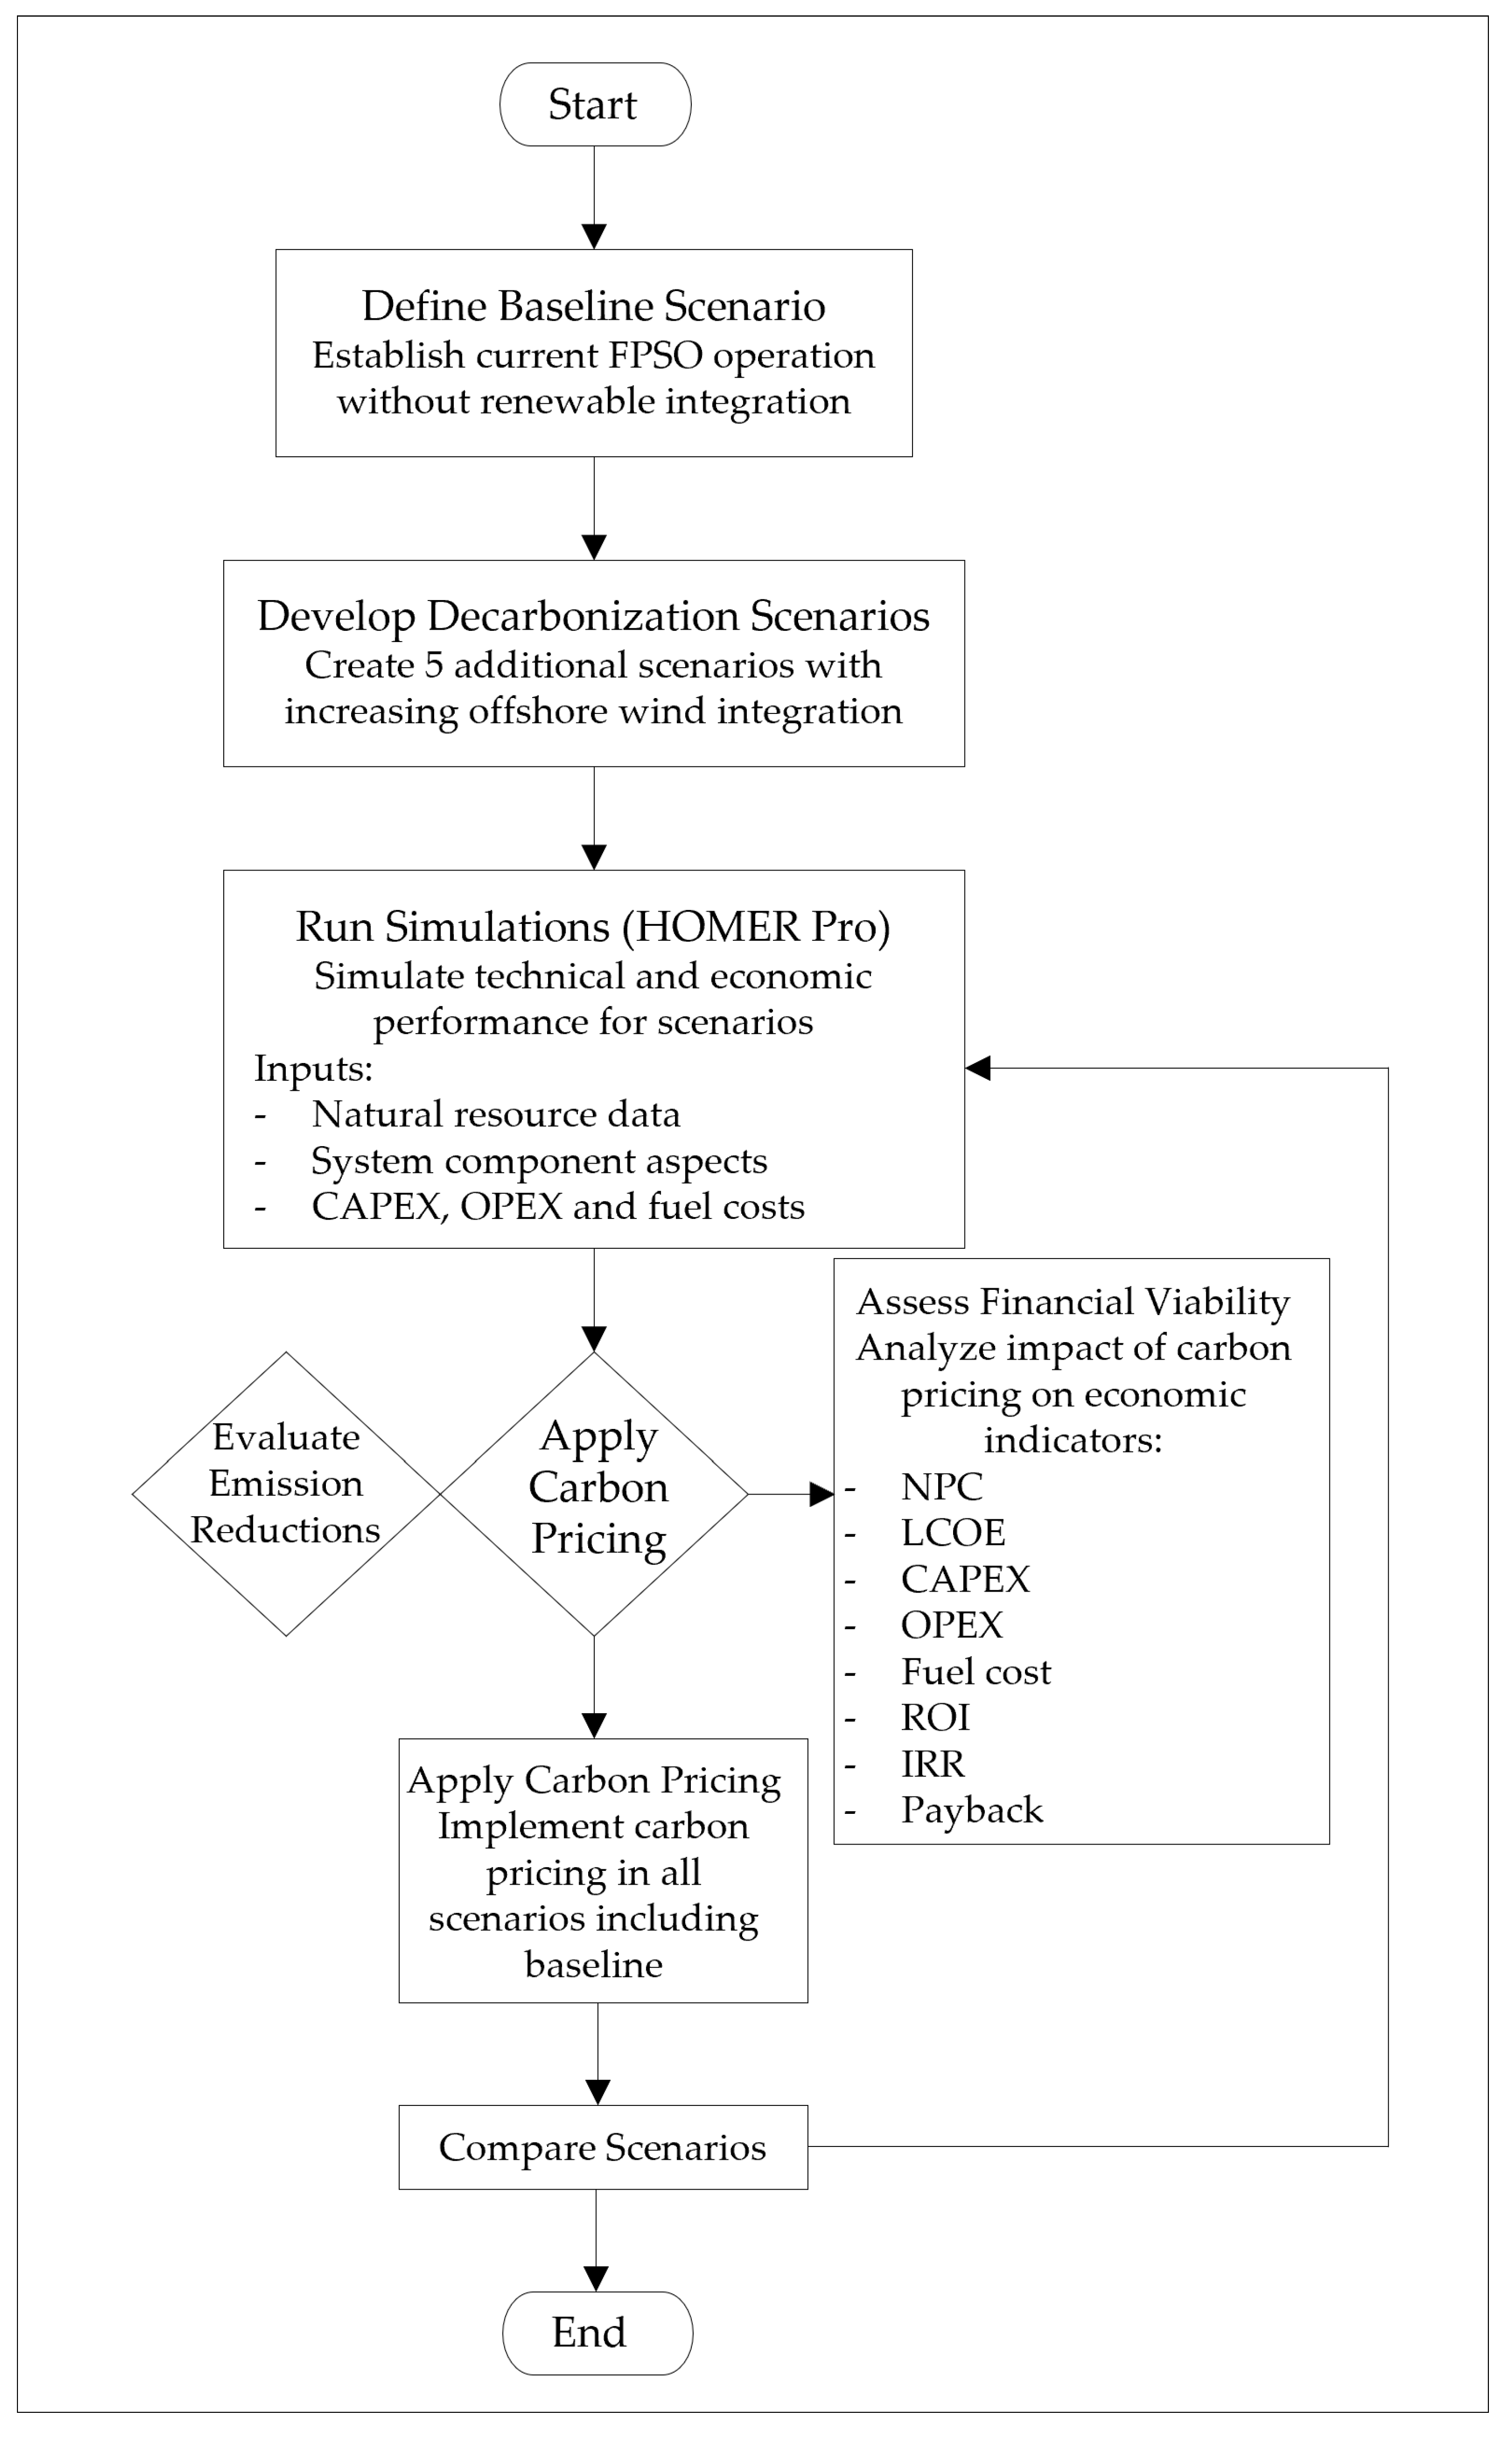
This study employed a scenario-based methodology to assess the decarbonization potential of FPSO operations. Initially, a baseline scenario was established, which reflected the current operational conditions, devoid of renewable energy integration. Subsequently, five additional scenarios were developed for sensitivity analysis, progressively integrating floating offshore wind power. This methodological approach facilitated a systematic evaluation of the influence of renewable energy penetration on CO2 emissions, thereby quantifying the degree of emissions reduction as the proportion of wind energy escalates.
Upon evaluating the outcomes of decarbonization, a carbon pricing mechanism was implemented in each scenario, including the baseline. Subsequently, the financial viability of each case was analyzed, scrutinizing the effects of carbon pricing on key economic indicators. This phase facilitated a comparative assessment of how carbon costs impact the feasibility of integrating renewable energy sources into FPSO operations.
To optimize system configurations across various scenarios, a modeling and simulation process was executed utilizing HOMER Pro software. This tool was employed to evaluate the technical and economic viability of integrating floating offshore wind power into FPSO energy systems. The analysis encompassed detailed input parameters, which included the availability of renewable resources, specifications of system components and financial metrics such as Capital Expenditures (CAPEX), operational expenditures (OPEX) and operational costs [
35]. The optimization process guaranteed a thorough evaluation of system performance under distinct decarbonization and carbon pricing conditions [
36].
Figure 1 provides a comprehensive flowchart of the methodology employed in this study, delineating the steps undertaken to evaluate the decarbonization potential of FPSO operations in a clear and sequential manner. The diagram depicts the progression of the process, beginning with the definition of the reference scenario, advancing to the development of scenarios characterized by the gradual integration of floating offshore wind energy and culminating in the simulation and technical–economic analysis incorporating the application of carbon pricing. This methodological framework facilitated a systematic visualization of the modeling and decision-making processes, thereby reinforcing the results articulated throughout the study.
3.1. Case Study Analysis: Scope and Context
This section provides an overview of the FPSO unit’s location and site characteristics, the natural resources considered, key elements of the energy system, economic and design parameters and the structure and dynamics of Brazil’s carbon credit market.
3.1.1. FPSO Location and Site Characteristics
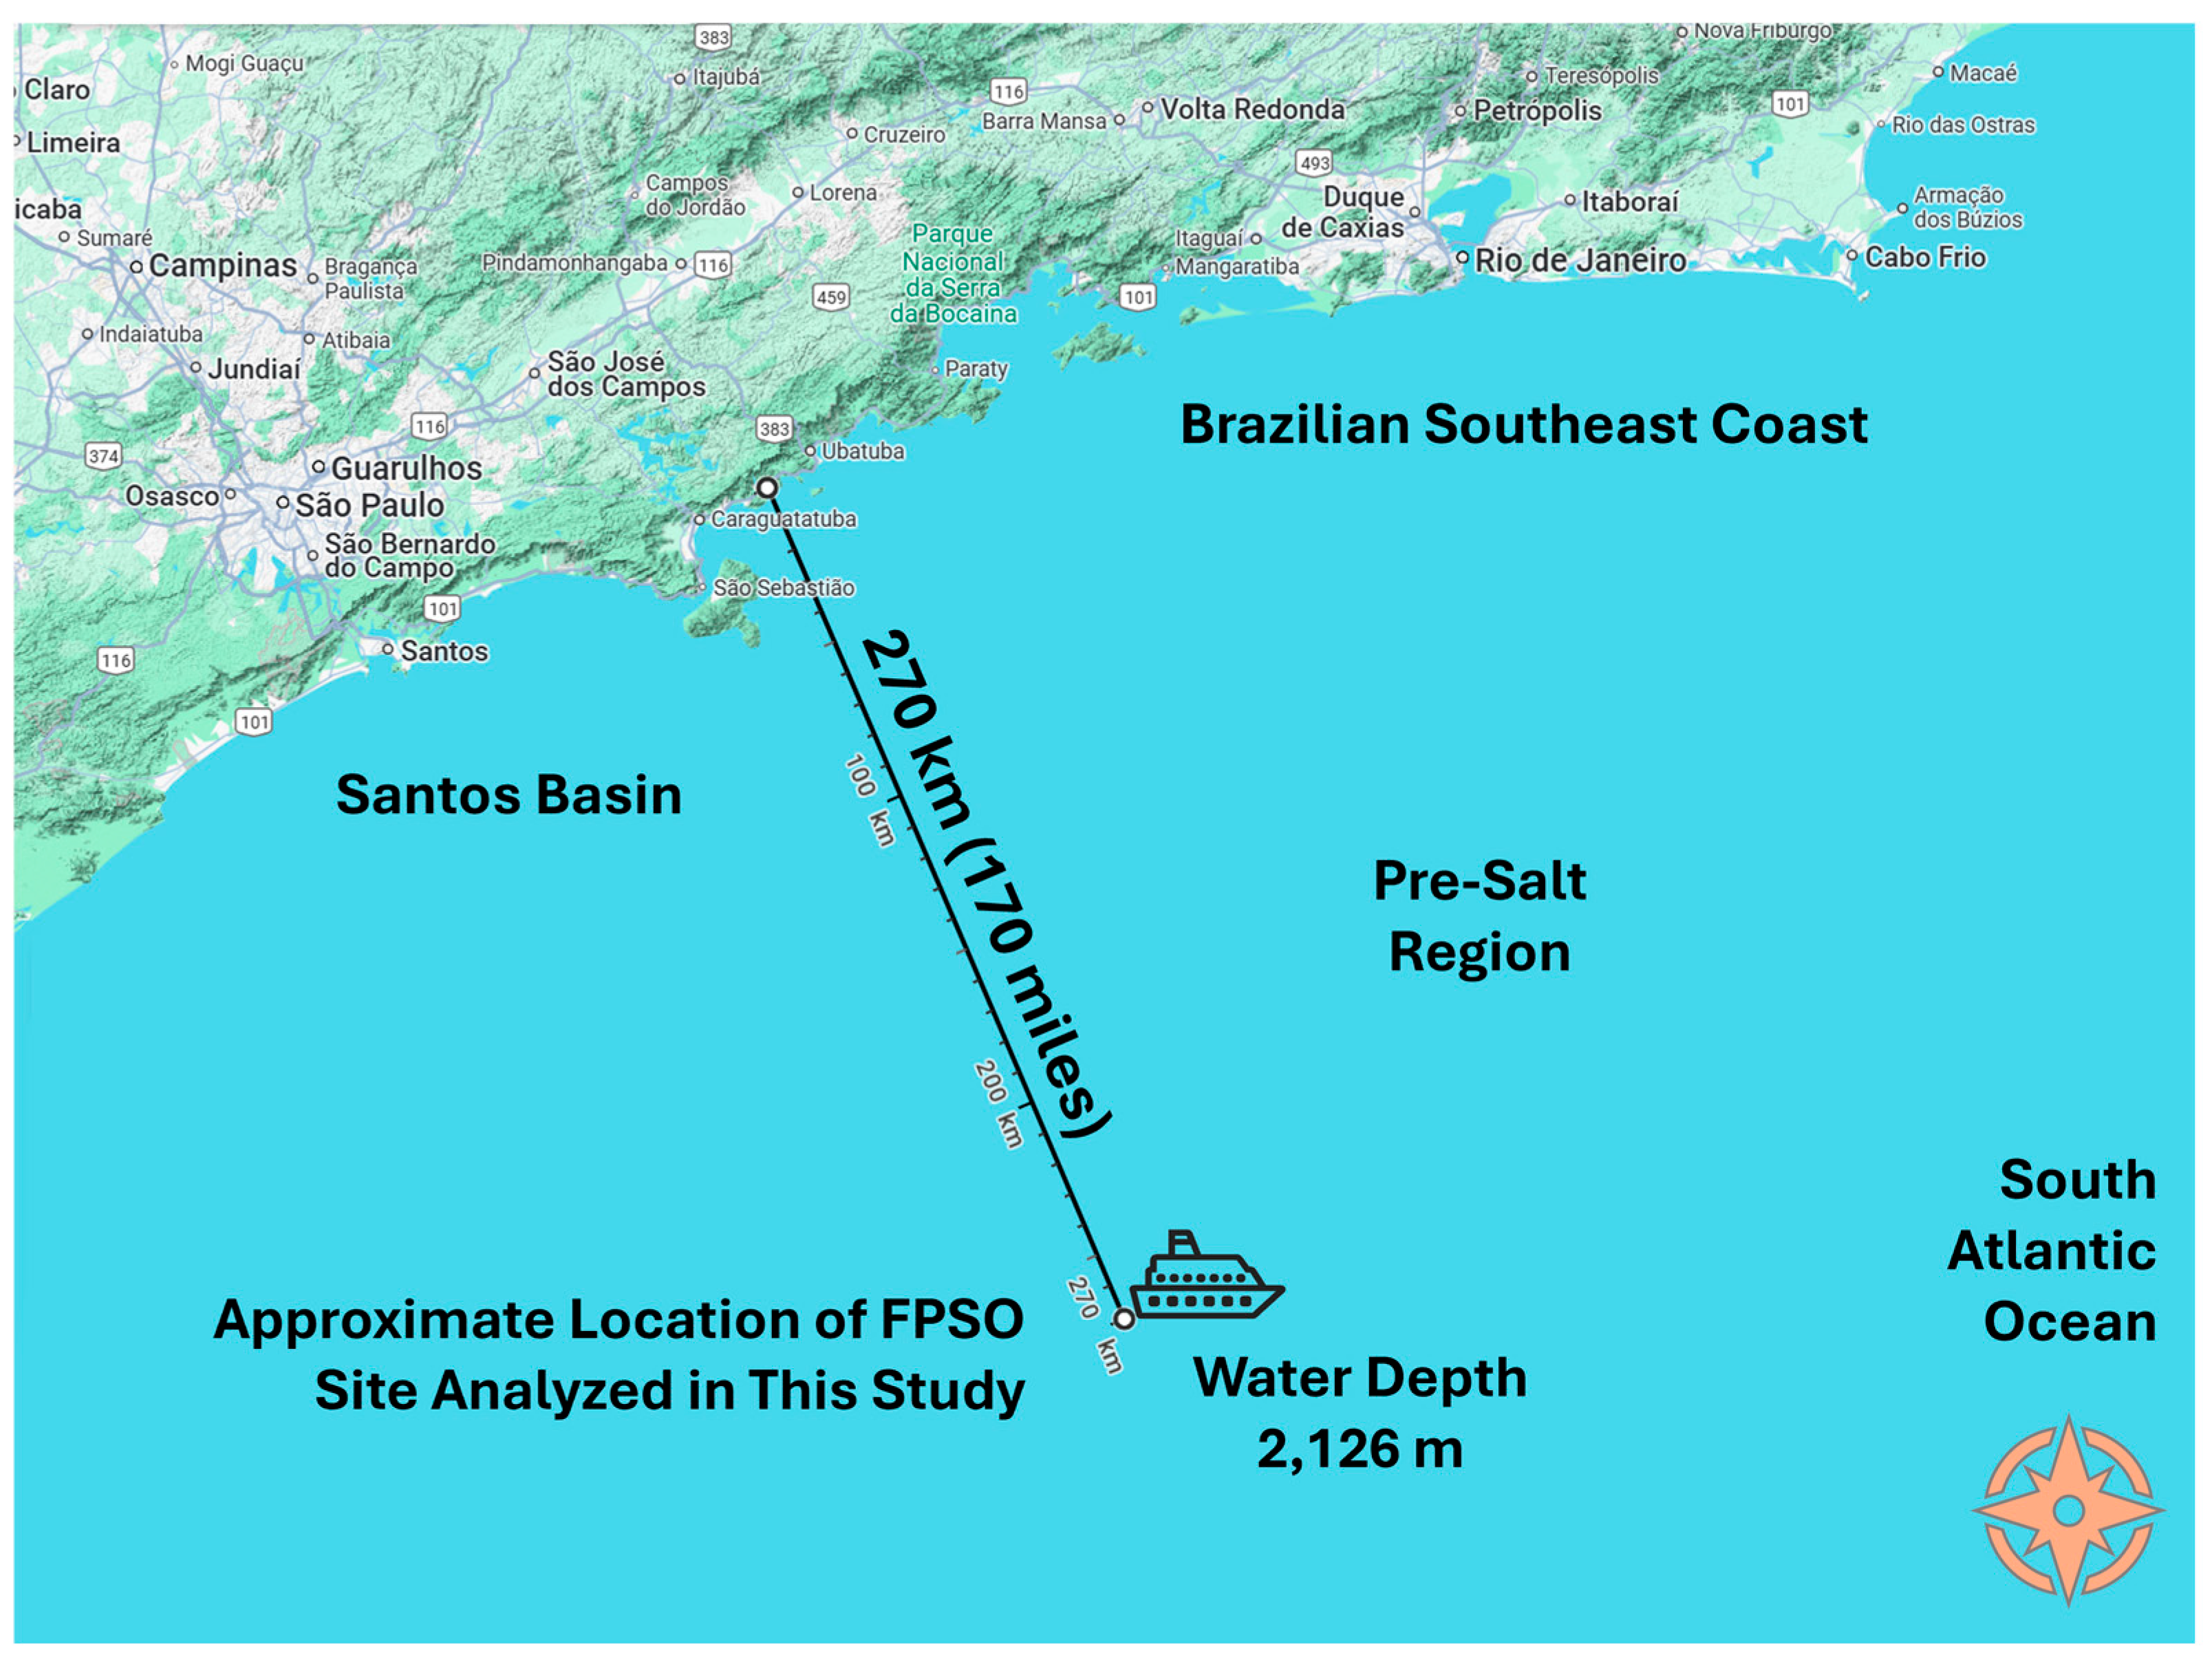
The FPSO unit Cidade de Caraguatatuba MV27 operates in the “pre-salt” region of the Santos Basin, situated off the coast of Brazil. It was deployed to the Lapa Oil Field, a deep-water reservoir within the pre-salt Guaratiba Group of the South Atlantic Santos Basin, located approximately 270 km (170 miles) offshore from São Paulo. As a result, it relies entirely on its own electrical energy, with no external connection to the electrical grid.
Figure 2 illustrates the approximate location of the FPSO site analyzed in this study.
3.1.2. Natural Resources: Wind and Natural Gas
The natural resources utilized within FPSO systems, encompassing wind data and natural gas resources, are pivotal for their functionality and efficiency.
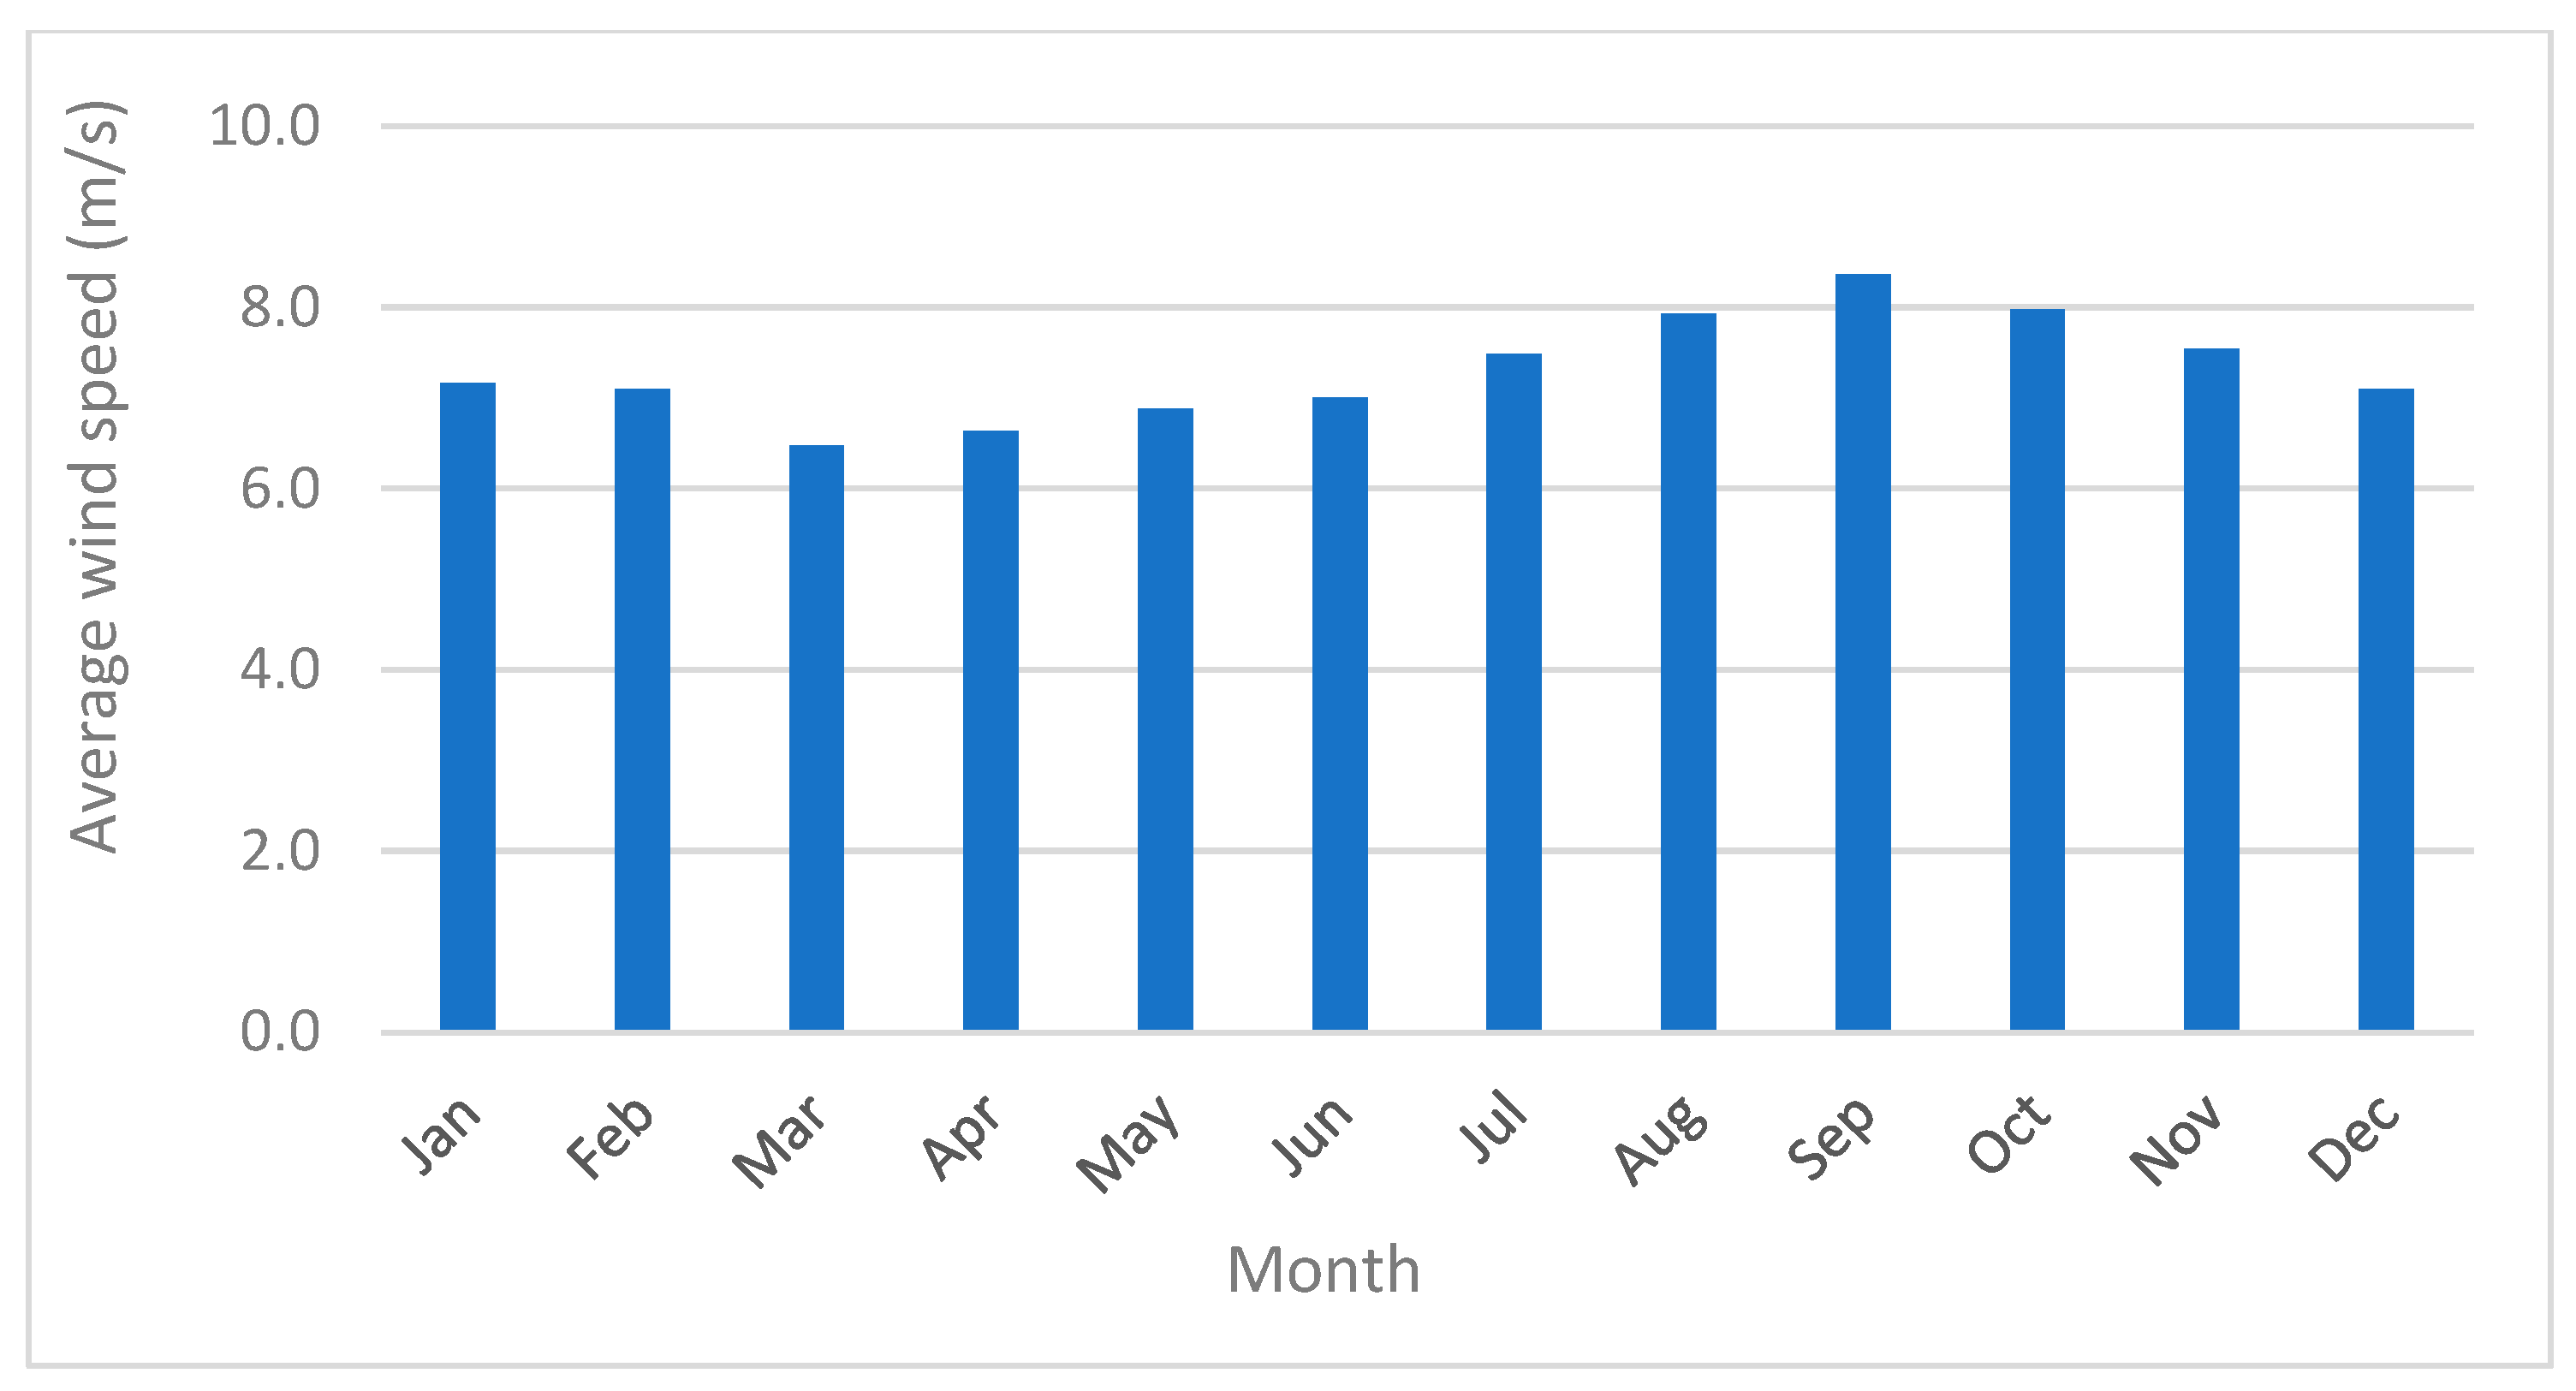
The wind resource data for this study were derived from NASA’s climate database, using the specific coordinates of the FPSO Cidade de Caraguatatuba MV27 unit’s location. The baseline dataset used in HOMER consisted of a one-year time series of monthly average wind speeds, measured in meters per second (m/s).
Figure 3 illustrates the average wind speed at the designated study location, quantified in meters per second (m/s). These data served as crucial parameters for evaluating the potential of wind resources, as wind speed has a direct impact on the energy output and viability of wind power initiatives.
The average monthly wind speed and air temperature were based on a 30-year historical dataset. At a height of 150 m above ground, the average wind speed recorded at the study site was 7.31 m/s, with an average air temperature of 23.18 °C. These conditions suggest a favorable environment for wind energy generation, as the wind speeds fall within the optimal range for the efficient operation of Floating Offshore Wind Turbines.
The FPSO unit does not procure natural gas; rather, it utilizes the gas that is extracted directly from its platform for operational purposes in its gas turbines. Consequently, the cost associated with natural gas is solely represented by the extraction expenses, quantified as 0.12649 USD/m
3 [
38].
3.1.3. Key Elements of Energy System
This item delineates the essential components of the energy system and provides a comprehensive analysis of the parameters associated with each energy source, including wind and gas turbines. Furthermore, it encompasses the energy demand profile, and the economic factors involved.
The main electrical power generation system consisted of four fuel aero-derivative Gas Turbine Generator sets, each rated at 30 MW at a design temperature of 30 °C, typically supplying power at 13.8 kV, 3-Phase, 3-Wire and 60 Hz for the FPSO facility. One of the Gas Turbine Generators (GTGs) serves as a standby unit. The generator requires a 50% minimum load for optimal performance and has a lifetime of 131,400 h (about 15 years), with a minimum runtime of 30 min. Additionally, the generator is equipped with mechanisms to assist in voltage and frequency stability, ensuring the smooth and continuous operation of the electrical system. The initial expenditure associated with the gas turbine amounted to USD 25,862,068.97 [
39]. Following the conclusion of its useful life, the expense for replacement was regarded as equivalent to the initial acquisition cost. The operational and maintenance cost was USD 295.23 per hour of operation [
39]. The parameters of the gas turbine employed are summarized in
Table 1.
The wind turbine considered in this model was of type 4, where the electric generator is connected to the grid through a full-scale converter, and there is no direct AC coupling between the generator and the grid. Its generator is a Permanent Magnet Synchronous Generator (PMSG), connected to a converter known as the Machine-Side Converter, which rectifies the voltage and is linked to a DC bus connected to the Grid-Side Converter. Both converters are two-level Voltage-Source Converters (VSCs). After the converter, there is a filter and a step-up transformer to match the output voltage to the FPSO unit’s voltage bus of 13.8 kV. The turbine’s operational lifetime is 20 years and its hub height is 97.5 m. Each unit of the wind turbine possessed a capacity of 1000 kilowatts. The initial investment required for a single wind turbine amounted to USD 2,873,563.22, calculated at a rate of USD 2873.56 per kilowatt [
39]. The wind farm would be equipped with multiple turbines in accordance with the specified schematic to achieve the desired output power. At the end of its useful life, the replacement cost will be equivalent to the initial acquisition cost. The annual operational and maintenance expenses totaled USD 174,329.50 for each year of operation [
39]. Multiple turbines were integrated to establish the modeled wind farm, specifically designed to fulfill the requisite power demands for each scenario.
Approximately 97% of the load was continuous, related to oil and gas extraction, while 3% was intermittent, related to the operations of the FPSO unit, such as lighting and elevators. The load was predominantly composed of induction machines, such as compressor motors and seawater lift pump motors. The loads were distributed across several voltage levels: 13.8 kV, 6.6 kV and 0.460 kV. Therefore, voltage transformers were also used to distribute energy from the higher voltage bus to these lower voltage levels. The system’s scaled annual average load was 1,987,200 kWh/day, with peak demand reaching 84,245.24 kW and a load factor of 98%.
The project evaluated several key parameters to ensure thorough economic and design assessments. An 8% real discount rate was employed, determining the present value of future cash flows. The project lifetime was set at 30 years, aligning with the typical operational lifespan of infrastructure investments in the energy sector, ensuring a comprehensive analysis of its full economic and functional duration. Furthermore, the US Dollar (USD) was the currency utilized, offering a standardized and internationally recognized unit for financial assessments and cost comparisons. These parameters create a strong basis for assessing the project’s feasibility and long-term sustainability. In conclusion,
Table 2 delineates the initial investment, replacement expenses and operational and maintenance costs related to a 30 MW natural gas turbine and a 1 MW wind turbine.
3.1.4. Structure and Dynamics of Brazil’s Carbon Credit Market
This item outlines the structure and dynamics of Brazil’s emerging carbon market, which is expected to play a significant role in the country’s energy transition.
The Brazilian carbon market primarily focuses on the Brazilian GHG Emissions Trading System (ETS), which will operate as a cap-and-trade mechanism similar to those implemented in other nations. The ETS will establish emission caps for regulated sectors and facilitate trading Brazilian Emissions Quotas (BEQs). Companies emitting below the designated cap will be permitted to sell their surplus credits, while those exceeding the established limits must purchase credits to ensure compliance.
This system applies to entities that emit more than 25,000 tons of CO2 equivalent annually. It requires them to reconcile their emissions with BEQs and permits partial compensation through Verified Emissions Reduction or Removal Certificates (VERCs) sourced from the voluntary market.
To ensure compliance, companies must register with the ETS, accurately measure and verify their emissions, fulfill their obligations regarding the delivery of BEQs and VERCs and devise strategies for reducing emissions through sustainable practices, such as adopting cleaner technologies or enhancements in energy efficiency. Engaging in the emissions trading market is imperative, enabling companies to purchase or sell carbon credit according to their specific needs and reduction objectives.
As Brazil’s carbon market progresses, carbon pricing remains somewhat speculative, yet it may ultimately conform to international trends. In voluntary markets, prevailing prices generally range from USD 10 to USD 80 per ton of CO
2 [
16], whereas the anticipated national ETS, expected to be implemented by 2025, may initially establish prices between USD 10 and USD 30 per ton of CO
2, varying according to sectoral caps and allowances. These prices are projected to increase as reduction targets become more stringent. Companies are encouraged to remain informed about ETS standards and regulations to ensure compliance and contribute effectively to Brazil’s efforts to reduce greenhouse gas emissions.
The parameters of the Gas Turbine Generator are inextricably linked to the calculation of CO2 emissions, as they delineate the baseline fuel consumption and the corresponding emission levels. In the alternative scenarios developed in this study, the incorporation of floating offshore wind power decreased the operational hours and load demand on the gas turbine, resulting in diminished fuel usage and, consequently, reduced emissions. This reduction in emissions bolsters the objectives of the carbon market by minimizing the quantity of emission allowances that be procured or offset. Consequently, the economic viability of hybrid renewable energy systems is augmented under carbon pricing mechanisms. This reinforces the central assertion of the study—that the integration of renewable energy can substantially contribute to the decarbonization of FPSO operations within carbon-constrained regulatory frameworks.
3.2. Scenario Proposals
The methodology involved generating and evaluating six distinct scenarios. Each scenario varied by the penetration level of wind energy, ranging from 30% to 120% of the energy demand, and carbon pricing, reflecting values influenced by the recently established Brazilian carbon credit market framework. Key performance metrics, including reductions in CO2 emissions, the economic impacts of carbon credit trading (purchase and sale of credits) and financial indicators such as NPC, CAPEX, OPEX, LCOE, IRR, ROI and payback, were systematically analyzed for each scenario.
Description of Scenarios 1 to 6
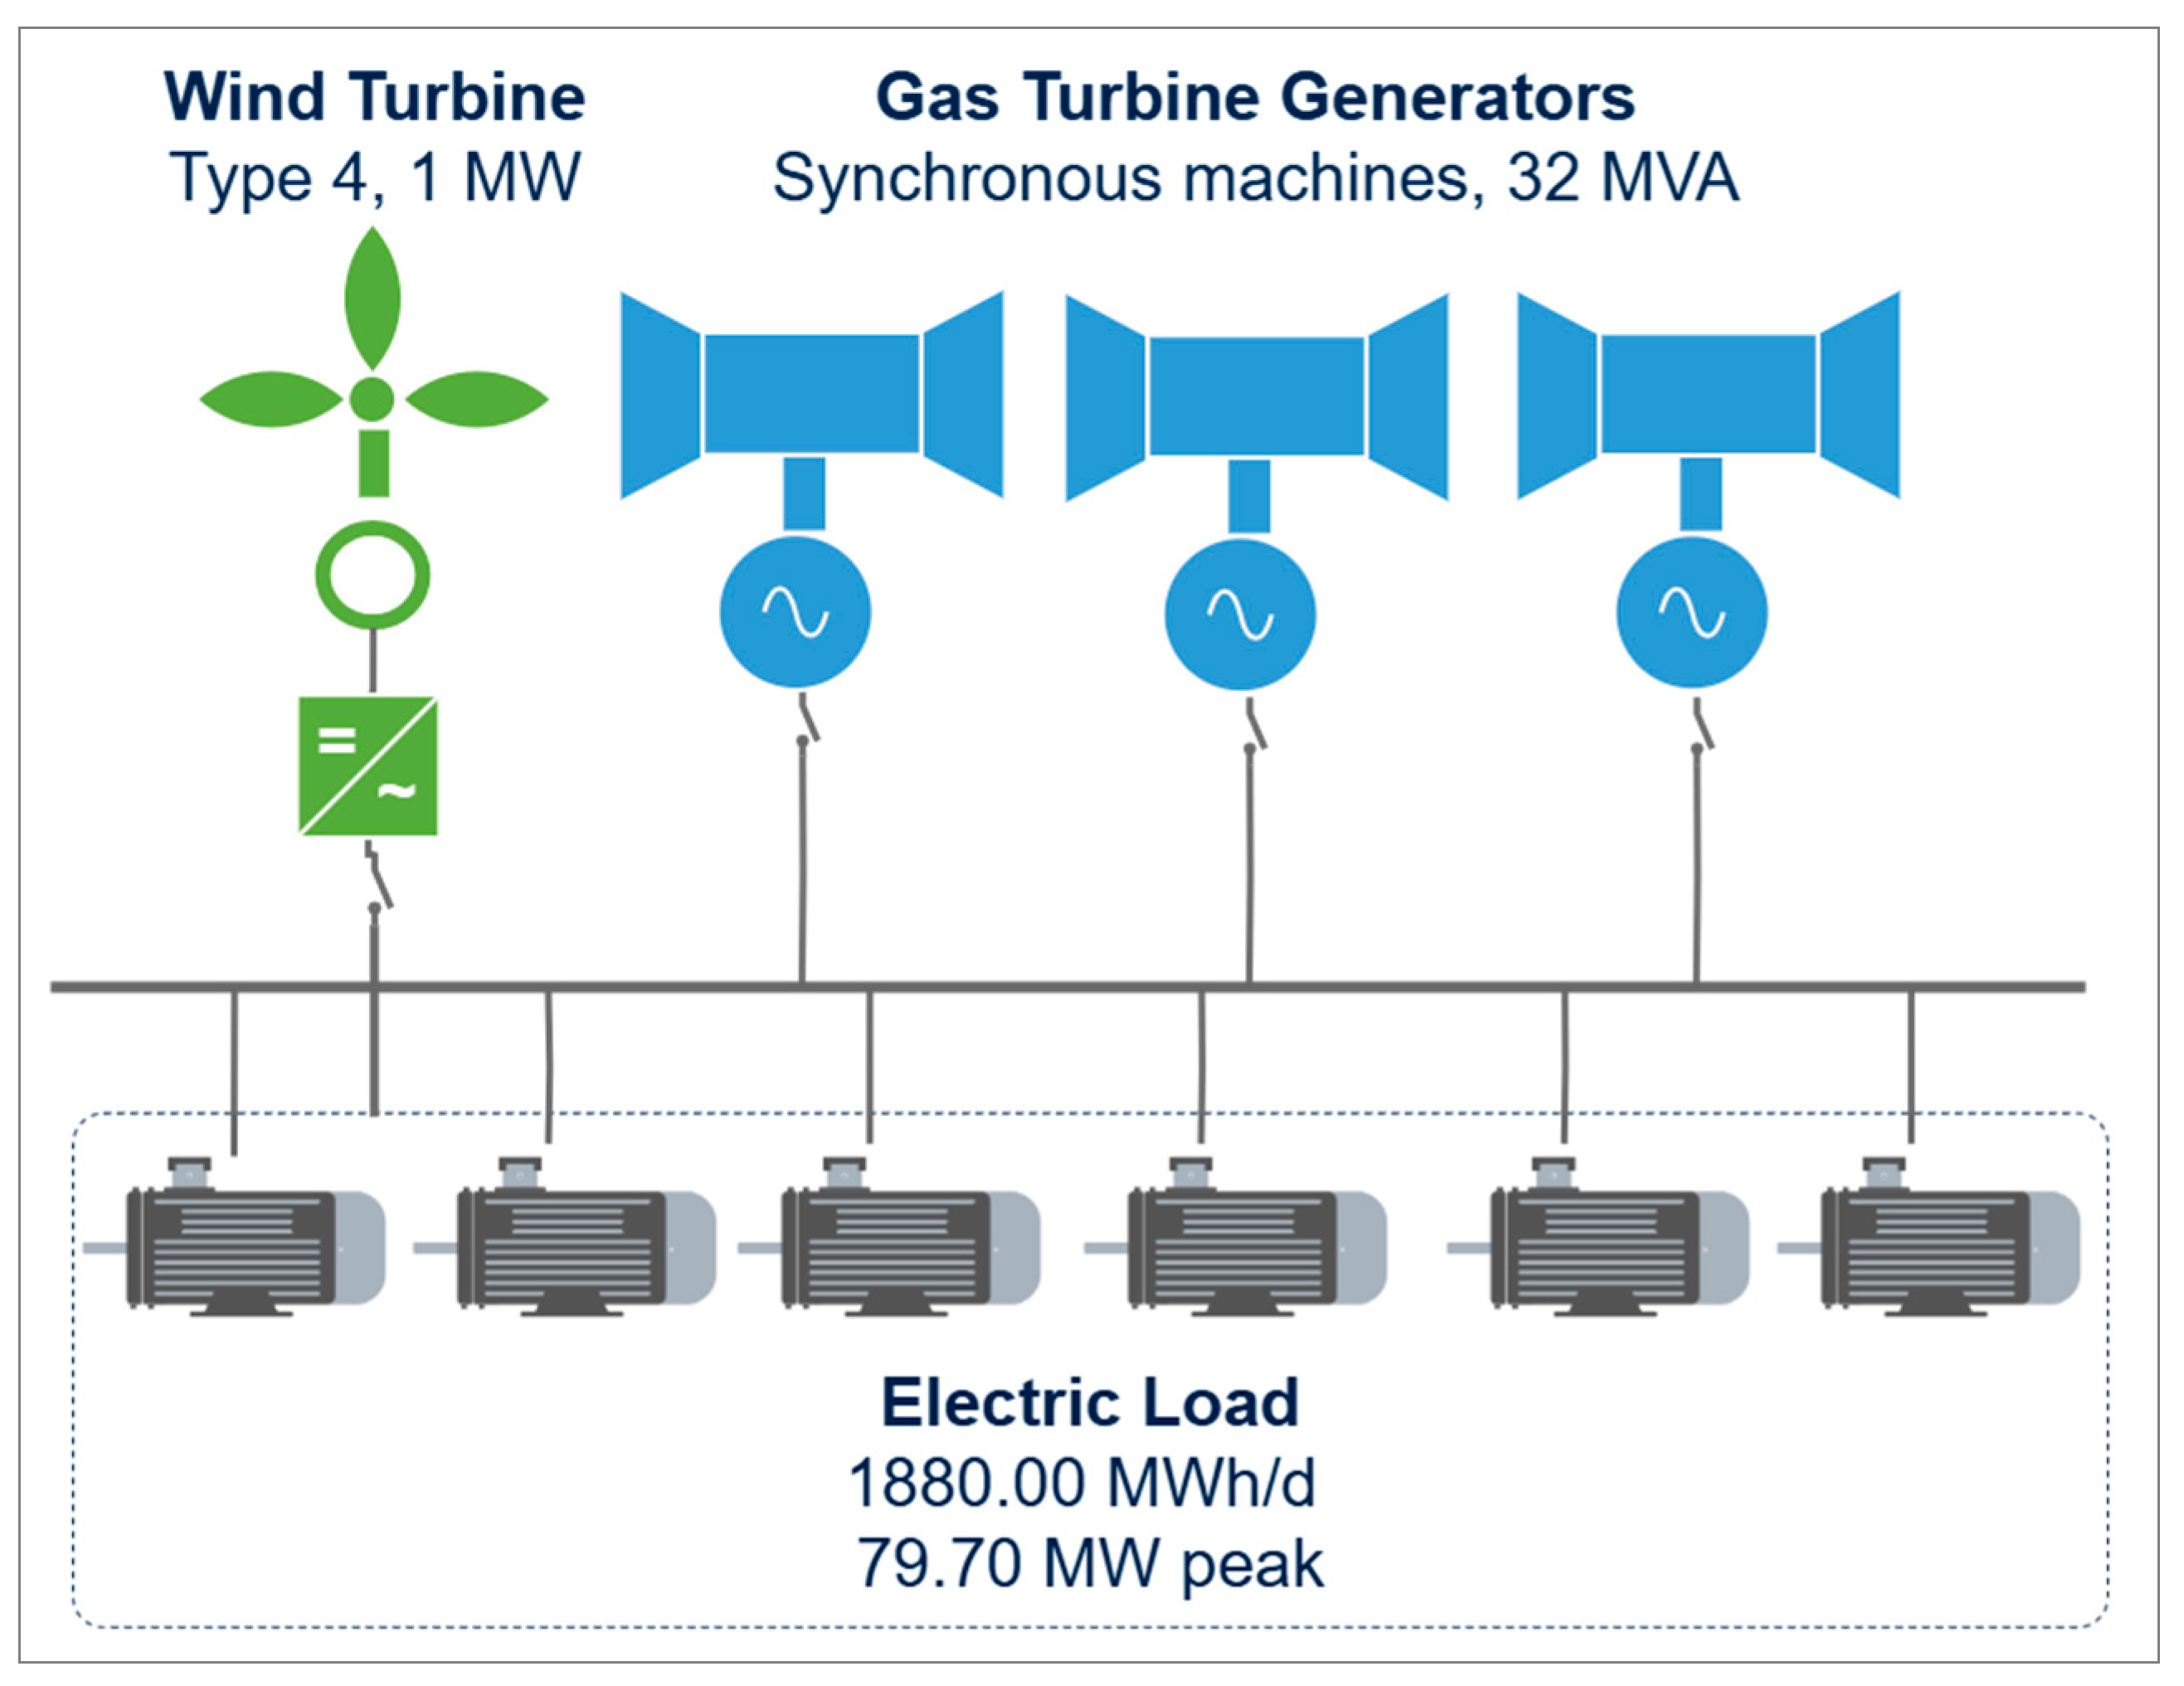
The initial scenario established was the baseline, which consisted solely of three GTGs. This scenario exemplified the fundamental operational framework of the FPSO unit, wherein energy requirements are comprehensively satisfied by the utilization of the three Gas Turbine Generators. It functioned as a critical reference point for assessing the ramifications associated with the incorporation of wind energy.
Figure 4 illustrates the baseline configuration diagram, which provides a comprehensive overview of an electric load totaling 1880.1 MWh per day and a peak load of 80 MW.
The subsequent scenarios were founded upon the initial case, incorporating a floating wind farm that was meticulously designed to enhance the decarbonization of the FPSO system and to effectively mitigate CO
2 emissions.
Figure 5 presents the schematic representation of the proposed system architecture. In each successive scenario, the installed capacity of the floating wind farm was systematically expanded by increasing the number of turbines. This gradual capacity augmentation conformed to a structured methodology, as delineated in this section, with the aim of assessing the cumulative impacts on operational efficiency and emissions reduction, as guided by the theoretical and practical framework proposed in [
40].
In Scenario 1, 30% of the FPSO unit’s energy demand was fulfilled by the floating offshore wind power plant (WPP), while the GTGs addressed the remaining 70%. Scenario 2 enhanced the WPP’s contribution to 50% of the energy demand, indicating a significant shift towards the integration of renewable energy, with the GTGs providing the remaining 50%. In Scenario 3, the penetration of the WPP escalated to 70%, thereby reducing the contribution of the GTGs to merely 30% of the FPSO’s energy requirements. Scenario 4 exhibited the FPSO’s entire energy demand being completely satisfied by the WPP, with the GTGs serving as backup power sources, consequently eliminating dependence on fossil fuels under optimal conditions. Finally, Scenario 5 amplified the WPP capacity to 120%, producing surplus energy that could be traded, resulting in economic advantages and enhanced system resilience.
Table 3 comprehensively summarizes all the scenarios analyzed within this study’s scope.
A sensitivity analysis was proposed to assess the economic and financial viability of integrating wind farms, contingent upon implementing penalties for CO2 emissions. Consideration was given to penalty values of USD 10, USD 20, USD 30, USD 40 and USD 50 per ton of CO2, while the effects of this pricing structure were evaluated across various scenarios of wind energy penetration. This analysis aimed to offer insights into the influence of carbon pricing on the feasibility of wind energy deployment.
The selection of carbon price values ranging from USD 10 to 50 per ton of CO
2 was founded upon international benchmarks and policy-relevant literature [
41,
42]. This interval was chosen to include a baseline scenario, devoid of carbon pricing, which mirrored the existing circumstances in numerous emerging economies [
17], including Brazil, as well as a progressive scale of penalties that correspond with the lower thresholds recommended by global institutions such as the World Bank and the OECD to attain climate mitigation objectives. The incorporation of this spectrum facilitated a systematic sensitivity analysis designed to identify economic tipping points at which carbon pricing begins to substantially enhance the financial viability of floating wind integration. Furthermore, it permitted an examination of how varying levels of carbon pricing affect essential financial metrics, including NPC, ROI and payback period, across diverse wind penetration scenarios.
It is crucial to underscore that the scenarios, modeling framework and sensitivity analyses delineated in this study were exclusively developed by the authors. While a portion of the technical and economic data was sourced from the literature to guarantee methodological rigor and replicability, the simulation strategy, the implementation of carbon pricing across all scenarios and the evaluation of its effects on essential financial indicators represent original contributions. This customized methodological approach, facilitated by the utilization of HOMER Pro, enabled a thorough assessment of system performance and economic viability across various decarbonization pathways, thereby bolstering the scientific contribution and originality of the study.
4. Results and Discussion
The
Section 4 elucidates the effects of floating wind power on reductions in CO
2 emissions from FPSO units, while also assessing the economic viability of various deployment scenarios. The findings underscore the pivotal influence of carbon pricing mechanisms in augmenting the financial performance of hybrid energy systems. Notably, elevated carbon penalties markedly enhance economic indicators such as IRR, ROI and payback periods.
4.1. Analysis of Preliminary Results
The outcomes of the analysis pertaining to fuel consumption, cost savings and reductions in CO
2 emissions across the evaluated scenarios are delineated below. In the examination of the six scenarios, the preliminary simulation results include the following techno-economic indicators: NPC, LCOE, annual operating cost, CAPEX, annual fuel cost and OPEX. All our findings are exhibited in
Table 4.
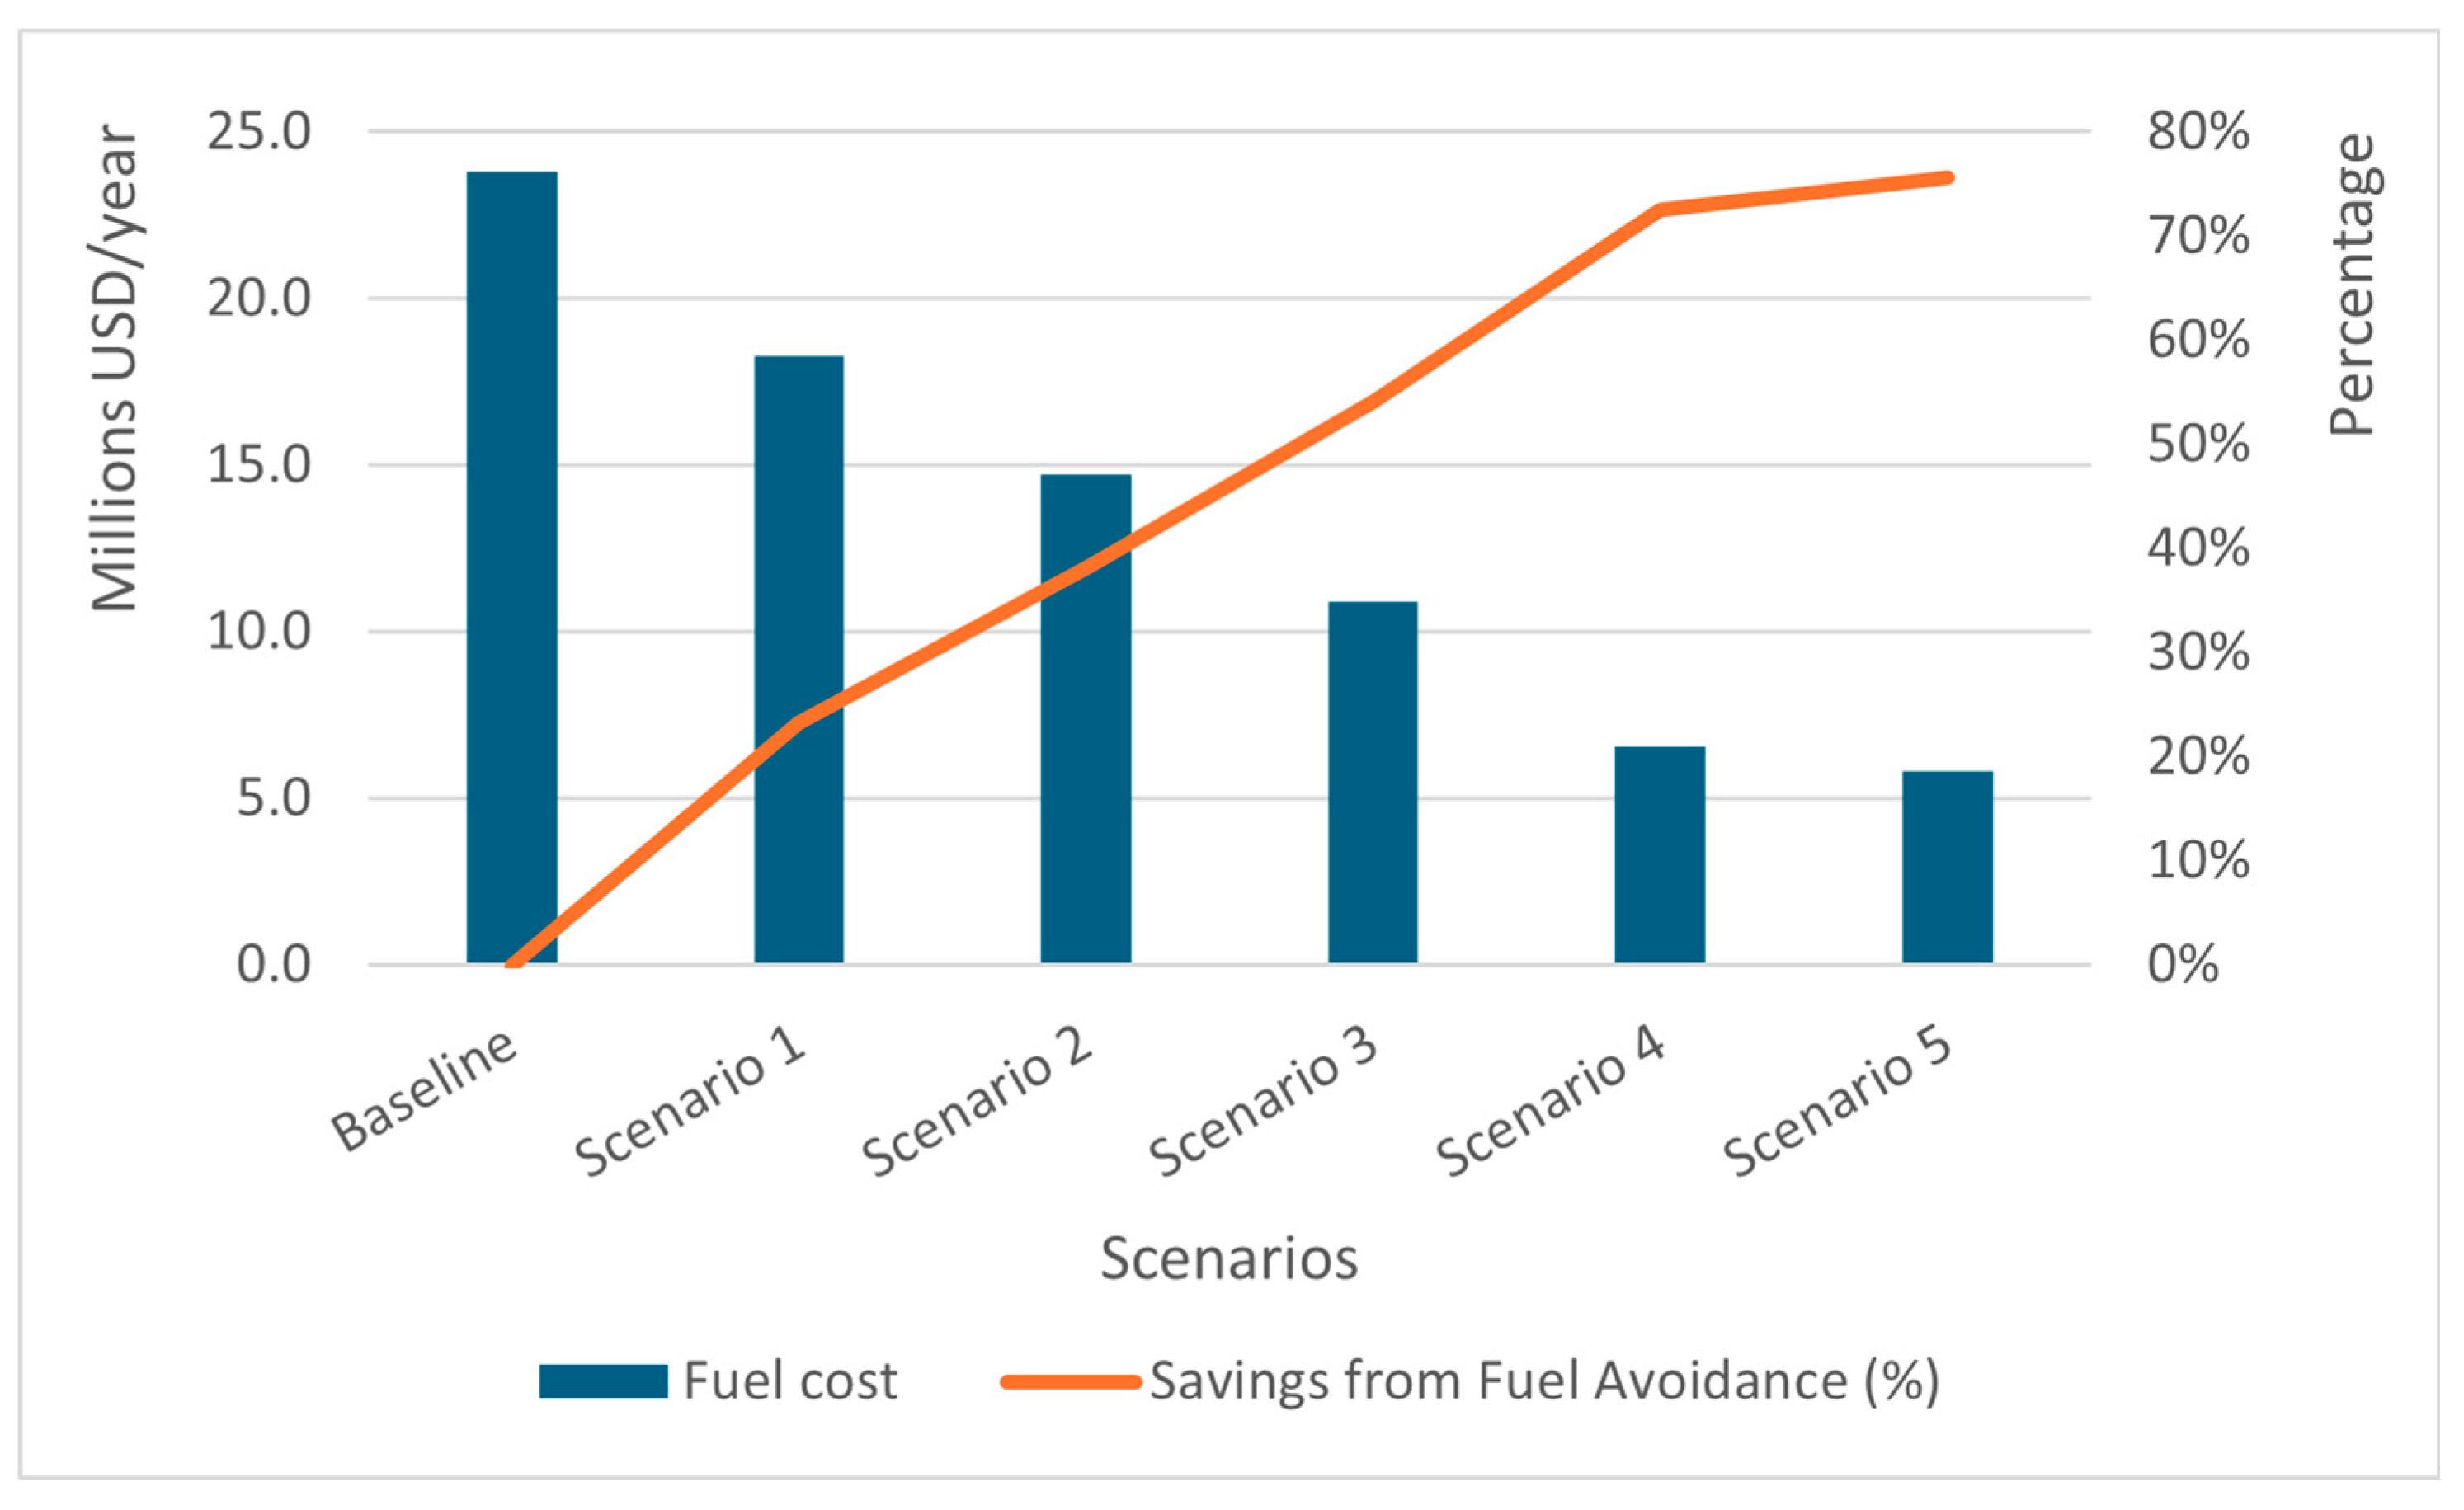
To assess the economic impacts of the proposed decarbonization strategies, fuel cost reductions and corresponding savings percentages are shown in
Figure 6, while
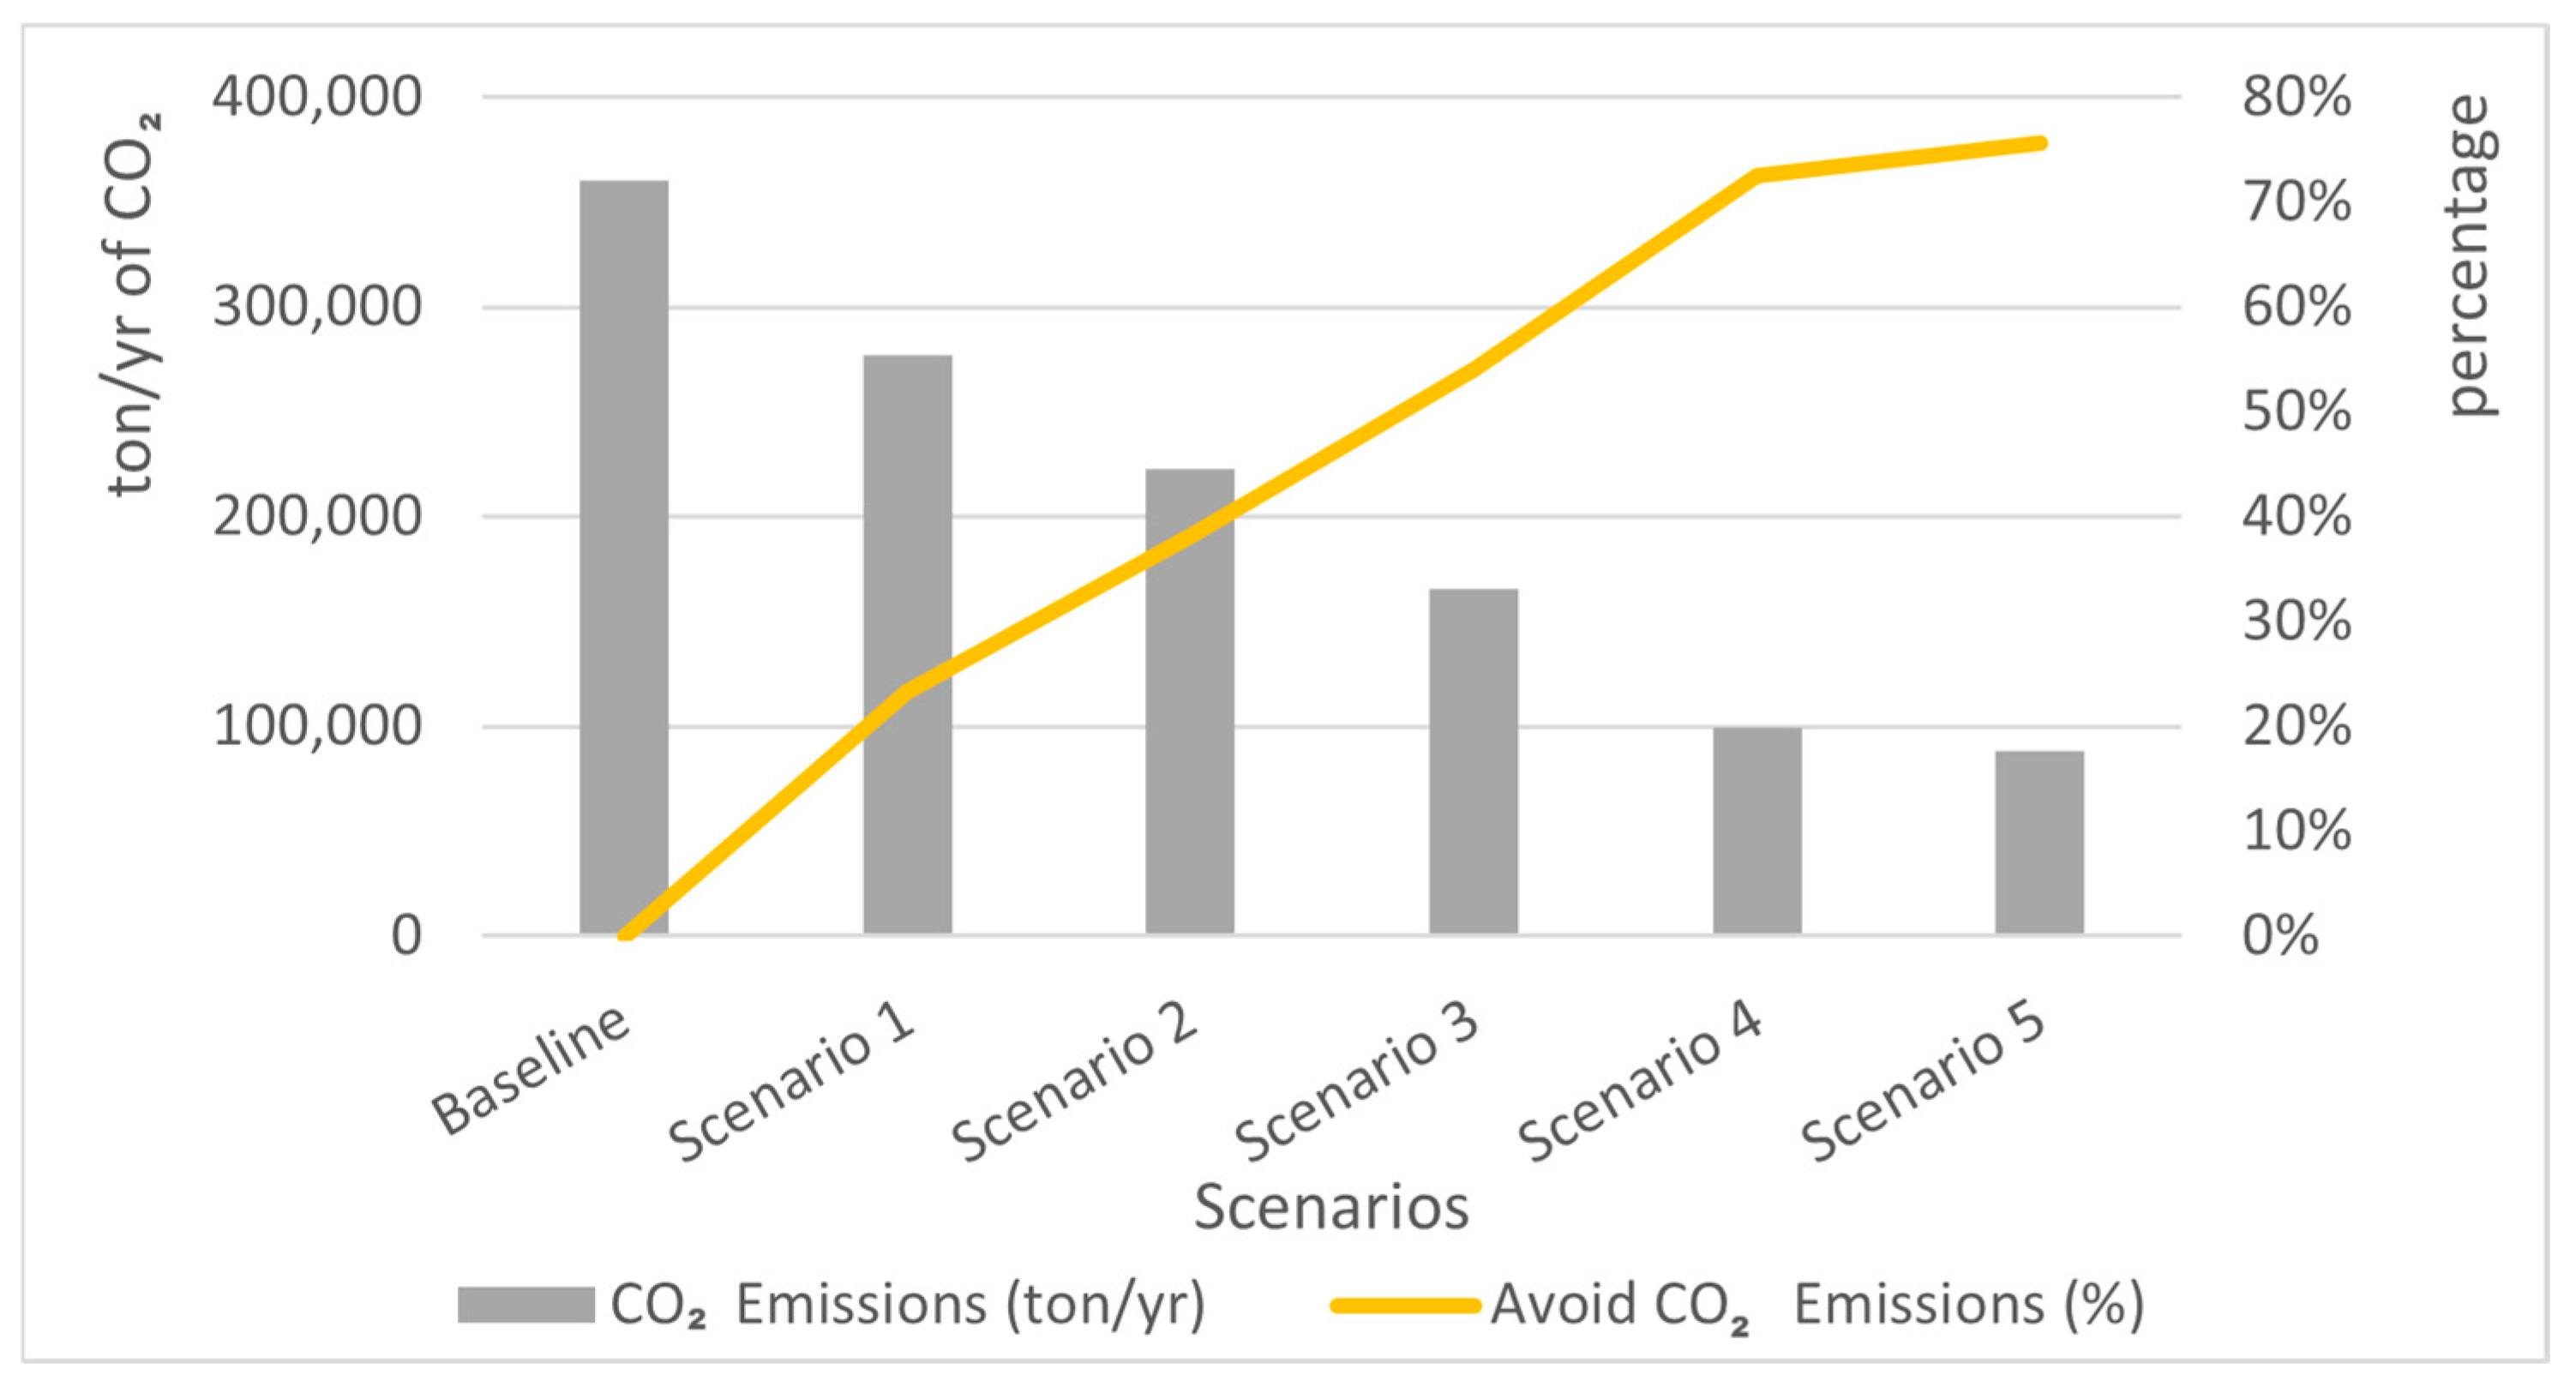
Figure 7 illustrates the associated reductions in CO
2 emissions. Notably, the highest reductions in fuel consumption and emissions were observed in Scenario 4 and Scenario 5, reaching 72% and 76%, respectively. Based on the scenarios outlined in
Table 1, annual CO
2 emissions in the base case scenario are estimated at 360,557.6 tons. The integration of the wind farm across Scenarios 1 to 3 demonstrated a progressive and significant mitigation potential. Specifically, Scenario 1 yielded a 23% reduction in CO
2 emissions, Scenario 2 achieved a 38% decrease and Scenario 3 resulted in the greatest reduction, lowering emissions by 54%.
The ability to mitigate CO2 emissions retained significance across all scenarios. A distinct trend emerged: the increased penetration of wind farms was associated with greater reductions in fuel consumption and diminished CO2 emissions. Nevertheless, when comparing Scenarios 4 and 5, the difference in emissions reduction was negligible. Beginning with Scenario 4, the wind farm generated an excess of energy beyond what was required for its load, leading to energy losses. Specifically, Scenario 4 reported a clipped energy percentage of 5.1%, while Scenario 5 indicated a clipped energy percentage of 15.21%.
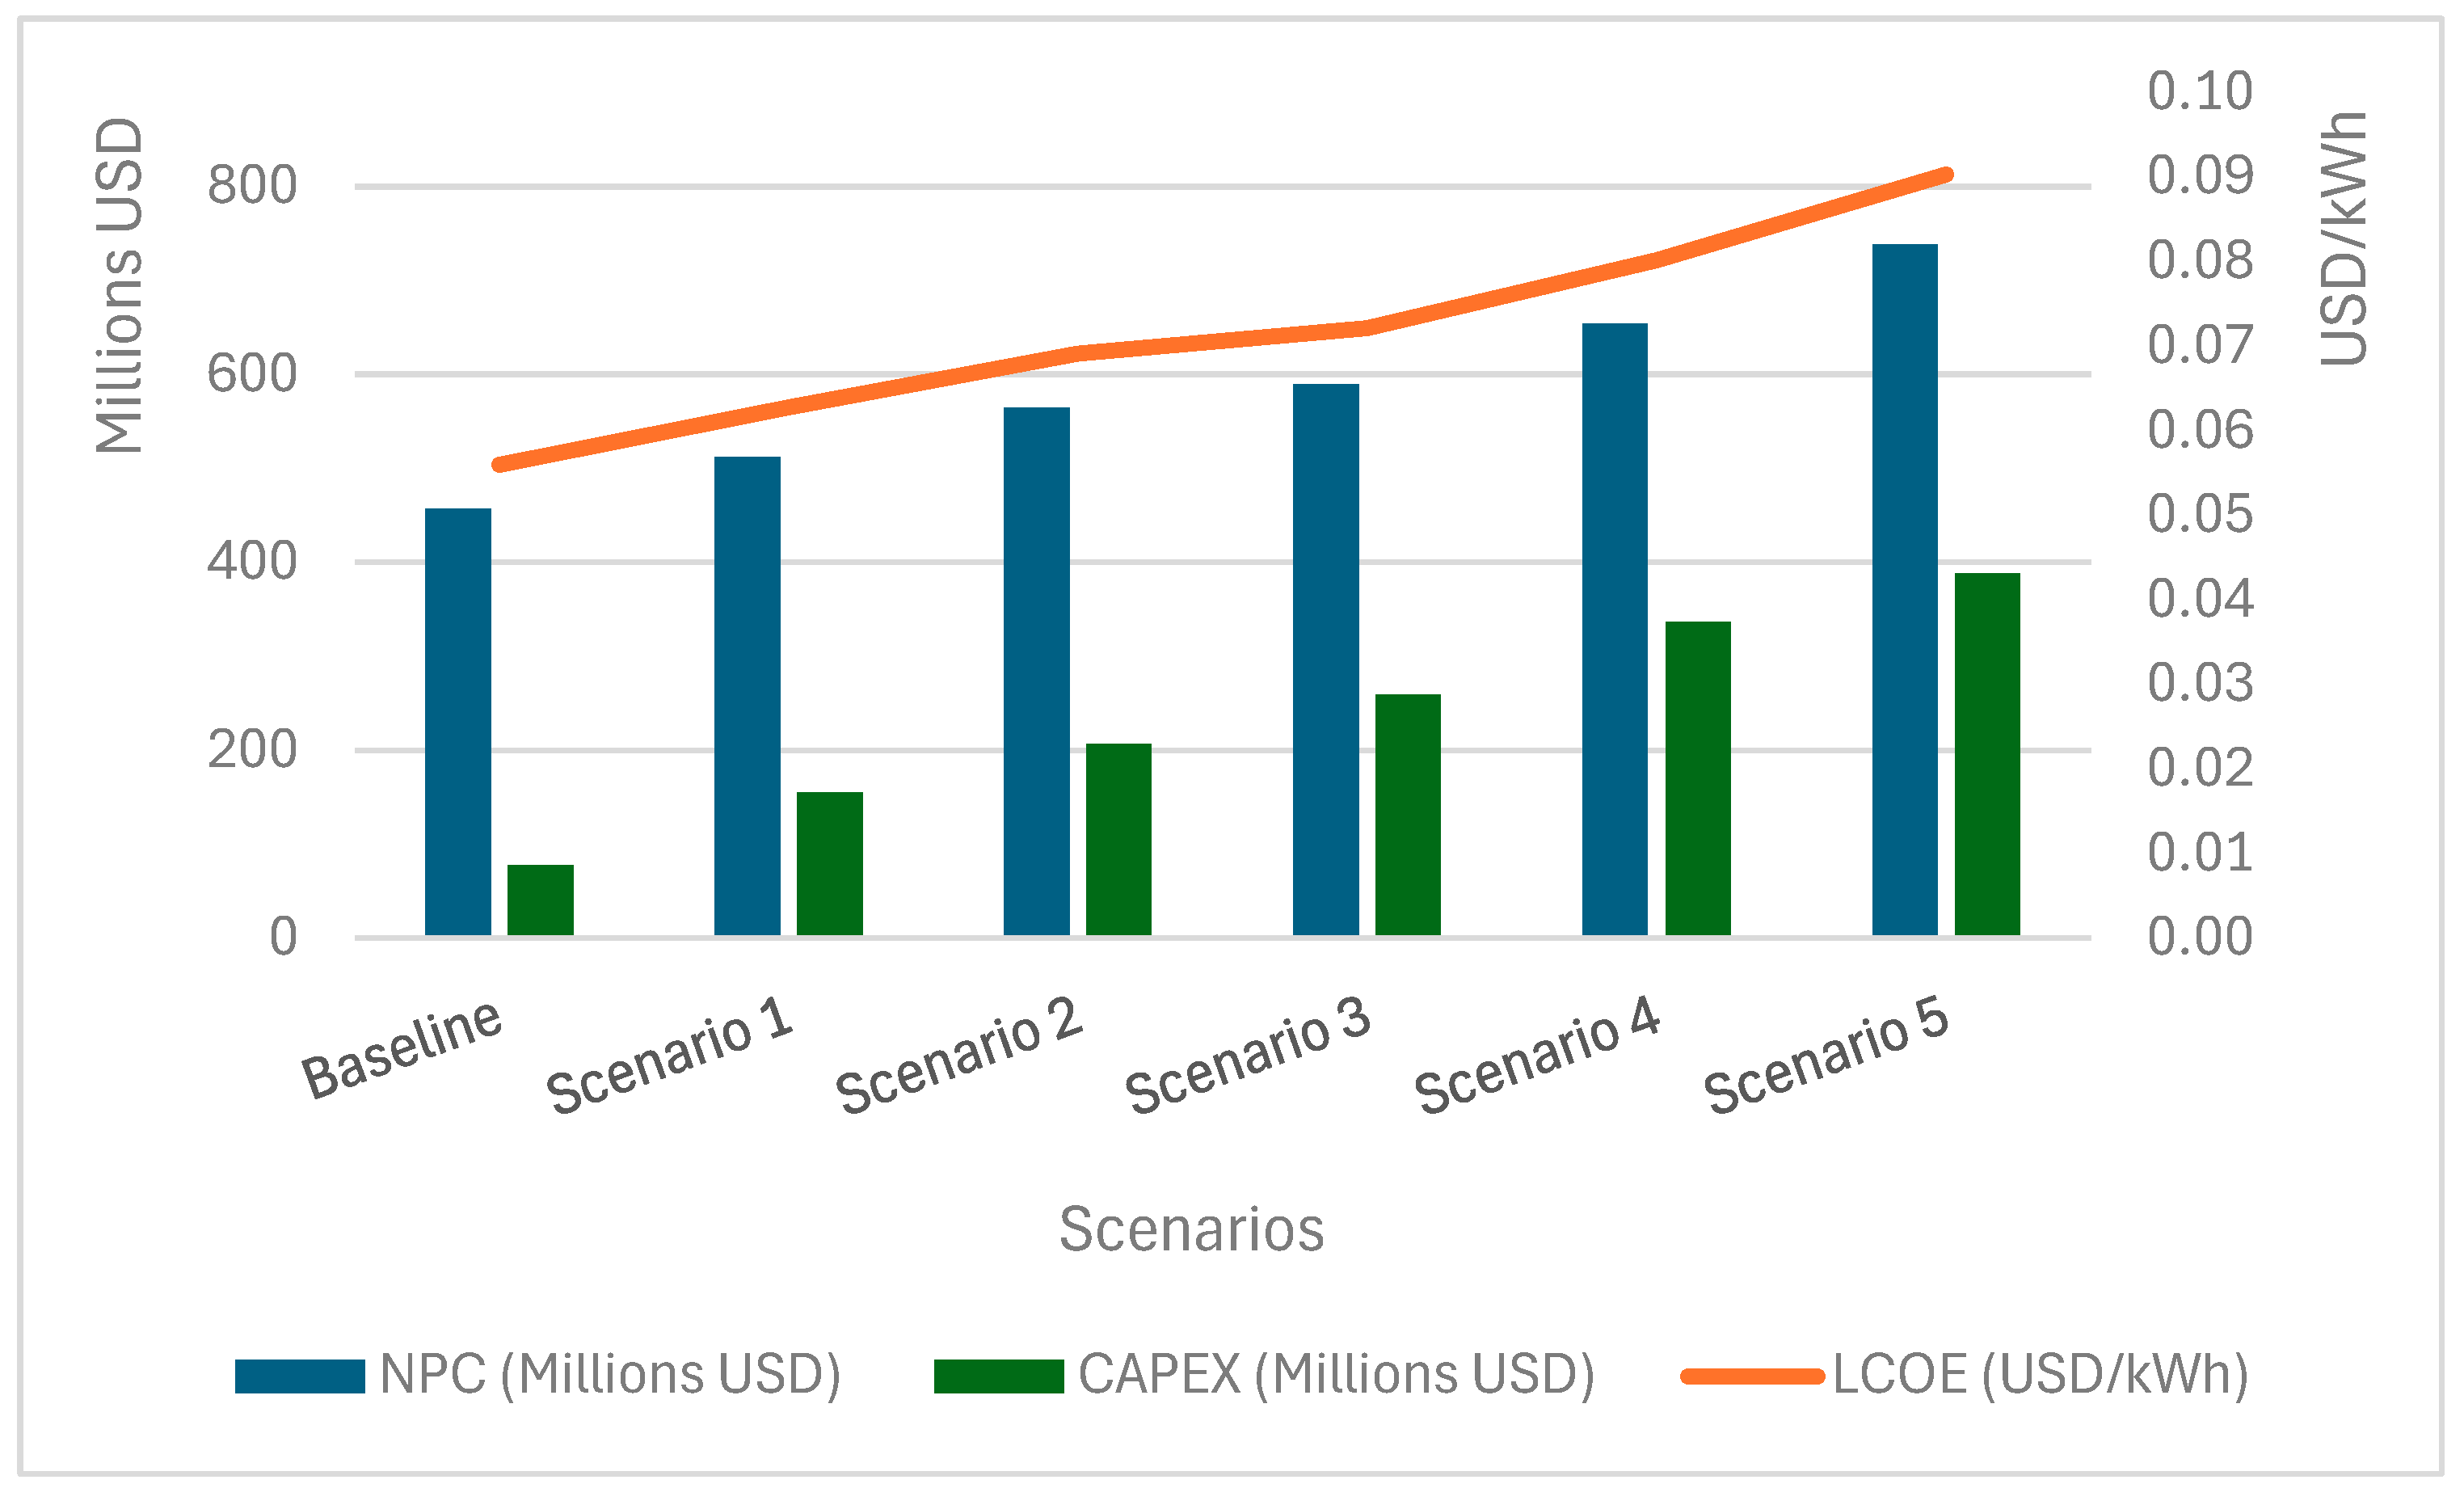
The incorporation of wind power plants is linked to a decrease in fuel expenses and emissions, a fact that is unequivocal. Nevertheless, the establishment of wind power plants also incurs supplementary costs, including the investment required for the technology and the operational costs associated with managing the wind farm. The NPC, CAPEX and LCOE for the six scenarios are illustrated and can be compared in
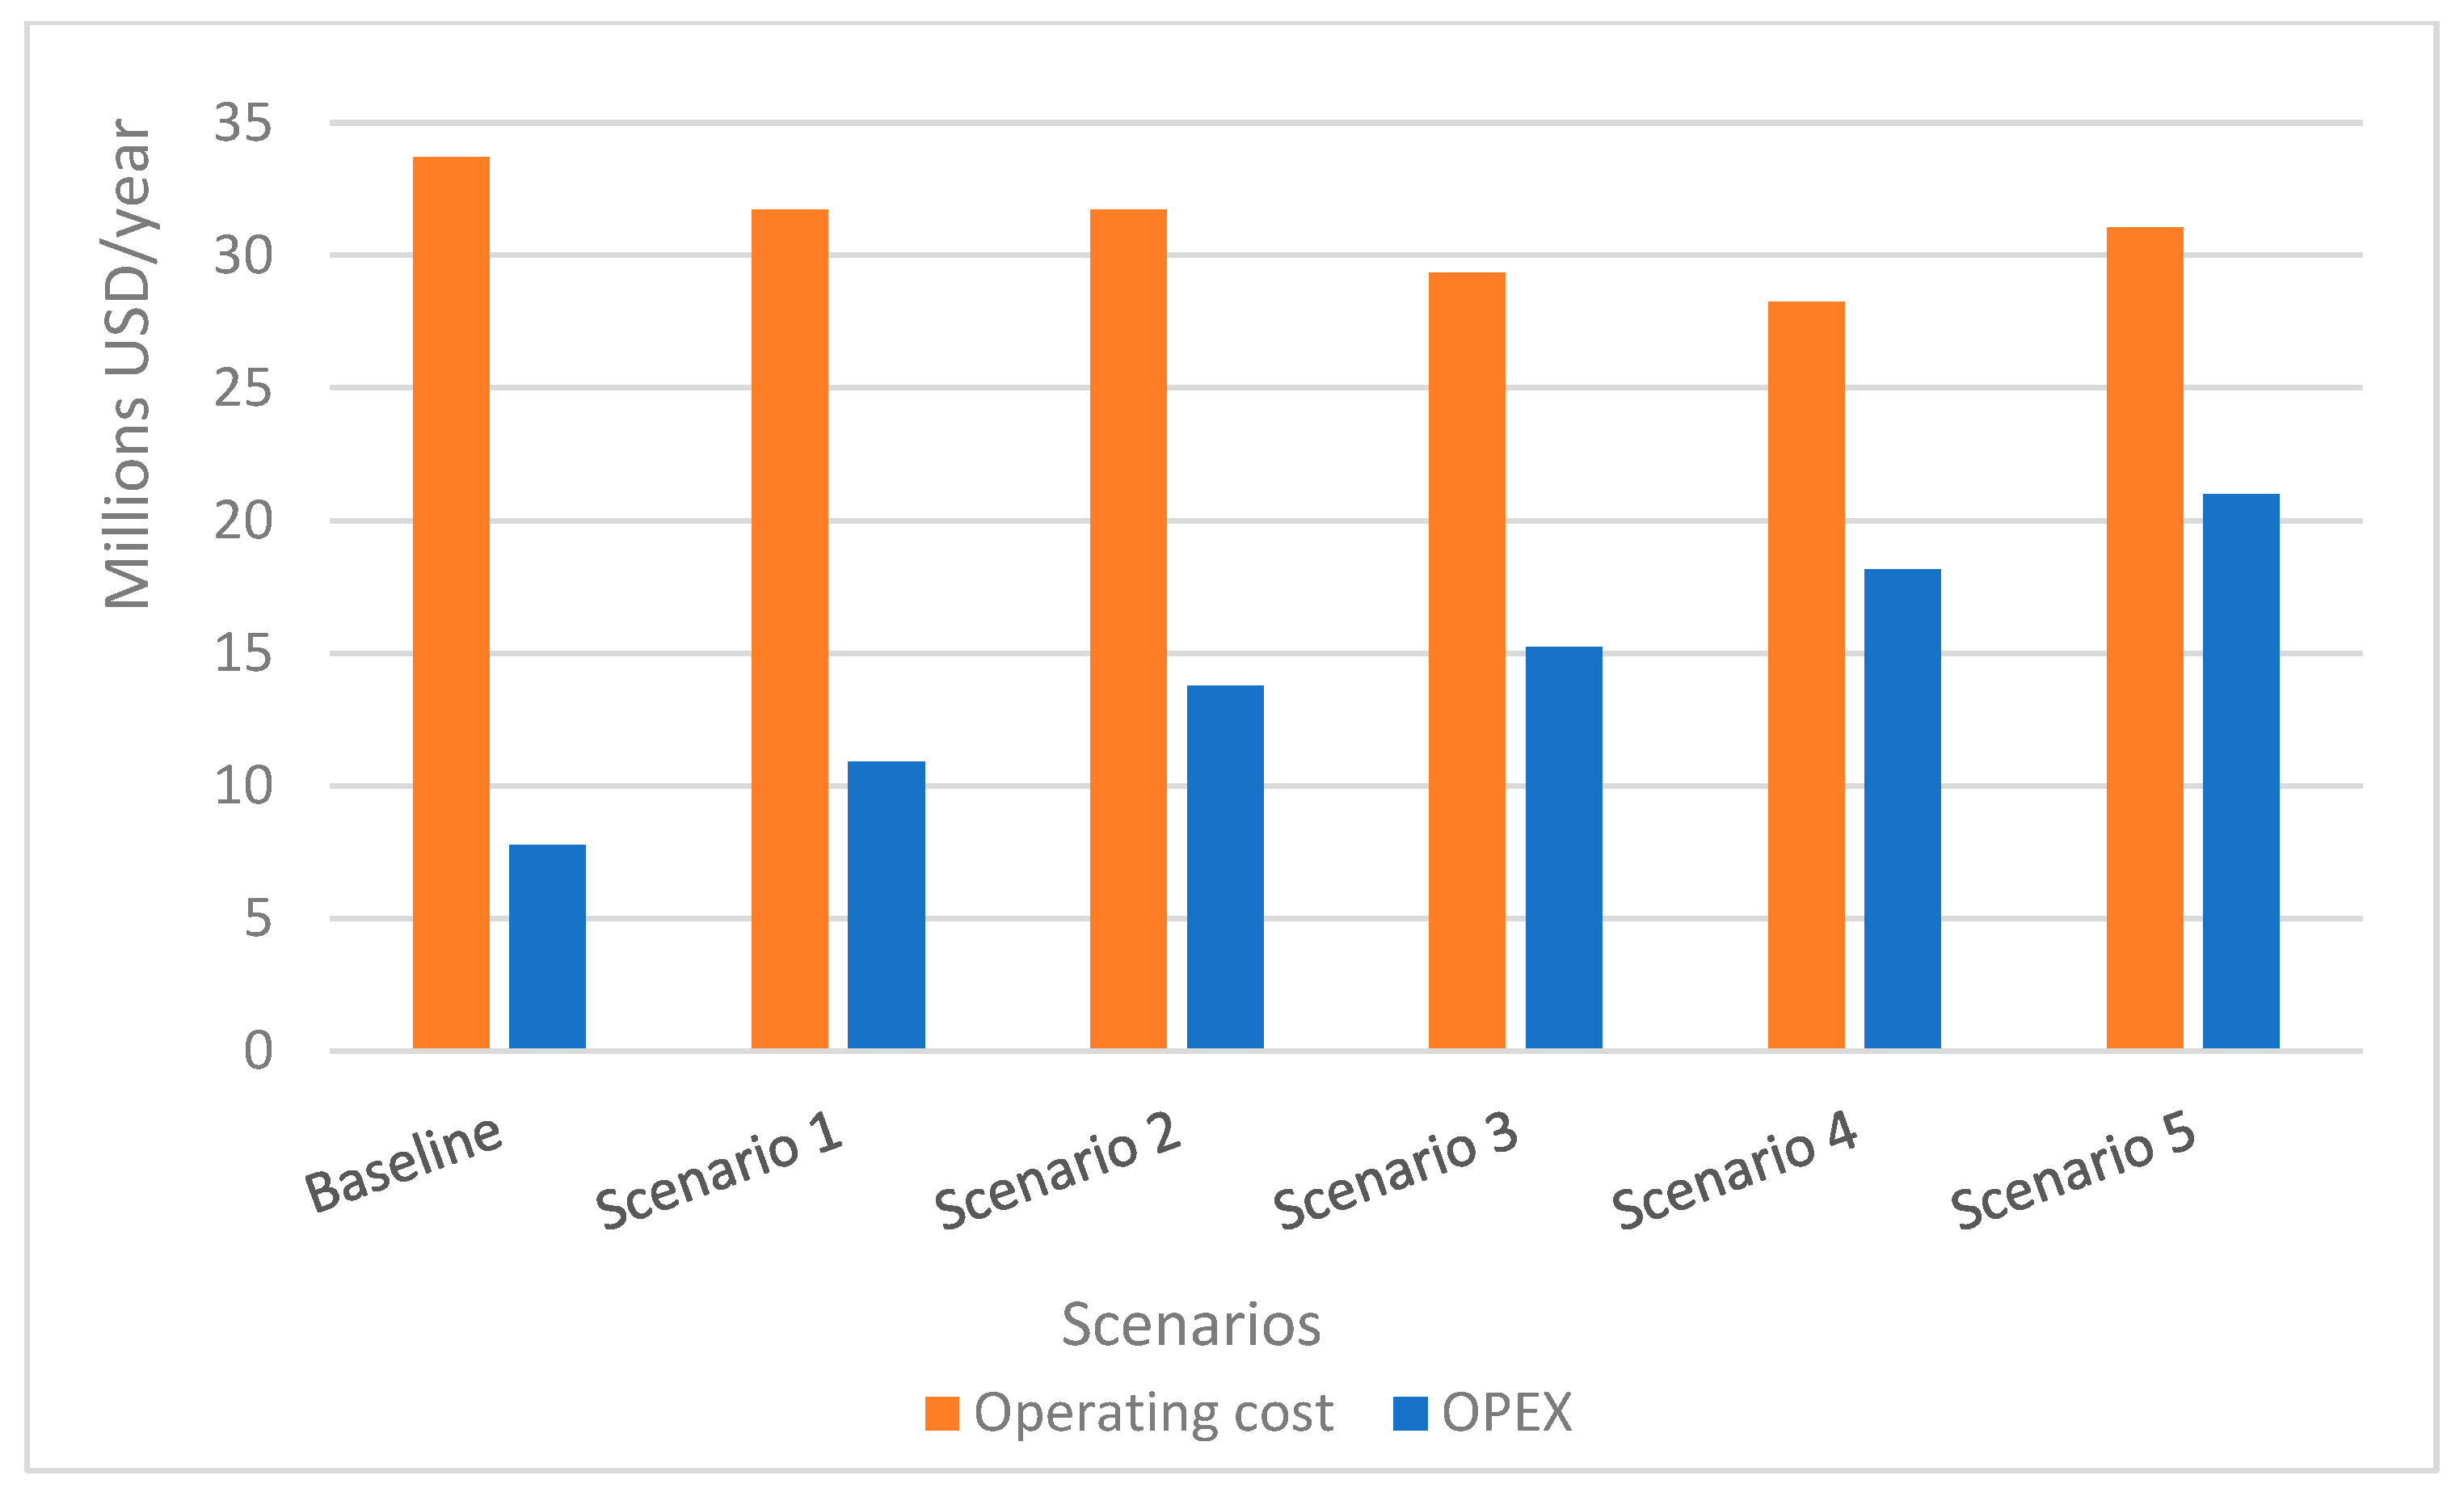
Figure 8. Additionally, the OPEX and operational costs are depicted in
Figure 9.
It can be observed that the NPC, CAPEX, OPEX and LCOE rise in proportion to the increase in wind farm capacity. Conversely, as depicted in
Figure 9, which delineates one of the initial findings of this study, operating expenses exhibit a declining trend from the baseline scenario to Scenario 4, recognized as the scenario presenting the minimum operating costs. None of the six scenarios demonstrated an IRR or payback period, indicating a lack of financial viability.
Owing to the constraints of financial viability, the subsequent section will offer an in-depth analysis of the results, which will encompass a sensitivity analysis pertaining to CO2 emissions penalties. This analysis was designed to evaluate the impact of internalizing emissions penalties on the financial parameters outlined in this section.
4.2. Analysis of Results for Viable Decarbonization Pathways
This section provides a comprehensive analysis of the effects of carbon penalization resulting from the establishment of the Brazilian carbon credit market. The examination will consider penalty values of USD 10, USD 20, USD 30, USD 40 and USD 50 per ton of CO
2, as detailed in
Section 4, and an assessment of the impacts of internalizing this penalty in each scenario is presented.
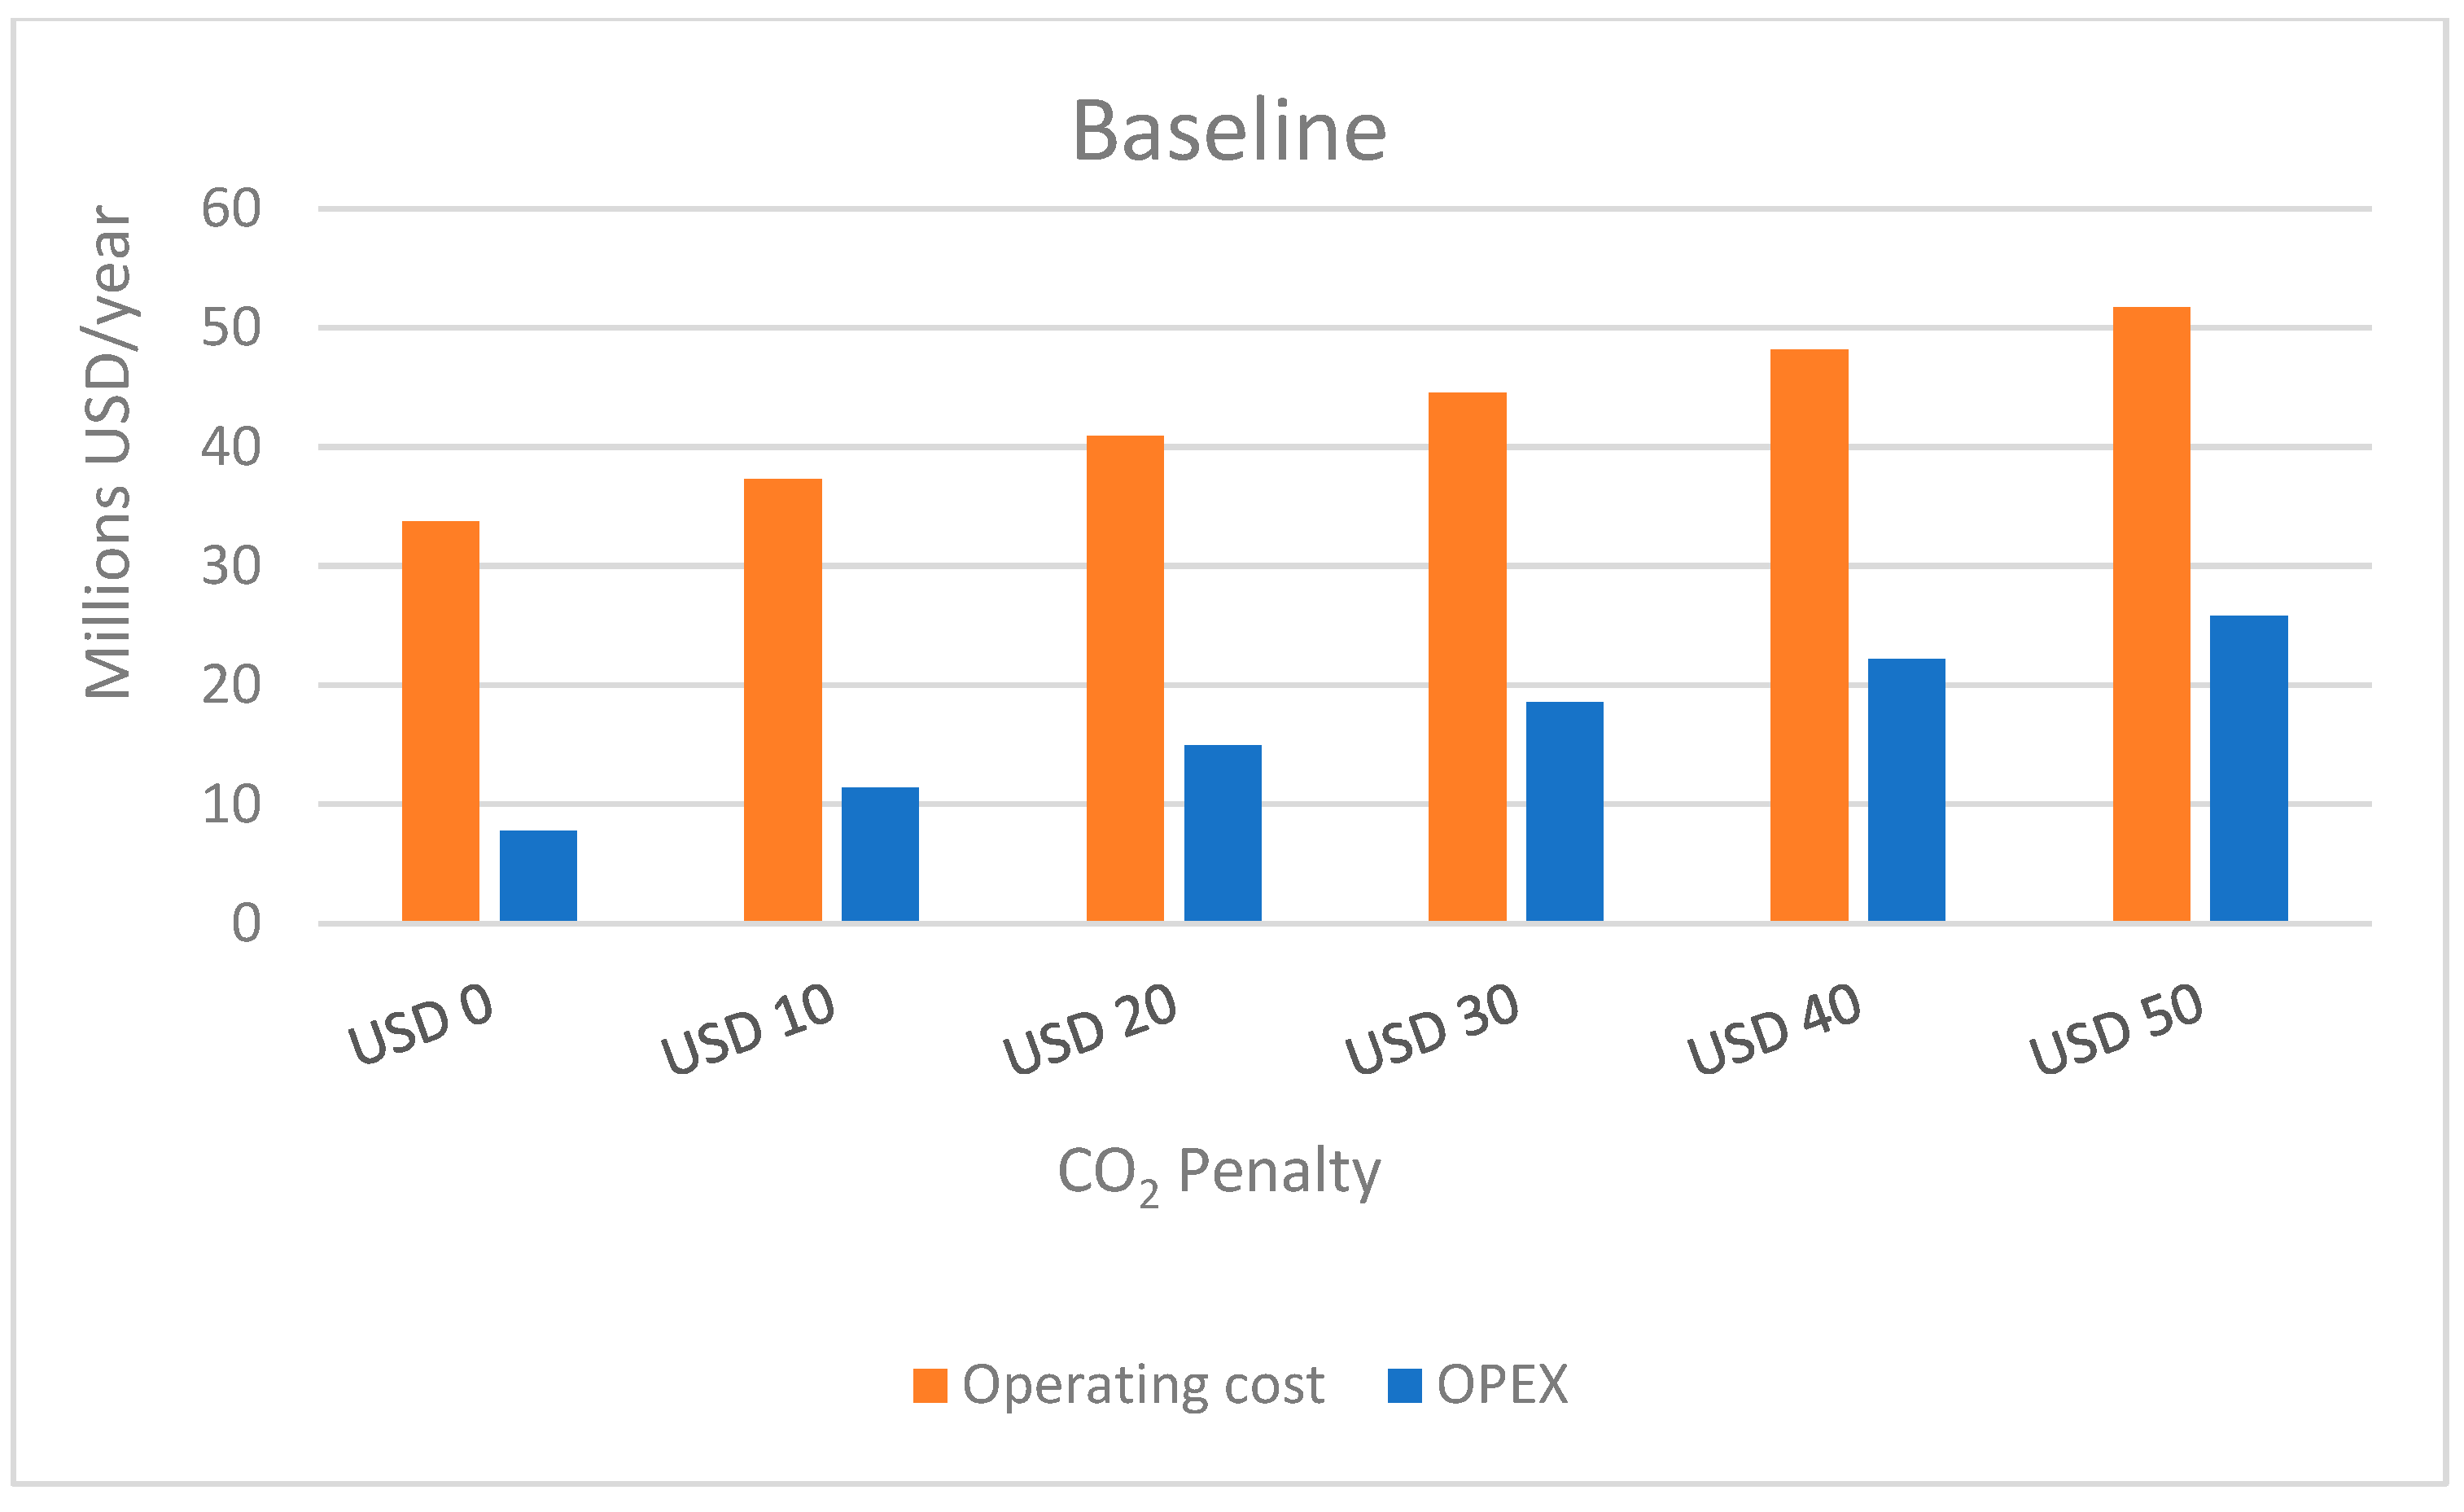
4.2.1. Scenario Baseline: 3 GTGs Only
In the Baseline scenario, the IRR and the payback period remain undefined. As the carbon dioxide emissions penalty escalates, both OPEX and total operating costs experience increase due to the obligatory payment for carbon credits when emissions surpass the prescribed limits. Specifically, operating costs exhibit a 53% rise when the penalty escalates from USD 0 to USD 50 per ton of CO
2, as demonstrated in
Figure 10.
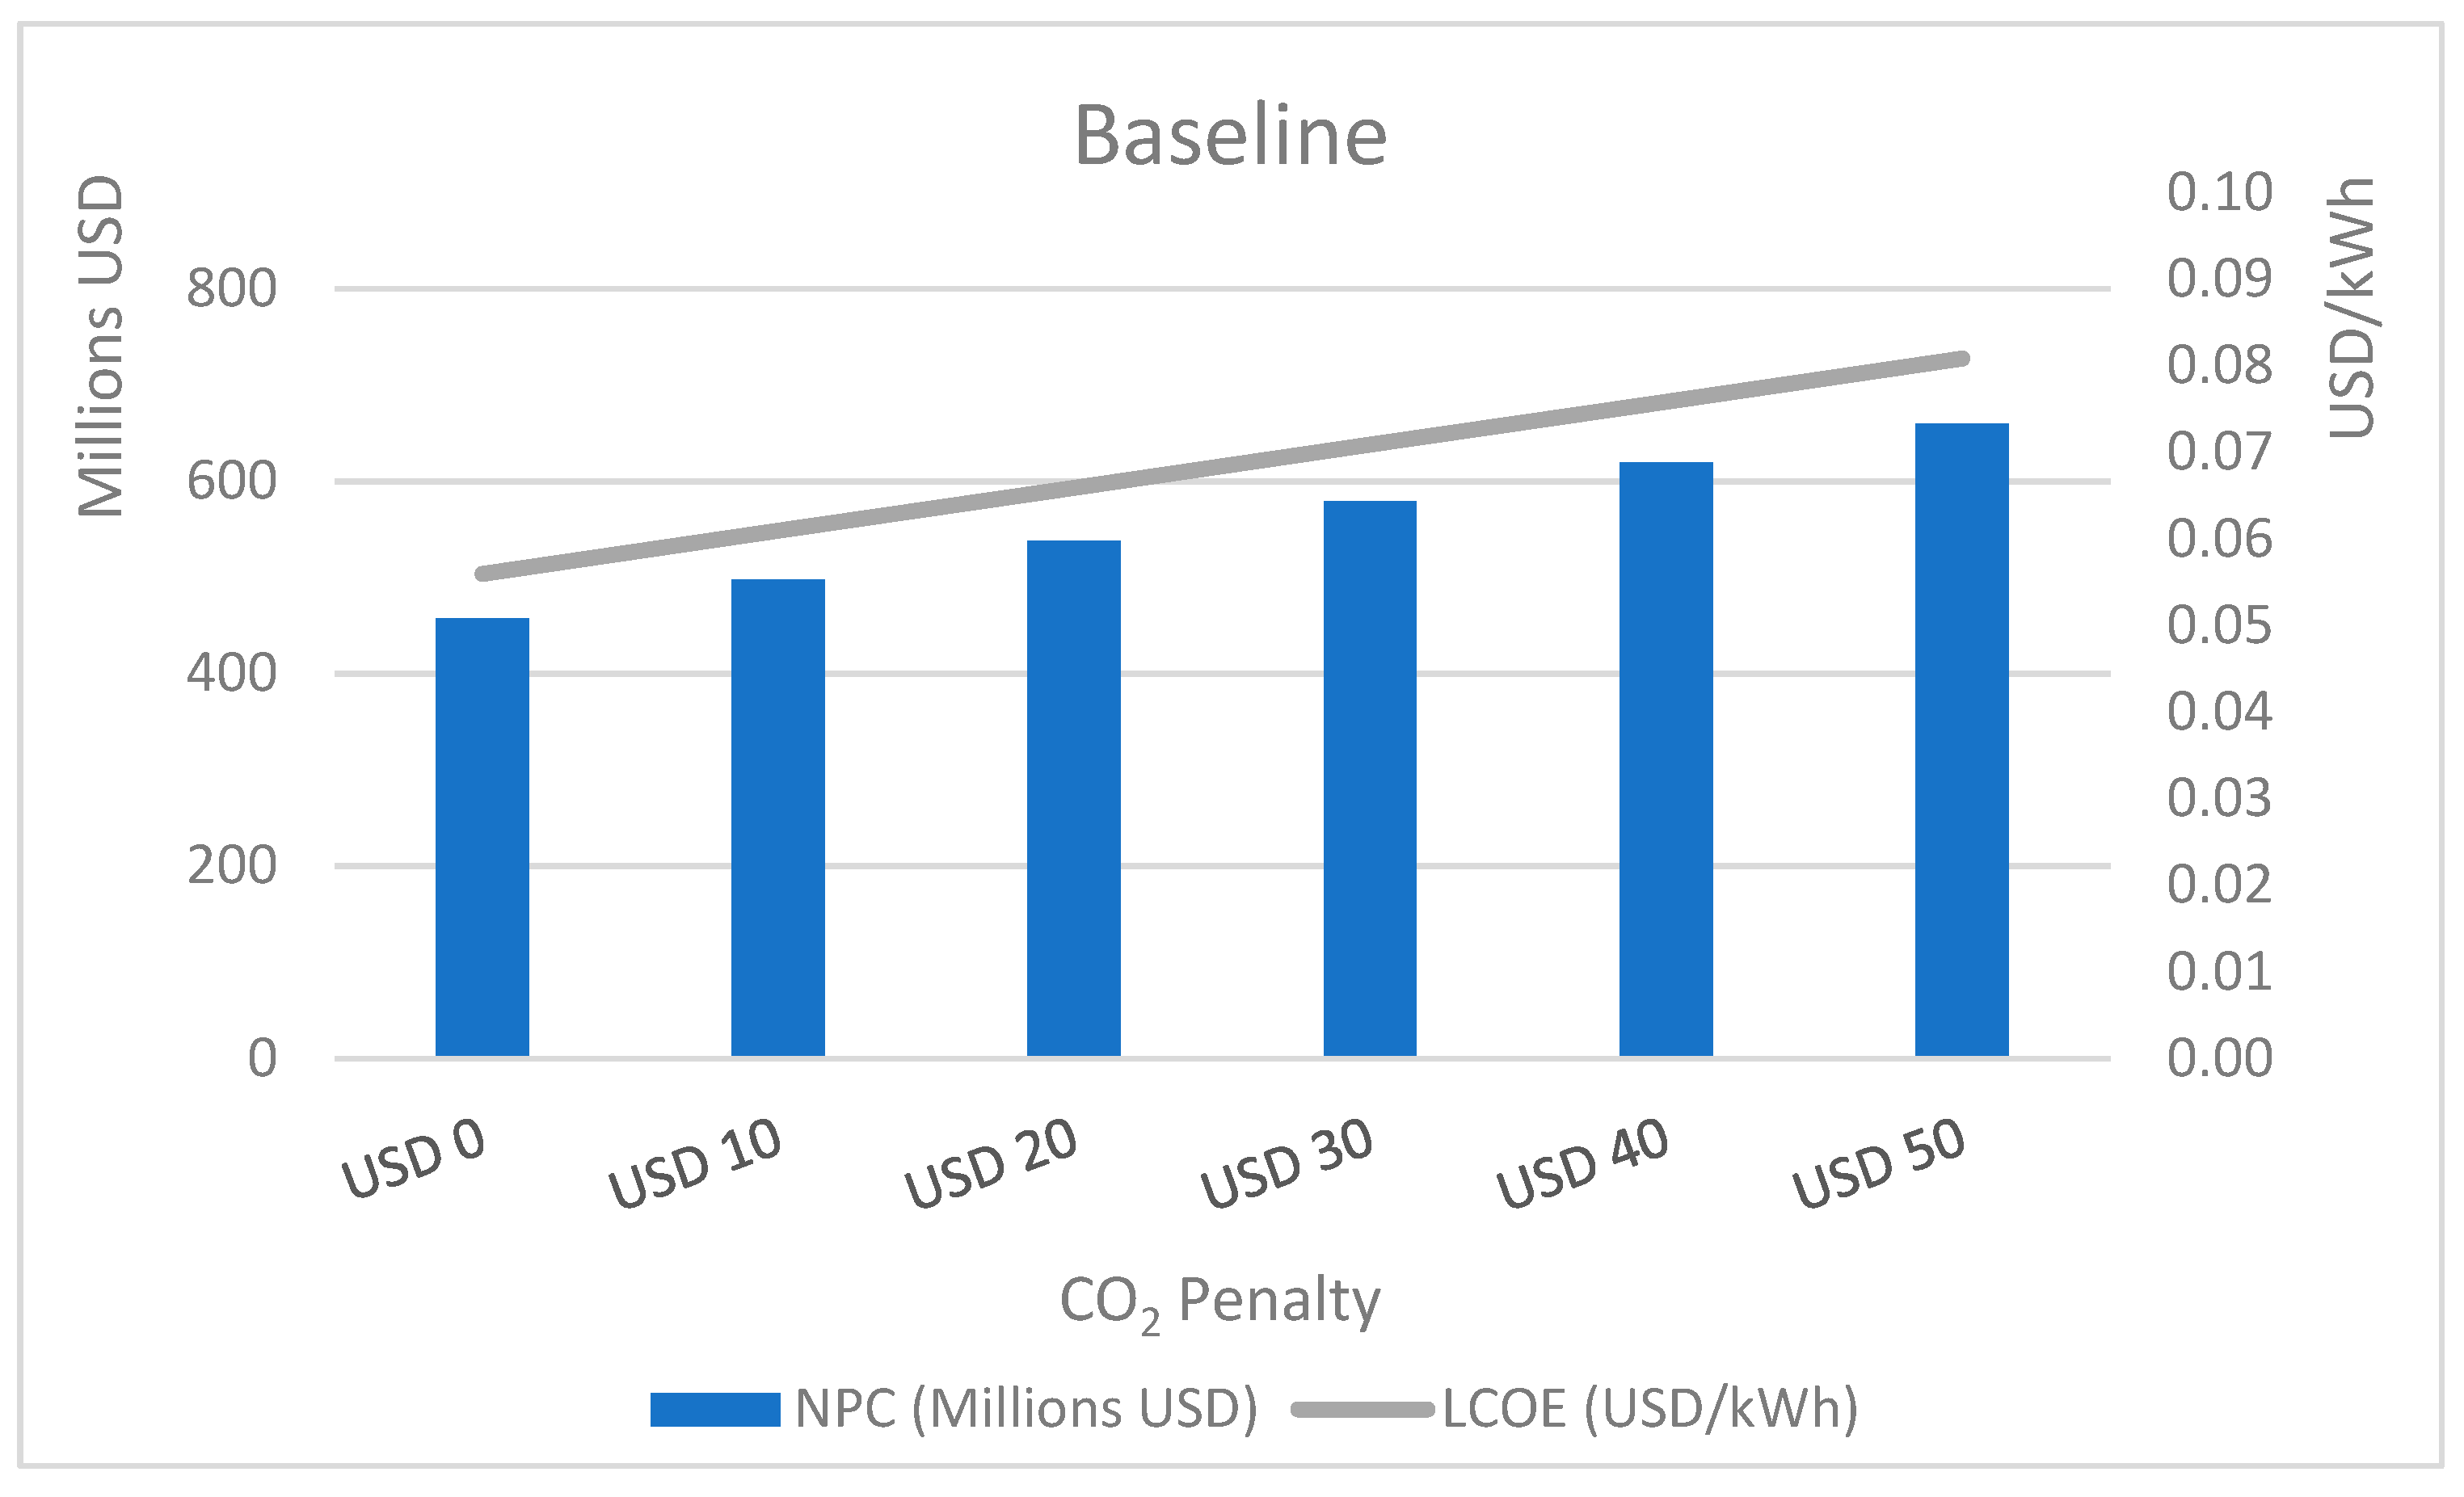
The NPC and LCOE exhibit a similar upward trend as the carbon dioxide penalty increases. Under a zero-penalty scenario, the LCOE is 0.0560 USD/kWh. However, with a penalty of USD 50, it rises to 0.0808 USD/kWh, representing a 44% increase in the NPC, as illustrated in
Figure 11. This result underscores the significant economic impact of carbon pricing on energy costs.
The carbon credit market elevates the costs associated with the baseline scenario.
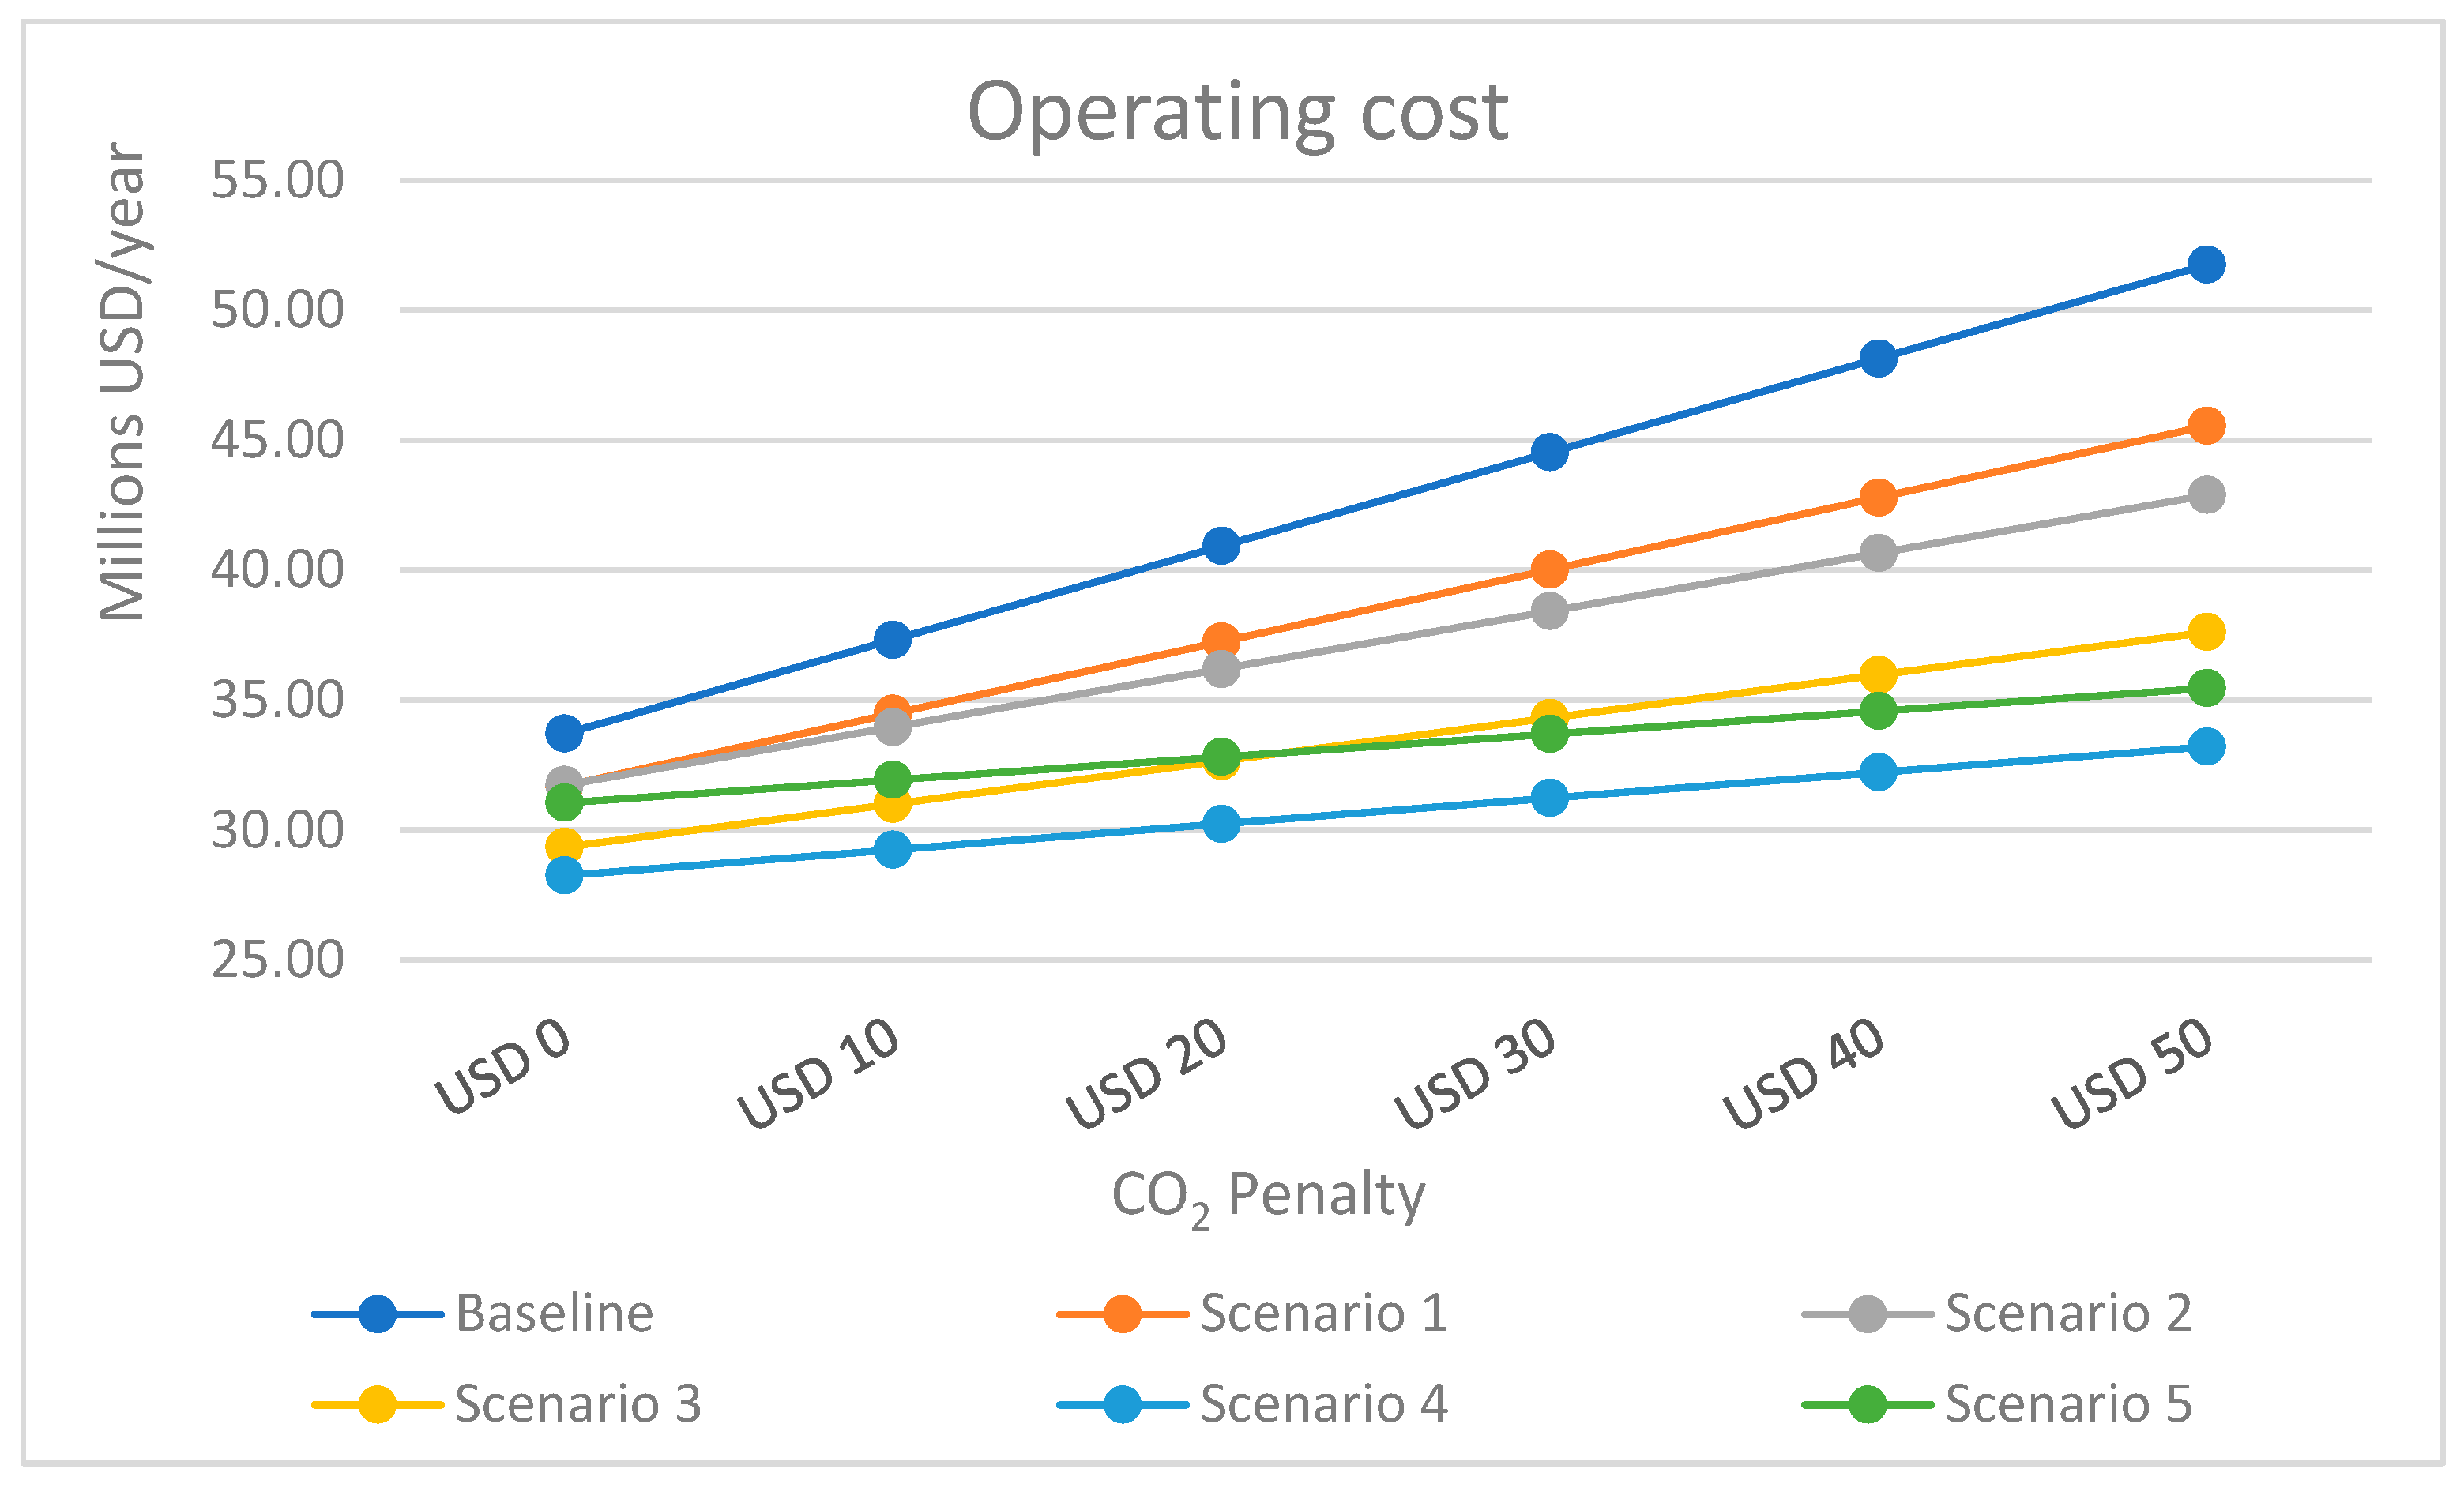
4.2.2. Operating Costs
An analysis of operational costs across the six scenarios, considering the penalties associated with CO
2 emissions, demonstrates that Scenario 4 consistently yields the lowest costs across all levels of penalty values.
Figure 12 depicts the variations in costs and presents the findings of the sensitivity analysis. With carbon pricing ranging between USD 10 and 50 per ton, Scenario 4 continued to be the most cost-effective option. At USD 10, Scenario 3 was ranked second, whereas for prices exceeding USD 20, Scenario 5 emerged as the next viable alternative.
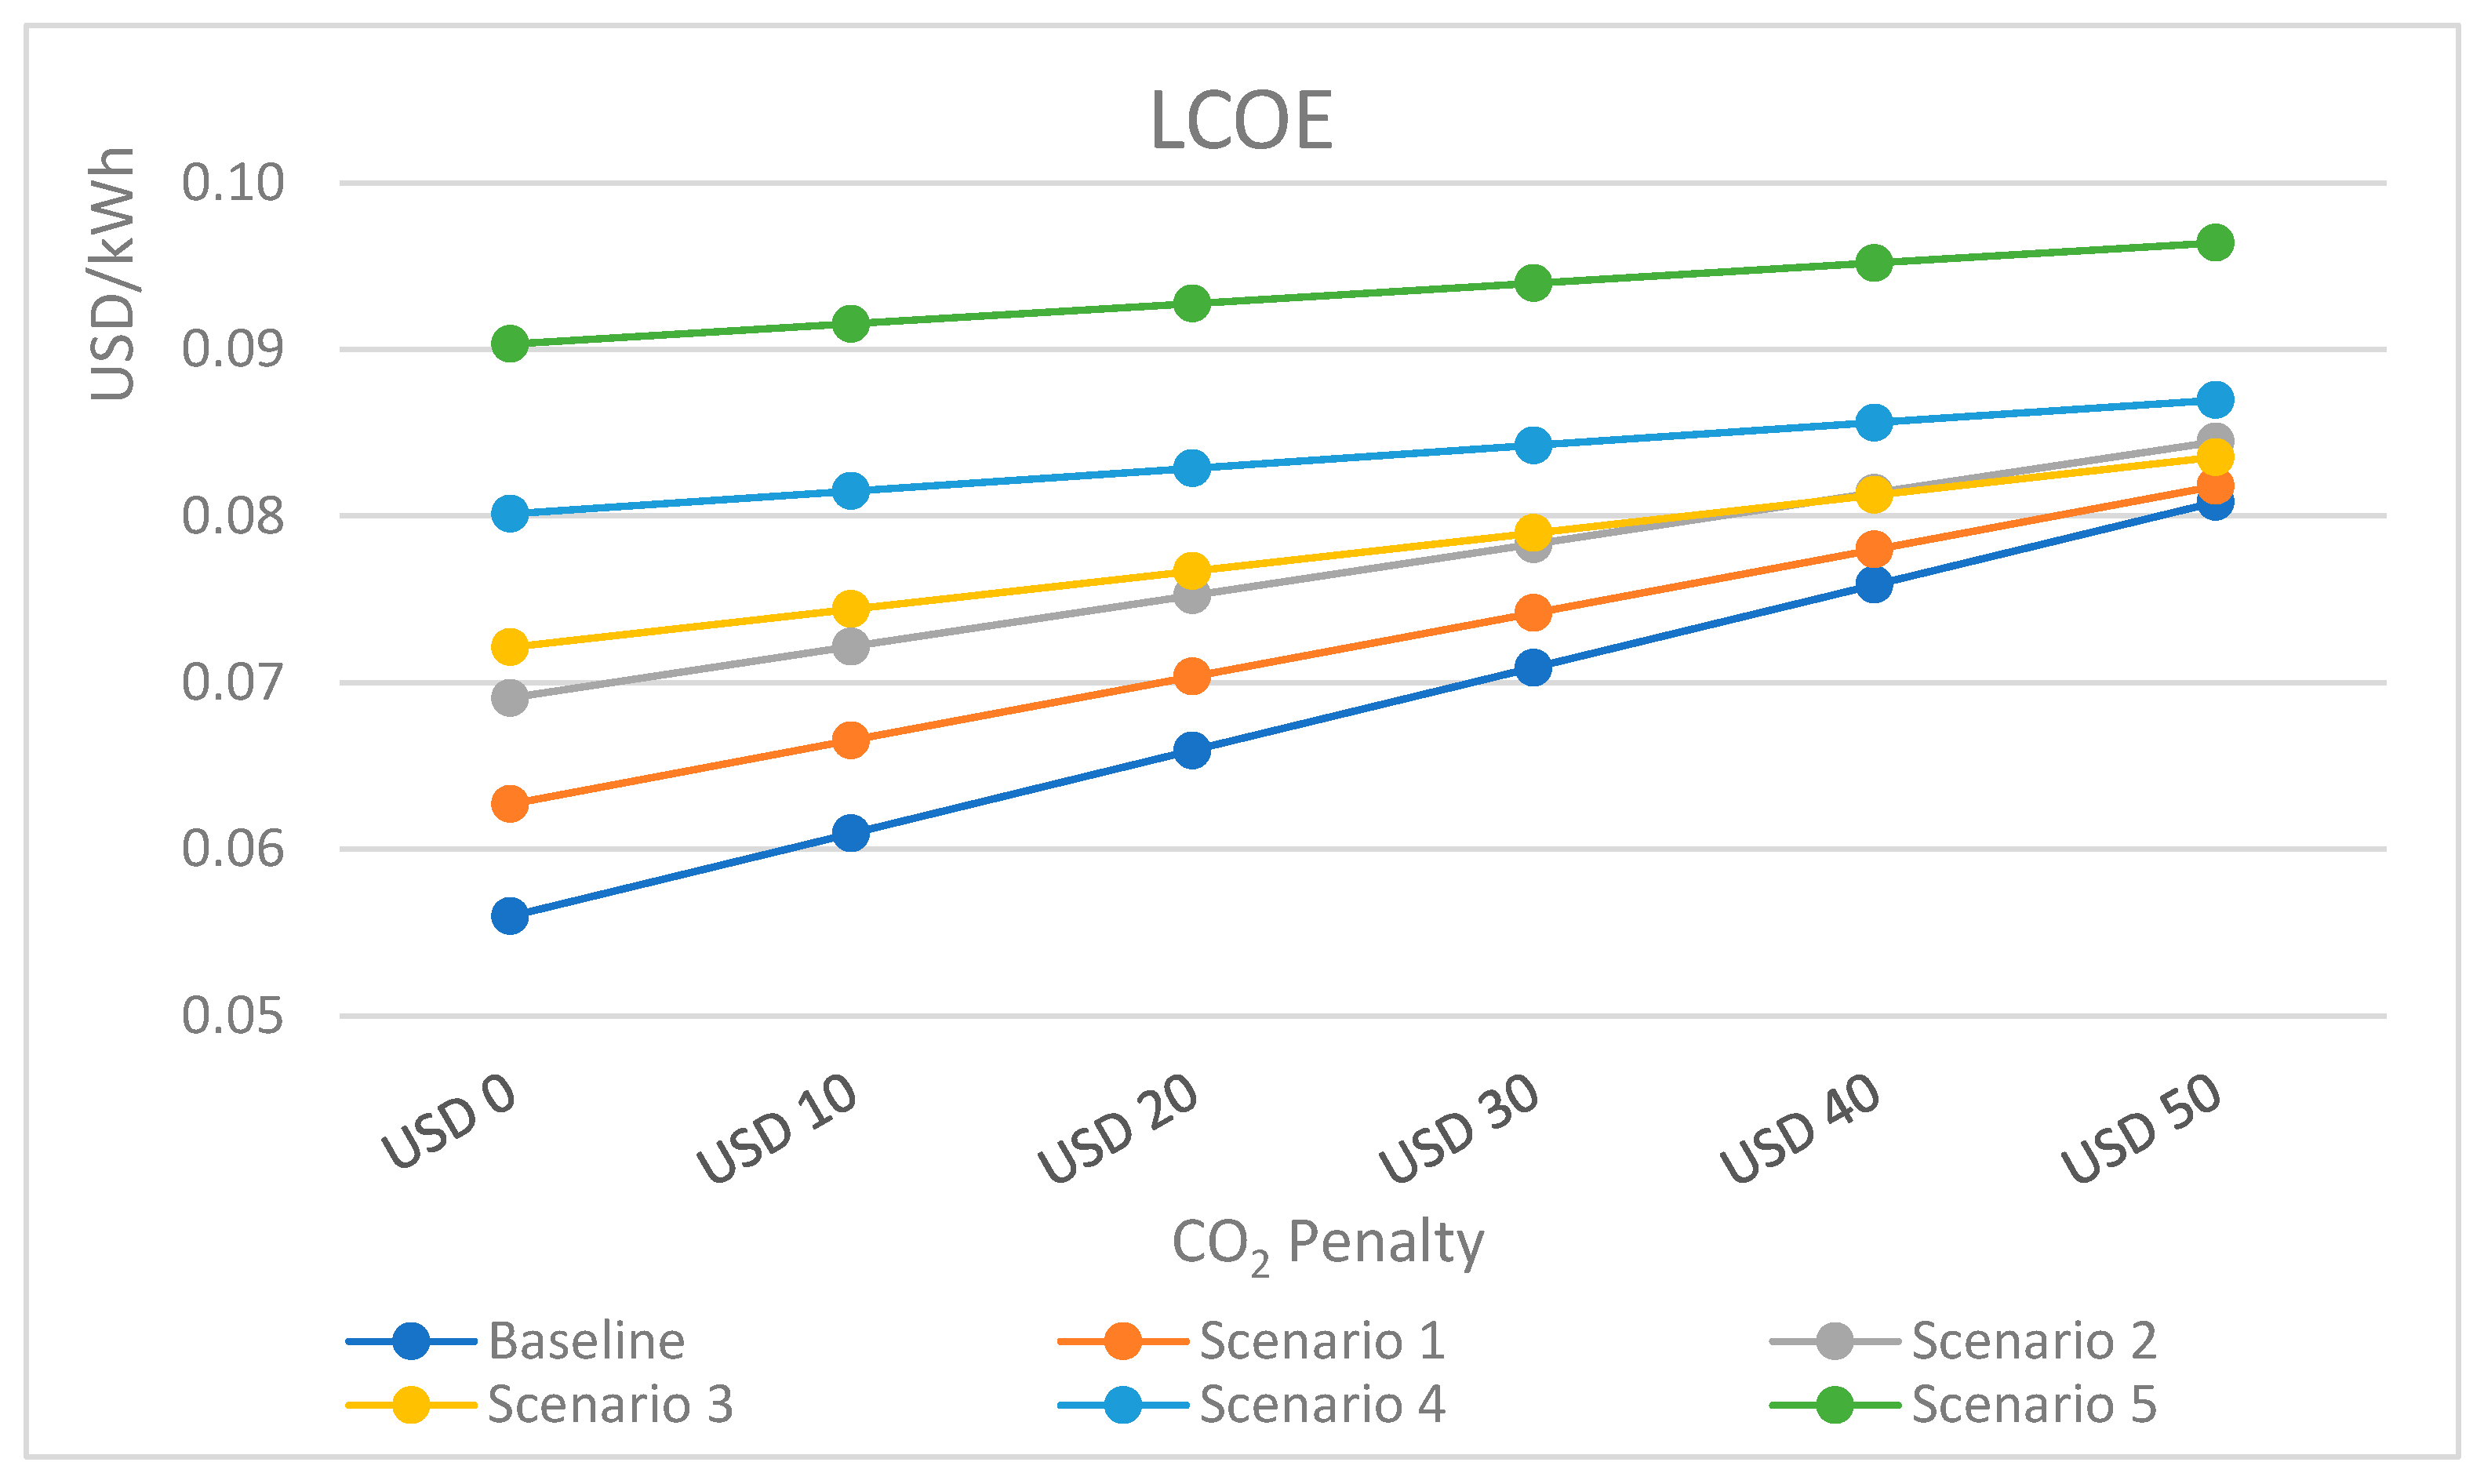
4.2.3. Levelized Cost of Energy
In the base case, where no penalties for CO
2 emissions are applied, the LCOE is the lowest among all scenarios. However, with the introduction of a carbon emissions penalty, the LCOE for the base case increases significantly, demonstrating a rise of 44%. In contrast, Scenarios 5 and 4 show relatively modest increases of 7% and 9%, respectively.
Figure 13 illustrates the variation curve of LCOE for each scenario across different CO
2 penalty values per ton. Upon analyzing the LCOE, it becomes evident that Scenario 1 presents the lowest values for pricing cases, ranging from USD 10 to 30, placing it second only to the base case. In contrast, for higher pricing scenarios between USD 40 and 50, the LCOE values associated with Scenarios 1, 2, 3 and 4 exhibit a remarkable similarity to those observed in the base case.
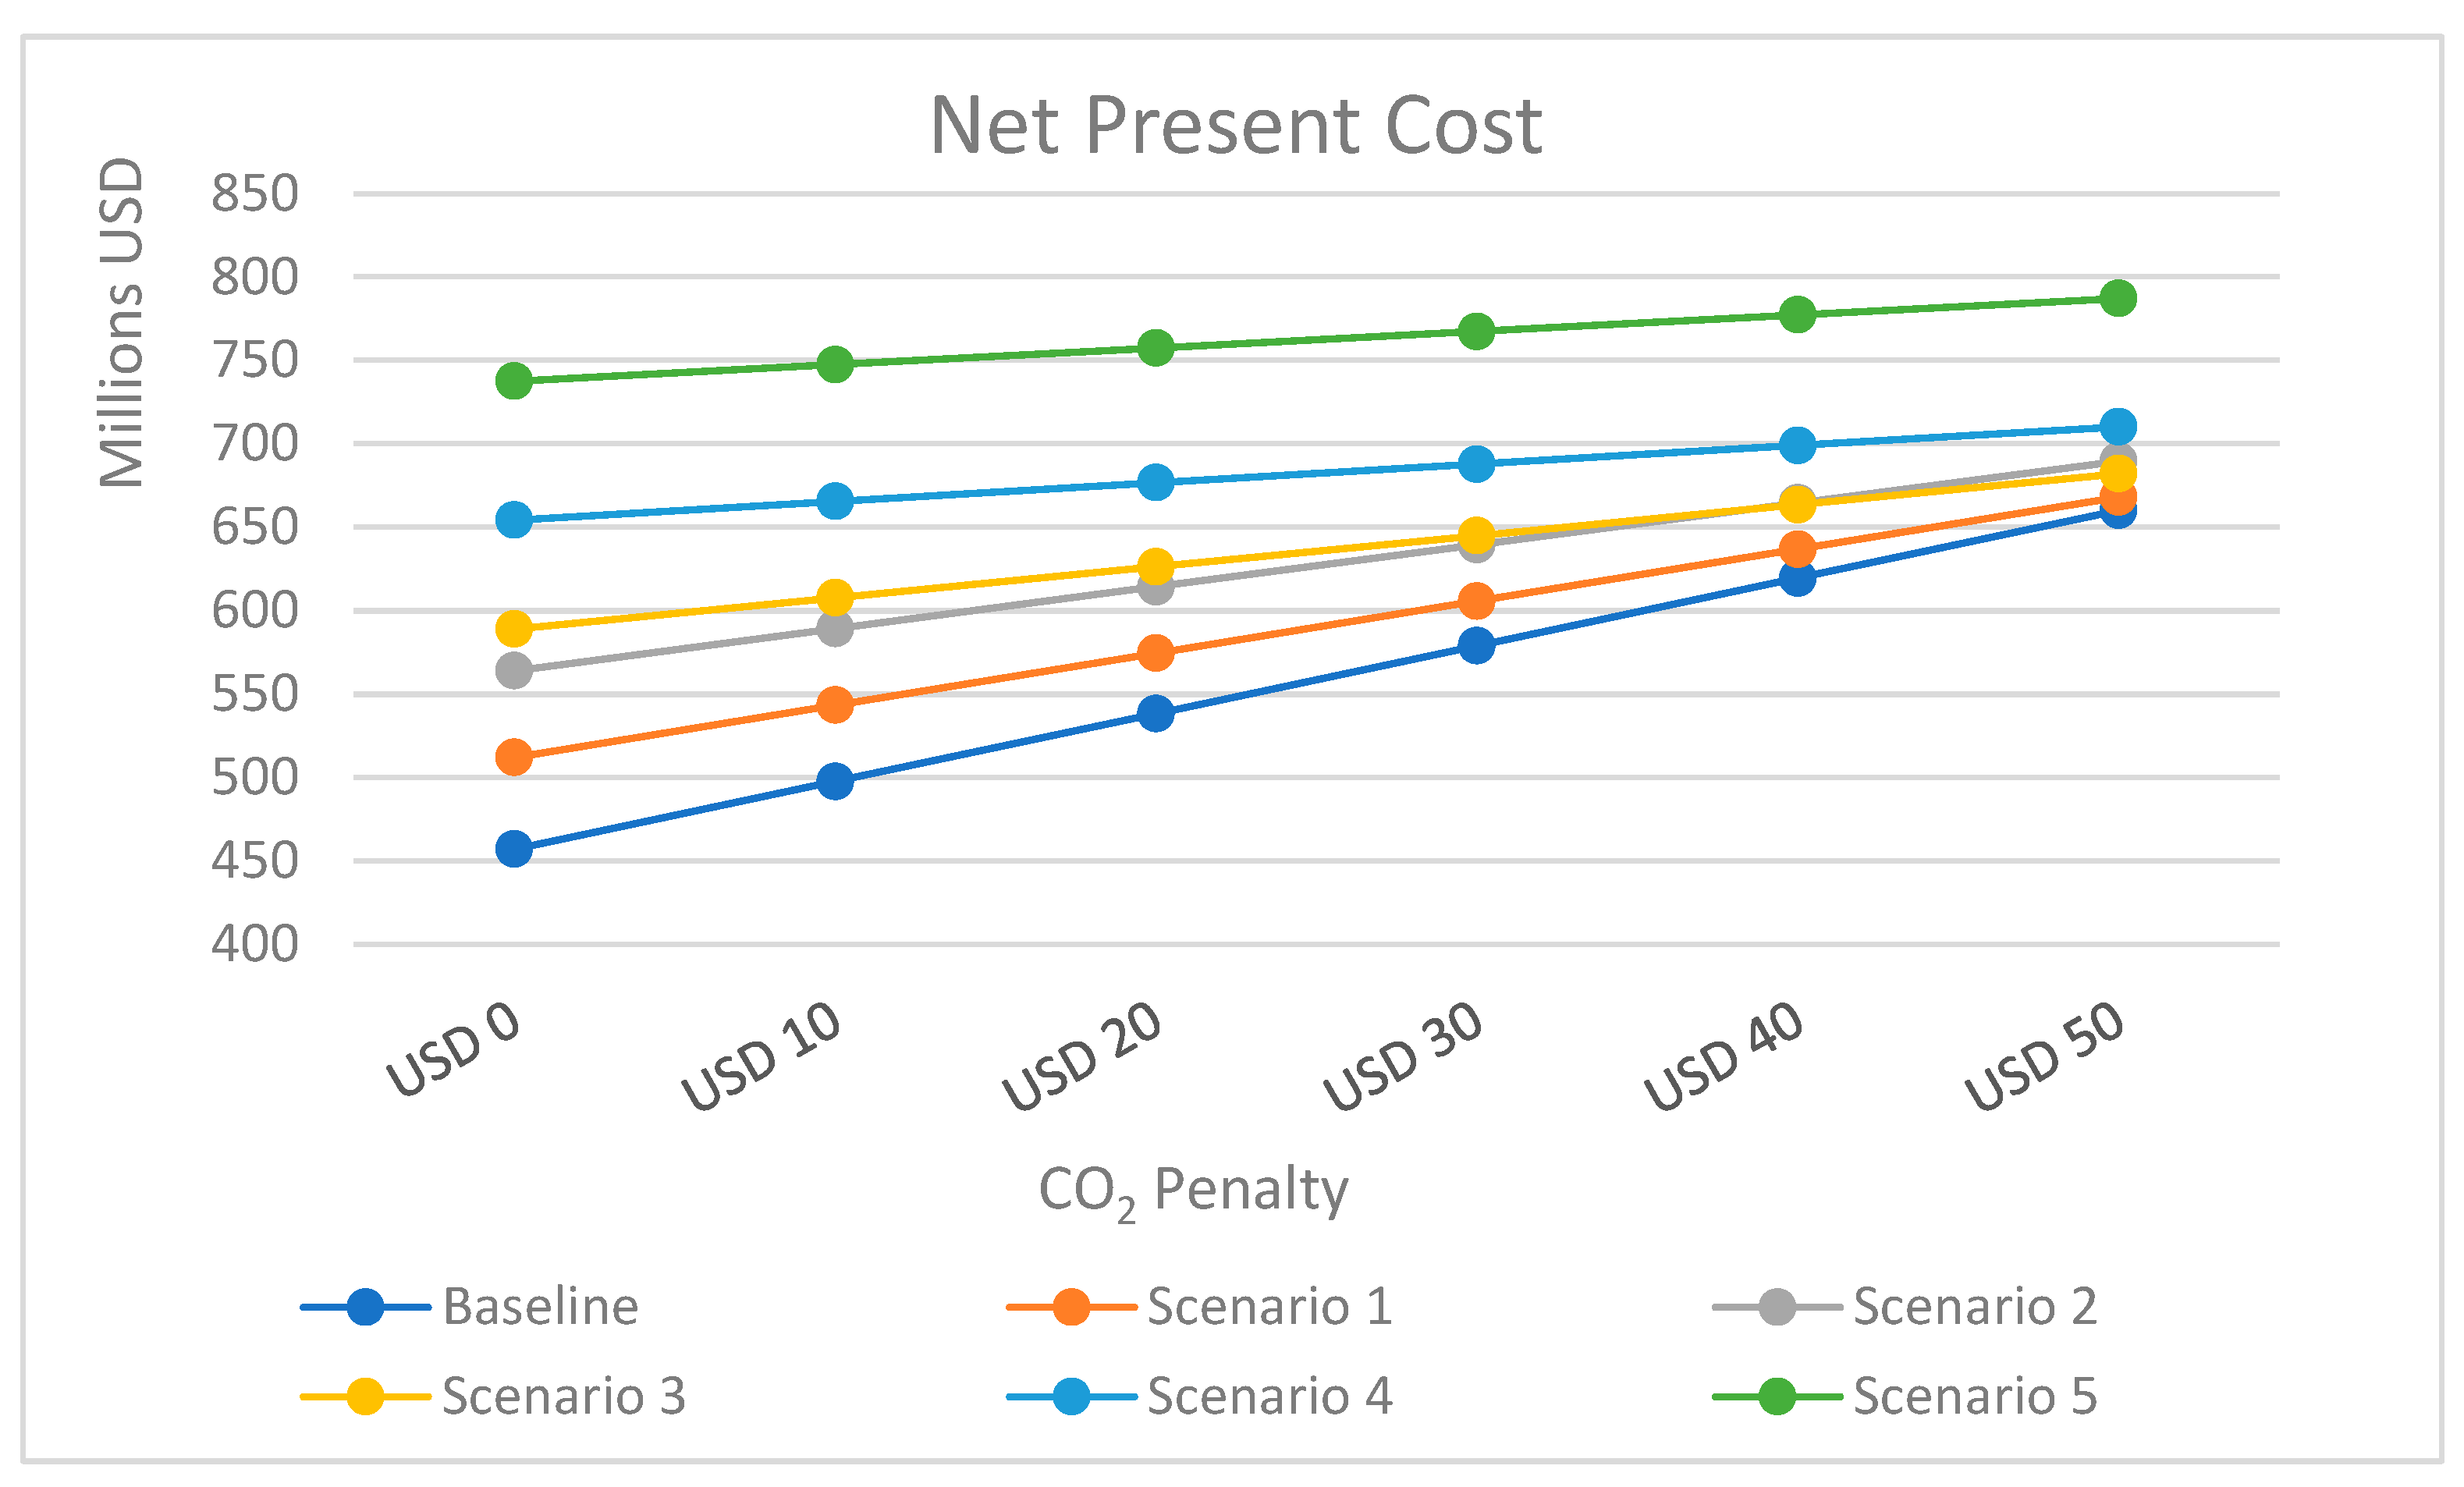
4.2.4. Net Present Cost
The NPC demonstrates a pattern analogous to that of the LCOE. The baseline scenario indicates a significantly greater variation as the CO
2 emissions penalty escalates, reflecting heightened sensitivity to the penalty. In contrast, the other scenarios exhibit more stable and modest variations, irrespective of the increasing penalty. This trend underscores the baseline scenario’s susceptibility to carbon pricing mechanisms in comparison to other configurations.
Figure 14 illustrates these variations, thereby emphasizing the disparities in cost responses across the scenarios.
4.2.5. Internal Rate of Return
In the absence of a penalty for CO
2 emissions, all six scenarios yield an IRR of 0%. However, with the introduction of such a penalty, certain scenarios begin to exhibit positive IRRs. Scenarios 1 and 3 demonstrate the highest rates of return, reaching 6.85% and 6.62%, respectively, when subjected to a penalty of USD 50 per ton of CO
2. Notably, even at a lower penalty of USD 40 per ton, these scenarios achieve viable IRRs of 5.42% and 5.19%, respectively. These findings underscore that the implementation of a CO
2 emissions penalty significantly enhances the economic and financial feasibility of integrating floating wind energy for decarbonization purposes.
Figure 15 illustrates the progression of IRR across the scenarios as a function of CO
2 penalty values.
4.2.6. Return on Investment
In the absence of a carbon dioxide emissions penalty, the ROI is negative across all scenarios, with the sole exception of the base case, which remains unchanged at zero. However, as the penalty associated with carbon emissions escalates, there is a pronounced improvement in ROI for the scenarios that incorporate floating wind power. Notably, Scenario 1 attains an ROI of 4.78%, whereas Scenario 3 reaches 4.67% when the penalty is set at USD 50 per ton of CO
2.
Figure 16 illustrates the incremental rise in ROI for each scenario in relation to increasing CO
2 penalty values.
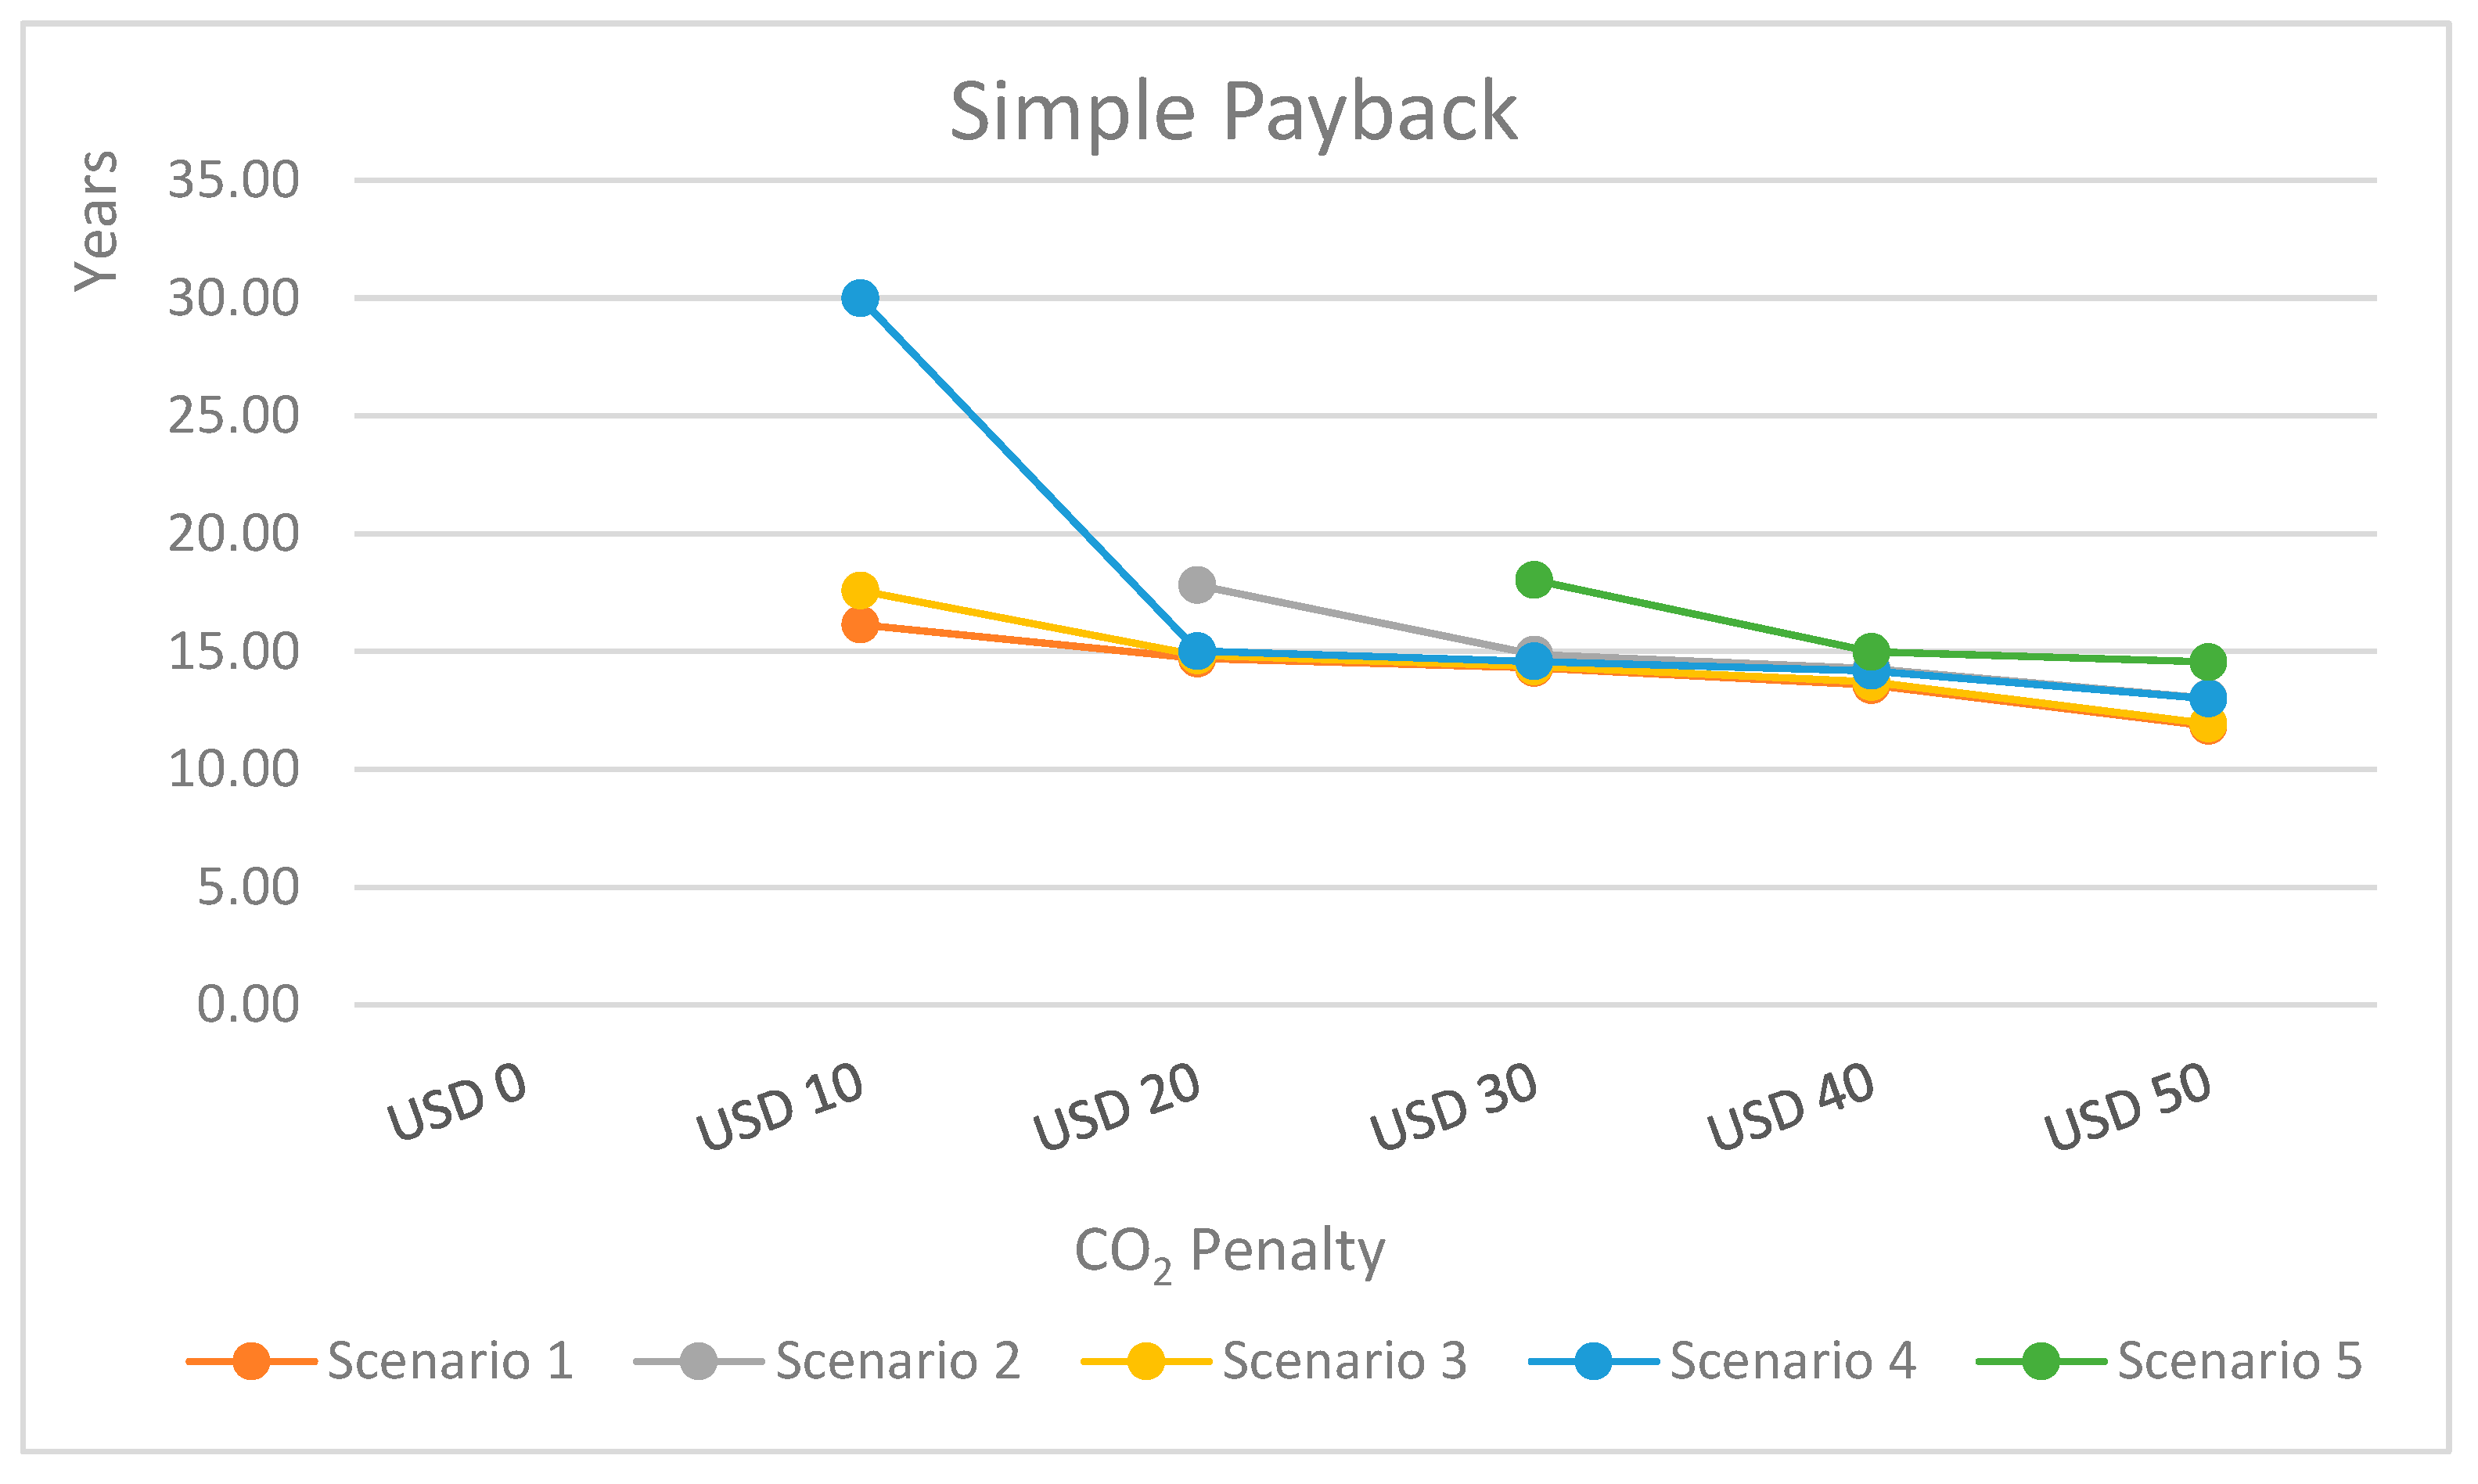
4.2.7. Simple Payback
Concerning the investment payback period, no scenarios, including the baseline case, achieve a predetermined Return on Investment in the absence of a carbon dioxide emissions penalty. However, following the implementation of a penalty of USD 10 per ton of carbon dioxide, although the payback period remains significant, a measurable timeframe for Return on Investment begins to materialize. As the penalty increases to USD 50 per ton of carbon dioxide, the payback period shows improvement, reaching 11.84 years for Scenario 1 and 11.94 years for Scenario 3. These results highlight the considerable impact of carbon dioxide penalties on the enhancement of financial viability. In the baseline case, no payback period was identified, even when considering the penalties associated with CO
2 emissions.
Figure 17 illustrates the variation in payback periods across scenarios, contingent upon differing carbon dioxide penalty values.
To facilitate comprehension,
Table 5 encapsulates the economic and environmental performance of the six modeled scenarios under varying carbon pricing penalties, which range from USD 0 to 50 per ton of CO
2. The table delineates key indicators, including wind energy penetration, CO
2 emissions reduction, NPC, annual operational cost, LCOE, IRR, ROI, simple payback period, energy curtailed and annual savings derived from fuel avoidance. This comprehensive overview enables a detailed comparative analysis concerning how different levels of carbon penalties impact the trade-offs between emissions reduction and economic viability. The results indicate that as carbon pricing escalates, scenarios exhibiting a higher renewable penetration become increasingly competitive, demonstrating improvements in financial indicators alongside greater emissions savings. Consequently, the table offers fundamental insights into the significance of carbon pricing in enhancing the feasibility of hybrid renewable systems for FPSO operations.
4.3. Discussion of Results
The results demonstrate that the integration of floating wind power into FPSO operations can substantially mitigate CO2 emissions while simultaneously enhancing the economic viability of the system, contingent upon specific conditions. This study elucidates that the efficacy of this integration is significantly influenced by the installed wind capacity and the prevailing carbon pricing mechanisms.
The scenarios demonstrating the highest levels of wind energy penetration, exceeding 100%, accomplished substantial emission reductions, achieving lower emissions by up to 76% in comparison to the baseline case. Nevertheless, these scenarios concurrently exhibited significant energy losses attributed to curtailment, which diminished the overall system efficiency. This trade-off indicates the existence of an optimal level of wind penetration, wherein emissions are reduced without experiencing excessive energy wastage.
The implementation of CO2 emission penalties profoundly transformed the financial landscape of the analyzed scenarios. Although the baseline scenario demonstrated the lowest costs in the absence of carbon pricing, the floating wind scenarios gained a competitive edge as carbon penalties rose. The sensitivity analysis revealed that Scenarios 1 and 3, which incorporate moderate wind penetration rates of 30% and 70%, respectively, produced the most favorable financial outcomes across a variety of metrics, including IRR, ROI and payback periods. These findings underscore the pivotal importance of emissions penalties in enhancing the financial and economic viability of floating wind power as a strategic approach to decarbonization. By incentivizing reductions in CO2 emissions, this policy mechanism effectively facilitates the transition towards cleaner energy technologies.
Notwithstanding the encouraging outcomes, this study underscores that offshore wind power continues to be economically uncompetitive within the broader Brazilian electricity sector, attributed to the availability of more cost-effective renewable energy alternatives, such as onshore wind and solar photovoltaic systems. Nonetheless, the FPSO market presents a promising niche application wherein offshore wind may confer distinct decarbonization advantages. This market could act as a catalyst for the advancement of the offshore wind industry in Brazil, fostering the development of local expertise, infrastructure and supply chains.
A significant element identified in the study is the disparity between carbon credit prices in Brazil and those in international markets. Given that international carbon prices exceed USD 100 per ton of CO2 in specific regions, the capacity to sell Brazilian carbon credits in the international market could substantially enhance the economic viability of floating wind projects. This finding underscores the necessity of aligning Brazil’s carbon credit market with global standards and exploring mechanisms for cross-border carbon trading.
5. Conclusions
This study underscores the transformative potential of floating offshore wind energy in mitigating CO2 emissions associated with FPSO operations, particularly when the level of wind penetration surpasses 100%. Although such elevated levels of integration yield substantial reductions in emissions, they concurrently pose challenges pertaining to energy constraints. This situation necessitates the development of optimized wind capacity planning to reconcile environmental advantages with energy efficiency.
Carbon pricing has emerged as a significant driver of economic viability. Scenarios that incorporate carbon penalties of up to USD 50 per tonne of CO2 markedly enhance the financial performance of integrated wind systems, particularly concerning Net Present Cost, Return on Investment and payback periods. These findings suggest that aligning environmental costs with financial metrics can render decarbonization strategies more appealing to investors and operators.
It is essential to acknowledge that situations defined by moderate wind penetration, approximately 30% to 70%, provide the most economically viable route to decarbonization, achieving a noteworthy equilibrium between a reduction in emissions and economic efficiency. These arrangements contribute to the minimization of energy waste while yielding considerable climate advantages.
Notwithstanding the substantial initial expenses, floating offshore wind signifies a strategic opportunity for the FPSO sector in Brazil. As a specialized application marked by unique emissions challenges, FPSO units can serve as a catalyst for the progress of the Brazilian floating wind industry, thereby promoting wider national and sectoral decarbonization objectives.
The emerging carbon credit market in Brazil exerts a considerable influence on the feasibility of these initiatives. The divergence between domestic and international carbon pricing poses both challenges and opportunities, reconciling Brazil’s carbon pricing with global standards and enabling international trade could enhance project profitability and promote innovation in low-carbon technologies.
To enhance the viability of floating wind power within FPSO operations, it is essential to establish robust policy support. The implementation of stricter carbon penalties or the provision of incentives for carbon pricing mechanisms hold the potential to expedite the energy transition in offshore settings.
Future research initiatives should focus on examining the integration of Battery Energy Storage Systems (BESSs) in Scenarios 4 and 5, with the objective of optimizing fuel economy and further reducing CO2 emissions. The deployment of BESSs would facilitate the storage of surplus energy generated by the wind farm for future use, particularly during periods of diminished wind generation, thereby lessening the effects of wind variability. Additionally, a comprehensive analysis of carbon credit trading mechanisms and the advancement of hybrid renewable energy systems could yield significant insights into the considerable economic and environmental advantages of offshore wind power in the ongoing endeavor to decarbonize the oil and gas sector. Furthermore, future research should emphasize the development of technical strategies to minimize curtailment and evaluate renewable hybrid configurations, such as the amalgamation of wind and solar power, to enhance the economic and environmental performance of FPSO units even further.


 ,
, 


