Article

Investigation of Bio-Oil and Biochar Derived from Cotton Stalk Pyrolysis: Effect of Different Reaction Conditions

1
Bioenergy and Environment Science & Technology Laboratory, College of Engineering, China Agricultural University, Beijing 100083, China
2
Key Laboratory of Clean Production and Utilization of Renewable Energy, Ministry of Agriculture and Rural Affairs, Beijing 100083, China
3
National Center for International Research of BioEnergy Science and Technology, Ministry of Science and Technology, Beijing 100083, China
4
Department of Power Supply and Renewable Energy Sources, National Research University TIIAME, Tashkent 100000, Uzbekistan
5
College of Mechanical and Electrical Engineering, Shihezi University, Beisi Road, Shihezi 832000, China
6
The Faculty of Energy and Fuels, AGH University of Krakow, 30-059 Krakow, Poland
7
Faculty of Chemical Engineering & Technology, Jejawi Complex of Academics (3), UniMAP, Arau Perlis 02600, Malaysia
*
Authors to whom correspondence should be addressed.
Resources 2025, 14(5), 75; https://doi.org/10.3390/resources14050075
Submission received: 21 March 2025 / Revised: 13 April 2025 / Accepted: 23 April 2025 / Published: 28 April 2025

Abstract

:
This work aimed to conduct a kinetic study of cotton stalks (CSs) through TGA to examine the impact of reaction conditions on bio-oil yield derived from CS slow pyrolysis using a tube furnace lab-scale reactor, as well as a characterization of bio-oil and biochar products. The iso-conversional approaches of Kissinger–Akahira–Sunose (KAS) and Flynn–Wall–Ozawa (FWO) were applied to estimate kinetic parameter activation energy (Ea) for the range of conversion degrees (α = 0.1–0.9). The kinetic results demonstrated that the average values of Ea for secondary pyrolysis were lower compared to those of primary pyrolysis; this could be explained by the fact that mainly cellulose degrades during primary pyrolysis, which requires more energy to be degraded. The pyrolysis findings indicated that the highest yield of bio-oil was 38.5%, which occurred at conditions of 500 °C and 0.5–1 mm size, while retention time showed an insignificant effect on pyrolysis oil. GC–MS analysis demonstrated that bio-oil is dominated by phenol compounds, which account for more than 40% of its components. SEM and XRD analyses emphasized that biochar is porous and has an amorphous shape, respectively. It can be concluded that these outcomes confirm that CSs have the potential to be a good candidate for a feedstock material for bioenergy production via the pyrolysis process.

1. Introduction

Energy produced from fossil fuels has detrimental social, political, and environmental effects. Moreover, burning fossil fuel has increased carbon dioxide (CO2) levels globally and accelerated climate change. These implications have attracted more attention to renewable energy source development [1]. over the decreasing supply of fossil fuels and the increasing emissions of greenhouse gases (GHGs) are conducive to a growing emphasis on utilizing biomass energy as an alternative fuel, particularly from forestry and agricultural wastes, due to its low cost and availability [2]. Biomass resources have the ability to be transformed to solid, liquid, and gaseous fuels. When compared with fossil fuels, biomass energy emits less CO2 and has lower content of nitrogen and sulfur [3]. Biomass derives either directly or indirectly from sun energy. The emitted CO2, a byproduct of biomass combustion, can be reabsorbed via photosynthesis through the growth of green plants. Consequently, biomass is a source of renewable energy that can potentially satisfy the needs of sustainable development [4]. Cotton stalks (CSs), a byproduct of the cultivation of cotton, is becoming an important agricultural waste via its potential uses throughout many industries. Annually, huge amounts of CSs are generated worldwide—about 90.3 to 129 million tons—but this material is commonly neglected and categorized as waste [5]. However, CSs have high percentages of lignin, hemicellulose, and cellulose contents, which make it a good candidate for bioenergy production via thermo-chemical conversion methods. Therefore, exploiting CS biomass for bioenergy generation could contribute significantly to emission reduction, as well as providing further income for cotton farmers.
Biomass as a solid fuel has attracted researchers’ interest due to its potential to aid in reducing dependency on fossil fuels as well as address climate change issues [6]. Biomass energy has gained great attention due to its low CO2 emissions, high content of hydrogen, and widespread distribution. By 2050, energy derived from biomass will account for almost half of the energy consumption in the world; of this, developed countries consume approximately 80%. Furthermore, biomass resources have been used as fuels for long periods throughout history and, recently, it has been found that biomass can be utilized with different thermal methods (mixed combustion, pure combustion, pyrolysis, and gasification) for generating energy along with other value-added outputs [7].
The pyrolysis process is considered the first stage in all thermal processes, and plays an important role in the thermo-chemical conversion of biomass [7]. It refers to the thermal degradation of biomass in an oxygen-free atmosphere. In terms of operations, the pyrolysis method can be categorized into three different stages: flash, fast, and slow pyrolysis [8]. Many studies have been conducted on CS pyrolysis using different reactors and conditions. For instance, the impact of CS particle size and reaction temperature on the fast pyrolysis technique was investigated in a bubbling fluidized-bed reactor. The findings determined the highest bio-oil output to be at a temperature of 490 °C and a 1 mm feedstock particle size [9]. Another study examined the microwave-assisted pyrolysis of CSs under various parameters (reaction temperature, microwave power, and retention time). These conditions were optimized to obtain maximum bio-oil production (32.47%) [10]. Valorized colored cotton residue was investigated using a micro-pyrolyzer. The results demonstrated significant energetic ability and depicted a presence of oxygenated substances, light organic acids, and phenols in pyrolysis products, implying its use as an alternative energy source and bioenergy generator [11]. On the other hand, investigating CSs via slow pyrolysis is still not well established. Therefore, studying CSs through slow pyrolysis, adopting different conditions for bio-oil production, could contribute significantly to the utilization of these residues and produce clean energy as well.
The pyrolysis of solid fuels involves two major steps: primary and secondary pyrolysis. The primary stage takes place at a lower temperature, where solid fuel deteriorates into tar, char, lighter gases, and ash. Secondary pyrolysis is a process in which primary pyrolysis products, particularly tar, undergoes additional chemical reactions at a higher temperature and longer retention time [12]. Cellulose, hemicellulose, and lignin of biomass degrade through the primary reaction, yielding primary as well as intermediate byproducts. The intermediate products undergo a secondary reaction which depends on the reaction parameters and feedstock characteristics [13]. Consequently, understanding the biomass’s thermal decomposition is critical for determining the optimal temperature of biomass conversion for combustion or pyrolysis. Kinetic studies of thermal and chemical processes can help to predict the reaction’s performance and energy [14]. Furthermore, estimating the pyrolysis kinetics is crucial for predicting biomass decomposition behavior through the pyrolysis process, which provides the basis of designing the reactors. The thermal decomposition of biomass involves several steps, making it a complex process. However, the International Confederation for Thermal Analysis and Calorimetry (ICTAC) strongly recommends the use of iso-conversional (IC) approaches to determine the kinetic triplet of thermal degradation, which includes activation energy [15]. The IC, also known as the model-free method, is the most extensively used method for studying biomass pyrolysis kinetics. Generally, there are two kinds of model-free approaches: differential and integral. The differential iso-conversional technique’s reliance on the instantaneous rate values makes it vulnerable to trial noise, resulting in numerical instability. Using the integral method, particularly in TGA experiments, can effectively avoid this matter [16]. The Kissinger–Akahira–Sunose (KAS) and Flynn–Wall–Ozawa (FWO) approaches are common integral non-isothermal iso-conversion methods [17]. In the present study, the FWO and KAS models were employed to determine the activation energy (Ea) of CSs using TGA data. However, more attention is given to the pyrolysis technique due to several benefits. It can convert biomass materials to biochar, gases, and bio-oil. Each of these products can be utilized for various purposes. The gases are capable of being used to generate heat and electricity. Bio-oil could serve as a boiler fuel or a raw material for chemicals. Biochar can be gasified to produce syngas, or utilized as an adsorbent, biofuel, or amendment for soil [18]. However, in this research, a kinetic analysis was first carried out to investigate CS decomposition behavior. The effects of reaction conditions (including biomass characteristics) on pyrolysis products were then explored, while many other investigations focusing on other conditions including heating rate, reaction temperature, and carrier gas flow rate, not including feedstock particle size, were performed.
Exploiting biomass wastes as a renewable energy using efficient techniques can provide alternative green fuels which contributes positively to the reduction of GHG emissions in the environment. Reaction parameters such as residence time, temperature, and biomass characteristics have an impact on the yield and properties of the products produced during the pyrolysis process. Therefore, this study aimed to perform kinetic analysis to estimate the activation energy of CSs using thermogravimetric analysis (TGA) data and to estimate the impact of reaction conditions (particle size, temperature, and retention time) on bio-oil yield derived from CS pyrolysis adopting the single factor method, and further characterize the bio-oil and biochar products utilizing analytical methods including gas chromatography–mass spectrometry (GC–MS), TGA, scanning electron microscopy (SEM), X-ray diffraction (XRD) analysis, energy yield, and energy densification. This work integrates both the determination of Ea and investigation of unique reaction conditions (temperature, retention time, and particle size) via TGA and analysis of the pyrolysis process of CS biomass, respectively. According to kinetic Ea values, it has been found that smaller biomass particle sizes are more suited to the pyrolysis process due to increased heat transmission efficiency, which is in conformity with the pyrolysis experiments, where the highest bio-oil yield occurred using smaller sizes of CSs (0.5–1 mm) at a reaction temperature of 500 °C, while the other sizes (1–1.5 and 1.5–2 mm) generated more gases. Therefore, this research provides insightful information about the kinetic and pyrolysis processes of CSs; hence, it can be used as a valuable reference for researchers and stakeholders.

2. Materials and Methods

2.1. Samples Preparation and Characteristics

Cotton stalk samples were collected from Xinjiang Province, China. CS samples were collected in the 2023 season, directly after the cotton harvest, and used in experiments after 45 days. The dried samples were cut into smaller sizes and then crushed to sizes of 0.5–1, 1–1.5, and 1.5–2 mm. The prepared raw materials were placed in an oven at 105 °C for 4 h. After that, they were packed in bags and stored in a dry place to be used later in experiments.
A German Element Analyzer (Model: UNICUBE) was used for the ultimate analysis. The sample was decomposed by catalyst oxidation in an oxygen environment at a high temperature (1800 °C), the non-detected gases such as volatile halogen were removed and different component gases were separated by a special adsorption column, then the corresponding gases were detected by a Thermal Conductivity Detector using nitrogen as a carrier and purge gas. The proximate test was performed in accordance with the current Chinese national standard (GB/T28732-2012). Calorific value was measured using a bomb calorimeter. The cellulose, hemicellulose, and lignin percentages in CS raw materials were measured using the Van Soest Method of Detergent Fiber Analysis [19].

2.2. Experimental Design and Procedures

Pyrolysis products were investigated adopting various operation conditions, including temperature (°C), particle size (mm), and retention time (min). The single factor method was used to conduct the experiments and to understand the effect of factors on the liquid yield. The single factor research approach involves changing a single factor within a specific range while keeping all other variables constant. The adopted operation conditions of CS slow pyrolysis were: temperature (400, 450, 500, 550, and 600 °C); particle size (0.5–1, 1–1.5, and 1.5–2 mm); and retention time (15, 25, 35, and 45 min).
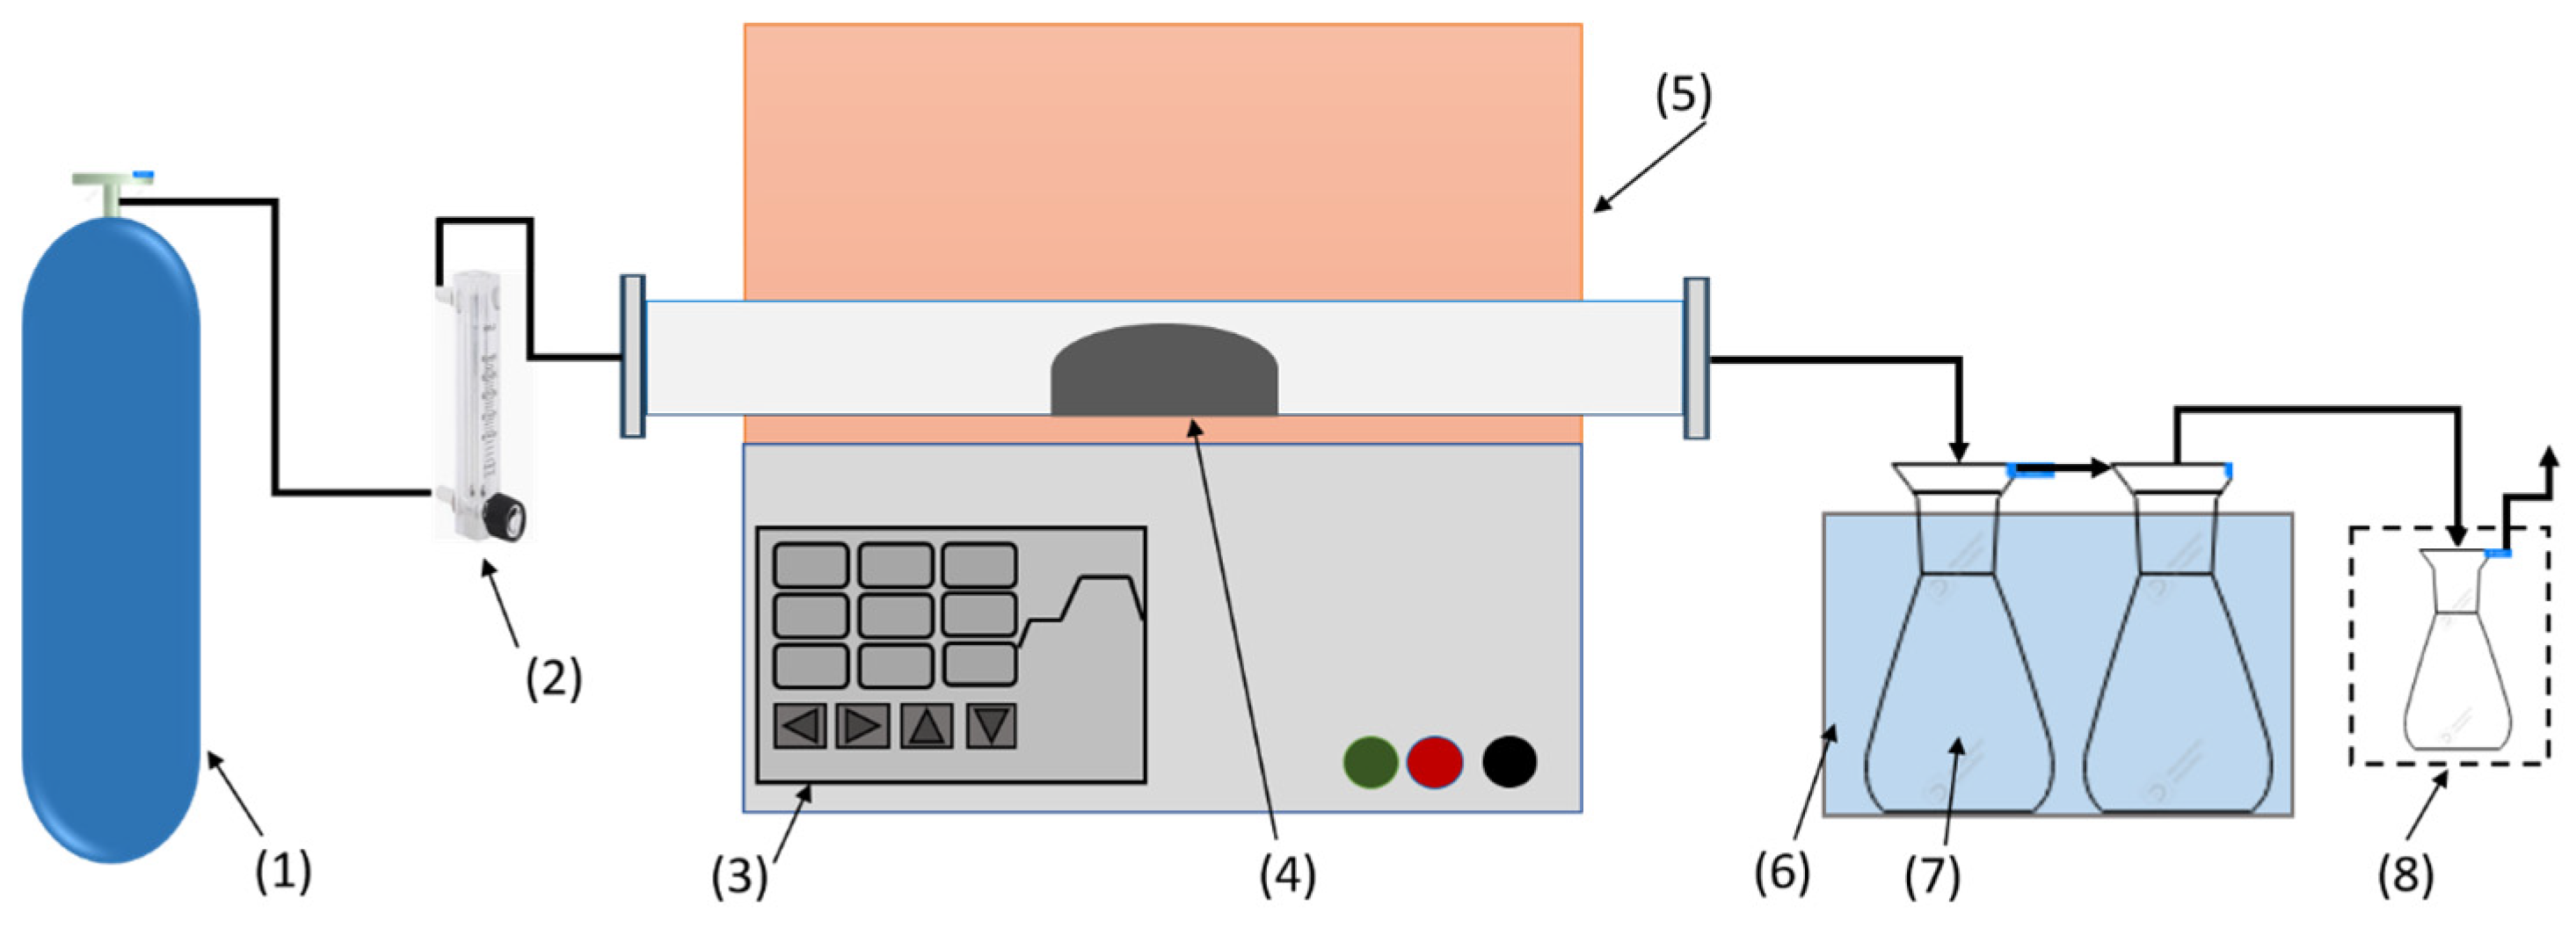
The slow pyrolysis experiments were conducted in a fixed-bed reactor (tube furnace) Hefei Kejing Material Technology Co., Ltd., (OTF-1200X, Kejing, Hefei, China). As demonstrated in Figure 1, the system contains a gas supply, gas flowmeter, quartz tube, liquid yield collector, and flue gas purifier (a water filter was used to trap gases which include heavy hydrocarbons). The sample of CS (30 g) was placed directly in the center of the tube (1000 mm length, internal diameter 54 mm, length of temperature zone 150 mm). The tube was purged with high purity Ar gas (99.99%) at a flow rate of 200 mL/min. To start the experiment, the temperature of the furnace was programed from 20 °C to increase gradually to the selected temperatures of 400, 450, 500, 550, and 600 °C, with 10 °C/min as the rate of heat increase. Liquid products were collected by condensation using two glass bottles (500 mL size) placed inside iced water. To ensure accurate results, each experiment was conducted in three replicates.

2.3. Yield Calculations

The liquid yield was determined by weighing the bottles before and after the experiment, then it was computed as a percentage of the sample’s initial weight. Biochar yield was obtained by the difference between the final solid product and the sample weight. For the gas yield, it was calculated by the difference between 100% and the sum of solid and liquid yields. Equations (1) and (2) show the calculation of liquid and solid yields [20,21].
L i q u i d   y i e l d w t % = w e i g h t   o f   l i q u i d ( g ) w e i g h t   o f   b i o m a s s   s a m p l e ( g ) × 100
B i o c h a r   y i e l d w t % = w e i g h t   o f   b i o c h a r ( g ) w e i g h t   o f   b i o m a s s   s a m p l e ( g ) × 100
The energy densification ratio and energy yield of CS biochar were determined using Equations (3) and (4) [22].
E n e r g y   d e n s i f i c a t i o n   r a t i o = c a l o r i f i c   v a l u e   o f   c h a r c a l o r i f i c   v a l u e   o f   b i o m a s s
E n e r g y   y i e l d = c h a r   y i e l d × E n e r g y   d e n s i f i c a t i o n   r a t i o

2.4. Thermogravimetric Tests

Thermogravimetric tests of CS samples were performed using a TG analyzer (TGA 5500, TA Instruments, United State of America (USA)). Approximately 6.5 mg of CS sample was placed in a heat-resistant platinum pot. The reactor’s temperature was adjusted to gradually increase from 30 °C to 800 °C at a rate of 10 °C/min. The furnace was purged with helium gas at a flow rate of 25 mL/min. The TRIOS program was used to analyze the recorded data.
Pyrolysis progress (conversion degree devolatilization) α (−) was calculated using sample weight loss as a function of temperature:
α = M 0 M t M 0 M f
where M0, Mt, and Mf are the initial, actual, and final weights of the sample, respectively.

2.4.1. Non-Isothermal Model-Free Iso-Conversion Method

The activation energy of the pyrolysis process was determined by employing IC approaches. These methods assume the same conversion degree (α) of a given value of Ea, regardless of heating rate, and that the Ea fluctuates as the progress of process. Every chemical process is progressive, reflecting various aspects of the mechanism across the whole reaction route [23]. To conduct kinetic analysis using IC methods, numerous TG measurements at various heating rates are required. The values of Ea are calculated using data from multiple kinetic curves rather than, as with a single fitting approach, at varied heating rates for a constant α. The Ea value can be obtained at any stage of the process, allowing for a thorough evaluation of the kinetics and reaction mechanism, and its degree of complexity as it advances [24]. The IC study of kinetics provides for exact, near-actual activation energy estimates, limiting issues caused by the impacts of mass transfer and energy at varying heating rates. This analysis also helps to avoid problems caused by the imprecise evaluation of the reaction models.
The model-free approach employed in this study served as the foundation for the IC methods. The IC techniques of FWO and KAS were applied to determine various kinetic parameters that occur via the pyrolysis of CS. The ICTAC has recommended that FWO and KAS are precise procedures for kinetic parameter calculations. Differential or integral approaches are the two types of IC methods. Two integral approaches that are frequently used are FWO and KAS.
Calculations of Ea were conducted for the α range from 0.1 to 0.9, and four heating rate constants (β = 10, 15, 20, and 25 °C/min). This work concerns pyrolysis at a heating rate of 10 °C/min. However, measurements at other heating rates were used to calculate Ea, and these measurements showed trends similar to those at 10 °C/min. For both formulas, R represents the universal constant of gas (8.314 J/mol·K) [24].

2.4.2. Flynn–Wall–Ozawa (FWO) Method

The Ea is often determined using the FWO method, which is dependent upon TGA data conducted at heating constant rates. Following that, a linear function with a slope corresponding to the Ea is calculated by combining the natural logarithm of the degradation fraction and the inverse of the absolute temperature. Doyle’s approximations algorithm [25] was then applied to obtain the subsequent Equation (6):
l o g β = log A E a R g a 5.331 1.052 E a R T
where β is the heating rate (°C/min), g(α) is a constant at a known conversion value, 1/T is the linear relationship with a given conversion value at different rates, A is the frequency or pre-exponential factor, Ea is the activation energy of the reaction, R is the universal gas constant (8.314 J/mol·K), and T is the absolute temperature. The apparent Ea can be determined via a plot of log(β) versus 1/T at a specific conversion for different heating rates.

2.4.3. Kissinger–Akahira–Sunose (KAS) Method

The Arrhenius formulation serves as the foundation for the KAS, which is a differential method. This approach leads to the conclusion that the heating rate logarithm over the square of absolute temperature versus the reciprocal of absolute temperature is a linear function for a given conversion degree (to understand it another way, the slope and activation energy are proportional). By using the Murray–White approximation [26] and the Coats–Redfern method [27], we obtained the KAS model, which is expressed by the Equation (7):
l o g β T 2 = log R A E a g a E a R T
Ea can be calculated using Equation (6) from the slope (−Ea/RT) on a plot of log (β/T2) versus 1/T at a particular conversion for various heating rates.

2.5. Analysis of Pyrolysis Products

The compositions of tar compounds were determined using GC–MS model 7890A/5975C, Agilent Technologies, Santa Clara, CA, USA. Acetone solution was utilized to swill the condensed bottles to collect tar products. Powder of copper sulfate (anhydrous) was utilized to soak up moisture, followed by filtration via a quartz microporous membrane (0.22 μm). The GC–MS column was DB-5MS (30 m length, 0.25 mm diameter, and film thickness of 0.25 μm). Chromatographic conditions were: 1 μL injection volume, unsplit stream sampling, injector temperature adjusted to 250 °C, flow rate 64.20 mL/min. The temperature of the column was maintained at 60 °C for 5 min before gradually increasing to 270 °C with a rate of heat of 5 °C/min for 10 min. Pure helium gas (He) was employed as the carrier gas. The chromatographic peaks for each target component achieved using the aforementioned chromatographic parameters were compared to the NIST, 2008 (National Institute of Standards and Technology, USA) database of MS. The component yields were obtained as a peak area percentage.
The physical morphology of biochar surface was analyzed using SEM, SU3500, Hitachi, Japan, with parameters of 100 µm resolution and 10.0 kV acceleration. The XRD instrument was used to assess the structure and crystallinity of biochar.
The liquid yield data were assessed utilizing Statistical Package for the Social Sciences (SPSS), and differences among averages were examined via analysis of variance (ANOVA) using LSD (least significant difference) with p-value (p ˂ 0.05).
3. Results and Discussion

3.1. Characteristics of CS Biomass

The CS samples underwent the proximate, ultimate, and chemical composition analyses (hemicellulose, cellulose, and lignin). Table 1, depicts the results of those tests.

3.2. Thermogravimetric (TGA) Results

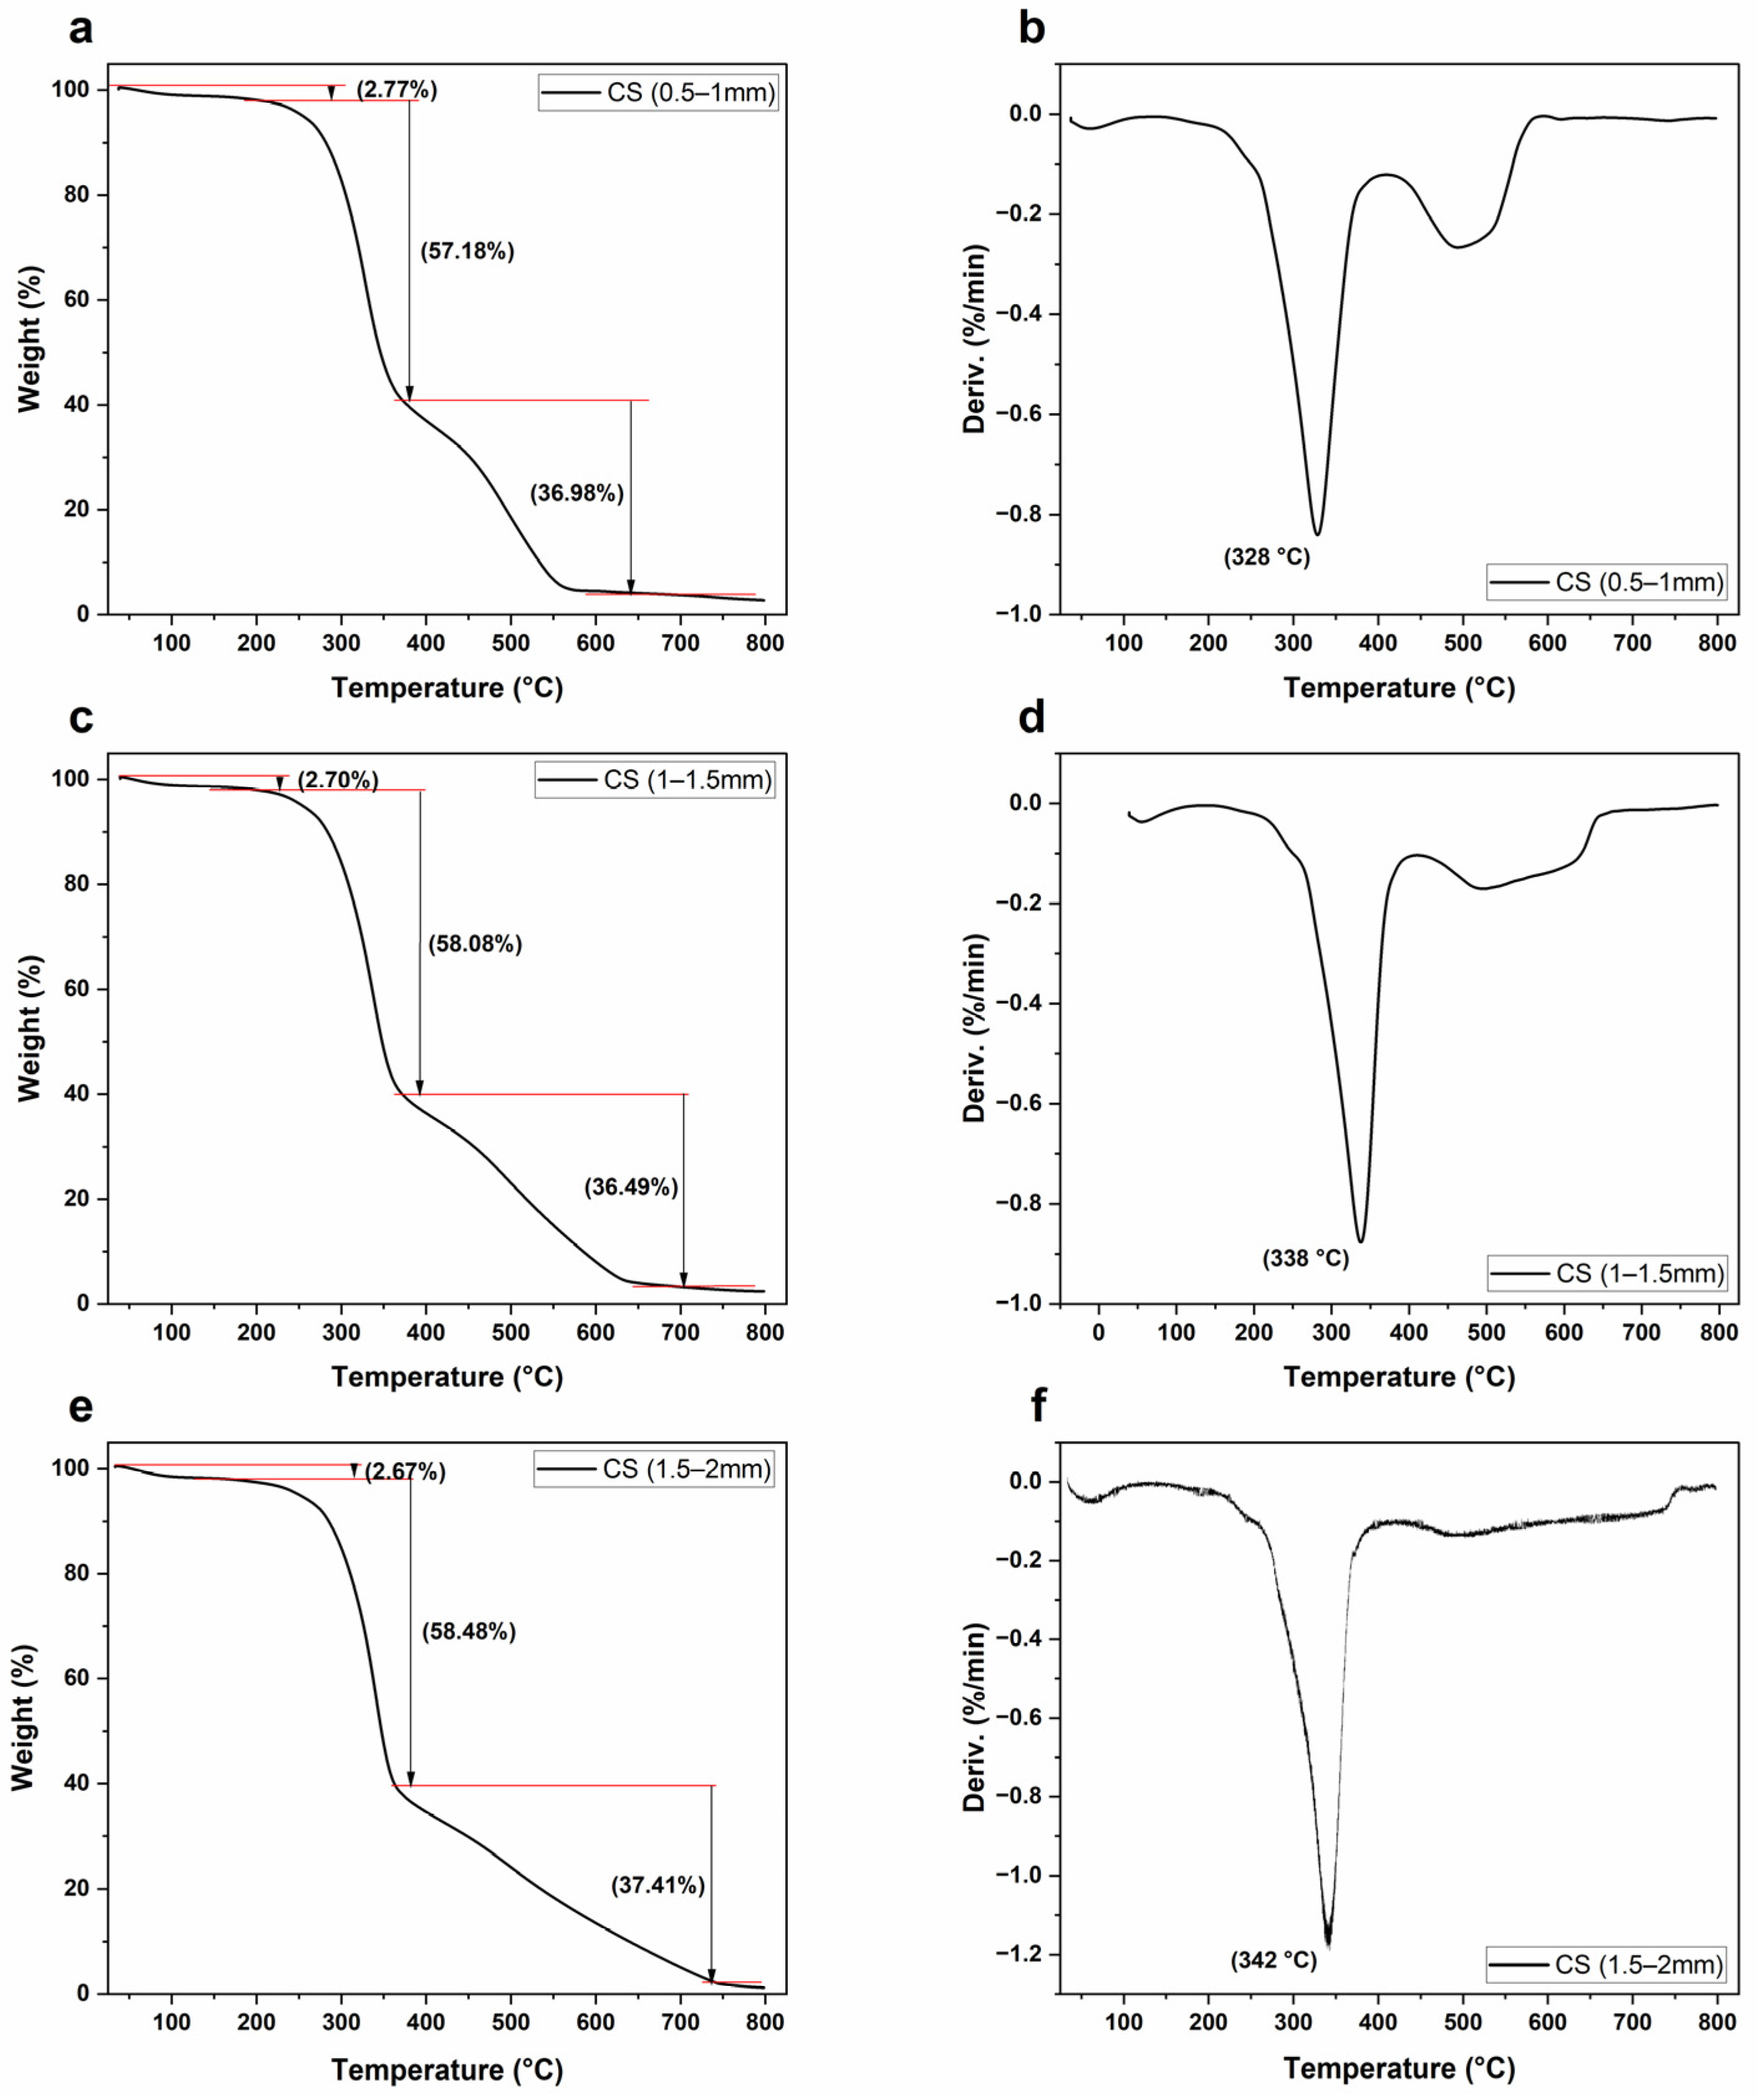
TGA is a critical technique for determining the thermal degradation mechanism of a feedstock materials [28]. According to Figure 2, TGA/DTG analysis of CS samples with different sizes (0.5–1, 1–1.5, and 1.5–2 mm) demonstrated the weight loss in three stages. The thermal decomposition of these stages can be classified as moisture evaporation, release of volatile matter content, and slow carbonization for solid products [29]. The water evaporation in the first stage of all samples occurred between 30–200 °C with weight loss of almost 2.7% attributed to the low content of moisture in the CS sample (Table 1). Also, the second stage (so called primary pyrolysis) shows similar trend which occurred between 200–370 °C with weight loss of (57.18, 58.08, and 58.48%) due to the degradation of cellulose and hemicellulose. It has been noticed that when the sample size increased the peak shoulder of temperature on DTG curve was also increased, the highest temperature peak values were 328, 338 and 342 °C for CS samples (0.5–1, 1–1.5, and 1.5–2 mm) respectively. The last stage of CS samples decomposition (secondary pyrolysis) occurred after 400 °C and followed by steady trend when the temperature reached around 600, 640, and 735 °C for the feedstock particle size (0.5–1, 1–1.5, and 1.5–2 mm) respectively. The most intense degradation stage for biomass feedstocks took place in the second phase which represents the major pyrolysis zone (primary pyrolysis). A study conducted by Hopa and others [3] revealed that the loss of mass in the initial phase was caused by moisture evaporation and decay of lower-temperature volatile, while the second phase (stage) which represents the major pyrolytic region, showed thermal breakdown of biomass chemical composition (hemicellulose, cellulose, and lignin). The final phase is credited to fully breakdown of lignin and formation of char and ash.

Activation Energy

The kinetic parameter Ea obtained by the KAS and FWO iso-conversion approaches was estimated for the conversion degree ranges α = 0.1 to 0.9 to avoid uncertainties in initial and ultimate values and provide the most results that are reliable. Table 2 and Table 3 describe the activation energy values and coefficient of determination R2 (which measures the fitting of experimental data to the model) of primary pyrolysis for analyzed samples.
The obtained R2 determination coefficient values were high—the lowest value obtained was 0.9513 with most of the other R2 values being much higher. Moreover, in each case, the FWO method was characterized by higher R2 values. These results imply that the measurement data fits well with the models utilized (particularly FWO).
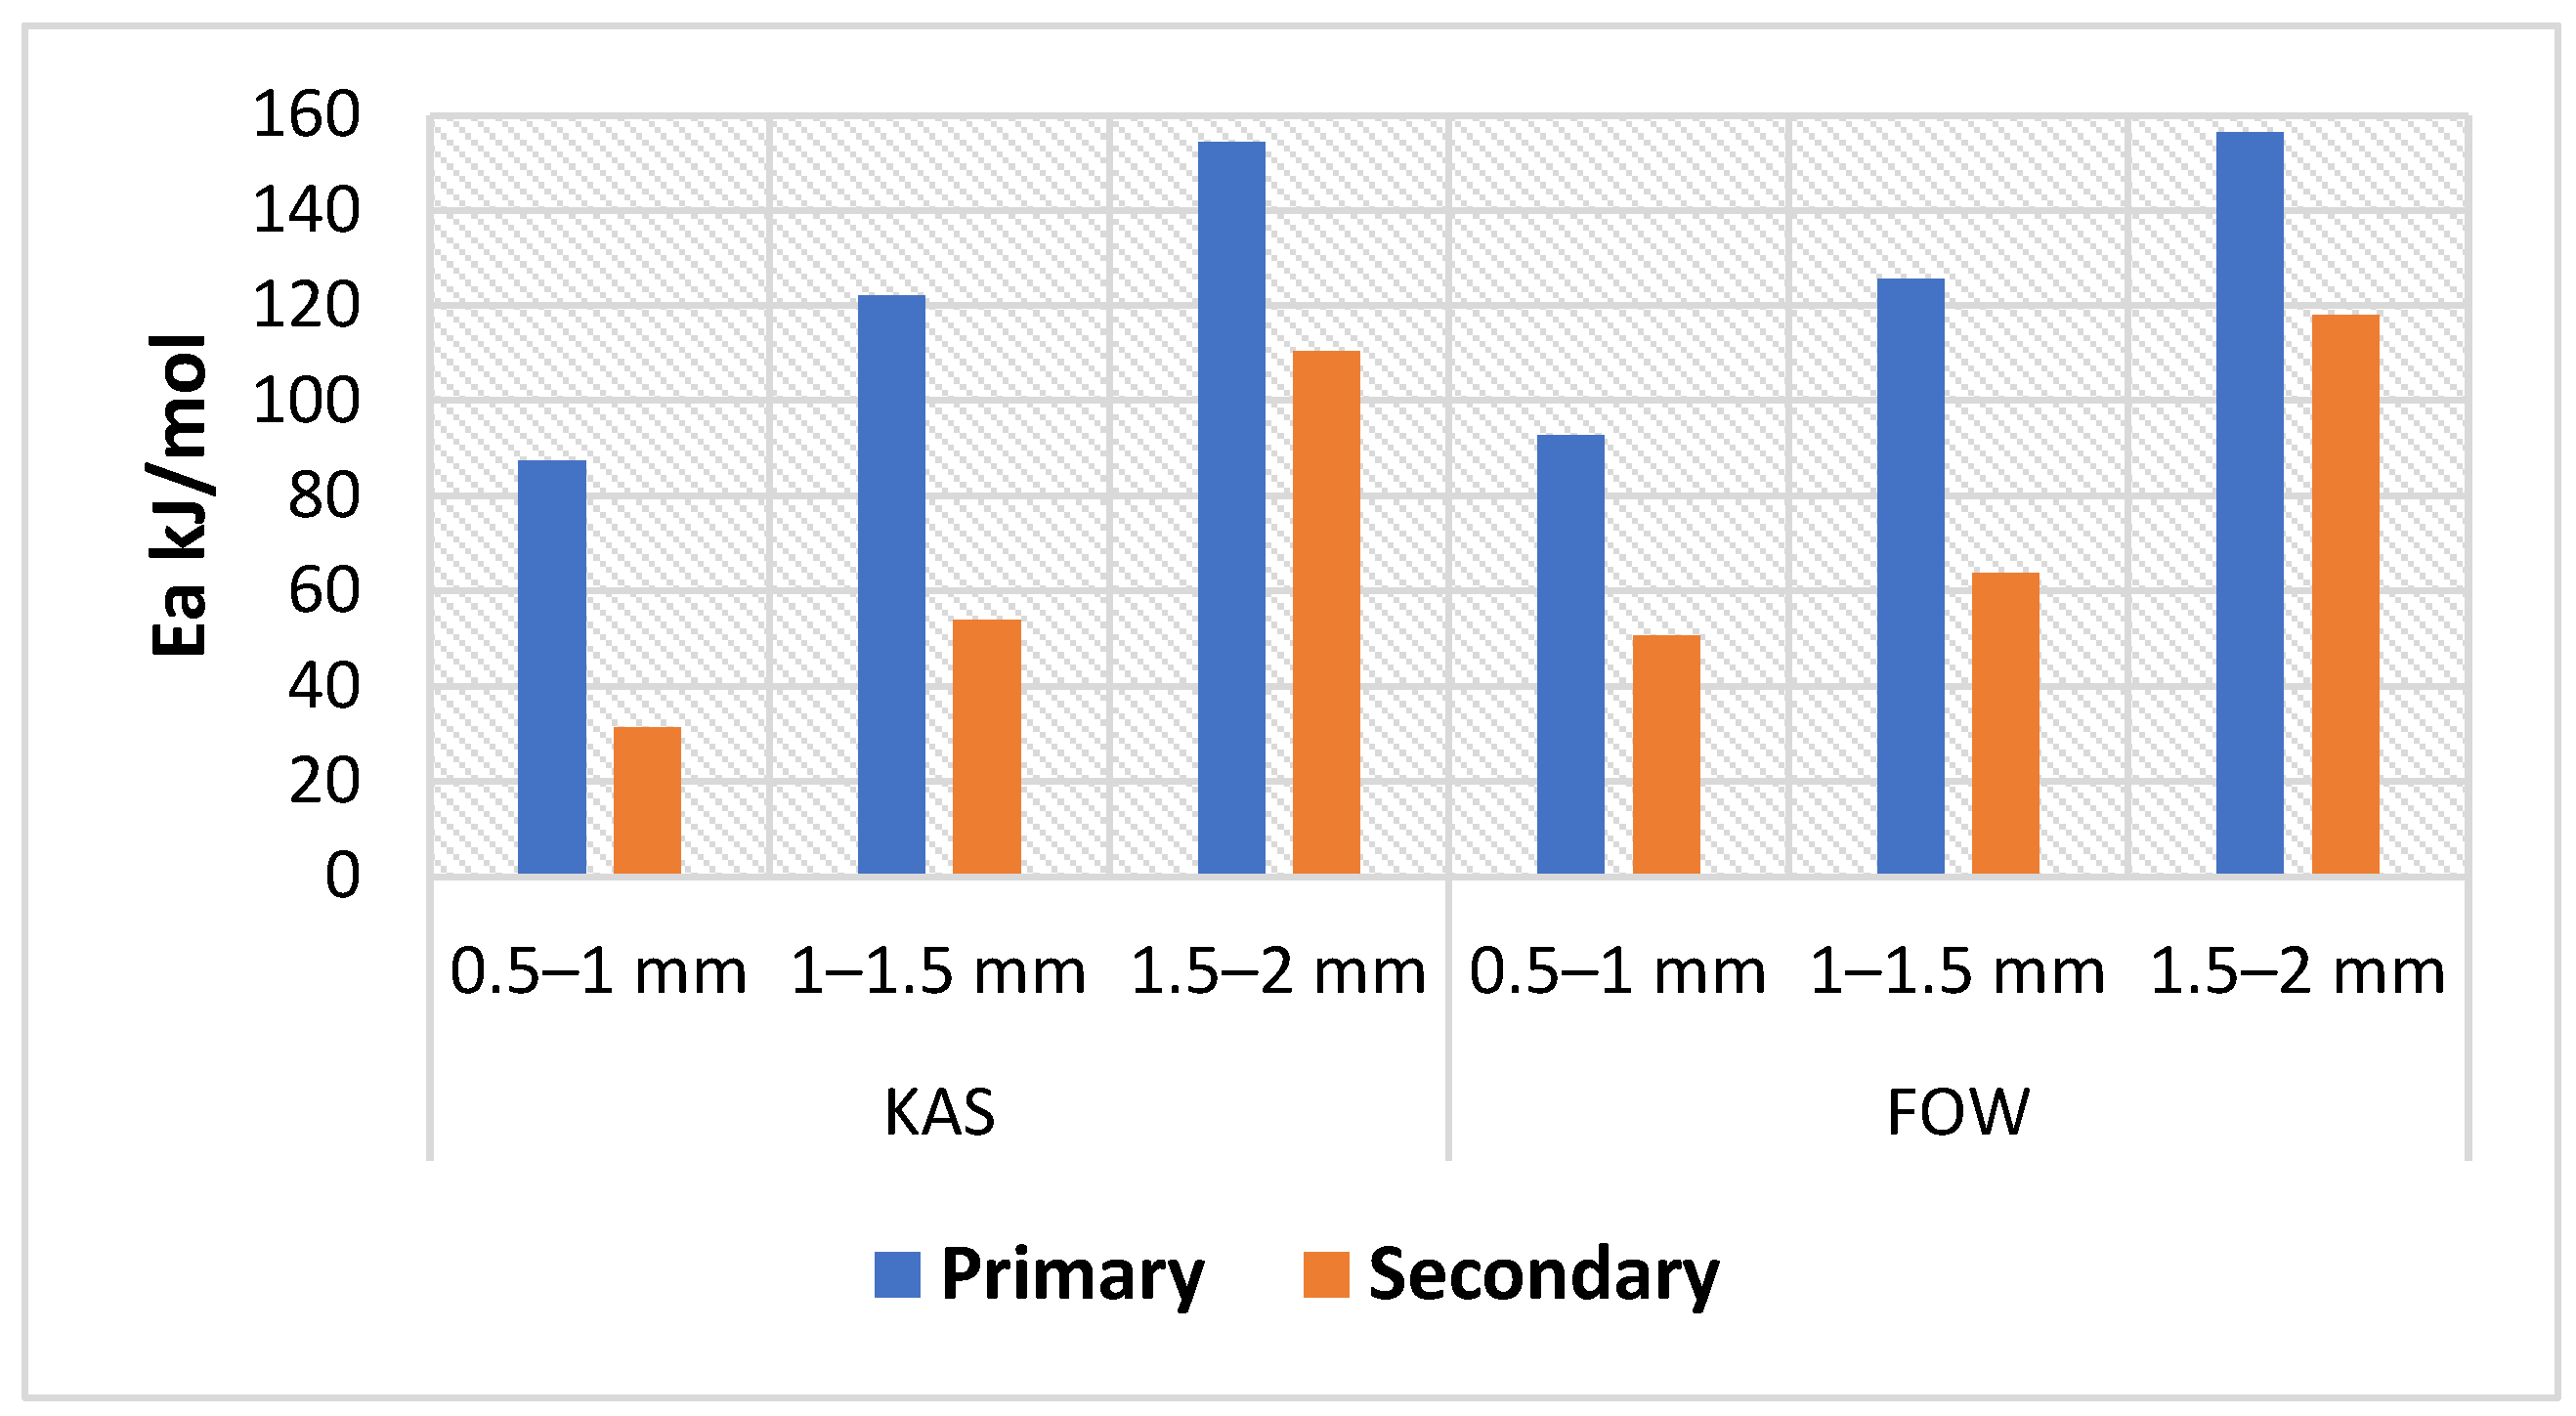
The data provided in Table 2 and Table 3 and Figure 3, demonstrate that the Ea values were always higher for the FWO method, and the bigger the particle sizes, the smaller the differences (the differences were in the range between 1.2–5.7 kJ/mol).
For the sample with the lowest particle size, a slight decrease in the Ea values is observed in the initial stage of the primary pyrolysis (to alpha ~0.4) and then there is an increase in this value (particularly intense from alpha ~0.6). As the particle size increases to 1–1.5, the decrease in Ea at the initial stage visible for the sample with the lowest particle size is no longer observed. In this case, Ea values increase over the entire alpha range, but this increase is very mild up to alpha of approximately 0.6 and then intense. In turn, for the sample with the largest particle size, Ea values increase intensively over the entire alpha range.
As can be seen in Table 2 and Table 3, the Ea is highly relying on conversion degree, indicating that pyrolysis technique is a complicated procedure involving various reactions. Nevertheless, smooth changes in Ea were occurred as the conversion degree increased from 0.1 to 0.6 (for samples with particle size 0.5–1 and 1–1.5), due to the lignin and hemicellulose pyrolysis [30]. As the pyrolysis progressed, the Ea values significantly increased due to the degradation of cellulose (which has the maximum activation energies; 145–285 kJ/mol) [31]. Moreover, higher particle sizes gave different character and higher activation energies compared with the lower particle sizes. The cause for this could be due to a constraint in heat transfer among CS particles. Therefore, when the feedstock particle size rises, heat transmission across biomass particles diminishes, consequently, less biomass particles get into touch; lowering the chance of reaction, and ultimately, higher Ea needed to overcome these limitations [32]. Thus, it can be concluded that smaller size of particles is better suitable for the process of pyrolysis due to increased heat transmission efficiency.
The mean values of Ea of primary pyrolysis amount to: 87.4/92.6; 122.0/125.6, and 154.4/156.4 kJ/mol (KSA/FWO) for 0.5–1, 1–1.5, and 1.5–2, respectively. These values are similar to some presented in the literature [33,34,35,36].
In the case of secondary pyrolysis (Table 4 and Table 5, and Figure 3), a trend is also observed that the FWO method gives higher Ea values and that these values (both average and for a given conversion degree) generally increase as the CS particle sizes rise (thus confirming the negative impact of high grain size on the process). As for the nature of the curves, a decrease in Ea is generally observed with the degree of conversion (the exception is the process for samples with particles 1.5–2), which indicates the decomposition of main lignin and low residual cellulose at this stage.
Comparing the values obtained for primary and secondary pyrolysis, it can be concluded that the average Ea values of the secondary pyrolysis are lesser than those values of the primary pyrolysis. The result could be clarified due to the fact that cellulose decomposes primarily during primary pyrolysis. Because of higher thermal degradation characteristics, cellulose requires greater amounts of energy to be decayed, hence, the mean Ea of primary pyrolysis was comparatively higher than that of the secondary pyrolysis [31].

3.3. Product Yield Distribution

3.3.1. Temperature Effect

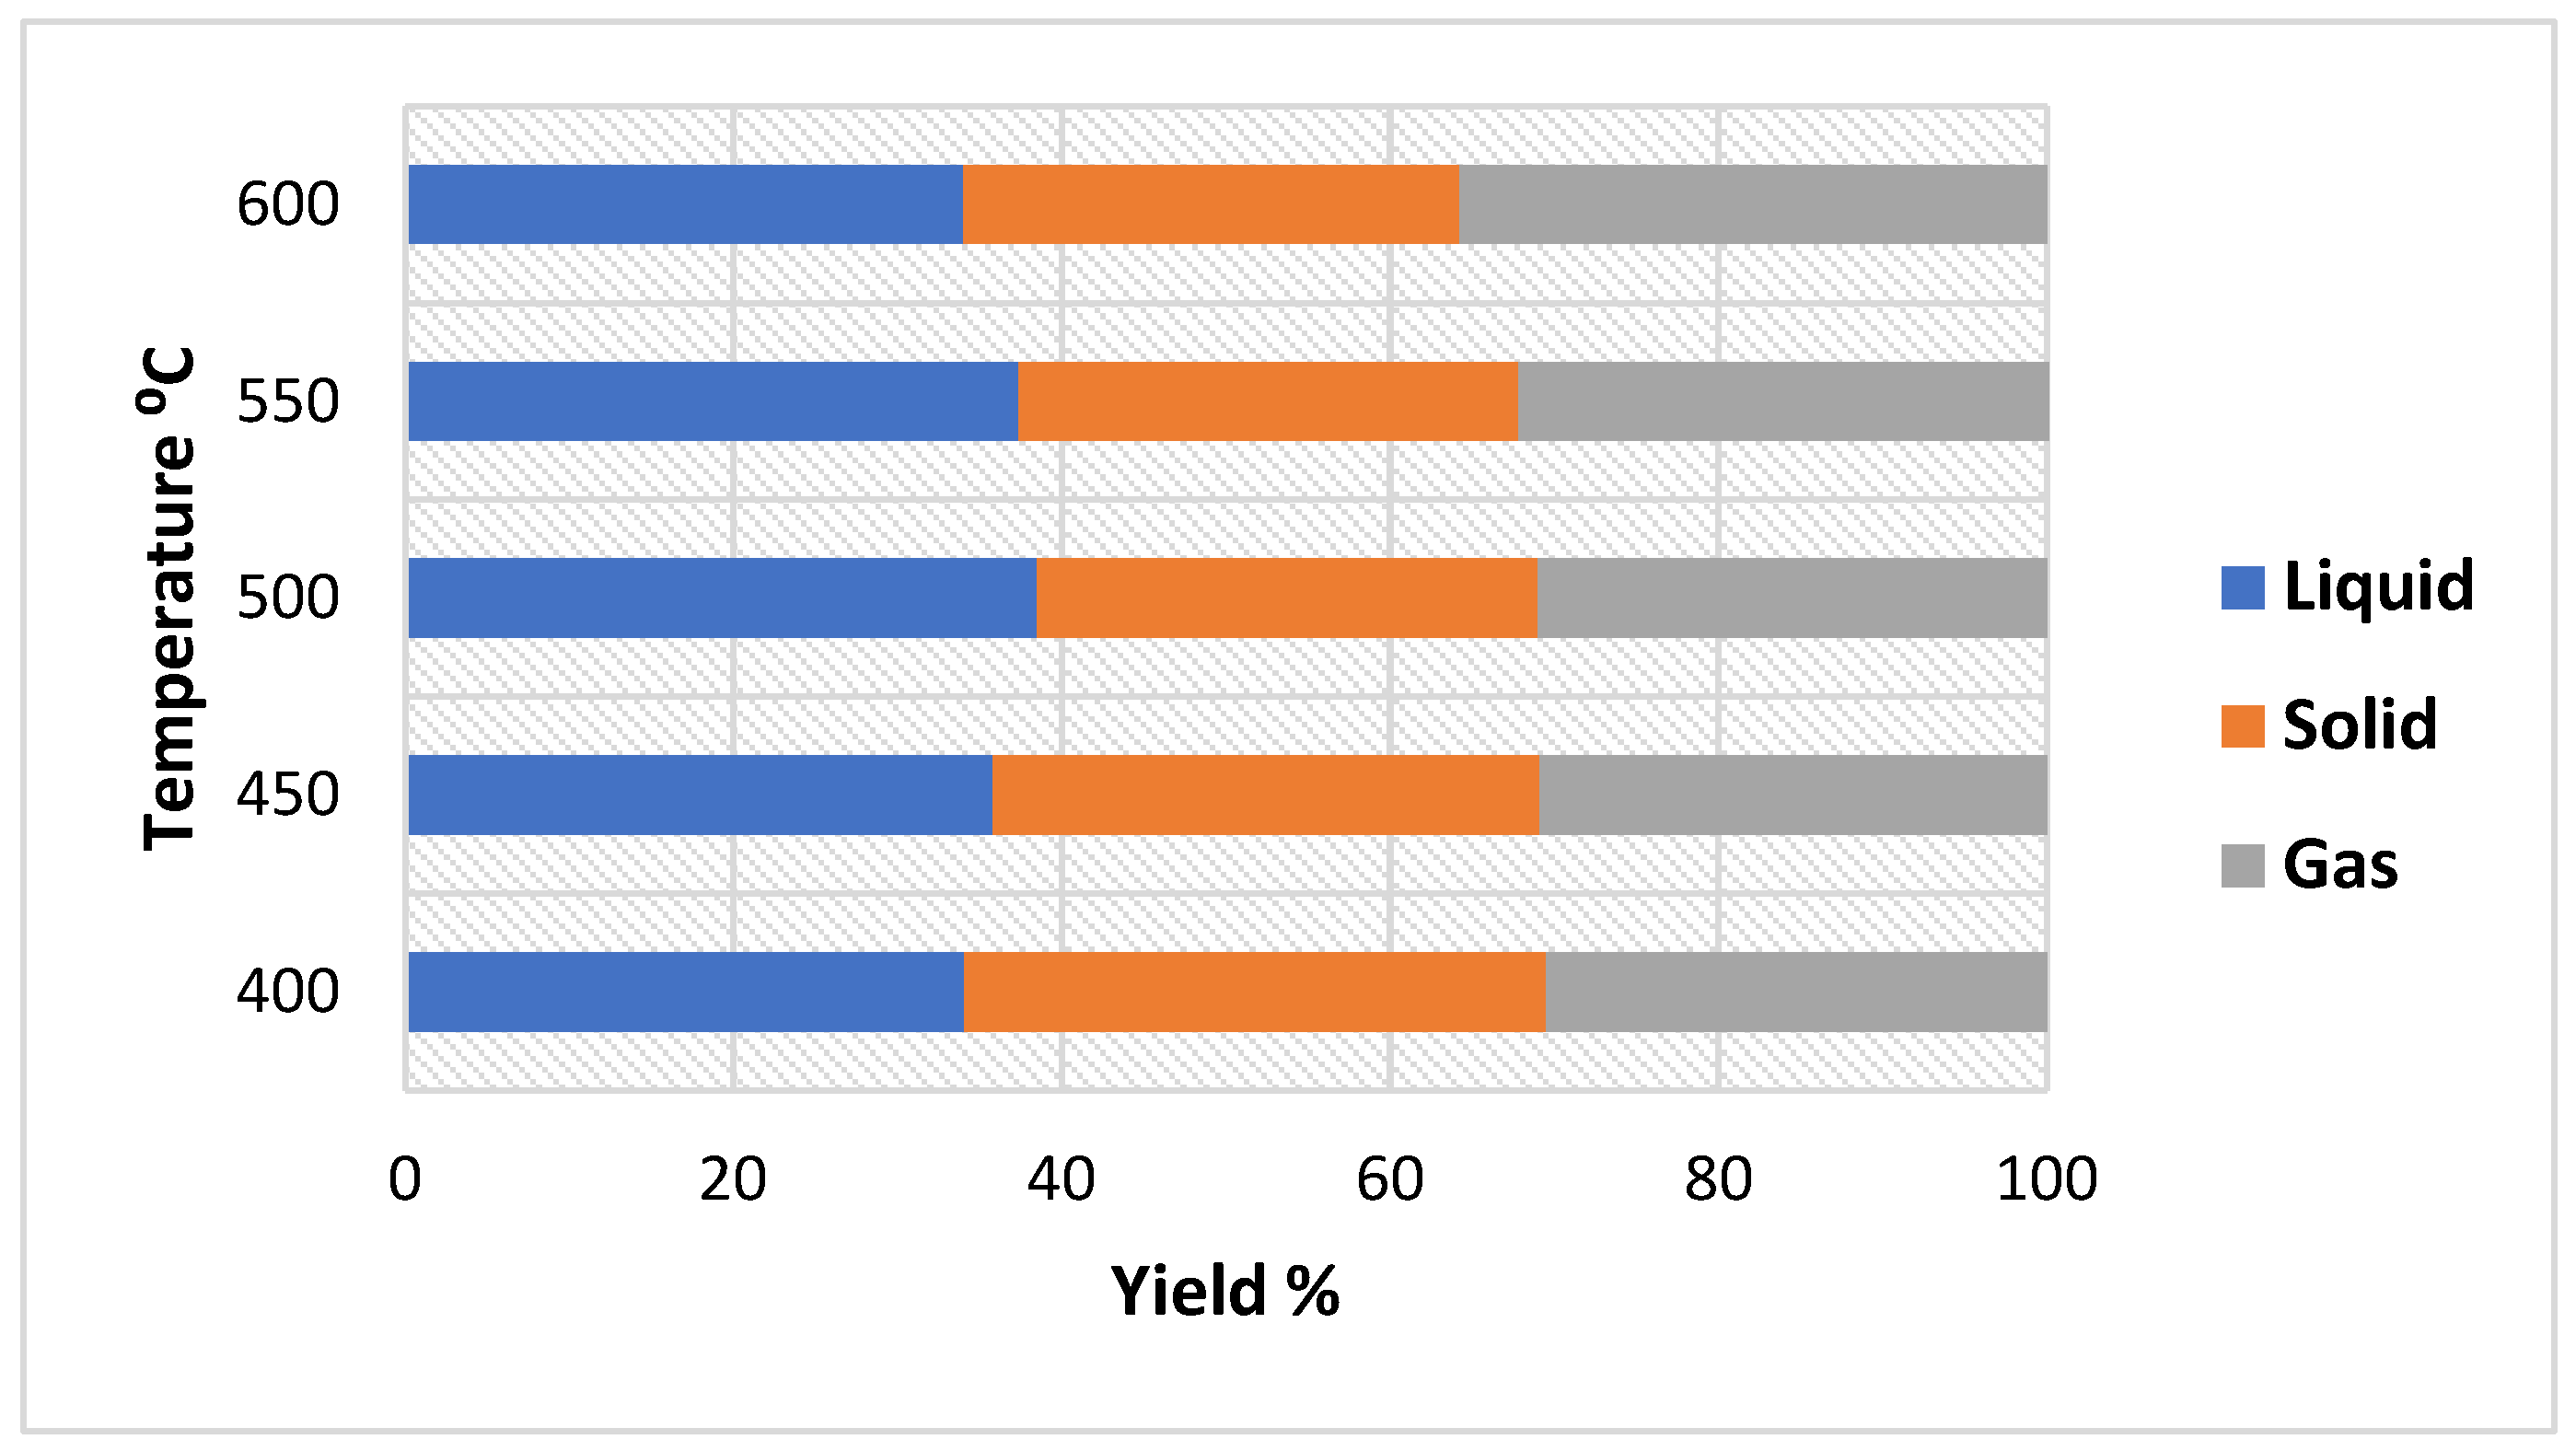
Pyrolysis products of CS at various temperatures (400–600 °C) are demonstrated in Figure 4. Liquid products increased significantly (p ˂ 0.05) with increase of temperature from 400 to 500 °C (34.1 to 38.5 %) and then declined as reaction temperature raised from 550 to 600 °C (37.4 to 34%). Solid products showed decreased trend with increasing of temperature from 400 to 500 °C (35.4 to 30.5%), then it decreased slightly from 500 to 600 °C (30.5 to 30.2%). Gas yield increased with the increase of temperature from 400 to 600 °C (30.5 to 35.8%). Studies have revealed that as the pyrolysis temperature raised the biochar yield declined, the yield of gases rose. But for the bio-oil output initially climbed, subsequently showed dropped trend, and reached its maximum value between 500 and 600 °C [18]. Another study of CS was performed in a batch pyrolizer (laboratory scale) by Al Afif and others [37], which revealed that when the temperature increases the char yield decreases and liquid and gas products increase. Furthermore, study conducted by Sakhiya and others [21] which revealed that raising the temperature of pyrolysis negatively impacted the yield of biochar; because of the thermal decay of heavy hydrocarbon at higher temperatures, hence contributed to a rise in bio-oil and syngas yields, further raising the reaction temperature, bio-oil output declined and gases production raised, which could be attributed to the reactions of secondary pyrolysis at greater temperatures, and tar vapor.

3.3.2. Particle Size Effect

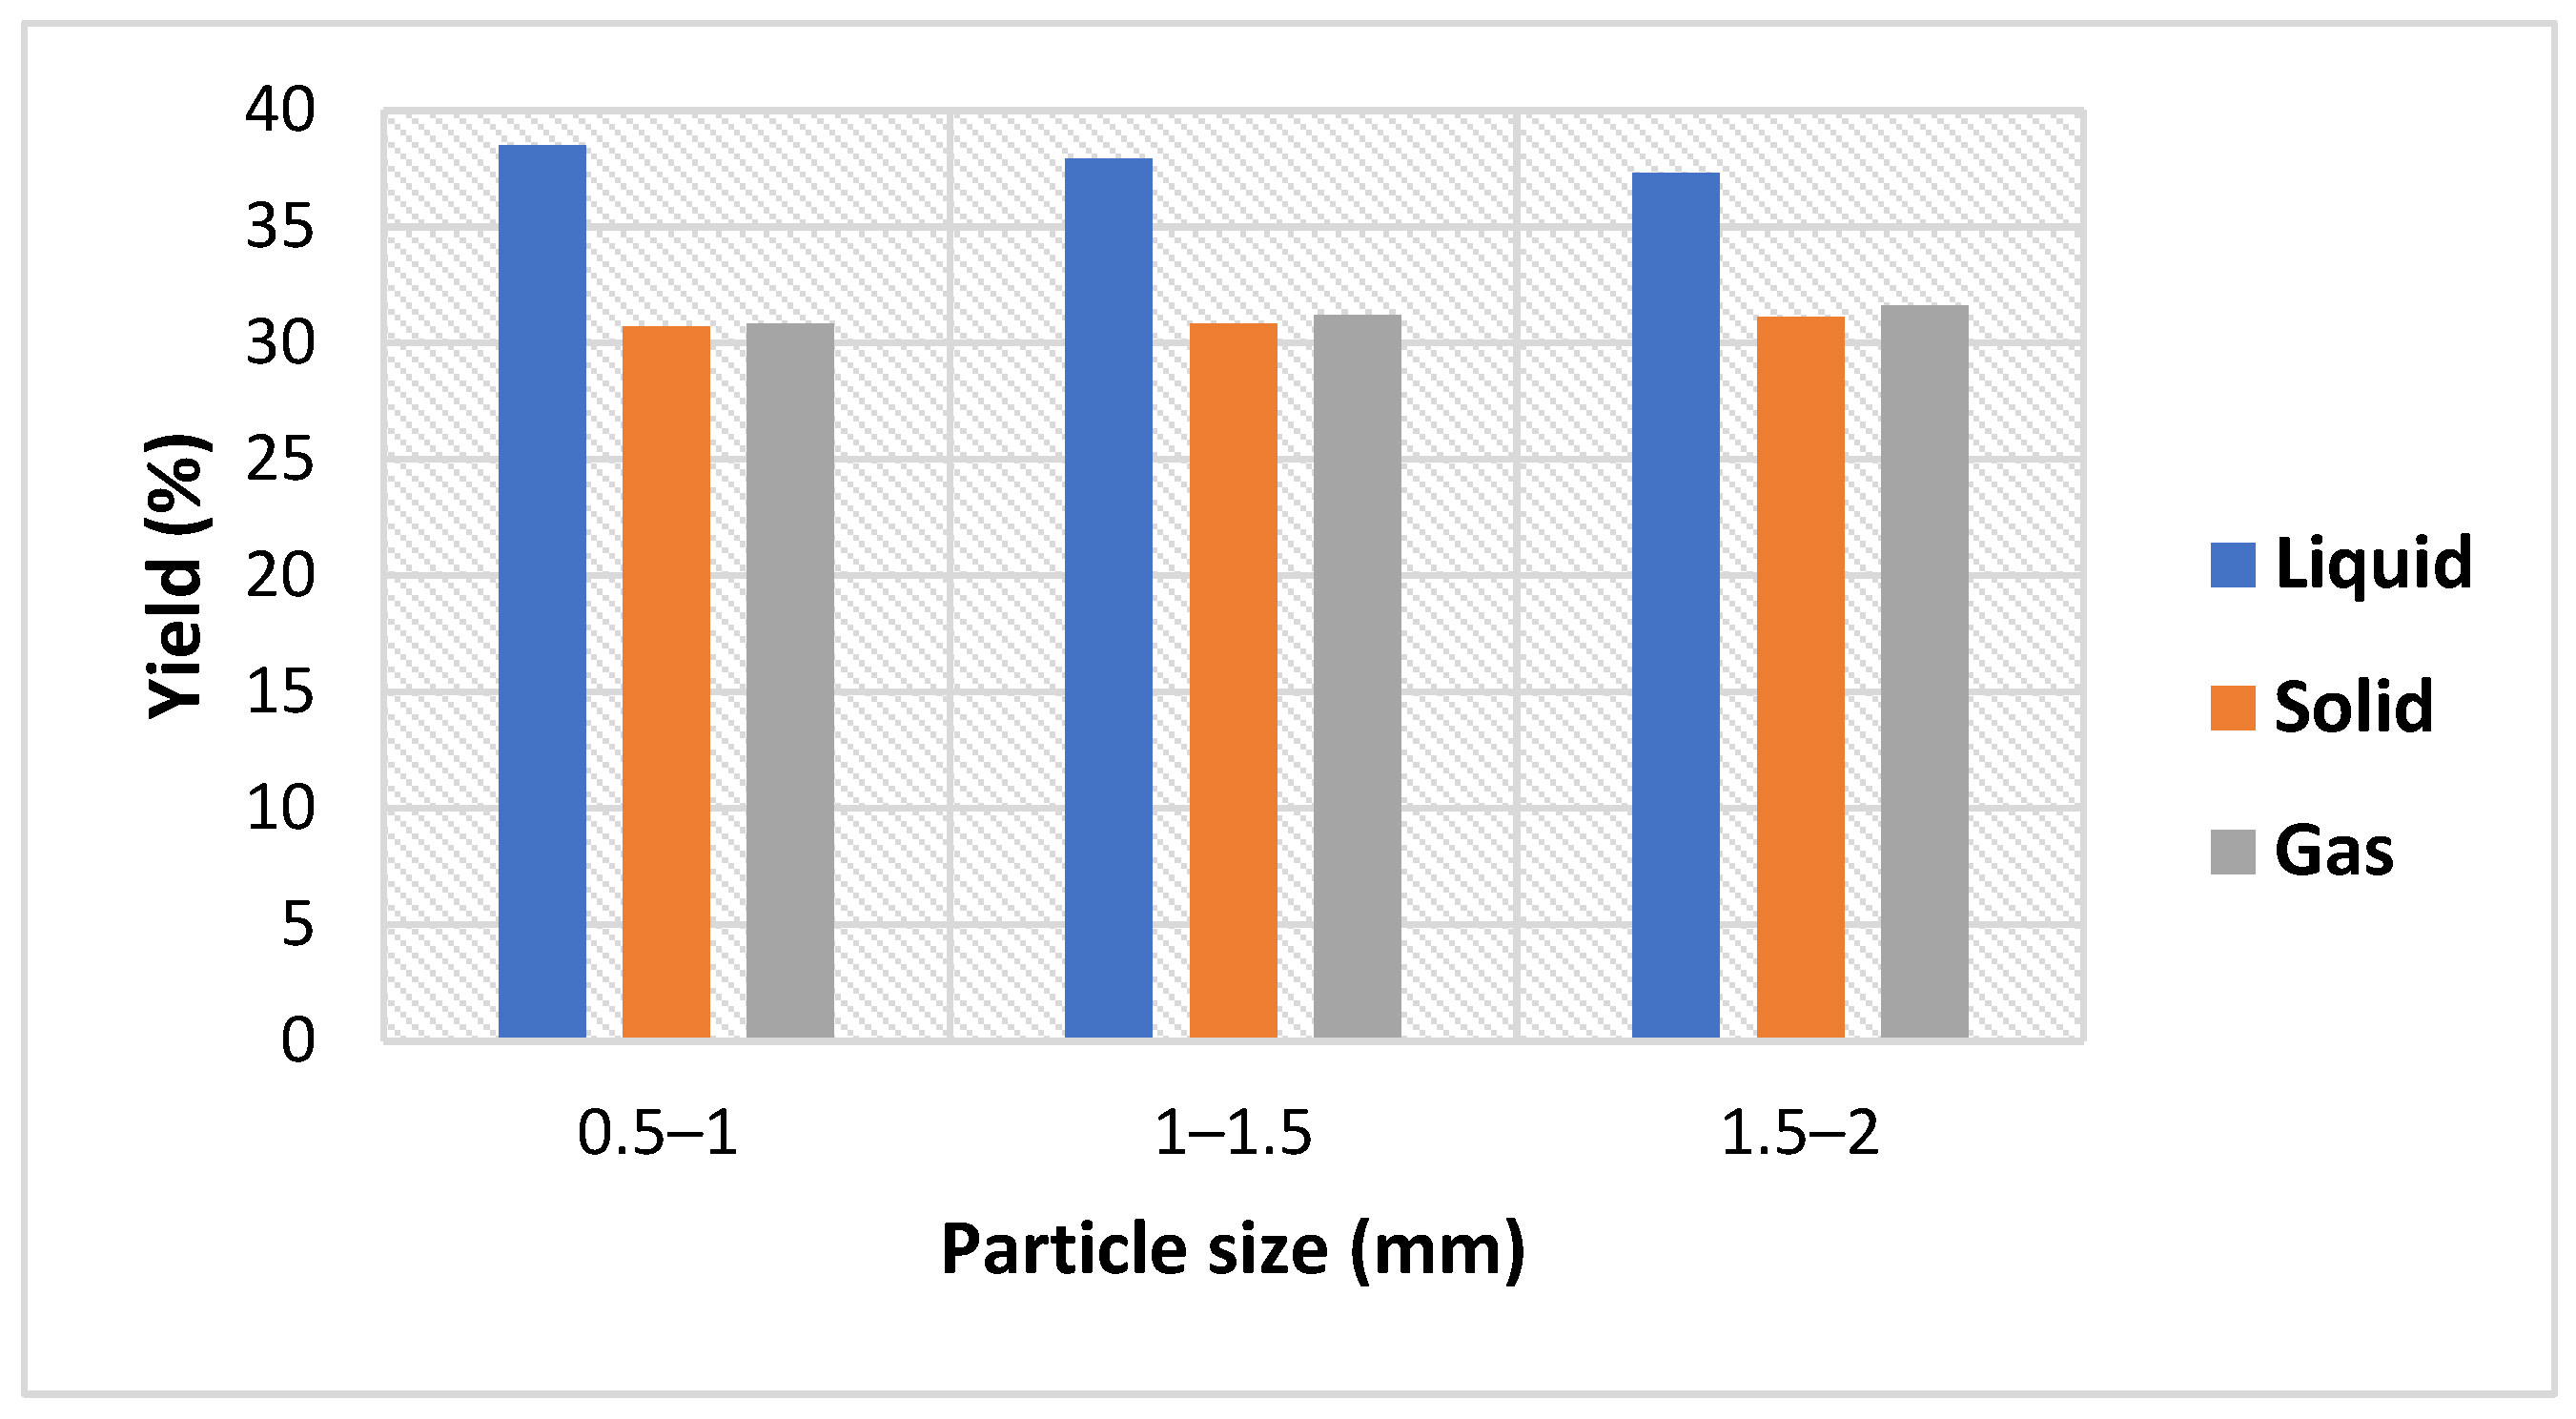
Figure 5, illustrates the pyrolysis products of CS at 500 °C using different particle sizes (0.5–1, 1–1.5, and 1.5–2 mm). The liquid yield produced from 0.5–1 mm particle size of samples was significantly (p ˂ 0.05) different when comparing to that yield of samples with 1–1.5 and 1.5–2 mm size (38.5, 37.9, and 37.2 respectively). It has been found that liquid products increased with decreasing particle size, while for the solid and gases products showed a slight increase with the increase of CS particle size. Similar results were obtained by Mahmood and others [38], their study investigated the impact of feedstock sizes on bio-oil output generated via pyrolysis of cotton stalk in a fixed-bed reactor, which concluded that the solid and gases products increase as the size of particles increases, while bio-oil output decrease as the feedstock size increases. Fast pyrolysis experiments of maize stalks were conducted in bubbling fluidized bed reactor using different particle sizes (1.0, 1.5, and 2.0 mm) by Ali and others [13], the findings revealed that bio-oil product declined from 42 to 35 wt%, biochar product increased from 22 to 25 wt%, and syngas output raised from 36 to 40% as biomass particle size increased. This effect of biomass particle size on the pyrolysis products due to higher transfer of heat via smaller particles which conduce to produce more volatiles, then condensed, leading to more liquid (bio-oil) production.

3.3.3. Retention Time (RT) Effect

Different four retention times (15, 25, 35, and 45 min) were investigated at 500 °C. First slow pyrolysis was conducted to 500 °C and then hold for 15, 25, 35, and 45 min individually to determine the bio-oil yield under each residence time. The results indicated that the bio-oil yield of retention time 15, 25, and 35 min were not significantly (p ˃ 0.05) different to that yield of 500 °C experiments, where the optimal liquid output of 38.3% was obtained at 35 min RT. This amount of yield was less than that yield obtained at 500 °C (without RT), then it was declined when the RT increased, as the RT attained 45 min the output of bio-oil dropped to 36.7%. The solid yield was decreased as the RT raised from 15 to 45 min. The gas product was increased with the increase of RT from 15 to 45 min (31.9 to 33.1%). However, this could explain that RT from 15 to 45 min increases gas yield, decreases solid products, but for the liquid yield first increased to reach it maximum at 35 min, then decreased. Pyrolysis experiment of shredded CS was conducted under different resident times and the findings concluded that with the increase of residence time, biochar output was decreased, gases and bio-oil products were increased [39]. Another pyrolysis experiment of sunflower husk pellets was carried out in a continuous reactor to investigate the operation parameters effects on biochar yield and characteristics, the results demonstrated that the yield of biochar was declined when the temperature and RT were increased [40]. Furthermore, residence time effects have been studied through co-pyrolysis of CS and sewage sludge in electric furnace at 600 °C, the results indicated that the yield of biochar was decreased significantly when the residence time increased from 30 to 90 min, tar and gas yields were showed opposite trend of biochar; this is attributed to breaking down more volatile biomass macromolecules due to longer residence time, as well as thermal cracking of macromolecular organic components in tar [41].

3.4. Bio-Oil Chemical Compositions

GC–MS analysis was conducted to investigate CS bio-oil chemical compounds, produced under the parameters (500 °C and 0.5–1 mm particle sizes), which represent the highest liquid yield. Bio-oil is widely recognized as a complex combination of phenols, acids, hydrocarbons, esters, ketones, ethers, alcohols, nitrogen-containing compounds, and other components that make it appropriate for a variety of applications. Nevertheless, it is crucial to consider that the quantity of chemical compounds in bio-oil differs substantially based on biomass type, feedstock mix, type of pyrolysis, and operation conditions [42]. According to Table 6, the chemical components of bio-oil obtained from the present study mainly contain phenols, 2,6-dimethoxy and benzene acetic acid, 4-hydroxy-3-methoxy, and other compounds such as; 2H-Pyran, 3,4-dihydro-6-methyl, 1,2-Cyclopentanedione, 3-methyl, Pyrazine, 2-methoxy-3-(1-methylethyl), and 4-Methyl-2,5-dimethoxybenzaldehyde. It has been found that phenol compounds were greater than other components (more than 40%). Other studies have indicated similar results of phenol contents in bio-oil obtained from pyrolysis of CS [10] and algal biomass [43]. The phenolic compounds fraction can be utilized to replace fossil phenols directly, or further separation techniques can be employed to produce simple phenols for usage in medicinal products, fine chemical substances, and food industries [44].

3.5. Biochar Characteristics

3.5.1. Calorific Value, Energy Yield and Energy Densification Ratio of CS Biochar

Table 7, illustrates the calorific values, energy densification ratios, and energy yields of CS biochar produced at 500 °C with heating rate of 10 °C/min using different RT (15, 25, 35, and 45 min), and biomass particle size (0.5–1, 1–1.5, and 1.5–2 mm). It can be seen that CS biochar shows high energy content comparing to the HHV of the initial feedstock sample. Energy yield ratios are greater than biochar yields for all samples. Furthermore, all energy density values were bigger than the feed stock energy density, demonstrating that CS biochar has a higher mass energy density than the CS raw materials, which means that CS pyrolysis produced high quality biochar with high energy content. It was found that increasing CS particle size from 0.5–1 mm to 1–1.5 mm the calorific value and energy yield increased from 25.56 to 25.90 MJ/Kg and 47.41 to 48.2% respectively. However, there was slight decrease in HHV of 1.5–2 mm sample, while the energy yield reached it maximum ratio of 48.37%, due to the increase of biochar yield. Similar results have been found for biomass torrefaction at 200 °C, which indicated that as the particle size raised from 1 to 3 mm the energy yield and solid mass yield increased and slight increase occurred in the calorific value [45]. For the RT experiments, the highest heating value and energy yield occurred in the first RT of 15 min after slow pyrolysis at 500 °C (26.05 MJ/Kg, 48.01%), and then followed by little reduction in the RT of 25, 35, and 45 min. The energy yield and HHV indicated slight decrease with the increasing of RT from 15 to 45 min. These results are in the line with the study performed by Lee and others [46], which examined feedstuff waste via pyrolysis using various reaction temperatures of 300, 400, and 500 °C and different RT (15, 30, 45, and 60 min), their findings explained that the highest energy yield obtained at RT of 15 min, then decreased when the RT time increased. Furthermore, pyrolysis study of CS biochar revealed that the energy yield showed decreased trend as the temperature raised from 400–800 °C (64.48–39.14%), and the HHV decreased after temperature of 600 °C [37].

3.5.2. SEM Results of Biochar

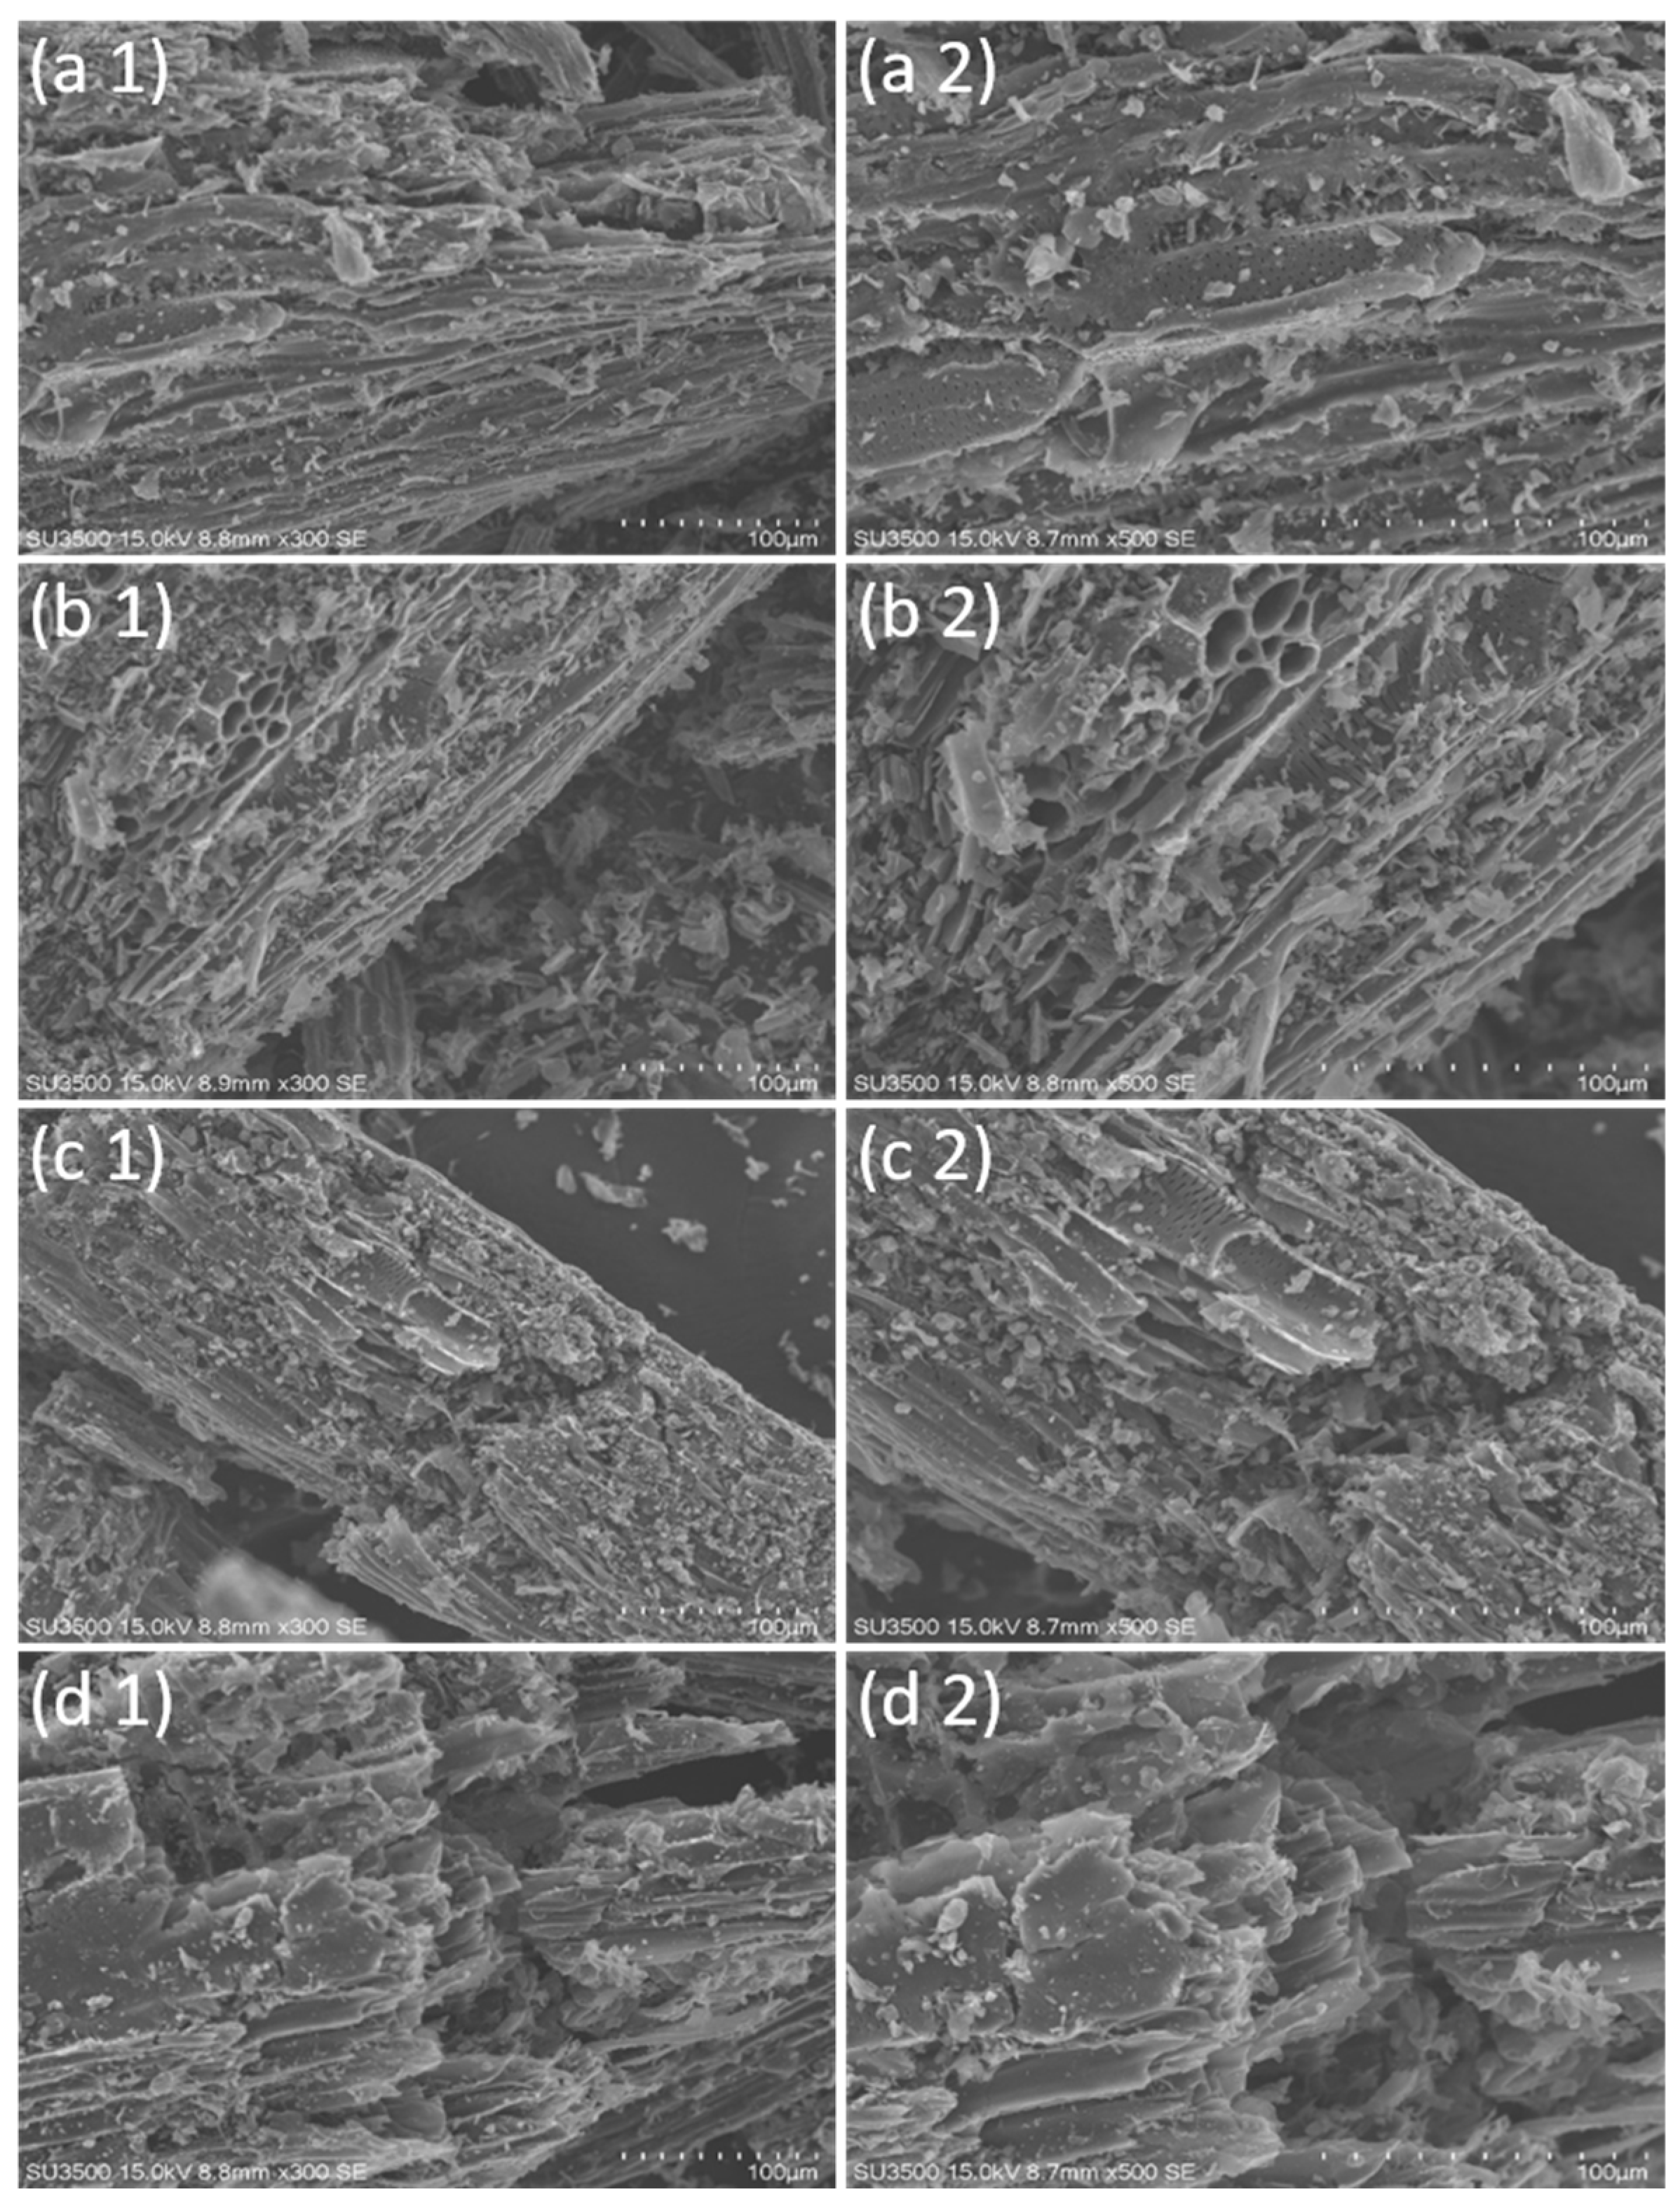
Figure 6a–c and Figure 7a–d show the SEM results (at 300× and 500× magnifications) of CS biochar produced at 500 °C adopting different particle size (0.5–1, 1–1.5, and 1.5–2 mm) and retention time (15, 25, 35, and 45 min). Figure 6a–c shows SEM results of biochar, it has been found that increasing the size of particles promoted more pores, rough and fragmented structure as well as appearance of honeycomb and cylindrical shapes. For the biochar produced by different RT, in Figure 7a–d, it can be seen that with increase of RT from 15 to 35 min more pores were occurred. This result is in conformity with findings obtained by Ali and others [47], which indicated that the biochar derived from pyrolysis of woody biomass at high temperature becomes more porous due to thermal decomposition of the lignocellulosic ingredients. But, in RT of 45 min few pores were observed due to the accumulation of ash on biochar surface. However, when the RT increased the surface was rough, particles were fragmented and ash content of the surface increased, because of longer time of temperature. Studies have shown that as the pyrolysis temperature increased, more porous structures were seen. Nevertheless, the increasing temperature also contributed to an increase in the formation of particles, primarily ash, on the biochar surface. Higher temperatures produce more ash on the surface of the biochar, which supports the idea that these particles can clog the micropores of the surface [48]. However, studies have shown that the characteristics of biochar determine its suitability for various purposes. For instance, biochar materials having high porosity, electrical conductivity, and stable at low temperature, which makes biochar appropriate as materials for electrodes in microbial fuel cell devices. In supercapacitor development, biochar has high structural nitrogen groups and porosity are favored. Moreover, biochar with high surface area and low content of ash may make it suitable for soil amendment [49].

3.5.3. XRD Analysis of Biochar

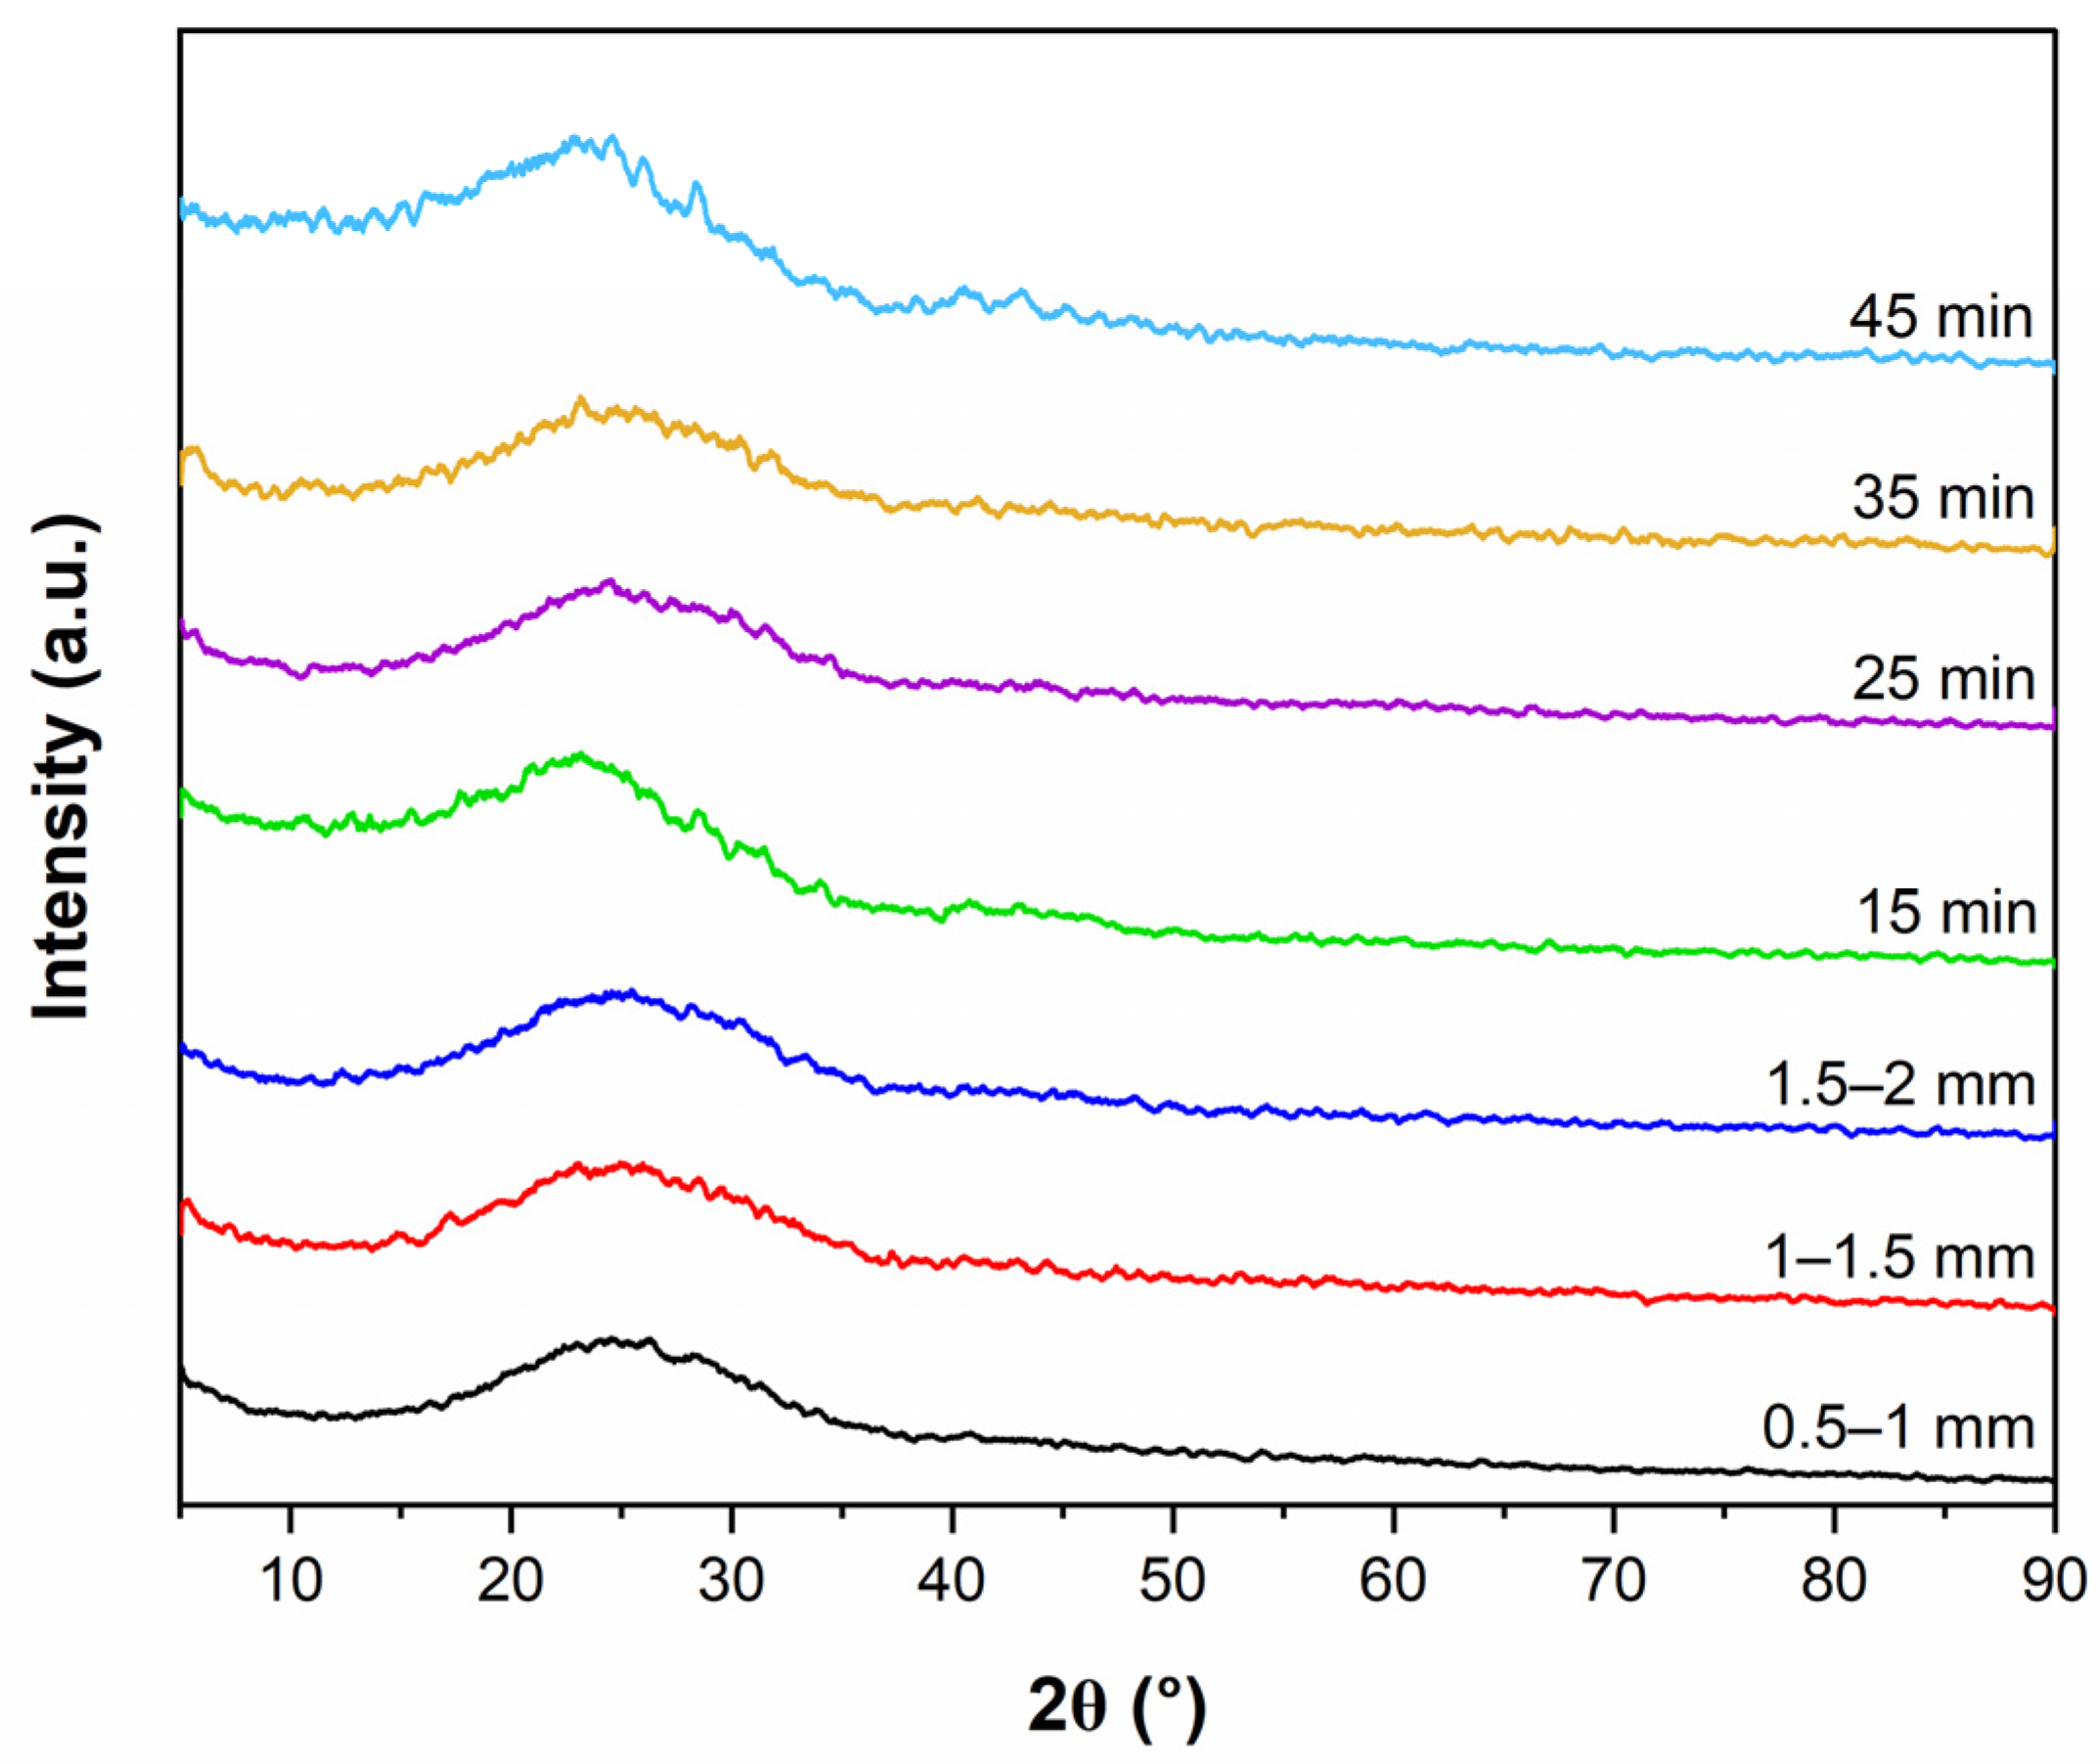
XRD analysis is a widely used approach for determining the crystallinity and biochar structure. The diffractogram in XRD has revealed specific properties of nebulous substance formed at temperatures exceeding 350 °C and was dependable [50]. According to Figure 8, all biochar samples obtained at 500 °C under different RT and particle size showed that the XRD results have one large beak at 2Ɵ of 23° and the diffraction plots were not crystalline indicating amorphous shape, due to the decomposition of cellulose compounds. This large beak at 2Ɵ of 23° is associated to (0 0 2) crystallography diffraction, which relates to the structure of graphitic carbon of biochar [51]. Similar findings were obtained of firewood biochar, which indicated amorphous components as a sequence of cellulose degradation illustrating random order structure of aromatic carbons [52]. Another study of CS showed an amorphous structure of biochar with two wide peaks at 23° and 43° attributed to (002) and (100) crystalline planes of carbon compound materials [53]. Furthermore, an experiment of barely straw biochar revealed that a large peak between 20–30° may suggest the presence of a weak crystal structure and a carbon-rich components in the materials [54]. Researches have reported that high pyrolysis temperature can produce biochar rich in carbon, which has a higher removal efficiency for organic contaminants. The carbon-rich biochar generated via high pyrolysis temperature has more removal performance of organic contaminants, due to its improved characteristics like surface area, porosity, lower dissolved carbon content, pH, and hydrophobicity [55].

4. Conclusions

The present work performed kinetic parameter activation energy of CS using TGA data adopting KAS and FWO models, as well as investigating the effect of various operation parameters such as; temperatures (400–600 °C), particle sizes (1–2 mm), and retention time (15–45 min) on liquid product produced during CS slow pyrolysis using lab-scale tube furnace reactor and further characterization of bio-oil and biochar products was conducted. The results indicate that the main decomposition of CS takes place during primary pyrolysis, which is characterized by higher activation energy values than secondary pyrolysis, mainly due to the degradation of cellulose which it needs more energy to be decomposed. Experiments findings revealed that bio-oil yield increased with the increasing temperature from 400 to 500 °C, then decreased when temperature exceeded 500 °C promoting more gases production and it decreased with the increase of CS particle sizes, which the maximum yield of bio-oil (38.5%) was achieved at (500 °C and 0.5–1 mm feedstock size), while retention time indicated insignificant effect on liquid products. GC–MS analysis depicted that phenol compounds were greater than other components which account for more than 40% for bio-oil chemical compositions. Furthermore, CS slow pyrolysis at 500 °C produced high quality biochar with high energy content, which the highest heating value was 26.05 MJ/Kg and energy yield of 48.01% occurred at the conditions (RT of 15 min and 0.5–1-min CS particle size). SEM images of biochar confirmed that increasing the particle size promoted more pores, rough and fragmented structure as well as appearance of honeycomb and cylindrical shapes, while increasing temperature and RT promoted more pores. XRD analyses emphasized that all biochar samples obtained at 500 °C under different RT and particle sizes had one large peak at 2Ɵ of 23°, which is related to the structure of graphitic carbon of biochar, and the diffraction plots were not crystalline indicating amorphous shape due to the decomposition of cellulose compounds.

Author Contributions

Conceptualization, H.E. and O.T.; methodology, O.T., H.E. and K.Ś.; validation, O.T., Y.Z. and A.R.M.; formal analysis, O.T. and Y.Z.; investigation, H.E., S.R. and Y.F.; data curation, H.E. and K.Ś.; writing—original draft preparation, H.E., O.T. and K.Ś.; writing—review and editing, O.T. and Y.Z.; visualization, A.R.M. and R.D.; supervision, O.T. and Y.Z. All authors have read and agreed to the published version of the manuscript.

Funding

This study was supported by the Beijing Natural Science Foundation (International Scientists Project Grants No. IS24033), National Natural Science Foundation of China (Grants No. 42177431), and by the joint research project between UniMAP and TIIAME NRU (Grant No. INTERES 9008-00064).

Data Availability Statement

The authors confirm that the data supporting the findings of this study are available within the article.

Acknowledgments

The team appreciate for the support from China Scholarship Council and TYSP program to the international students and scholars. We appreciate the support from the Key Laboratory of Clean Production and Utilization of Renewable Energy, Ministry of Agriculture and Rural Affairs, China Agricultural University; National Centre for International Research of BioEnergy Science and Technology, Ministry of Science and Technology, China Agricultural University; China Scholarship Council; Beijing Municipal Key Discipline of Biomass Engineering.

Conflicts of Interest

The authors declare no conflict of interest.

References

  1. Safarian, S.; Unnþórsson, R.; Richter, C. A review of biomass gasification modelling. Renew. Sustain. Energy Rev. 2019, 110, 378–391. [Google Scholar] [CrossRef]
  2. Zhao, Y.; Ding, M.; Dou, Y.; Fan, X.; Wang, Y.; Wei, X. Comparative study on the pyrolysis behaviors of corn stalk and pine sawdust using TG-MS. Trans. Tianjin Univ. 2014, 20, 91–96. [Google Scholar] [CrossRef]
  3. Hopa, D.Y.; Alagöz, O.; Yılmaz, N.; Dilek, M.; Arabacı, G.; Mutlu, T. Biomass co-pyrolysis: Effects of blending three different biomasses on oil yield and quality. Waste Manag. Res. 2019, 37, 925–933. [Google Scholar] [CrossRef] [PubMed]
  4. Zhang, G.; Sun, Y.; Shi, Y.; Jia, Y.; Xu, Y.; Zhao, P.; Zhang, Y. Characteristic and kinetics of corn stalk pyrolysis in a high pressure reactor and steam gasification of its char. J. Anal. Appl. Pyrolysis 2016, 122, 249–257. [Google Scholar] [CrossRef]
  5. Prakash, S.; Radha, S.K.; Dhumal, S.; Senapathy, M.; Deshmukh, V.P.; Kumar, S.; Madhu, A.T.; Balamurugan, V.; Pandiselvam, R.; Kumar, M. Unlocking the potential of cotton stalk as a renewable source of cellulose: A review on advancements and emerging applications. Int. J. Biol. Macromol. 2024, 261, 129456. [Google Scholar] [CrossRef]
  6. Li, H.; Mou, H.; Zhao, N.; Yu, Y.; Hong, Q.; Philbert, M.; Zhou, Y.; Dizaji, H.B.; Dong, R. Nitrogen Migration during Pyrolysis of Raw and Acid Leached Maize Straw. Sustainability 2021, 13, 3786. [Google Scholar] [CrossRef]
  7. Zhang, Y.; Liang, Y.; Li, S.; Yuan, Y.; Zhang, D.; Wu, Y.; Xie, H.; Brindhadevi, K.; Pugazhendhi, A.; Xia, C. A review of biomass pyrolysis gas: Forming mechanisms, influencing parameters, and product application upgrades. Fuel 2023, 347, 128461. [Google Scholar] [CrossRef]
  8. Lam, M.K.; Loy, A.C.M.; Yusup, S.; Lee, K.T. Biohydrogen Production from Algae. In Biohydrogen; Elsevier: Amsterdam, The Netherlands, 2019; pp. 219–245. [Google Scholar] [CrossRef]
  9. Ali, N.; Saleem, M.; Shahzad, K.; Chughtai, A. Bio-Oil Production from Fast Pyrolysis of Cotton Stalk in Fluidized Bed Reactor. Arab. J. Sci. Eng. 2015, 40, 3019–3027. [Google Scholar] [CrossRef]
  10. Li, X.; Wang, B.; Wu, S.; Kong, X.; Fang, Y.; Liu, J. Optimizing the Conditions for the Microwave-Assisted Pyrolysis of Cotton Stalk for Bio-Oil Production Using Response Surface Methodology. Waste Biomass Valorization 2017, 8, 1361–1369. [Google Scholar] [CrossRef]
  11. Silva, J.E.; Deus, J.O.; Calixto, G.Q.; Melo, D.M.A.; Melo, M.A.F.; Júnior, V.C.B.; Chagas, B.M.E.; Medeiros, E.P.; Braga, R.M. Colored cotton crop wastes valorization through pyrolysis: A study of energetic characterization and analytical Py-GC/MS. Sci. Rep. 2024, 14, 9359. [Google Scholar] [CrossRef]
  12. Amini, E.; Safdari, M.S.; DeYoung, J.T.; Weise, D.R.; Fletcher, T.H. Characterization of pyrolysis products from slow pyrolysis of live and dead vegetation native to the southern United States. Fuel 2019, 235, 1475–1491. [Google Scholar] [CrossRef]
  13. Ali, N.; Saleem, M.; Shahzad, K.; Hussain, S.; Chughtai, A. Effect of operating parameters on production of bio-oil from fast pyrolysis of maize stalk in bubbling fluidized bed reactor. Pol. J. Chem. Technol. 2016, 18, 88–96. [Google Scholar] [CrossRef]
  14. Boubacar, Z.; Merdun, H. Kinetic analysis of Pearl Millet (Penissetum glaucum (L.) R. Br.) under pyrolysis and combustion to investigate its bioenergy potential. Fuel 2020, 267, 117172. [Google Scholar] [CrossRef]
  15. Vuppaladadiyam, A.K.; Liu, H.; Zhao, M.; Soomro, A.F.; Memon, M.Z.; Dupont, V. Thermogravimetric and kinetic analysis to discern synergy during the co-pyrolysis of microalgae and swine manure digestate. Biotechnol. Biofuels 2019, 12, 170. [Google Scholar] [CrossRef] [PubMed]
  16. Sivaraman, S.; Shanmugam, S.R.; Veerapandian, B.; Venkatachalam, P. Understanding the pyrolysis kinetics, thermodynamic, and environmental sustainability parameters of Sesamum indicum crop residue. Environ. Res. Commun. 2023, 5, 125013. [Google Scholar] [CrossRef]
  17. Rego, F.; Soares, A.P.; Casquilho, M.; Rosa, F.C.; Rodrigues, A. Pyrolysis kinetics of short rotation coppice poplar biomass. Energy 2020, 207, 118191. [Google Scholar] [CrossRef]
  18. Guo, M.; Bi, J. Pyrolysis Characteristics of Corn Stalk with Solid Heat Carrier. BioResources 2015, 10, 3839–3851. [Google Scholar] [CrossRef]
  19. Bartos, A.; Anggono, J.; Farkas, Á.E.; Kun, D.; Soetaredjo, F.E.; Móczó, J.; Antoni, P.H.; Pukánszky, B. Alkali treatment of lignocellulosic fibers extracted from sugarcane bagasse: Composition, structure, properties. Polym. Test. 2020, 88, 106549. [Google Scholar] [CrossRef]
  20. Sakhiya, A.K.; Baghel, P.; Pathak, S.; Vijay, V.K.; Kaushal, P. Effect of Process Parameters on Slow Pyrolysis of Rice Straw: Product Yield and Energy Analysis. In Proceedings of the 2020 International Conference and Utility Exhibition on Energy, Environment and Climate Change (ICUE), Pattaya, Thailand, 20–22 October 2020; IEEE: Piscataway, NJ, USA, 2020; pp. 1–9. [Google Scholar] [CrossRef]
  21. Sakhiya, A.K.; Anand, A.; Aier, I.; Vijay, V.K.; Kaushal, P. Suitability of rice straw for biochar production through slow pyrolysis: Product characterization and thermodynamic analysis. Bioresour. Technol. Rep. 2021, 15, 100818. [Google Scholar] [CrossRef]
  22. Al Afif, R.; Tondl, G.; Pfeifer, C. Experimental and simulation study of hydrochar production from cotton stalks. Energy 2023, 276, 127573. [Google Scholar] [CrossRef]
  23. Jayaraman, K.; Gokalp, I. Effect of char generation method on steam, CO2 and blended mixture gasification of high ash Turkish coals. Fuel 2015, 153, 320–327. [Google Scholar] [CrossRef]
  24. Grzywacz, P.; Czerski, G.; Gańczarczyk, W. Effect of Pyrolysis Atmosphere on the Gasification of Waste Tire Char. Energies 2021, 15, 34. [Google Scholar] [CrossRef]
  25. Doyle, C.D. Estimating isothermal life from thermogravimetric data. J. Appl. Polym. Sci. 1962, 6, 639–642. [Google Scholar] [CrossRef]
  26. Murray, P. Kinetics of Clay Dehydration. Clay Min. 1955, 2, 255–264. [Google Scholar] [CrossRef]
  27. Chen, L.; Hu, J.; Han, Q.; Xie, A.; Zhou, Z.; Yang, J.; Tang, Q.; Mi, B.; Wu, F. Application of distributed activation energy model and Coats-Redfern integration method in the study of industrial lignin pyrolysis kinetics. In Biomass Convers Biorefinery; Springer: Berlin/Heidelberg, Germany, 2022. [Google Scholar] [CrossRef]
  28. Stančin, H.; Šafář, M.; Růžičková, J.; Mikulčić, H.; Raclavská, H.; Wang, X.; Duić, N. Co-pyrolysis and synergistic effect analysis of biomass sawdust and polystyrene mixtures for production of high-quality bio-oils. Process Saf. Environ. Prot. 2021, 145, 1–11. [Google Scholar] [CrossRef]
  29. Li, H.; Yu, Y.; Yi, F.; Qiang, J.; Li, C.; Zhao, N.; Lu, J.; Jia, Z.; Zhou, L.; Mperejekumana, P.; et al. Characteristics and formation of nitrogen-containing products from the pyrolysis of maple wood and maize straw. J. Anal. Appl. Pyrolysis 2022, 163, 105462. [Google Scholar] [CrossRef]
  30. Huang, X.; Cao, J.P.; Zhao, X.Y.; Wang, J.X.; Fan, X.; Zhao, Y.P.; Wei, X.Y. Pyrolysis kinetics of soybean straw using thermogravimetric analysis. Fuel 2016, 169, 93–98. [Google Scholar] [CrossRef]
  31. Vamvuka, D.; Kakaras, E.; Kastanaki, E.; Grammelis, P. Pyrolysis characteristics and kinetics of biomass residuals mixtures with lignite. Fuel 2003, 82, 1949–1960. [Google Scholar] [CrossRef]
  32. Gözke, G.; Açıkalın, K. Pyrolysis characteristics and kinetics of sour cherry stalk and flesh via thermogravimetric analysis using isoconversional methods. J. Therm. Anal. Calorim. 2021, 146, 893–910. [Google Scholar] [CrossRef]
  33. Kongkaew, N.; Pruksakit, W.; Patumsawad, S. Thermogravimetric Kinetic Analysis of the Pyrolysis of Rice Straw. Energy Procedia 2015, 79, 663–670. [Google Scholar] [CrossRef]
  34. Mishra, R.K.; Mohanty, K. Pyrolysis kinetics and thermal behavior of waste sawdust biomass using thermogravimetric analysis. Bioresour. Technol. 2018, 251, 63–74. [Google Scholar] [CrossRef] [PubMed]
  35. Chen, W.; Chen, Y.; Yang, H.; Li, K.; Chen, X.; Chen, H. Investigation on biomass nitrogen-enriched pyrolysis: Influence of temperature. Bioresour. Technol. 2018, 249, 247–253. [Google Scholar] [CrossRef]
  36. Li, Y.; Hong, C.; Wang, Y.; Xing, Y.; Chang, X.; Zheng, Z.; Li, Z.; Zhao, X. Nitrogen Migration Mechanism during Pyrolysis of Penicillin Fermentation Residue Based on Product Characteristics and Quantum Chemical Analysis. ACS Sustain. Chem. Eng. 2020, 8, 7721–7740. [Google Scholar] [CrossRef]
  37. Al Afif, R.; Anayah, S.S.; Pfeifer, C. Batch pyrolysis of cotton stalks for evaluation of biochar energy potential. Renew. Energy 2020, 147, 2250–2258. [Google Scholar] [CrossRef]
  38. Mahmood, S.; Rana, M.S.; Najaf, A.; Kurram, S. Pyrolysis of Cotton Stalk in Fixed Bed Reactor: Effect of Particle Size of Feedstock on Bio-oil Yield. NFC IEFR J. Eng. Sci. Res. 2018, 6, 142–147. [Google Scholar]
  39. Makavana, J.M.; Sarsavadia, P.N.; Chauhan, P.M. Effect of Pyrolysis Temperature and Residence Time on Bio-char Obtained from Pyrolysis of Shredded Cotton Stalk. Int. Res. J. Pure Appl. Chem. 2020, 10–28. [Google Scholar] [CrossRef]
  40. Wystalska, K.; Malińska, K.; Włodarczyk, R.; Chajczyk, O. Effects of pyrolysis parameters on the yield and properties of biochar from pelletized sunflower husk. E3S Web Conf. 2018, 44, 00197. [Google Scholar] [CrossRef]
  41. Wang, Z.; Liu, K.; Xie, L.; Zhu, H.; Ji, S.; Shu, X. Effects of residence time on characteristics of biochars prepared via co-pyrolysis of sewage sludge and cotton stalks. J. Anal. Appl. Pyrolysis 2019, 142, 104659. [Google Scholar] [CrossRef]
  42. Nawaz, A.; Kumar, P. Optimization of process parameters of Lagerstroemia speciosa seed hull pyrolysis using a combined approach of Response Surface Methodology (RSM) and Artificial Neural Network (ANN) for renewable fuel production. Bioresour. Technol. Rep. 2022, 18, 101110. [Google Scholar] [CrossRef]
  43. Jeeru, L.R.; Abdul, F.K.; Anireddy, J.S.; Ch, V.P.; Dhanavath, K.N. Optimization of process parameters for conventional pyrolysis of algal biomass into bio–oil and bio–char production. Chem. Eng. Process—Process Intensif. 2023, 185, 109311. [Google Scholar] [CrossRef]
  44. Sangthong, S.; Phetwarotai, W.; Bakar, M.S.A.; Cheirsilp, B.; Phusunti, N. Phenol-rich bio-oil from pyrolysis of palm kernel shell and its isolated lignin. Ind. Crops Prod. 2022, 188, 115648. [Google Scholar] [CrossRef]
  45. Oladosu, K.; Olawore, A.; Alade, A.; Kolawole, M. Optimization of hhv and energy yield from torrefaction of Albizia zygia wood- calcium hydrogen phosphate catalyst blends using optimal combined design. Acta Period. Technol. 2022, 109–122. [Google Scholar] [CrossRef]
  46. Lee, Y.E.; Shin, D.C.; Jeong, Y.; Kim, I.T.; Yoo, Y.S. Effects of Pyrolysis Temperature and Retention Time on Fuel Characteristics of Food Waste Feedstuff and Compost for Co-Firing in Coal Power Plants. Energies 2019, 12, 4538. [Google Scholar] [CrossRef]
  47. Ali, L.; Palamanit, A.; Techato, K.; Ullah, A.; Chowdhury, M.S.; Phoungthong, K. Characteristics of Biochars Derived from the Pyrolysis and Co-Pyrolysis of Rubberwood Sawdust and Sewage Sludge for Further Applications. Sustainability 2022, 14, 3829. [Google Scholar] [CrossRef]
  48. Chaves, B.C.; Ferreira, M.K.; Dias, A.F.; da Silva, V.P.; da Silva, T.M.; Severo, S.T.; Mendonça, V.; de Freitas, S.M.; Valadão, S.D. Impact of Pyrolysis Temperature on the Properties of Eucalyptus Wood-Derived Biochar. Materials 2020, 13, 5841. [Google Scholar] [CrossRef]
  49. Li, R.; Wu, Y.; Lou, X.; Li, H.; Cheng, J.; Shen, B.; Qin, L. Porous Biochar Materials for Sustainable Water Treatment: Synthesis, Modification, and Application. Water 2023, 15, 395. [Google Scholar] [CrossRef]
  50. Usman, A.R.A.; Abduljabbar, A.; Vithanage, M.; Ok, Y.S.; Ahmad, M.; Ahmad, M.; Elfaki, J.; Abdulazeem, S.S.; Al-Wabel, M.I. Biochar production from date palm waste: Charring temperature induced changes in composition and surface chemistry. J. Anal. Appl. Pyrolysis 2015, 115, 392–400. [Google Scholar] [CrossRef]
  51. Qiu, L.; Li, C.; Zhang, S.; Wang, S.; Li, B.; Cui, Z.; Tang, Y.; Tursunov, O.; Hu, X. Importance of oxygen-containing functionalities and pore structures of biochar in catalyzing pyrolysis of homologous poplar. Chin. J. Chem. Eng. 2024, 65, 200–211. [Google Scholar] [CrossRef]
  52. Bayartsengel, B.; Erdene-Ochir, N.; Battulga, S.; Tyeliubek, S.; Jantsanpurev, E.; Chuluun, B. Characterization of Biochars Produced from Various Biowastes. Atl. Highlights Chem. Pharm. Sci. 2021, 2, 9. [Google Scholar] [CrossRef]
  53. Wang, Y.; Chang, H.; Ma, T.; Deng, H.; Zha, Z. Effect of cotton stalk particle size on the structure of biochar and the performance of anode for lithium-ion battery. J. Phys. Chem. Solids 2022, 169, 110845. [Google Scholar] [CrossRef]
  54. Zhang, J.; Huang, B.; Chen, L.; Du, J.; Li, W.; Luo, Z. Pyrolysis kinetics of hulless barley straw using the distributed activation energy model (daem) by the tg/dta technique and sem/xrd characterizations for hulless barley straw derived biochar. Braz. J. Chem. Eng. 2018, 35, 1039–1050. [Google Scholar] [CrossRef]
  55. Yaashikaa, P.R.; Kumar, P.S.; Varjani, S.; Saravanan, A. A critical review on the biochar production techniques, characterization, stability and applications for circular bioeconomy. Biotechnol. Rep. 2020, 28, e00570. [Google Scholar] [CrossRef] [PubMed]
Figure 1. Schematic diagram of the pyrolysis system. (1) Ar gas; (2) flowmeter; (3) temperature controller; (4) CS sample; (5) electric tube furnace; (6) iced water; (7) condensation bottle; (8) gas purifier.
Resources 14 00075 g001
Figure 2. TGA (a,c,e) and DTG (b,d,f) curves of CS with different particle size (0.5–1, 1–1.5, and 1.5–2 mm).
Resources 14 00075 g002
Figure 3. The average of Ea for KAS and FOW in primary and secondary pyrolysis for different particle sizes.
Resources 14 00075 g003
Figure 4. Pyrolysis products distribution under different temperatures (400–600 °C).
Resources 14 00075 g004
Figure 5. Particle size effect on pyrolysis products at 500 °C.
Resources 14 00075 g005
Figure 6. SEM images of CS biochar produced at 500 °C using different particle size; 0.5–1 mm (a1,a2), 1–1.5 mm (b1,b2), and 1.5–2 mm (c1,c2). (numbers 1 and 2 refer to magnifications of 300 and 500× respectively).
Resources 14 00075 g006
Figure 7. SEM images of biochar samples produced at 500 °C using different RT; 15 min (a1,a2), 25 min (b1,b2), 35 min (c1,c2), and 45 min (d1,d2).
Resources 14 00075 g007
Figure 8. XRD results of biochar obtained at 500° C under different particle sizes and RT.
Resources 14 00075 g008
Table 1. Basic properties of cotton stalks.
SampleCotton Stalks
Ultimate analysis (%)
C44.41
H5.40
N1.11
S0.23
O (by difference)48.85
Proximate analysis (%)
MC3.57
Ash0.70
VM74.03
FC21.70
HHV (MJ/kg)16.55
Chemical composition
Cellulose42.50
Hemicellulose17.32
Lignin15.11
MC—Moisture content, VM—Volatile matter, FC—Fixed carbon.
Table 2. Kinetics parameters calculated based on the KAS method (primary pyrolysis).
Conversion Degree (−)0.5–1 mm1–1.5 mm1.5–2 mm
EaR2EaR2EaR2
0.180.30.9861106.40.9925110.40.9833
0.280.20.9768111.70.9877129.60.9822
0.378.50.9664112.90.9836142.70.9794
0.477.20.9564113.50.9803154.10.9779
0.577.50.9513115.10.9781162.70.9762
0.679.90.9514118.20.9747168.90.9744
0.785.80.9583124.50.9699173.10.9704
0.899.50.9760136.20.9592175.70.9628
0.9127.80.9973159.70.9380172.20.9491
Mean Value87.40.9689122.00.9738154.40.9728
Table 3. Kinetics parameters calculated based on the FWO method (primary pyrolysis).
Conversion Degree (−)0.5–1 mm1–1.5 mm1.5–2 mm
EaR2EaR2EaR2
0.185.30.9887110.20.9937114.10.9857
0.285.30.9812115.30.9896132.50.9845
0.383.90.9730116.70.9861145.10.9819
0.482.80.9652117.40.9834156.10.9804
0.583.20.9612119.00.9815164.40.9788
0.685.50.9611122.10.9786170.40.9771
0.791.20.9662128.10.9743174.40.9735
0.8104.40.9801139.30.9646176.90.9667
0.9131.40.9977161.80.9451173.70.9545
Mean Value92.60.9749125.60.9774156.40.9759
Table 4. Kinetics parameters calculated based on the KAS method (secondary pyrolysis).
Conversion Degree (−)0.5–1 mm1–1.5 mm1.5–2 mm
EaR2EaR2EaR2
0.188.40.8408145.00.9570112.40.9961
0.264.20.9914104.00.9395153.90.9933
0.345.00.971479.10.9138187.20.9585
0.432.00.976955.40.8879154.50.8688
0.521.90.982537.20.8525115.80.7867
0.614.30.982625.20.809188.50.7386
0.78.70.976717.30.749769.30.7046
0.84.90.957212.20.668558.70.6865
0.92.50.87028.90.568953.50.7049
Mean Value31.30.950053.80.8163110.40.8265
Table 5. Kinetics parameters calculated based on the FWO method (secondary pyrolysis).
Conversion Degree (−)0.5–1 mm1–1.5 mm1.5–2 mm
EaR2EaR2EaR2
0.1118.40.9386148.50.9669117.50.9967
0.285.90.9701110.10.9507157.50.9942
0.364.10.941886.90.9342189.70.9633
0.450.00.947364.80.9233159.20.8861
0.539.10.951347.90.9144122.90.8214
0.631.00.951336.90.910797.60.7919
0.725.20.949229.90.909980.10.7789
0.821.50.942725.60.909470.70.7789
0.919.10.933023.00.908566.50.8039
Mean Value50.50.947363.70.9253118.00.8684
Table 6. GC–MS results of CS bio-oil produced under optimal conditions (500 °C and 0.5–1 mm particle size).
RT (min)Compounds NameArea (%)
4.952H-Pyran, 3,4-dihydro-6-methyl-7.39
9.75Tetrahydrofurfuryl chloride0.59
11.141,2-Cyclopentanedione, 3-methyl-4.89
13.30Phenol, 2-methoxy-12.96
16.97Phenol, 2-methoxy-4-methyl-3.60
19.93Pyrazine, 2-methoxy-3-(1-methylethyl)-4.85
21.182-Methoxy-4-vinylphenol3.22
22.04Phenol, 2,6-dimethoxy-36.77
25.23Phenol, 2-methoxy-4-(1-propenyl)-1.31
26.93Benzene acetic acid, 4-hydroxy-3-methoxy-18.53
28.004-Methyl-2,5-dimethoxybenzaldehyde5.91
Table 7. Calorific value, energy yield and energy densification ratio of CS biochar produced at 500 °C using different RT and particle size (PS).
Sample Solid Yield (%)Calorific Value (MJ/Kg)Energy Yield (%)Energy Densification Ratio
CS10016.55-1
PS (0.5–1 mm)30.725.5647.411.54
PS (1–1.5 mm)30.825.9048.201.56
PS (1.5–2 mm)31.125.7448.371.56
RT-15 min30.526.0548.011.57
RT-25 min30.4325.6747.201.55
RT-35 min30.2825.6446.911.55
RT-45 min30.2525.646.791.55
Disclaimer/Publisher’s Note: The statements, opinions and data contained in all publications are solely those of the individual author(s) and contributor(s) and not of MDPI and/or the editor(s). MDPI and/or the editor(s) disclaim responsibility for any injury to people or property resulting from any ideas, methods, instructions or products referred to in the content.