
Techno-Economic Optimization and Assessment of Solar Photovoltaic–Battery–Hydrogen Energy Systems with Solar Tracking for Powering ICT Facility

 , , , , ,
Abstract
1. Introduction
Contribution of the Present Study
- Conduct comprehensive analyses that consider technical, economic, and environmental performance to inform the design and implementation of renewable energy systems, providing decision-makers and stakeholders with an in-depth perspective.
- Examine the synergistic utilization of hydrogen tanks and batteries as energy storage solutions in a hybrid energy system for powering an ICT facility while evaluating their performance, efficiency, and cost-effectiveness.
- This paper examines the effects of various solar tracking setups on the sizing and functioning of energy storage systems, specifically focusing on hydrogen tanks and batteries.
- Utilize multi-criteria decision-making (MCDM) frameworks to assess and prioritize solutions for hybrid energy systems, considering technical, financial, and environmental factors.
2. Materials and Methods
2.1. Methodology
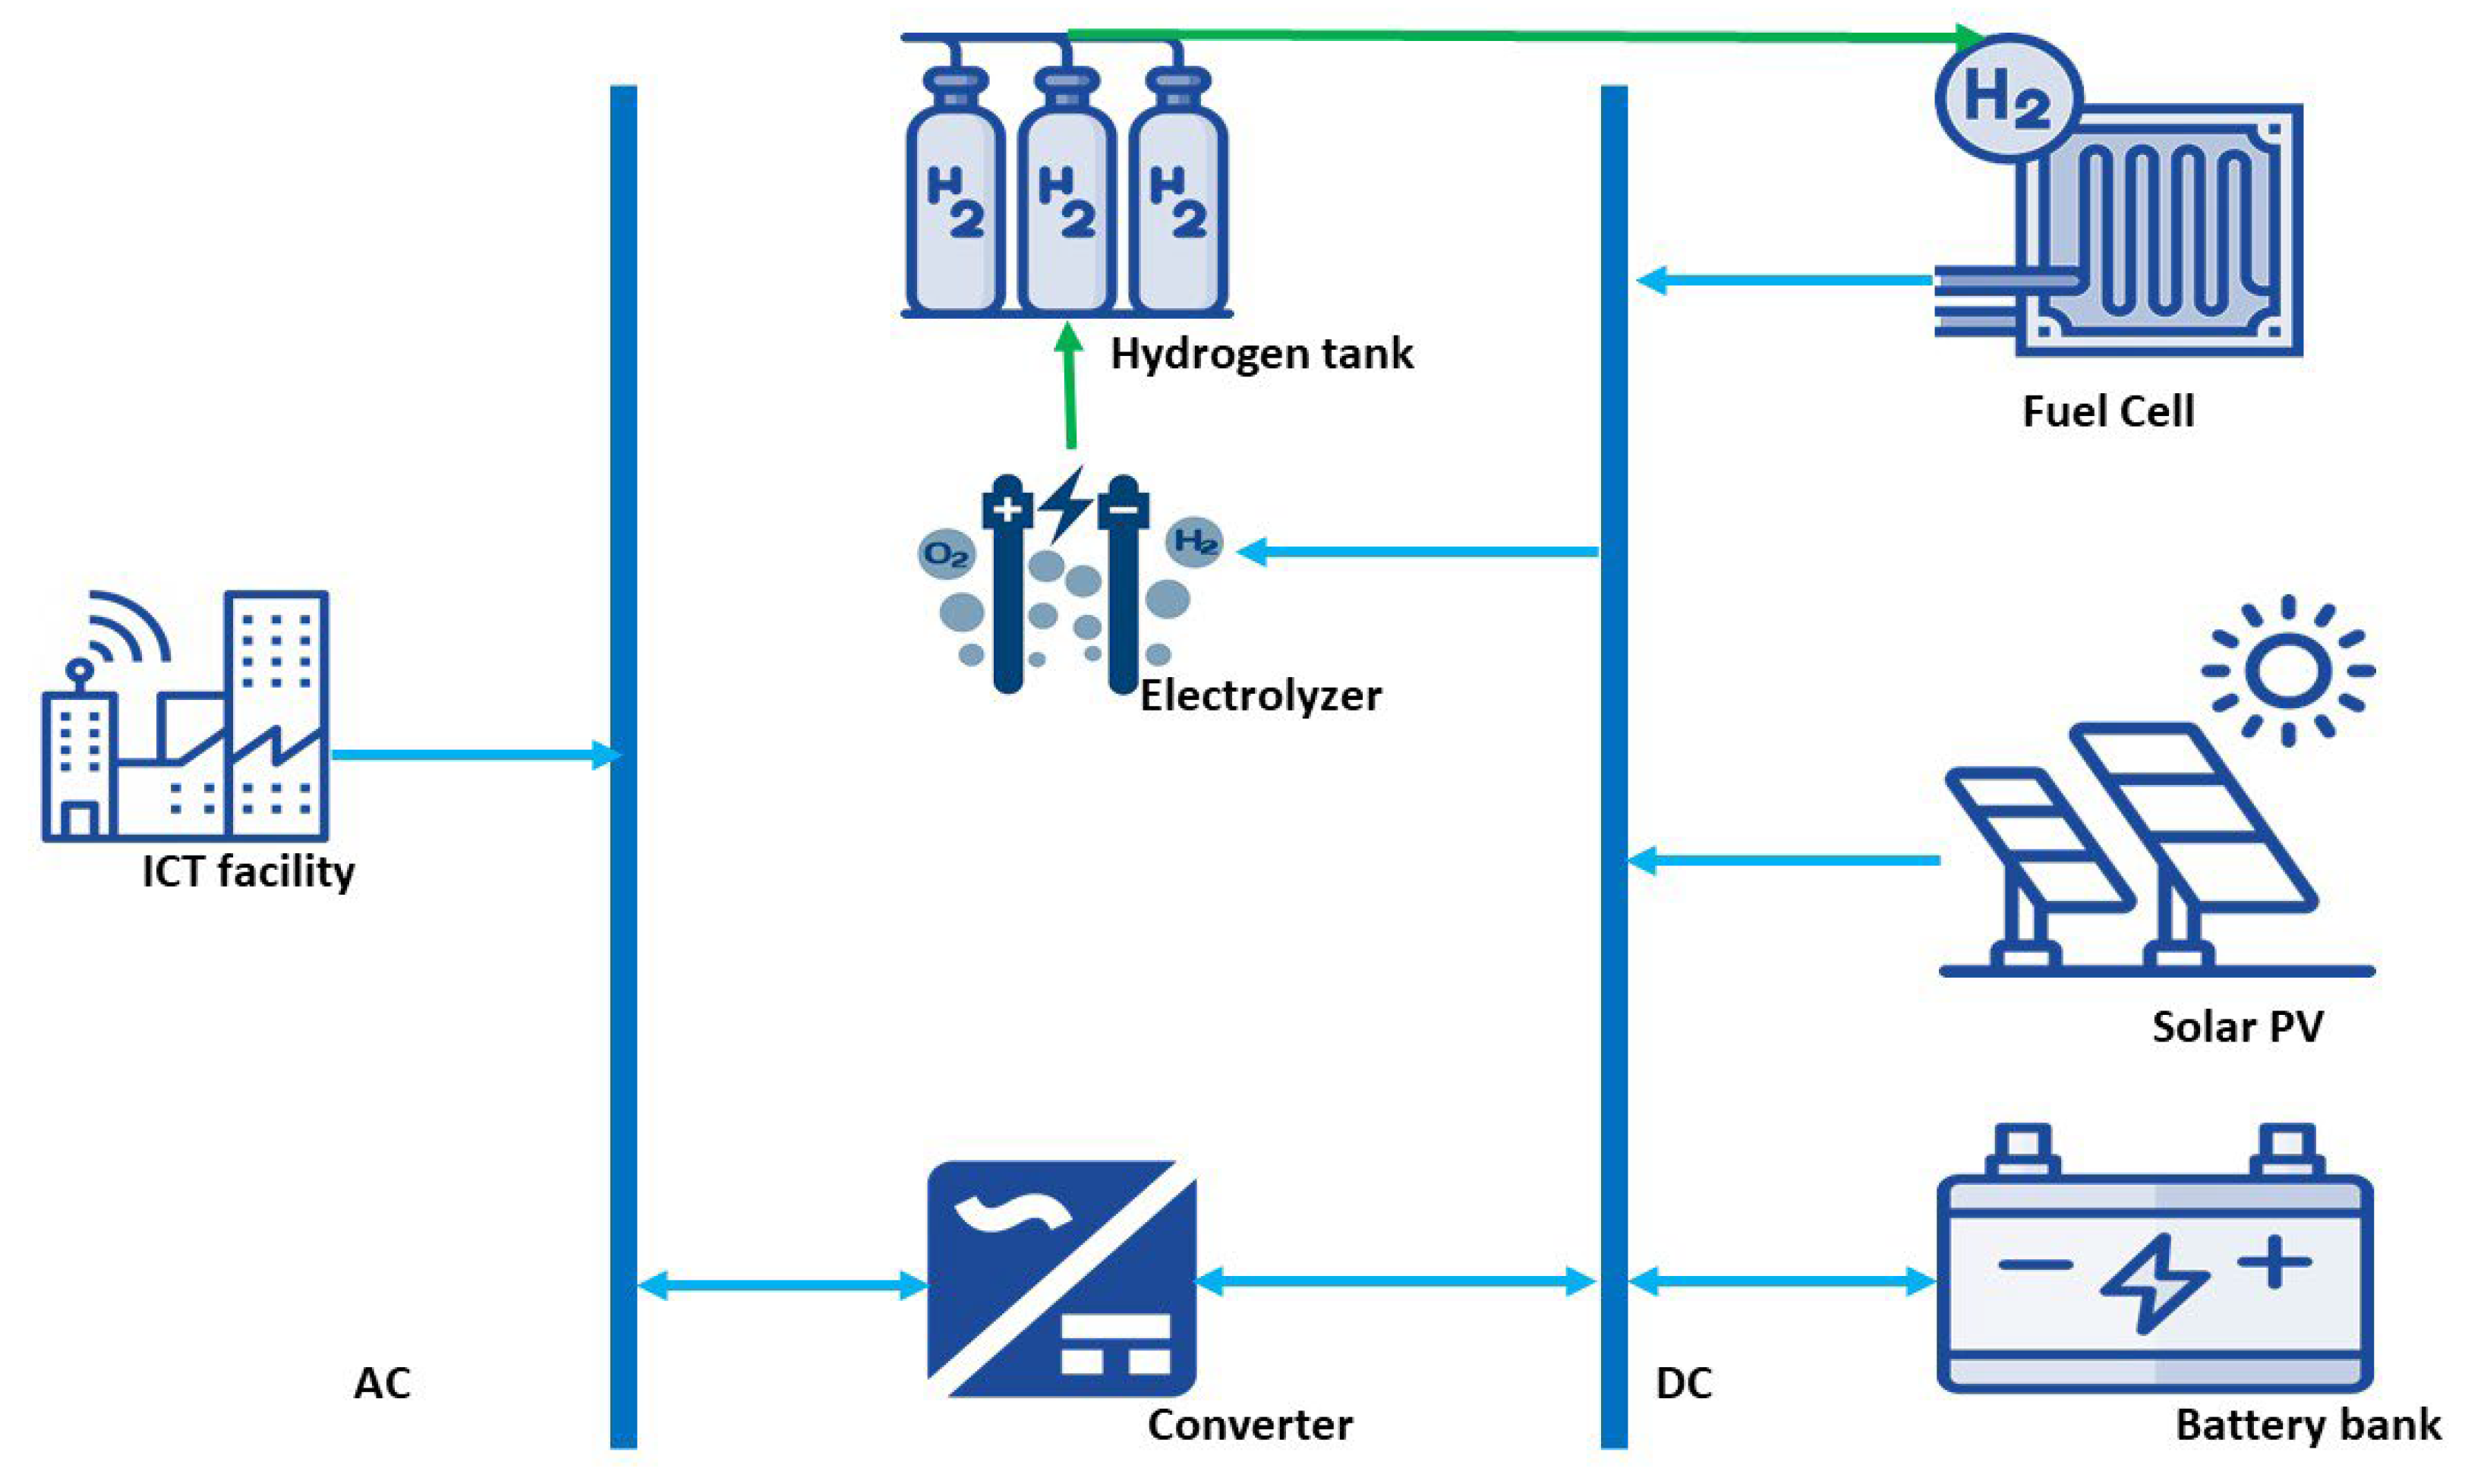
2.2. System Design
2.3. Solar PV
2.3.1. Solar Photovoltaic (PV) Tracking Systems
2.3.2. Solar Tracking Configurations
2.3.3. Choice of Tracking Strategy
2.4. Battery Storage
2.5. Hydrogen Storage
2.6. Economic Details of the Components
2.7. Study Area
2.8. Electricity Demand
2.9. Multi-Criteria Decision-Making (MCDM) Framework
2.9.1. Entropy Weighing Method
- Normalize decision matrix:
- 2.
- Calculate the entropy value for each criterion:
- 3.
- Calculate the degree of diversification:
- 4.
- Calculate the final weight:where is the number of alternatives and is the number of criteria.
2.9.2. CODAS Method
- Normalize the decision matrix using a linear normalization method.
- Calculate the weighted normalized decision matrix.
- Determine the negative-ideal solution for each criterion
- Compute each alternative’s Euclidean and Taxicab distances from the negative-ideal solution.
- Construct the relative assessment matrix using the following:where is a threshold parameter (typically set to 0.02) and:with being a threshold parameter (typically set to 0.01).
- Calculate the assessment score for each alternative:
- Rank the alternatives based on assessment scores, with higher scores indicating better alternatives.
2.9.3. ARAS Method
- Normalize the decision matrix:
- For benefit criteria:
- For cost criteria:
- Calculate the weighted normalized decision matrix.
- Determine the optimality function for each alternative:
- Compute the utility degree of each alternative:where is the optimality function value for the optimal alternative.
- Rank the alternatives based on utility degrees, with higher values indicating better alternatives.
2.9.4. EDAS Method
- Compute the average solution for each criterion:
- Calculate the positive distance from average (PDA) and negative distance from average (NDA):
- For benefit criteria:
- For cost criteria
- Calculate the weighted sum of PDA and NDA:
- Normalize the values of SP and SN:
- Calculate the appraisal score:
- Rank the alternatives based on AS values, with higher values indicating better alternatives.
2.9.5. MOORA Method
- Normalize the decision matrix:
- Calculate the benefit and cost criteria values:
- Compute the MOORA performance score:
- Rank the alternatives based on , where higher scores indicate more favorable alternatives.
3. Results and Discussion
3.1. Technical
3.2. Economic
3.3. Environmental
3.4. Multi-Criteria Decision Analysis
4. Conclusions
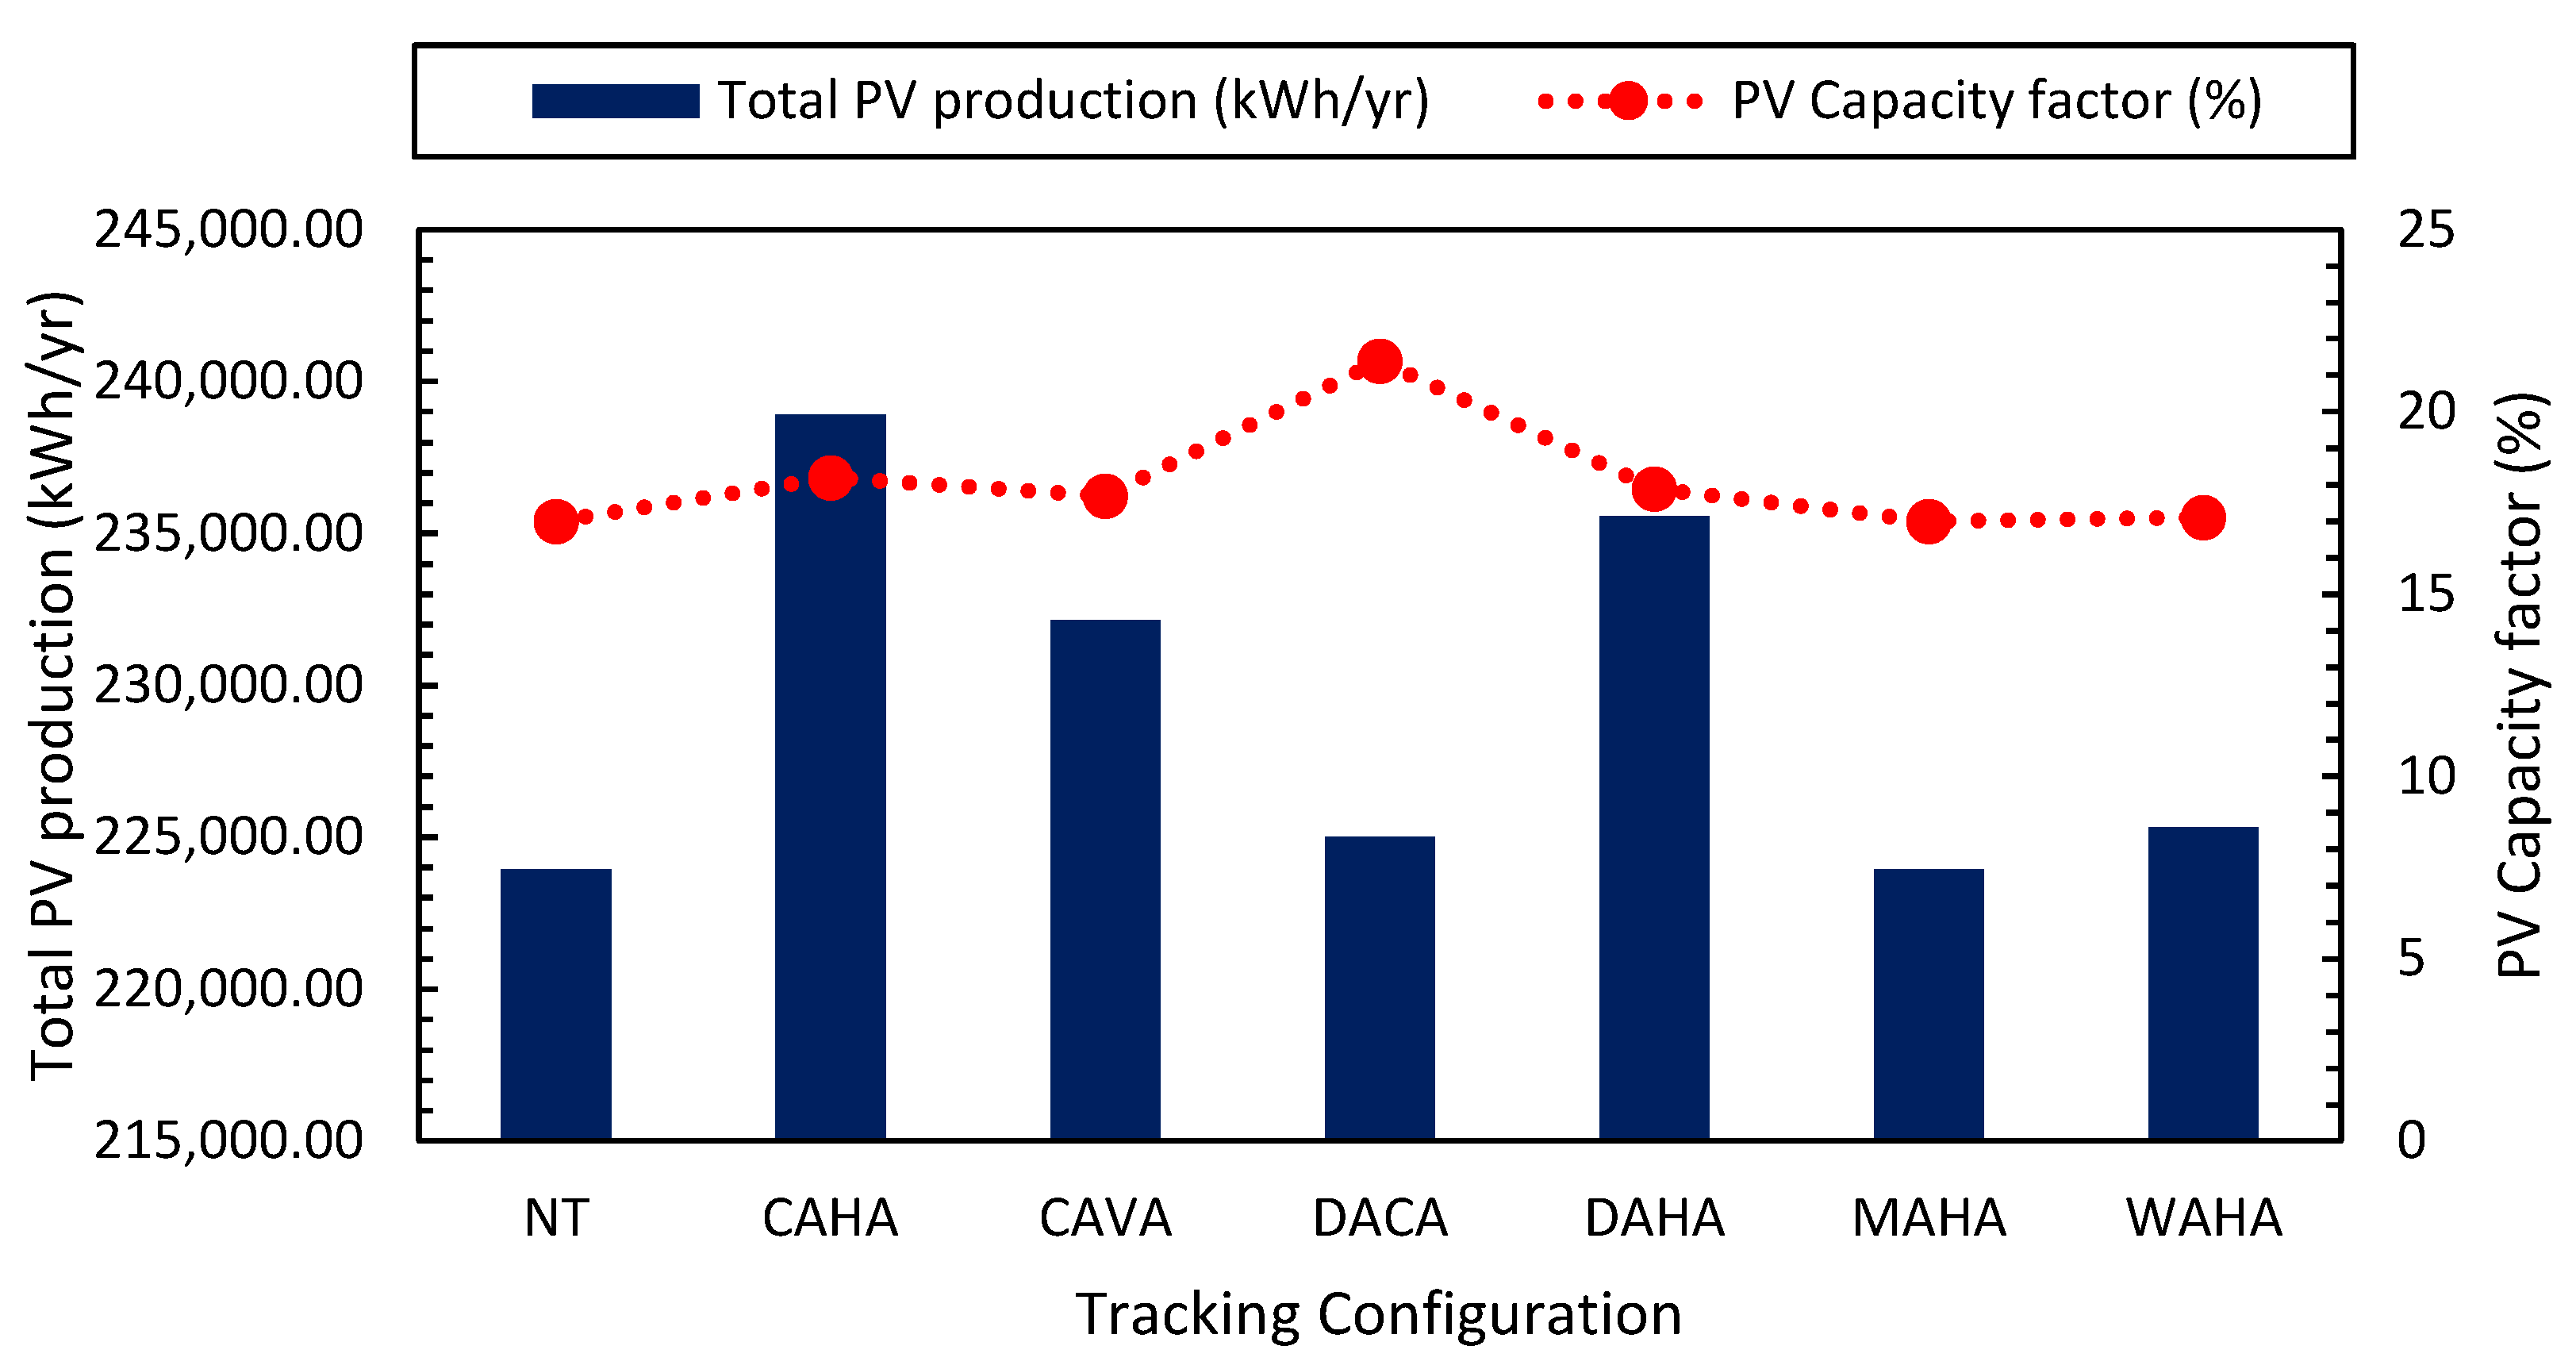
- Tracking systems enhance energy generation efficiency: In terms of overall energy production efficiency, the research found that photovoltaic (PV) tracking configurations outperformed non-tracking systems. Using tracking systems resulted in consistently better energy production, demonstrating their ability to extract more power from solar panels.
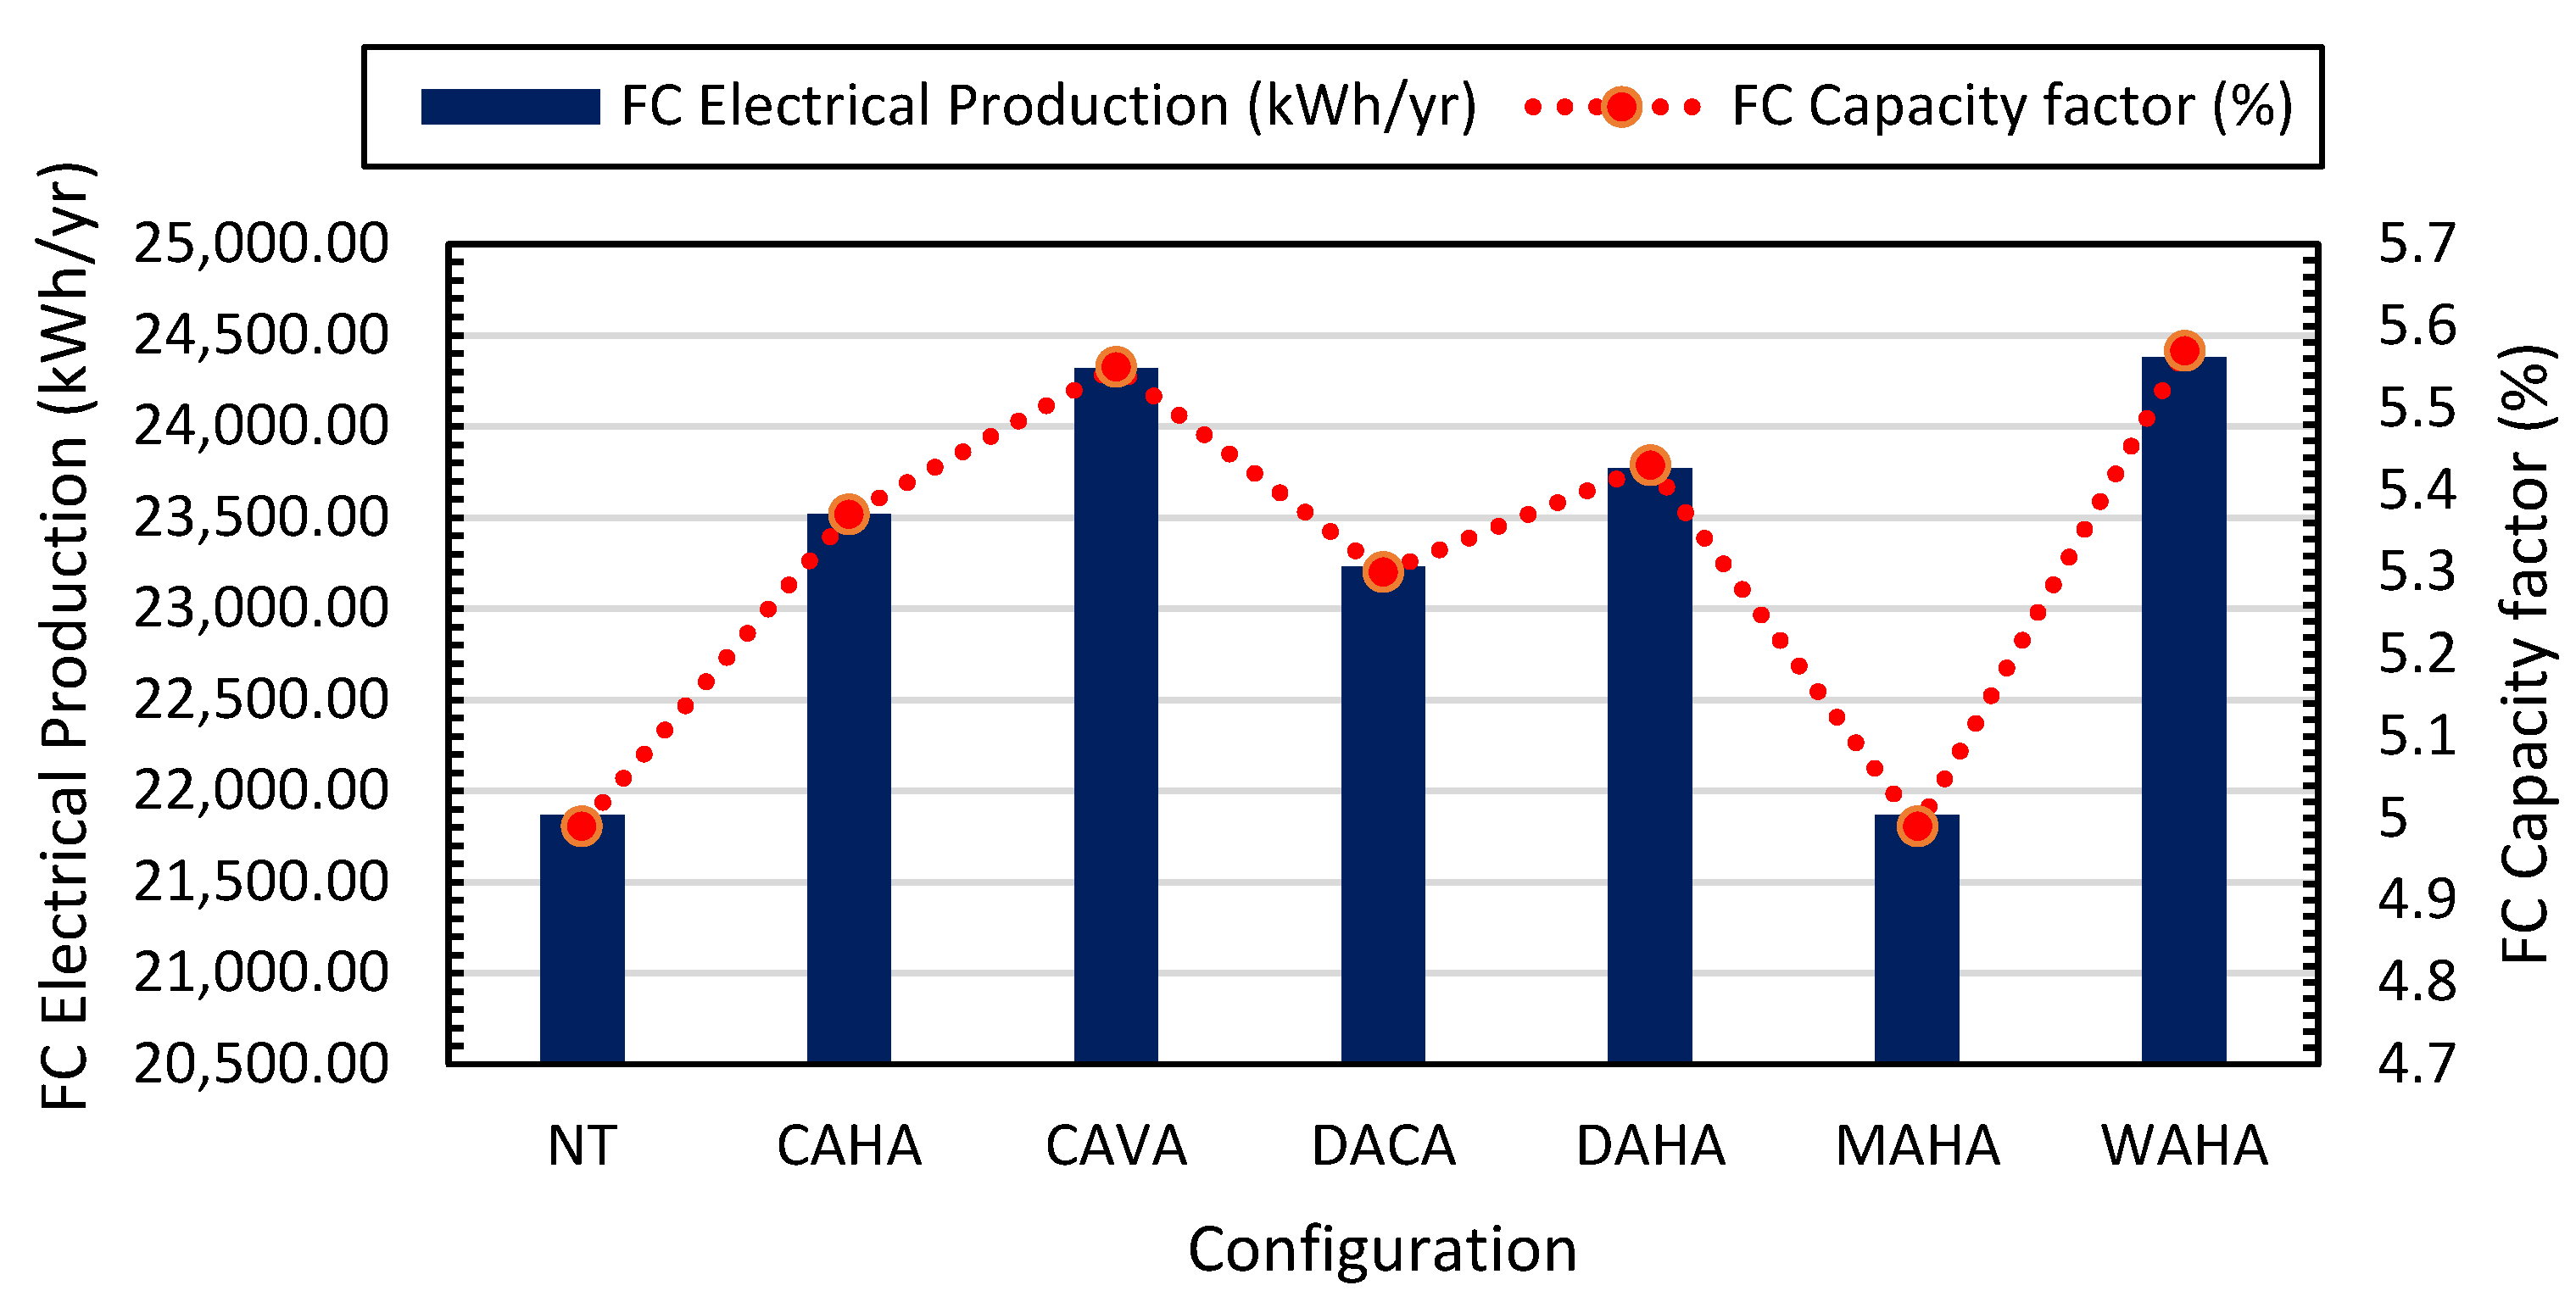
- Capacity factor variation: The capacity factor, a crucial metric for evaluating the efficacy of PV panels, varied across tracking configurations considered in this research. CAHA and DAHA configurations exhibited the highest energy production, demonstrating their capacity to maximize PV panel utilization.
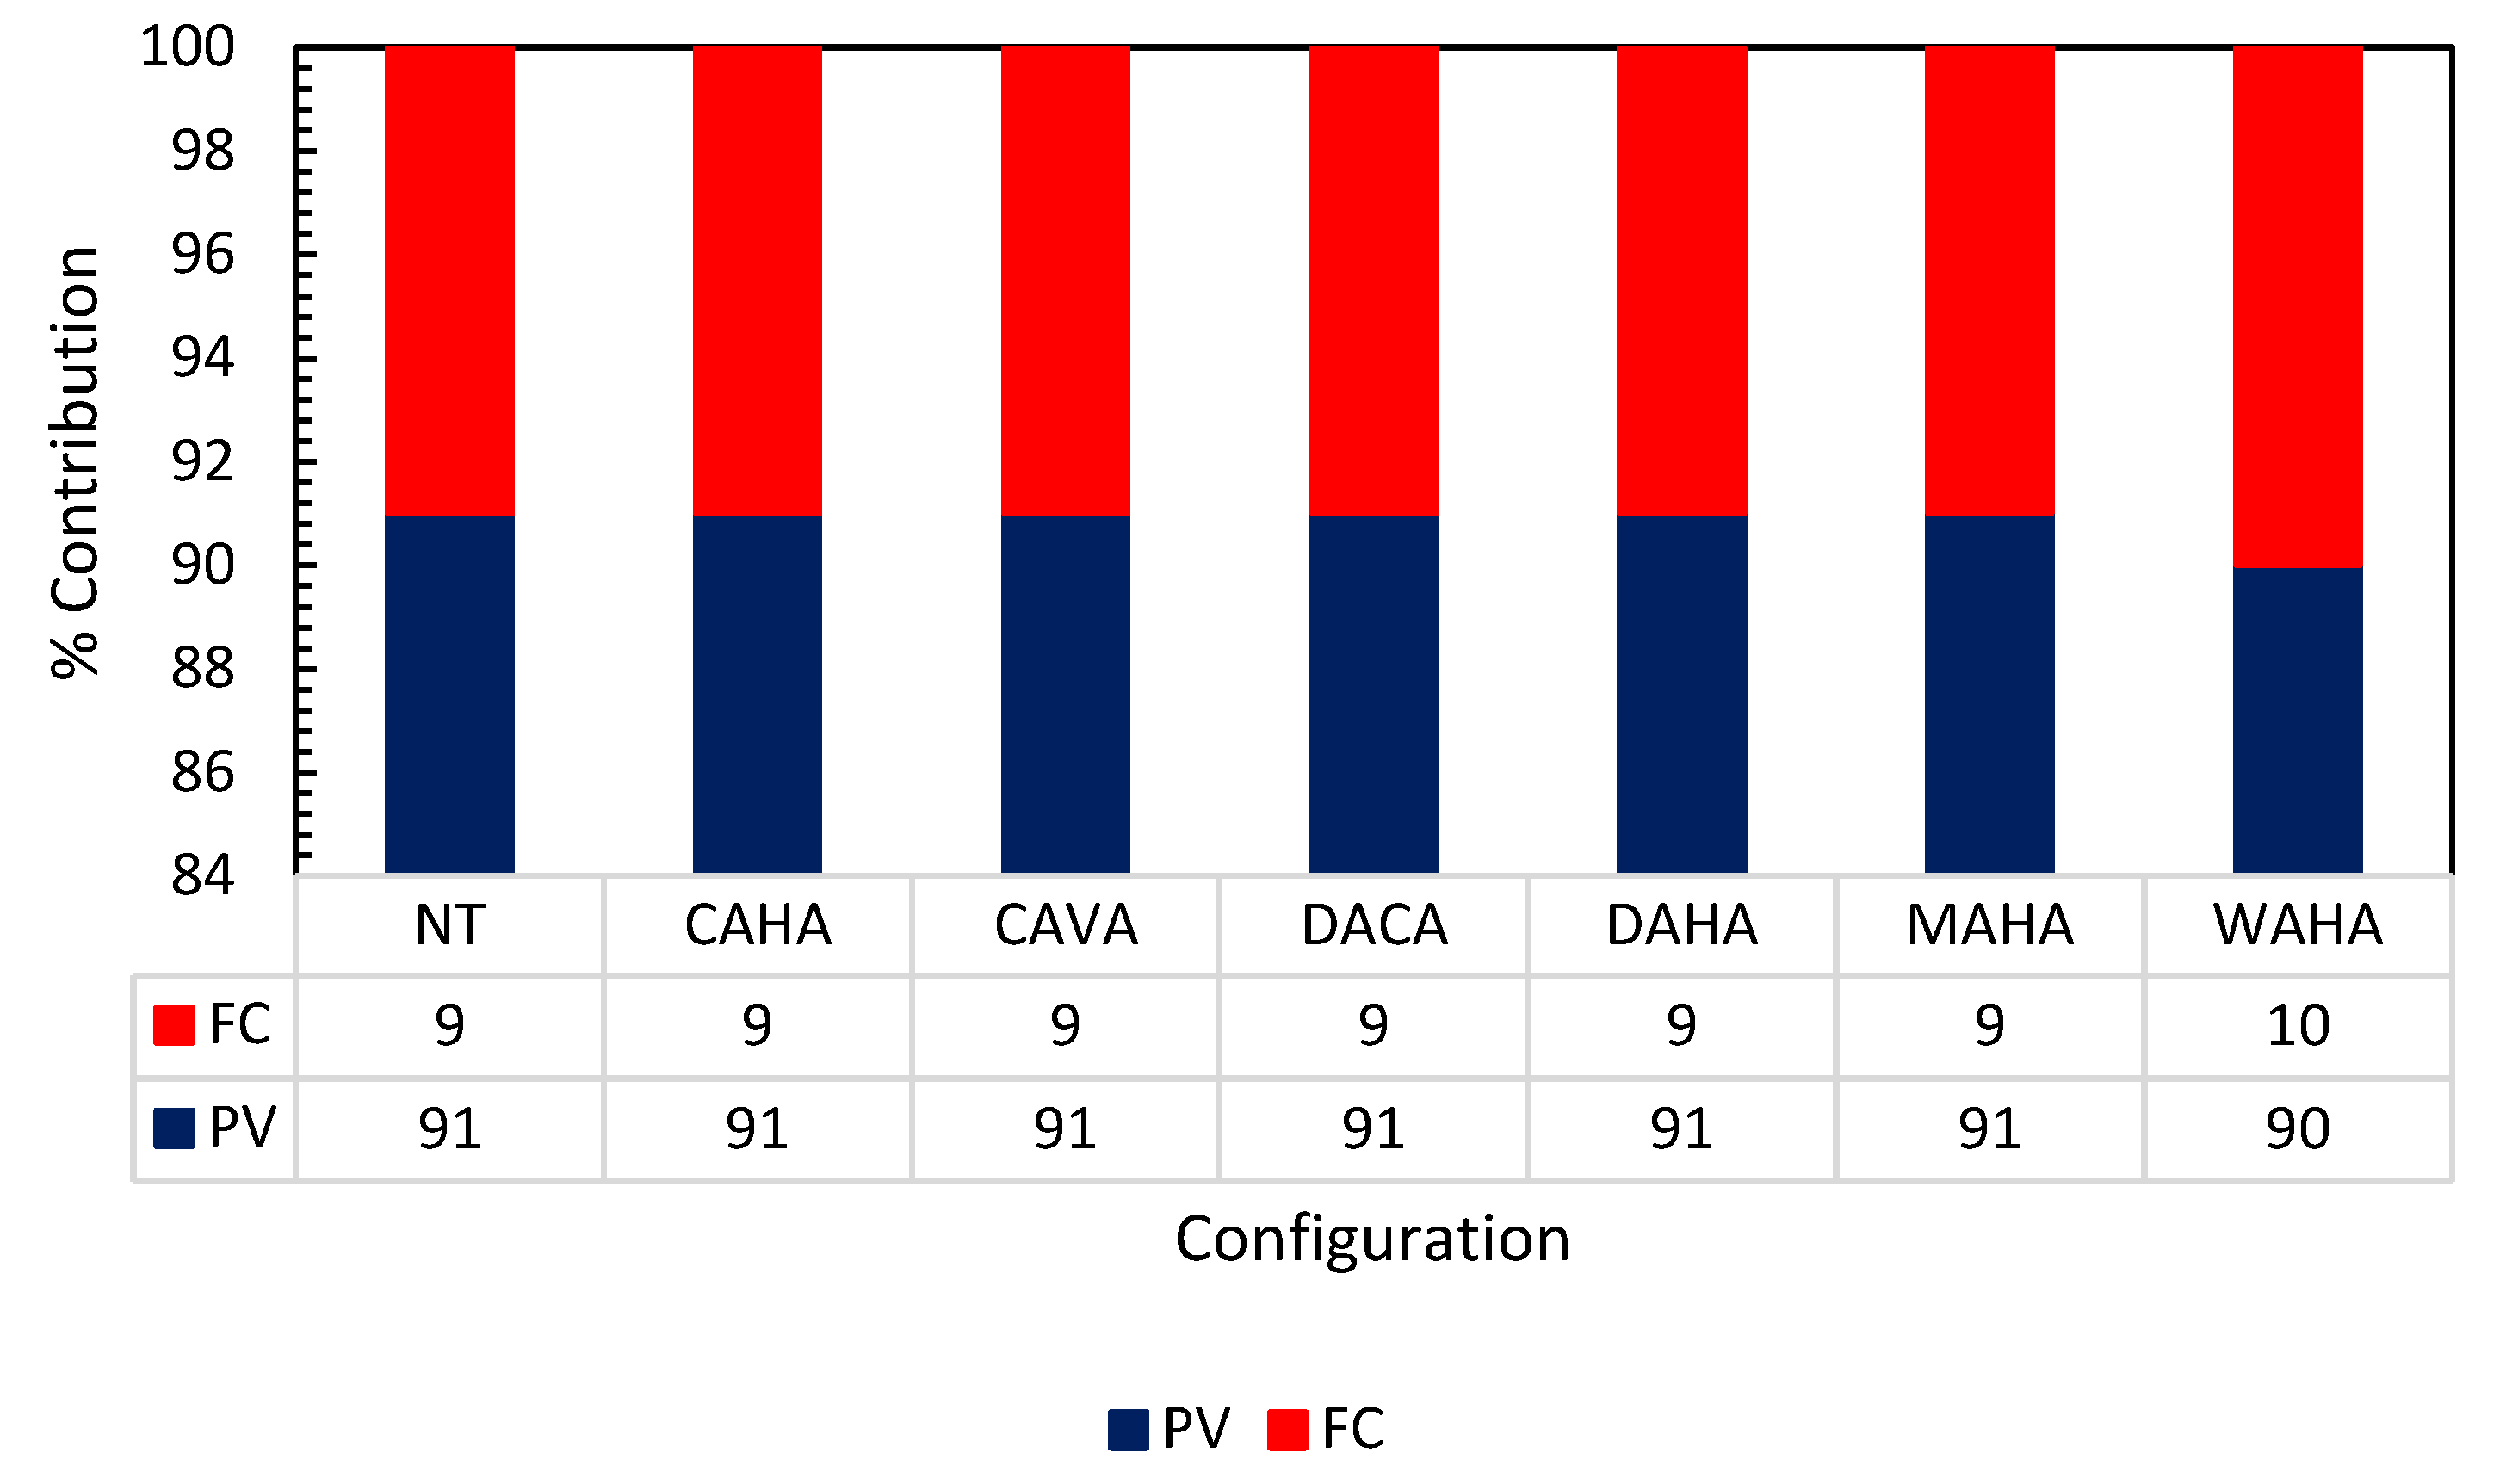
- Energy storage: Solar tracking systems optimize energy production. Regarding battery energy storage, DACA offers high autonomy and capacity, ideal for reliability, while MAHA and NT are cost-effective. CAHA produces the most FC energy in September, whereas MAHA produces the least in February. DACA produces the most hydrogen in January, whereas CAHA produces the least in February.
- Load-following strategies improve reliability: Regarding capacity deficit and excess power output, configurations employing load-following algorithms performed exceptionally well. This indicates that load-following strategies improve reliability and economic sustainability by more closely matching energy supply with demand.
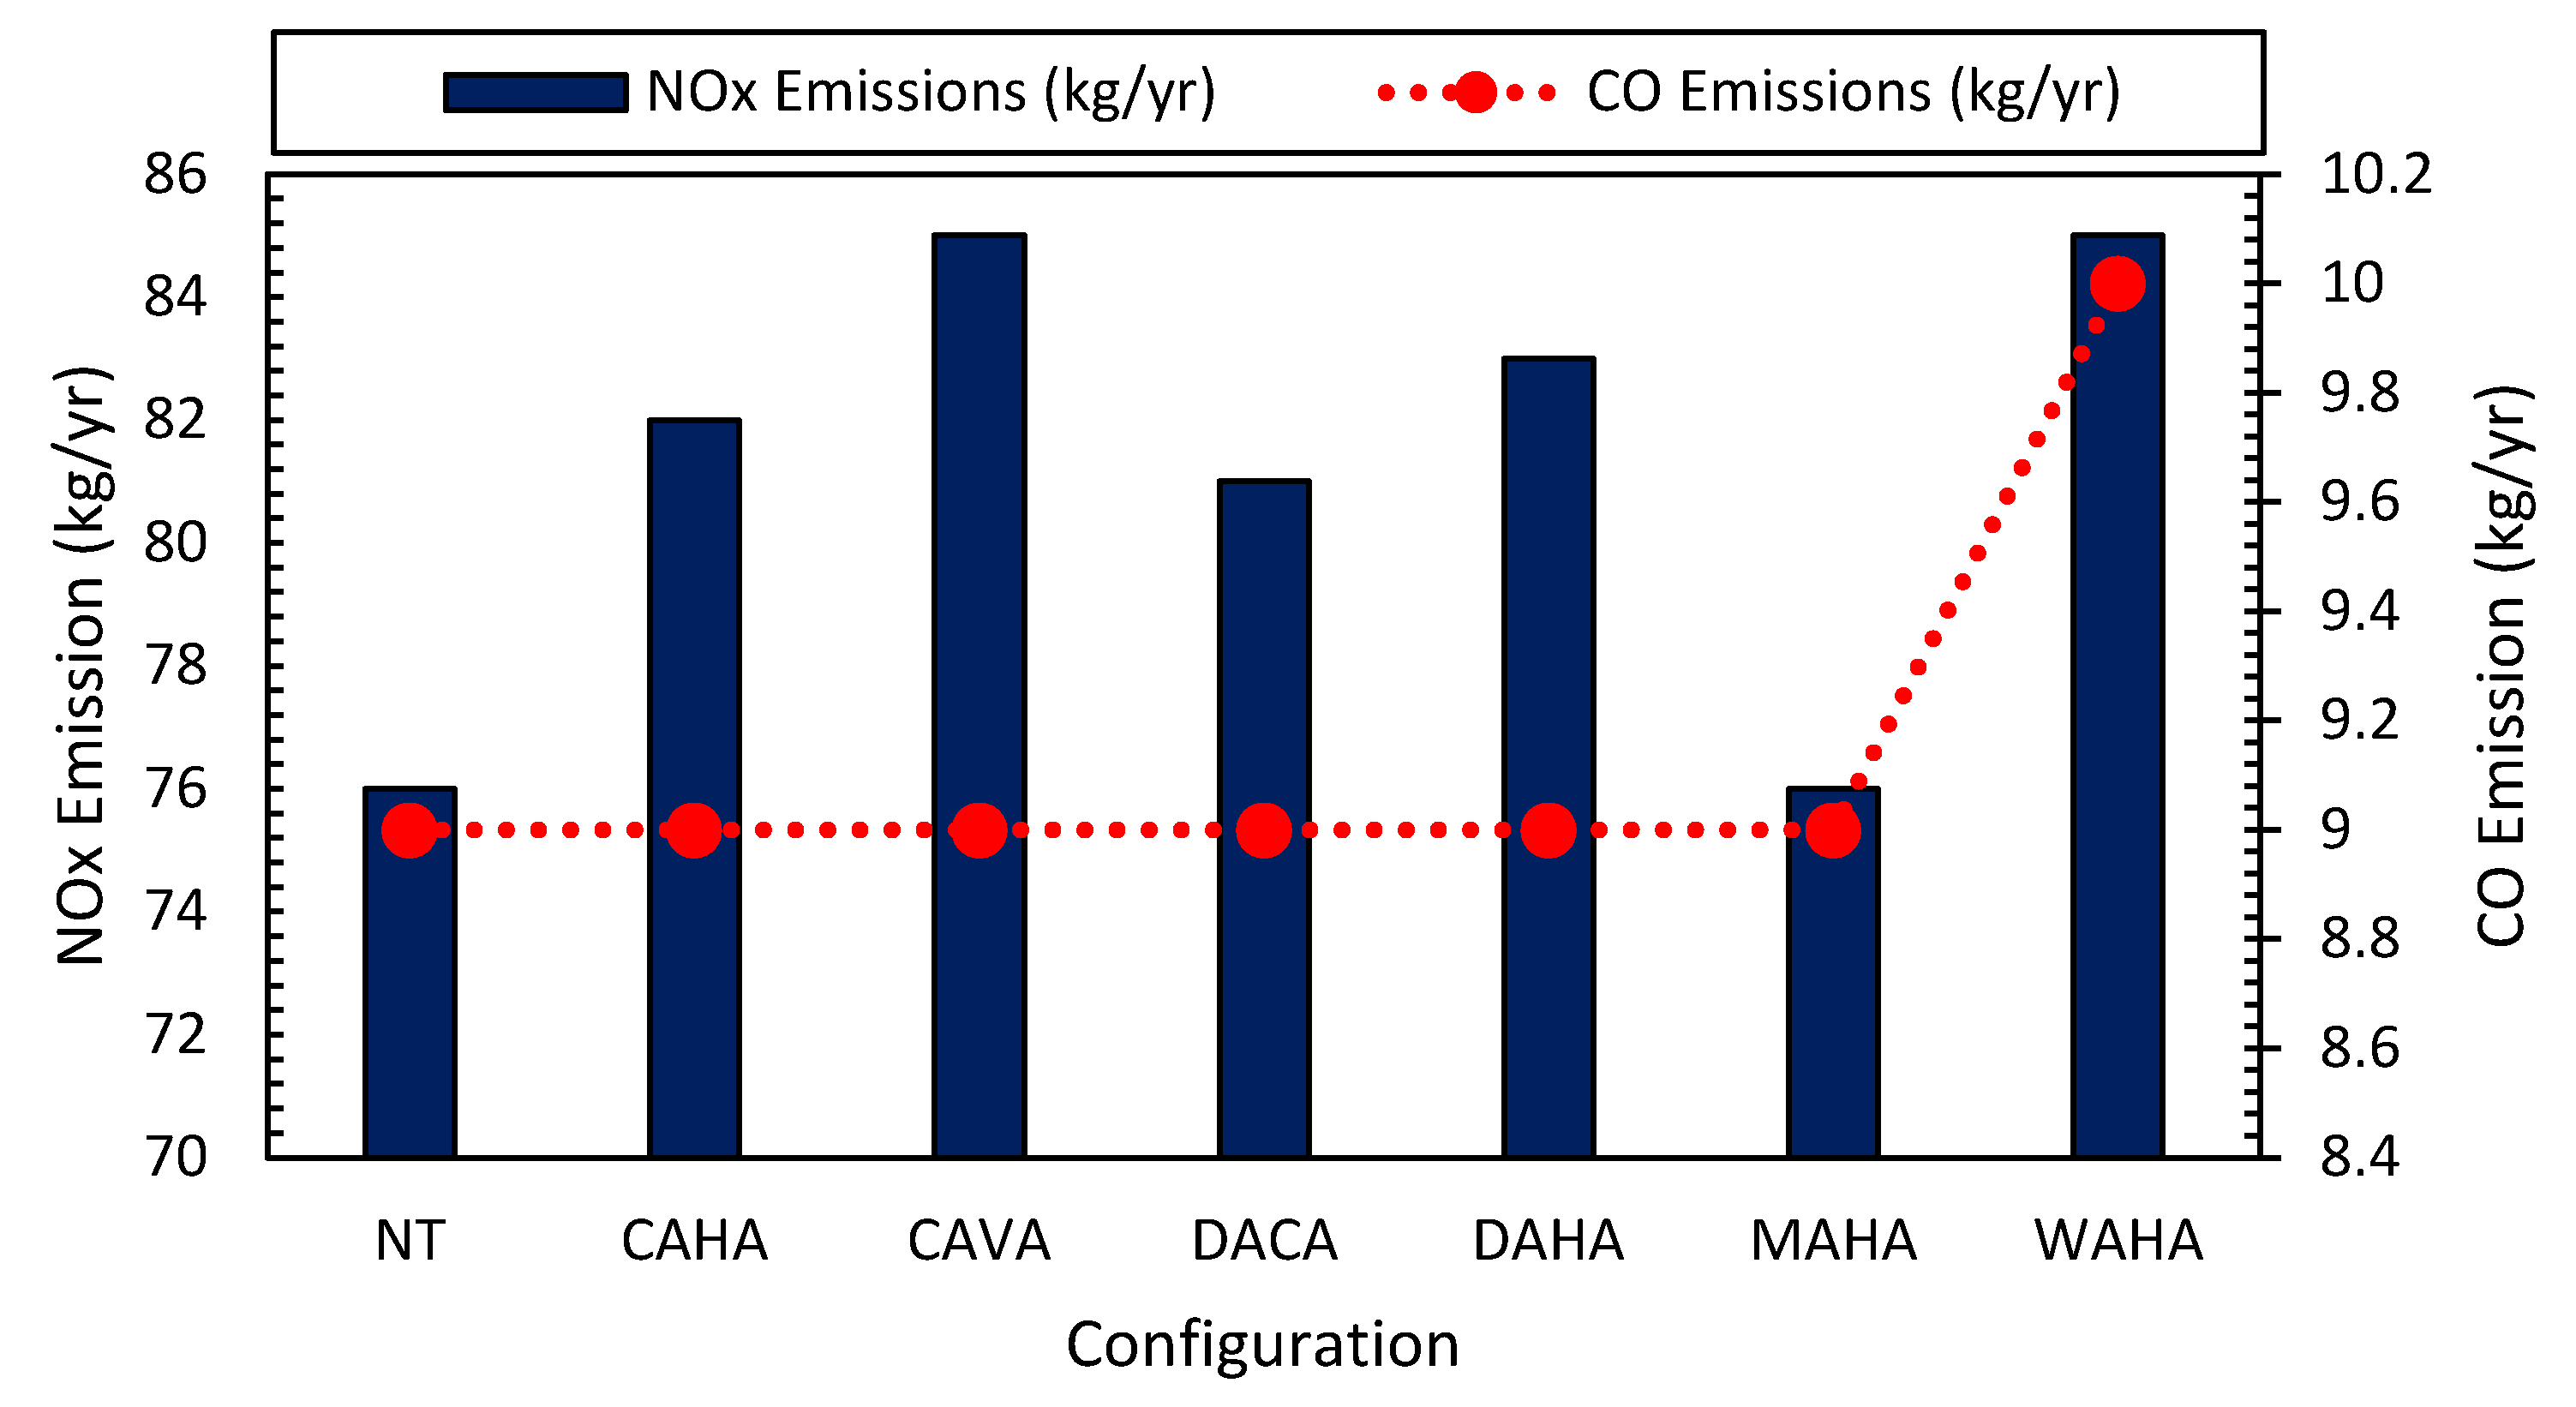
- Environmental impact: All configurations achieved a 100% renewable fraction, demonstrating their commitment to sustainability. Furthermore, none of the configurations emitted CO2, indicating their environmental friendliness. However, NOx emissions varied, with CAVA and WAHA producing the most and NT and MAHA emitting the least.
- Multi-Criteria Decision Analysis (MCDM): The research utilized the multi-criteria decision-making (MCDM) methodology to evaluate and prioritize various energy choices holistically. The study’s findings indicate that the CAVA energy system emerged as the most preferred option, demonstrating its superior performance across multiple criteria categories. On the other hand, DACA was deemed the least desirable option because of its performance shortcomings compared with other options. The inconsistency in MOORA’s findings highlights the need to employ multiple decision-making frameworks to achieve a comprehensive assessment. While each approach has merit, inconsistencies between them highlight the need for a comprehensive study that considers various evaluation methods and criteria before drawing conclusions in complex scenarios, such as energy system selection.
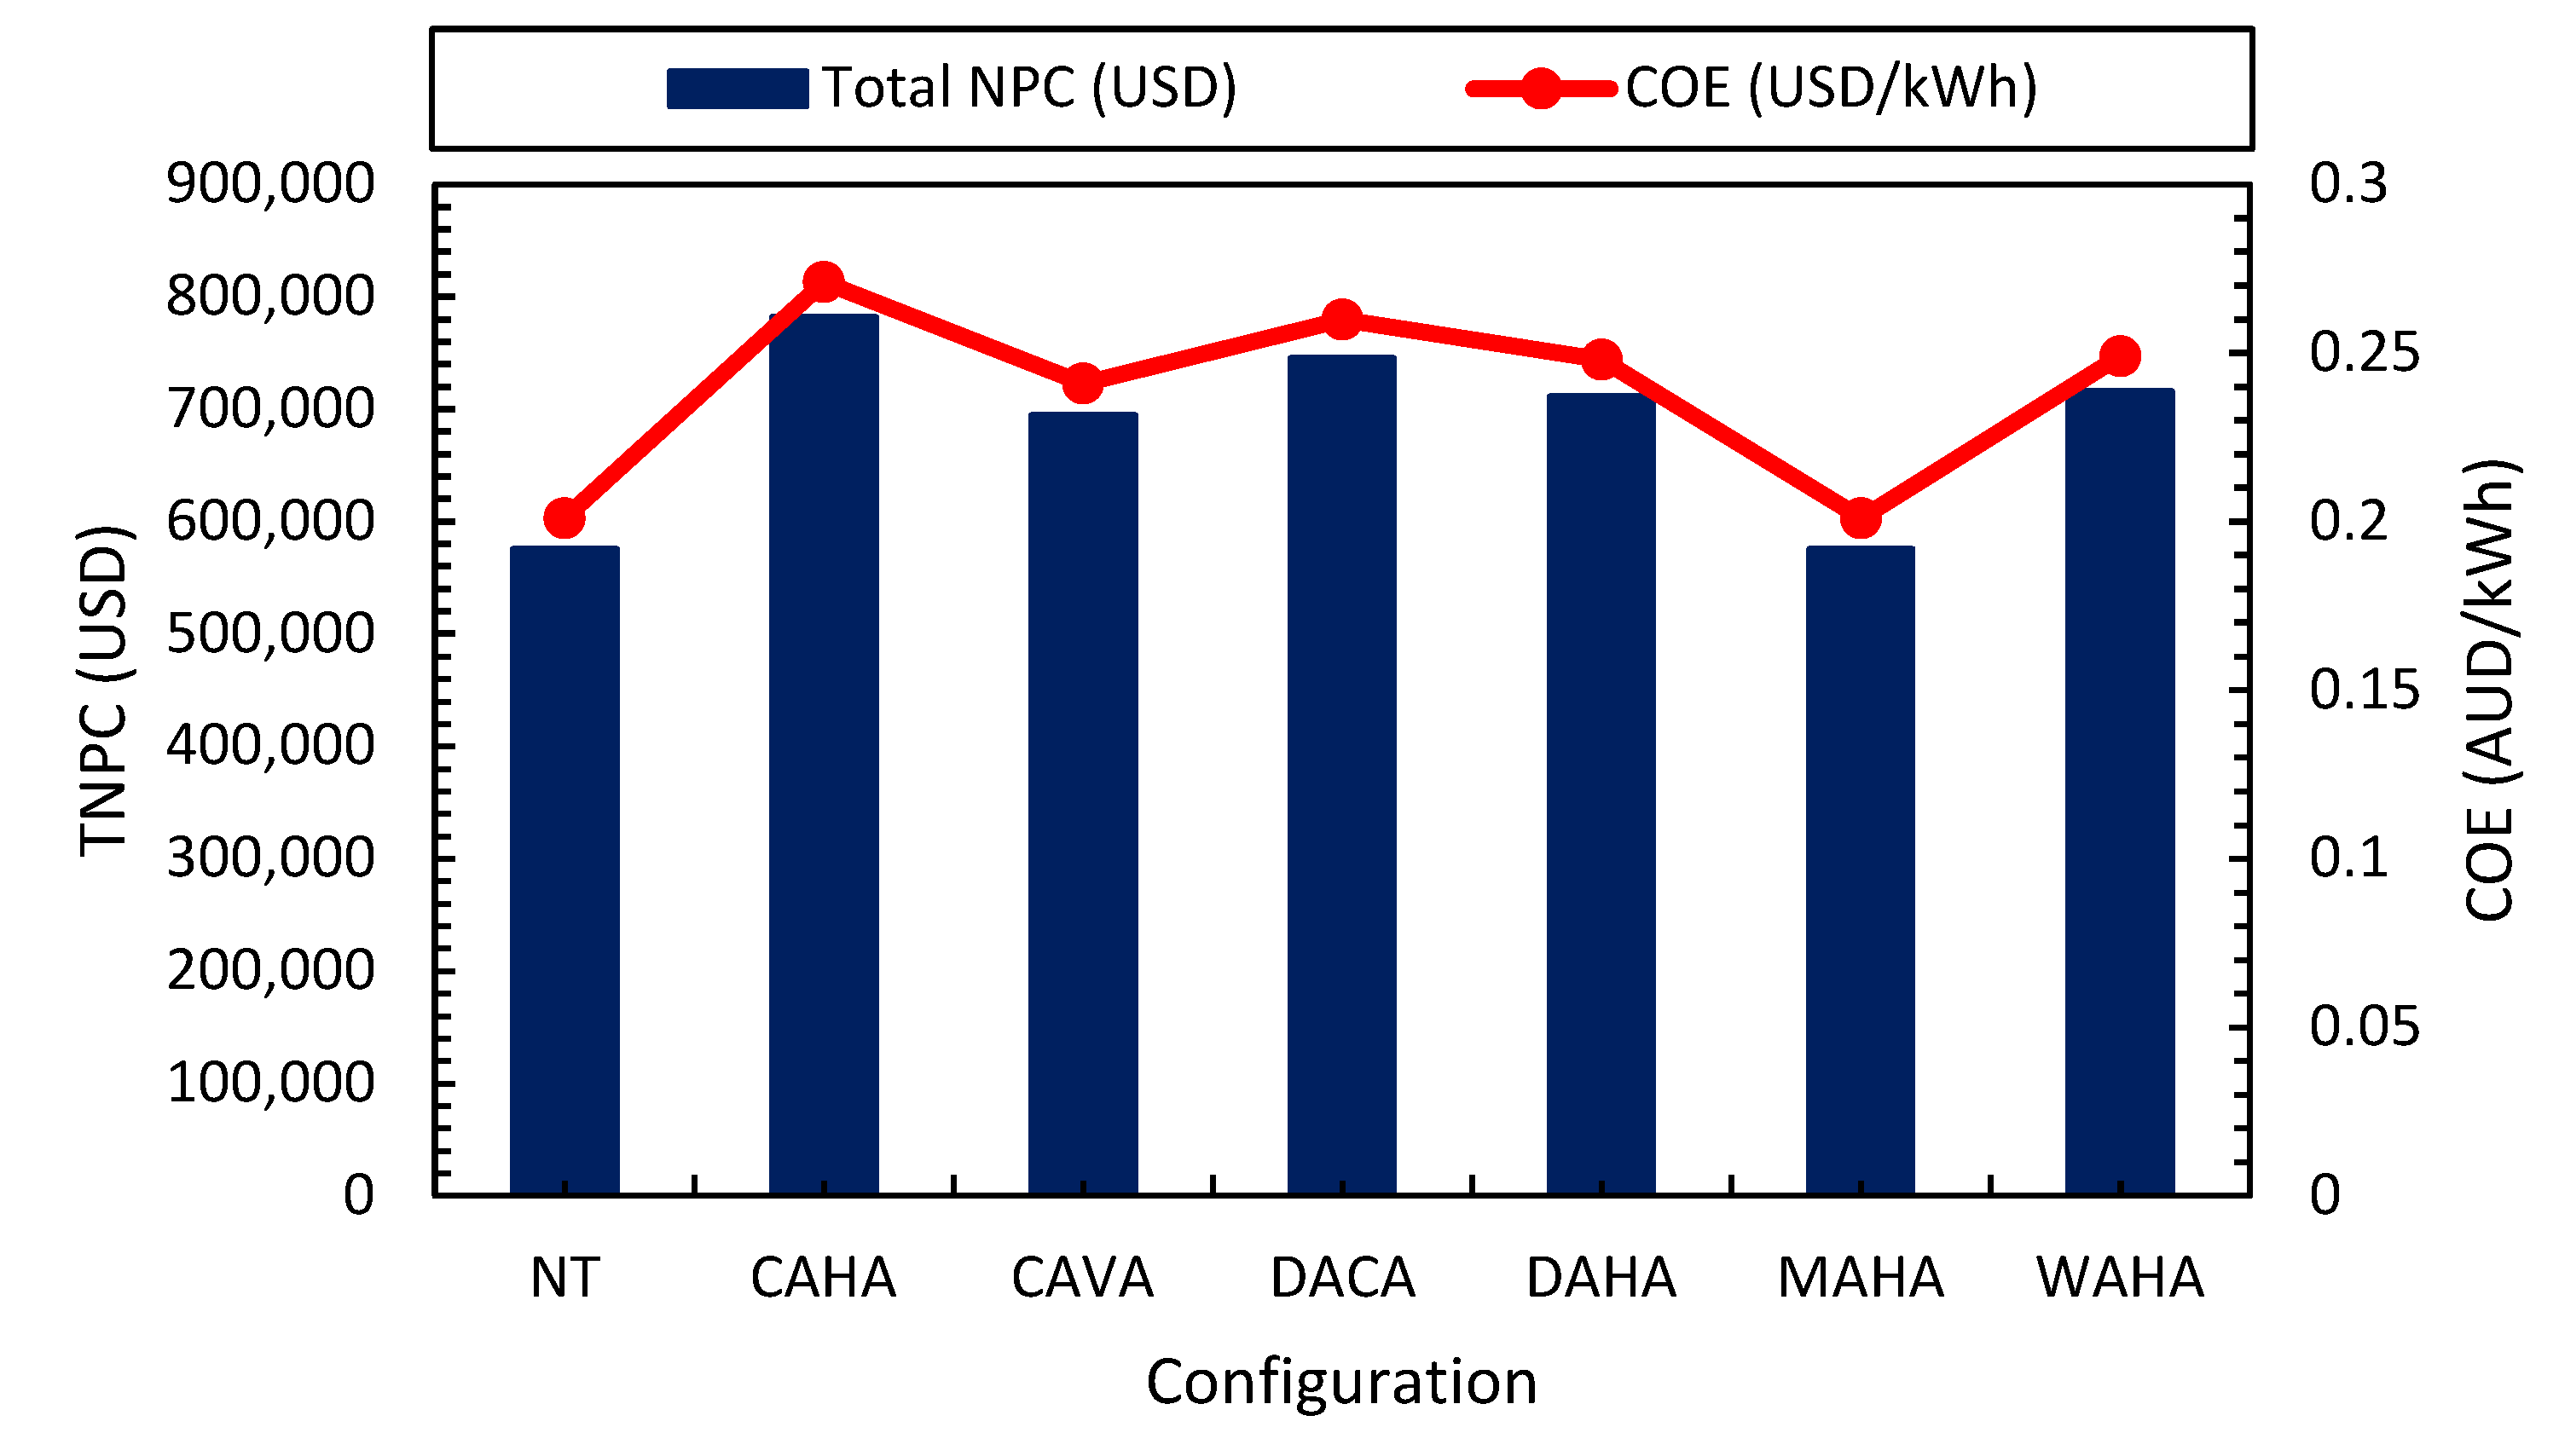
- Solar-tracking configuration rankings (using multiple metrics): Based on electricity production, the systems are ranked as . Based on cost of energy (COE), they are ranked as . Also, using the CODAS, EDAS, and ARAS methods, the systems are ranked as .
5. Future Work
Supplementary Materials
Author Contributions
Funding
Data Availability Statement
Conflicts of Interest
References
- UNESCO. One Year into COVID-19 Education Disruption: Where Do We Stand? 2023. Available online: https://www.unesco.org/en/articles/one-year-covid-19-education-disruption-where-do-we-stand (accessed on 22 May 2024).
- Alakrash, H.M.; Razak, N.A. Education and the Fourth Industrial Revolution: Lessons from COVID-19. Comput. Mater. Contin. 2022, 70, 951–962. [Google Scholar] [CrossRef]
- Adedoja, O.S.; Sadiku, E.R.; Hamam, Y. Effects of machine learning and artificial intelligence in an academic environment. In Proceedings of the Conference of the South African Society for Engineering Education, Pretoria, South Africa, 11–13 July 2023; Volume 313. [Google Scholar]
- Aldulaimi, S.H.; Abdeldayem, M.M.; Keir, M.Y.A.; Al-Sanjary, O. E-learning in higher education and COVID-19 outbreak: Challenges and opportunities. Psychol. Educ. J. 2021, 58, 38–43. [Google Scholar]
- Boeren, E. Understanding Sustainable Development Goal (SDG) 4 on “quality education” from micro, meso and macro perspectives. Int. Rev. Educ. 2019, 65, 277–294. [Google Scholar] [CrossRef]
- Adebisi, J.A.; Abdulsalam, K.A.; Omaidu, O.; Babatunde, O.M.; Ndjuluwa, N.P. Information Technology Driven Teaching and Learning in Post-Covid Era: A survey. Adeleke Univ. J. Sci. 2023, 2, 12–21. [Google Scholar]
- Miskiewicz, R. Clean and Affordable Energy within Sustainable Development Goals: The Role of Governance Digitalization. Energies 2022, 15, 9571. [Google Scholar] [CrossRef]
- Internertional Energy Agency. Data Centres and Data Transmission Networks. 2023. Available online: https://www.iea.org/energy-system/buildings/data-centres-and-data-transmission-networks (accessed on 13 August 2024).
- Akinyele, D.; Belikov, J.; Levron, Y. Challenges of Microgrids in Remote Communities: A STEEP Model Application. Energies 2018, 11, 432. [Google Scholar] [CrossRef]
- Gielen, D.; Gorini, R.; Wagner, N.; Leme, R.; Gutierrez, L.; Prakash, G.; Asmelash, E.; Janeiro, L.; Gallina, G.; Vale, G. Global Energy Transformation: A Roadmap to 2050. 2019. Available online: https://www.h2knowledgecentre.com/content/researchpaper1605 (accessed on 18 November 2024).
- The United Nations. THE 17 GOALS. Available online: https://sdgs.un.org/goals (accessed on 1 November 2024).
- Nsengiyumva, W.; Chen, S.G.; Hu, L.; Chen, X. Recent advancements and challenges in Solar Tracking Systems (STS): A review. Renew. Sustain. Energy Rev. 2018, 81, 250–279. [Google Scholar] [CrossRef]
- Awasthi, A.; Shukla, A.K.; Murali Manohar, S.R.; Dondariya, C.; Shukla, K.N.; Porwal, D.; Richhariya, G. Review on sun tracking technology in solar PV system. Energy Rep. 2020, 6, 392–405. [Google Scholar] [CrossRef]
- Okundamiya, M.S.; Wara, S.T.; Obakhena, H.I. Optimization and techno-economic analysis of a mixed power system for sustainable operation of cellular sites in 5G era. Int. J. Hydrogen Energy 2022, 47, 17351–17366. [Google Scholar] [CrossRef]
- Ali, M.B.; Altamimi, A.; Kazmi, S.A.A.; Khan, Z.A.; Alyami, S. Sustainable Growth in the Telecom Industry through Hybrid Renewable Energy Integration: A Technical, Energy, Economic and Environmental (3E) Analysis. Sustainability 2024, 16, 6180. [Google Scholar] [CrossRef]
- Odoi-Yorke, F.; Woenagnon, A. Techno-economic assessment of solar PV/fuel cell hybrid power system for telecom base stations in Ghana. Cogent Eng. 2021, 8, 1911285. [Google Scholar] [CrossRef]
- Ayodele, T.; Ogunjuyigbe, A.; Ehinlaiye, P.; Mosetlhe, T.; Yusuff, A. Hybrid Solar/Hydro Renewable Energy System with Hydrogen Storage for Powering a Typical Remote Base Transceiver Station. In Proceedings of the 2023 IEEE PES/IAS PowerAfrica, Marrakech, Morocco, 6–10 November 2023; pp. 1–5. [Google Scholar]
- Hossain, M.S.; Alharbi, A.G.; Islam, K.Z.; Islam, M.R. Techno-economic analysis of the hybrid solar PV/H/Fuel cell based supply scheme for green mobile communication. Sustainability 2021, 13, 12508. [Google Scholar] [CrossRef]
- Xie, Y.; Cui, Y.; Wu, D.; Zeng, Y.; Sun, L. Economic analysis of hydrogen-powered data center. Int. J. Hydrogen Energy 2021, 46, 27841–27850. [Google Scholar] [CrossRef]
- Kurtz, J.; Ma, Z.; Saur, G.; Wrubel, J.A.; Mount, R.; Hammond, S. Analysis of hydrogen infrastructure for the feasibility, economics, and sustainability of a fuel cell powered data center. Sustain. Energy Technol. Assess. 2023, 58, 103357. [Google Scholar] [CrossRef]
- Ali, M.B.; Kazmi, S.A.A.; Altamimi, A.; Khan, Z.A.; Alghassab, M.A. Decarbonizing Telecommunication Sector: Techno-Economic Assessment and Optimization of PV Integration in Base Transceiver Stations in Telecom Sector Spreading across Various Geographically Regions. Energies 2023, 16, 3800. [Google Scholar] [CrossRef]
- Sharma, S.; Sood, Y.R.; Kumar, S.; Kumar, V. Renewable based techno-economic analysis for telecommunication system: A case study of western Himalaya. Wind. Eng. 2023, 47, 897–912. [Google Scholar] [CrossRef]
- Tchike, S.M.; Zogbochi, V.; Chetangny, P.K.; Hounnou, H.J.; Aredjodoun, J.; Houndedako, S.; Barbier, G.; Chamagne, D.; Vianou, A. Techno-Economic and Environmental Analysis of the Integration of Renewable Energies in the Power Supply of BTS Sites Using the Optimization Method: The Case of Solar PV in Benin. In Proceedings of the 2023 International Conference on Electrical, Computer and Energy Technologies (ICECET), Cape Town, South Africa, 16–17 November 2023; pp. 1–6. [Google Scholar]
- Issahaku, M.; Kemausuor, F. Techno-economic comparison of standalone solar PV and hybrid power systems for remote outdoor telecommunication sites in northern Ghana. Ghana J. Sci. Technol. Dev. 2022, 8, 1–23. [Google Scholar] [CrossRef]
- Rahaman, A.; Noor, K.N.; Abir, T.A.; Rana, S.; Ali, M. Design and Analysis of Sustainable Green Data Center with Hybrid Energy Sources. J. Power Energy Eng. 2021, 9, 76–88. [Google Scholar] [CrossRef]
- Okundamiya, M. Integration of photovoltaic and hydrogen fuel cell system for sustainable energy harvesting of a university ICT infrastructure with an irregular electric grid. Energy Convers. Manag. 2021, 250, 114928. [Google Scholar] [CrossRef]
- Okundamiya, M.S. Size optimization of a hybrid photovoltaic/fuel cell grid connected power system including hydrogen storage. Int. J. Hydrogen Energy 2020, 46, 30539–30546. [Google Scholar] [CrossRef]
- Babayomi, O.O.; Olubayo, B.; Denwigwe, I.H.; Somefun, T.E.; Adedoja, O.S.; Somefun, C.T.; Olukayode, K.; Attah, A. A review of renewable off-grid mini-grids in Sub-Saharan Africa. Front. Energy Res. 2023, 10, 1089025. [Google Scholar] [CrossRef]
- Panbechi, B.; Hajinezhad, A.; Moosavian, S.F.; Fattahi, R. Enhancing the enviro-economic viability of biogas-solar hybrid systems: Strategies for sustainable energy development in Iran. Energy Strategy Rev. 2025, 58, 101671. [Google Scholar] [CrossRef]
- Emezirinwune, M.U.; Adejumobi, I.A.; Adebisi, O.I.; Akinboro, F.G. Off-grid PV/biomass/DG/battery hybrid renewable energy as a source of electricity for a farm facility. e-Prime Adv. Electr. Eng. Electron. Energy 2024, 10, 100808. [Google Scholar] [CrossRef]
- Bahramara, S.; Moghaddam, M.P.; Haghifam, M.R. Optimal planning of hybrid renewable energy systems using HOMER: A review. Renew. Sustain. Energy Rev. 2016, 62, 609–620. [Google Scholar] [CrossRef]
- Olatomiwa, L. Optimal configuration assessments of hybrid renewable power supply for rural healthcare facilities. Energy Rep. 2016, 2, 141–146. [Google Scholar] [CrossRef]
- Akinyele, D. Analysis of photovoltaic mini-grid systems for remote locations: A techno-economic approach. Int. J. Energy Res. 2017, 42, 1363–1380. [Google Scholar] [CrossRef]
- Khare, V.; Nema, S.; Baredar, P. Optimization of hydrogen based hybrid renewable energy system using HOMER, BB-BC and GAMBIT. Int. J. Hydrogen Energy 2016, 41, 16743–16751. [Google Scholar] [CrossRef]
- Rad MA, V.; Toopshekan, A.; Rahdan, P.; Kasaeian, A.; Mahian, O. A comprehensive study of tech-no-economic and environmental features of different solar tracking systems for residential photovoltaic installations. Renew. Sustain. Energy Rev. 2020, 129, 109923. [Google Scholar]
- Fahad, H.M.; Islam, A.; Islam, M.; Hasan, F.; Brishty, W.F.; Rahman, M. Comparative Analysis of Dual and Single Axis Solar Tracking System Considering Cloud Cover. In Proceedings of the International Conference on Energy and Power Engineering (ICEPE), Dhaka, Bangladesh, 14–16 March 2019. [Google Scholar]
- Babatunde, O.; Munda, J.; Hamam, Y. Off-grid hybrid photovoltaic–micro wind turbine renewable energy system with hydrogen and battery storage: Effects of sun tracking technologies. Energy Convers. Manag. 2022, 255, 115335. [Google Scholar] [CrossRef]
- Hafez, A.Z.; Yousef, A.M.; Harag, N.M. Solar tracking systems: Technologies and trackers drive types—A review. Renew. Sustain. Energy Rev. 2018, 91, 754–782. [Google Scholar] [CrossRef]
- Elizabeth, D.; Moses, O.; Olusegun, T. Hybrid energy systems model with the inclusion of energy efficiency measures: A rural application perspective. Int. J. Energy Econ. Policy 2018, 8, 310–323. [Google Scholar]
- Babatunde, O.; Denwigwe, I.; Oyebode, O.; Ighravwe, D.; Ohiaeri, A.; Babatunde, D. Assessing the use of hybrid renewable energy system with battery storage for power generation in a University in Nigeria. Environ. Sci. Pollut. Res. 2021, 29, 4291–4310. [Google Scholar] [CrossRef] [PubMed]
- Iqbal, R.; Liu, Y.; Zeng, Y.; Zhang, Q.; Zeeshan, M. Comparative study based on techno-economics analysis of different shipboard microgrid systems comprising PV/wind/fuel cell/battery/diesel generator with two battery technologies: A step toward green maritime transportation. Renew. Energy 2024, 221, 119670. [Google Scholar] [CrossRef]
- Babatunde, O.; Munda, J.; Hamam, Y. Hybridized off-grid fuel cell/wind/solar PV /battery for energy generation in a small household: A multi-criteria perspective. Int. J. Hydrogen Energy 2022, 47, 6437–6452. [Google Scholar] [CrossRef]
- Dehshiri, S.S.H.; Firoozabadi, B. Comparison, evaluation and prioritization of solar photovoltaic tracking systems using multi criteria decision making methods. Sustain. Energy Technol. Assess. 2022, 55, 102989. [Google Scholar] [CrossRef]
- Available online: https://power.larc.nasa.gov/ (accessed on 1 May 2024).
- Abdulsalam, K.A.; Adebisi, J.; Emezirinwune, M.; Babatunde, O. An overview and multicriteria analysis of communication technologies for smart grid applications. e-Prime Adv. Electr. Eng. Electron. Energy 2023, 3, 100121. [Google Scholar] [CrossRef]
- Hatefi, S.M.; Asadi, H.; Shams, G.; Tamošaitienė, J.; Turskis, Z. Model for the Sustainable Material Selection by Applying Integrated Dempster-Shafer Evidence Theory and Additive Ratio Assessment (ARAS) Method. Sustainability 2021, 13, 10438. [Google Scholar] [CrossRef]
- Chakraborty, S.; Datta, H.N.; Kalita, K.; Chakraborty, S. A narrative review of multi-objective optimization on the basis of ratio analysis (MOORA) method in decision making. Opsearch 2023, 60, 1844–1887. [Google Scholar] [CrossRef]
- Keshavarz Ghorabaee, M.; Zavadskas, E.K.; Turskis, Z.; Antucheviciene, J. A new combinative distance-based assessment (CODAS) method for multi-criteria decision-making. Econ. Comput. Econ. Cybern. Stud. Res. 2016, 50, 20–44. [Google Scholar]
- Liu, N.; Xu, Z. An overview of ARAS method: Theory development, application extension, and future challenge. Int. J. Intell. Syst. 2021, 36, 3524–3565. [Google Scholar] [CrossRef]
- Mitra, A. Selection of Cotton Fabrics Using EDAS Method. J. Nat. Fibers 2020, 19, 2706–2718. [Google Scholar] [CrossRef]


| References | Methodology | Purpose | Findings |
|---|---|---|---|
| [14] | Optimization Model | Optimum design of a hybrid power system (wind/PV/fuel cell/hydrogen energy/grid) for deployment of modern cellular mobile infrastructure in the fifth-generation era | The power supply’s renewable component is 98.8%, priced at AUD 0.03602 per kilowatt-hour (kWh). Additionally, energy expenditures are significantly reduced by 91.5%, resulting in an annualized return on investment of 43.9%. These favorable conditions make it feasible to enhance the reliability of the fluctuating power supply, achieving an amortization period of less than three years. |
| [15] | Techno-economic optimization using HOMER Pro | To provide a comprehensive 3E (Technical, Economic, Environmental) analysis of renewable-dominated hybrid standalone systems for decarbonizing the telecom sector in Pakistan and to evaluate the optimal energy configurations for BTS sites. | Different configurations were optimal depending on the site location; PV–battery–DG systems were most common, with others integrating wind, hydro, and biomass sources. LCOE ranged from 0.04547 to 0.2325 AUD/kWh. Hybrid systems have proven to be more cost-effective and sustainable than diesel-only solutions. |
| [16] | Hybrid energy system design | Development of a hybrid (PV/fuel cell) power system for telecom base stations in Ghana to reduce LCOE and GHG emissions | It is economically feasible, with a levelized cost of energy (LCOE) of 0.222 AUD/kWh, which is lower than the 0.25 AUD/kWh for grid-connected systems. Additionally, the LCOE is 30% less expensive than a PV/battery/diesel hybrid system and 67% less expensive than the diesel power system at the site, resulting in lower CO2 emissions per year compared with the diesel power system. |
| [17] | Hybrid optimization modeling using HOMER Pro | To propose and evaluate a hybrid solar/hydroenergy system with hydrogen storage for powering a remote BTS site in Nigeria. | The hybrid system achieved lower NPC (AUD 843,530), LCOE (AUD 0.4516), and operating costs (AUD 14,798) than the diesel system. It also reduced GHG emissions by 65,430 kg/year. |
| [18] | Simulation Model | An analysis of the PV/H/FC hybrid system’s techno-economic viability for supplying base stations in the development of green mobile communications aimed at curbing environmental deterioration and averting fossil fuel crises | The hybrid system maintained a higher quality of service (QoS) while generating approximately 17% more electricity than required, thereby enhancing system reliability. |
| [19] | Cost and energy management techniques | Comparison analysis of hydrogen-powered and traditional data centers with different backup power systems in China | A hydrogen-powered data center might be cost-effective if hydrogen could be produced from natural gas or H2-rich industrial water streams in chemical plants. Additionally, having a data center near hydrogen sources is advantageous. |
| [20] | Optimization Model | Design of reliable power system with integration of fuel cell for powering data center (computer servers and associated power control equipment and distribution network, chillers, and lighting) | Achieved reliable and sustainable power supply that is carbon-free. |
| [21] | Techno-economic assessment using HOMER software | To decarbonize the telecom sector by integrating photovoltaic systems into BTS infrastructure and assess their financial and environmental viability across different power-outage scenarios in Pakistan | PV–DG–battery hybrid systems reduced average LCOE by 29%, DG operational hours by 82%, and carbon emissions by 92%. Demonstrated significant improvements in operational cost and sustainability for BTS sites using solar PV systems. |
| [22] | Simulation model | Assessment of the techno-economic analysis of hybrid-renewable powered telecom tower in India | After government policy intervention, subsidies on the renewable energy system component reduced the energy cost from AUD 0.256/kWh to AUD 0.167/kWh compared with the diesel-powered system. |
| [23] | HOMER software | To assess the techno-economic and environmental benefits of integrating solar PV into BTS power supply systems in Benin | Solar integration reduced LCOE by 61.26–67.77% (off-grid) and 40.27–43.85% (on-grid), NPC by 61.24–67.71% (off-grid) and 26.77–31.34% (on-grid), and GHG emissions by over 94%. |
| [24] | Hybrid renewable system and comparative study | Comparison of independent solar photovoltaic and hybrid power systems for Northern Ghanaian distant outdoor communication sites | The PV/battery hybrid system is economically preferred to conventional diesel generators (DGs). It has lower environmental pollution and significantly reduced maintenance costs compared with conventional energy systems. |
| [25] | Simulation model | Development of hybrid energy supply for powering green data centers (GDCs) to achieve minimum net system cost and mitigate emission of greenhouse gases (GHGs) | The designed hybrid system for a new generation green data center (GDC) reduced the cost of electricity (COE) while offering preferred quality of service (QoS). The cost assessment and energy evaluation validated the system’s eco-friendly implications. |
| [26] | Simulation model | Techno-economic analysis of a hybrid system for powering ICT building | The findings demonstrate that the hybrid power system can efficiently and sustainably improve the current unreliable power supply. |
| [27] | Optimization model | Optimal hybrid power system sizing to meet the load requirements of a university laboratory in Nigeria. | The hybridized power system has the potential to reduce energy costs by more than 88% and achieve a return on investment of 41.3% in three years. In addition, using an appropriately sized hybrid system can reduce rural–urban migration and may improve the nation’s economic growth. |
| Component Parameter | Rated Capacity | Capital Cost (USD) | Replacement Cost (USD) | O and M Cost | Lifespan |
|---|---|---|---|---|---|
| Battery | 12 V, 200 Ah | 357 | 350 | USD 1.5/yr | 4 yrs |
| Fuel cell | 1 kW | 4000 | 3000 | USD 0.01/h | 40,000 h |
| Electrolyzer | 8 kW | 2700 | 2700 | USD 3/yr | 15 yrs |
| Hydrogen tank | 8 kg | 3100 | 3100 | USD 4/yr | 25 yrs |
| Converter | 1 kW | 37 | 36 | USD 2/yr | 10 yrs |
| Solar PV and Sun-Tracking Technologies | |||||
| NT | 0.25 kW | 295 | 290 | USD 0/yr | 20 yrs |
| MAHA | 0.25 kW | 435.75 | 413.96 | 3.26 | 20 yrs |
| WAHA | 0.25 kW | 435.75 | 413.96 | 3.26 | 20 yrs |
| DAHA | 0.25 kW | 435.75 | 413.96 | 3.26 | 20 yrs |
| CAHA | 0.25 kW | 512.5 | 486.87 | 3.84 | 20 yrs |
| CAVA | 0.25 kW | 407.5 | 387.12 | 3.05 | 20 yrs |
| DACA | 0.25 kW | 545 | 517.75 | 4.08 | 20 yrs |
| Configuration | Rank | PV (kW) | FC (kW) | Battery (no) | Converter (kW) | Electrolyzer (kW) | H2 Tank (kg) | Dispatch Strategy | PV Production (kWh/yr) | FC Production (kWh/yr) | Tot. Electrical Production (kWh/yr) | Cap. Shortage (kWh/yr) | Unmet Load (kWh/yr) | Excess Electricity (kWh/yr) |
|---|---|---|---|---|---|---|---|---|---|---|---|---|---|---|
| NT | 1 | 150 | 50 | 70 | 50 | 80 | 100 | LF | 223,954 | 21,868 | 245,822 | 1239 | 1078 | 36,413 |
| 2 | 200 | 50 | 0 | 50 | 80 | 100 | CC | 298,605 | 31,870 | 330,475 | 97 | 86 | 96,986 | |
| CAHA | 1 | 150 | 50 | 60 | 50 | 80 | 100 | CC | 238,897 | 23,521 | 262,418 | 414 | 364 | 47,666 |
| 2 | 150 | 50 | 0 | 50 | 80 | 120 | CC | 238,897 | 33,569 | 272,466 | 1422 | 1239 | 34,891 | |
| CAVA | 1 | 150 | 50 | 60 | 50 | 80 | 100 | CC | 232,127 | 24,323 | 256,450 | 104 | 91 | 39,256 |
| 2 | 150 | 50 | 0 | 50 | 80 | 100 | CC | 232,127 | 34,733 | 266,860 | 711 | 624 | 26,421 | |
| DACA | 1 | 120 | 50 | 80 | 50 | 80 | 150 | LF | 225,024 | 23,233 | 248,257 | 1391 | 1224 | 33,294 |
| 2 | 200 | 50 | 0 | 50 | 80 | 120 | CC | 375,040 | 30,348 | 405,388 | 79 | 68 | 175,084 | |
| DAHA | 1 | 150 | 50 | 60 | 50 | 80 | 100 | CC | 235,549 | 23,770 | 259,319 | 820 | 722 | 44,276 |
| 2 | 150 | 50 | 0 | 50 | 80 | 150 | CC | 235,549 | 34,243 | 269,792 | 1252 | 1086 | 28,993 | |
| MAHA | 1 | 150 | 50 | 70 | 50 | 80 | 100 | LF | 223,954 | 21,868 | 245,822 | 1239 | 1078 | 36,413 |
| 2 | 200 | 50 | 0 | 50 | 80 | 100 | CC | 298,605 | 31,870 | 330,475 | 97 | 86 | 96,986 | |
| WAHA | 1 | 150 | 50 | 60 | 50 | 80 | 100 | CC | 225,323 | 24,383 | 249,705 | 711 | 625 | 32,890 |
| 2 | 150 | 50 | 0 | 50 | 80 | 150 | CC | 225,323 | 34,884 | 260,207 | 1199 | 1044 | 17,742 |
| Battery Storage | |||||||
| System Variables | NT | CAHA | CAVA | DACA | DAHA | MAHA | WAHA |
| Usable nominal capacity (kWh) | 101 | 86.4 | 88.4 | 115 | 86.4 | 101 | 86.4 |
| Storage depletion (kWh/yr) | 24 | 24 | 24 | 24 | 24 | 24 | 24 |
| Nominal capacity (kWh) | 168 | 144 | 144 | 192 | 144 | 168 | 144 |
| Losses (kWh/yr) | 3694 | 3683 | 3698 | 3687 | 3693 | 3694 | 3737 |
| Lifetime throughput (kWh) | 64,190 | 55,020 | 55,020 | 73,360 | 55,020 | 64,190 | 55,020 |
| Expected life (yr) | 3.83 | 3.29 | 3.28 | 4.39 | 3.29 | 3.83 | 3.25 |
| Energy out (kWh/yr) | 14,979 | 14,936 | 14,995 | 14,950 | 14,974 | 14,979 | 15,153 |
| Energy in (kWh/yr) | 18,697 | 18,643 | 18,718 | 18,661 | 18,691 | 18,697 | 18,914 |
| Battery wear cost (AUD/kWh) | 0.427 | 0.427 | 0.427 | 0.427 | 0.427 | 0.427 | 0.427 |
| Average energy cost (AUD/kWh) | 0 | 0 | 0 | 0 | 0 | 0 | 0 |
| Autonomy (hrs) | 6.8 | 5.82 | 5.82 | 7.7 | 5.82 | 6.8 | 5.82 |
| Annual throughput (kWh/yr) | 16,747 | 16,699 | 16,765 | 16,714 | 16,742 | 16,747 | 16,941 |
| Hydrogen tank storage | |||||||
| System variables | NT | CAHA | CAVA | DACA | DAHA | MAHA | WAHA |
| Hydrogen generation (kg/yr) | 1399 | 1499 | 1546 | 1526 | 1514 | 1399 | 1550 |
| Hydrogen consumption (kg/yr) | 1312 | 1441 | 1459 | 1394 | 1426 | 1312 | 1463 |
| Hydrogen autonomy (hours) | 225 | 225 | 225 | 337 | 225 | 225 | 225 |
| Rank | Total Capital Cost (USD) | Total NPC (USD) | Tot. Ann. Cap. Cost (USD/yr) | Tot. Ann. Repl. Cost (USD/yr) | Total O and M Cost (USD/yr) | Total Ann. Cost (USD/yr) | Operating Cost (USD/yr) | COE (AUD/kWh) | |
|---|---|---|---|---|---|---|---|---|---|
| NT | 1 | 419,590 | 575,616 | 18,864 | 6215 | 800 | 25,879 | 7015 | 0.201 |
| 2 | 453,600 | 907,033 | 20,393 | 17,522 | 2864 | 40,779 | 20,386 | 0.314 | |
| CAHA | 1 | 546,820 | 781,706 | 24,585 | 7404 | 3157 | 35,145 | 10,560 | 0.271 |
| 2 | 533,150 | 1,057,168 | 23,970 | 18,271 | 5288 | 47,529 | 23,559 | 0.369 | |
| CAVA | 1 | 483,220 | 694,872 | 21,725 | 6906 | 2610 | 31,241 | 9516 | 0.241 |
| 2 | 461,800 | 968,595 | 20,762 | 18,020 | 4765 | 43,547 | 22,785 | 0.337 | |
| DACA | 1 | 527,135 | 745,770 | 23,700 | 7042 | 2788 | 33,529 | 9830 | 0.26 |
| 2 | 661,350 | 1,214,410 | 29,734 | 18,869 | 5996 | 54,599 | 24,865 | 0.42 | |
| DAHA | 1 | 500,620 | 711,696 | 22,507 | 6935 | 2555 | 31,997 | 9490 | 0.248 |
| 2 | 498,575 | 1,003,577 | 22,415 | 17,978 | 4727 | 45,120 | 22,704 | 0.35 | |
| MAHA | 1 | 419,590 | 575,616 | 18,864 | 6215 | 800 | 25,879 | 7015 | 0.201 |
| 2 | 453,600 | 907,033 | 20,393 | 17,522 | 2864 | 40,779 | 20,386 | 0.314 | |
| WAHA | 1 | 500,620 | 715,789 | 22,507 | 7105 | 2569 | 32,181 | 9674 | 0.249 |
| 2 | 498,575 | 1,008,428 | 22,415 | 18,171 | 4752 | 45,338 | 22,923 | 0.352 |
| Configuration | CODAS Score (Hi) | Rank | ARAS Score (KI) | Rank | EDAS Score (Asi) | Rank | MOORA (yi) | Rank |
|---|---|---|---|---|---|---|---|---|
| NT | −0.7350 | 5 | 0.1161 | 5 | 0.1535 | 5 | −4768.03 | 1 |
| CAHA | −0.0063 | 2 | 0.2736 | 2 | 0.7875 | 2 | −7805.81 | 6 |
| CAVA | 3.4251 | 1 | 0.9944 | 1 | 0.9995 | 1 | −6125.02 | 3 |
| DACA | −0.7939 | 7 | 0.1013 | 7 | 2.22 ×10⁻⁵ | 7 | −7992.55 | 7 |
| DAHA | −0.5641 | 4 | 0.1549 | 4 | 0.5163 | 4 | −6631.36 | 4 |
| MAHA | −0.7350 | 5 | 0.1161 | 5 | 0.1535 | 5 | −4768.03 | 1 |
| WAHA | −0.4798 | 3 | 0.1706 | 3 | 0.5848 | 3 | −6844.34 | 5 |
Disclaimer/Publisher’s Note: The statements, opinions and data contained in all publications are solely those of the individual author(s) and contributor(s) and not of MDPI and/or the editor(s). MDPI and/or the editor(s) disclaim responsibility for any injury to people or property resulting from any ideas, methods, instructions or products referred to in the content. |
© 2025 by the authors. Licensee MDPI, Basel, Switzerland. This article is an open access article distributed under the terms and conditions of the Creative Commons Attribution (CC BY) license (https://creativecommons.org/licenses/by/4.0/).
Share and Cite
Babatunde, O.; Adedoja, O.; Oyebode, O.; Kareem, U.A.; Babatunde, D.; Adedoja, T.; Akintayo, B.; Emezirinwune, M.; Ighravwe, D.E.; Ogunniran, O.; et al. Techno-Economic Optimization and Assessment of Solar Photovoltaic–Battery–Hydrogen Energy Systems with Solar Tracking for Powering ICT Facility. Resources 2025, 14, 74. https://doi.org/10.3390/resources14050074
Babatunde O, Adedoja O, Oyebode O, Kareem UA, Babatunde D, Adedoja T, Akintayo B, Emezirinwune M, Ighravwe DE, Ogunniran O, et al. Techno-Economic Optimization and Assessment of Solar Photovoltaic–Battery–Hydrogen Energy Systems with Solar Tracking for Powering ICT Facility. Resources. 2025; 14(5):74. https://doi.org/10.3390/resources14050074
Chicago/Turabian StyleBabatunde, Olubayo, Oluwaseye Adedoja, Oluwaseun Oyebode, Uthman Abiola Kareem, Damilola Babatunde, Toyosi Adedoja, Busola Akintayo, Michael Emezirinwune, Desmond Eseoghene Ighravwe, Olufemi Ogunniran, and et al. 2025. "Techno-Economic Optimization and Assessment of Solar Photovoltaic–Battery–Hydrogen Energy Systems with Solar Tracking for Powering ICT Facility" Resources 14, no. 5: 74. https://doi.org/10.3390/resources14050074
APA StyleBabatunde, O., Adedoja, O., Oyebode, O., Kareem, U. A., Babatunde, D., Adedoja, T., Akintayo, B., Emezirinwune, M., Ighravwe, D. E., Ogunniran, O., & Oludolapo, O. (2025). Techno-Economic Optimization and Assessment of Solar Photovoltaic–Battery–Hydrogen Energy Systems with Solar Tracking for Powering ICT Facility. Resources, 14(5), 74. https://doi.org/10.3390/resources14050074