Article

A Novel Set of Analysis Tools Integrated with the Energy Gap Method for Energy Accounting Center Diagnosis in Polymer Production

by
Omar Augusto Estrada-Ramírez
1,
Nicolás Andrés Muñoz-Realpe
1,
Julián Alberto Patiño-Murillo
1,* and
Farid Chejne
2
1
Instituto de Capacitación e Investigación del Plástico y del Caucho–ICIPC, Cra 49 #5 Sur 190, Medellín 050021, Colombia
2
Facultad de Minas, Universidad Nacional de Colombia, Av. 80 65-223, Medellín 050041, Colombia
*
Author to whom correspondence should be addressed.
Resources 2025, 14(4), 60; https://doi.org/10.3390/resources14040060
Submission received: 12 February 2025 / Revised: 14 March 2025 / Accepted: 21 March 2025 / Published: 2 April 2025
(This article belongs to the Special Issue Assessment and Optimization of Energy Efficiency)

Abstract

:
Energy and production efficiency are critical for achieving sustainability and competitiveness in polymer processing plants. A system with high energy efficiency and performance enhances productivity while reducing greenhouse gas emissions. While Monitoring and Targeting (M&T) methodologies are widely used for energy control in Energy Accounting Centers (EACs), they do not provide a diagnostic framework. The Energy Gap Method (EGM), introduced in 2018, addresses this gap by identifying the origin and magnitude of energy inefficiencies through a hierarchical model that defines six levels of specific energy consumption (SEC). Inspired by M&T strategies, the EGM has led to the development of diagnostic tools, including the Performance Characteristic Line for Diagnostics (PCLD), the Activity-Based Target from Diagnostics (ABTD), and the Performance Characteristic Curve for Diagnostics (PCCD). These tools enable manufacturers to determine optimal production batch sizes, establish minimum productivity requirements, identify molds and product references requiring intervention, and support the design of energy-efficient components. By integrating these tools, manufacturers can optimize energy consumption, achieve cost savings, and enhance environmental sustainability. This paper presents the methodology and two case studies demonstrating the analytical capabilities of the developed tools in improving energy efficiency within polymer production processes.

1. Introduction

Energy efficiency is a critical aspect of the manufacturing industry that increases competitiveness and reduces environmental impact [1,2]. Within the scenarios considered by the International Energy Agency (IEA), it is expected that energy efficiency will contribute to the most significant savings for the achievement of the goals of the reduction in greenhouse gas (GHG) emissions [3]. For this reason, energy efficiency has been called the fifth fuel [4]. At the business level, energy efficiency makes business sense for the industry. In the polymer processing industry, energy is estimated to account for a significant proportion of total operating costs, ranging from 4% to 10% [5]. A 20% reduction in specific energy consumption ( S E C ) could translate into a 2% increase in operating profit [6].
Energy efficiency’s tremendous economic and environmental advantages have been recognized internationally and constitute a fundamental aspect of the search for sustainable manufacturing [7,8,9]. However, experience shows that the level of investment in energy savings and efficiency in Small and Medium Enterprises (SMEs) does not reach the levels that correspond to these advantages, so the full potential for improvement is not realized. This phenomenon is referred to in the economic literature as the “energy efficiency paradox” [10]. A study among 280 SMEs in Europe establishes that they only achieve 10% to 25% of the energy-saving potential. Some non-financial practical barriers identified that explain this result are: the existence of limited internal skills, lack of experience in identifying and implementing energy-saving projects, difficulty in gathering external skills, lack of time, lack of information and confidence in information sources, challenges in adopting external trained consultants for the implementation of the required interventions, and non-use of state-of-the-art sensors and meters to monitor and control their energy consumption [11].
Audit programs do not automatically lead to high adoption rates of energy efficiency improvement measures. Adoption rates were found to be between 40% and 50% and include measures in space heating, ventilation, lighting, motors, air compressors, steam, or heat recovery, but with little intervention of the processes characteristic of the type of industry [12]. This is especially critical in polymer processing, where it is widely documented that the primary energy consumers are the specific processing steps that represent between 60% and 70% of the consumption [13]. This implies that to achieve more significant impacts, specialized knowledge of the processes and technologies for transforming plastics and rubbers is necessary.
In the field of information measurement and analysis, studies such as those by Diaz et al. [14], Ma et al. [15], and El Maraghy et al. [16] highlight the importance of energy monitoring of production processes as a key tool in the identification of energy improvements and the success of energy management systems. This is favored by the increasing adoption of Industry 4.0 technologies, which makes it possible to monitor energy consumption in polymer processing plants. These have become increasingly accessible technologies in terms of availability and cost [6], increasing the opportunity to find processing equipment connected to energy demand monitoring systems and their production controlled through Enterprise Resource Planning (ERP) software [17].
Equally important as the measurement is the methodological approach. It is recommended that programs for efficient and rational energy use be implemented within the framework of an energy management system based on ISO 50001:2018 [18]. It has been reported that, with these systems, energy performance improvement rates close to 4.1% can be achieved in the initial year of implementation and an average of 3.4% during subsequent years [19]. ISO 50001:2018 provides a standardized framework based on the PDCA (Plan-Do-Check-Act) cycle for implementing energy management systems, providing a systematic and structured approach to identify, implement, and maintain energy efficiency measures [18]. In the same way, energy audits (EAs) emerge as an essential means of enhancing end-use energy consumption awareness and efficiency. They are an integral part of an energy management system. EAs allow us to assess the energy carriers consumed in a productive sector, offering insight into existing efficiency improvement opportunities [20].
The energy analysis or efficiency study is performed on an Energy Accounting Center (EAC). The EAC is a physical entity within the company where energy consumption [kWh] and compliant production [kg] can be measured, following the scheme shown in Figure 1. The EAC can be the whole company, the production plant, a section of the production plant, a production line, or a critical machinery component in the production line [21].
To increase the chances of success in energy management, it is necessary to achieve the commitment of top management, assess the state of maturity of the company in energy efficiency, and set goals for the development of that maturity. In addition, selecting and planning the EACs properly is necessary, including measuring and storing EAC data properly, analyzing the available data, and using validated methodologies with indicators and targets. Finally, it is required to integrate management systems, translate energy improvements into economic benefits for the company, learn to identify opportunities for improvement, and train and communicate [22]. It is also essential to develop, establish, and periodically evaluate energy performance indicators, which should be measurable, verifiable, and under the context of the organization [18]. Some of these indicators have been reviewed and documented by authors such as May et al. [23], who found that their use contributes to implementing effective actions to improve efficiency in production lines. Among those practical actions are the analysis of the performance of energy measurement systems, the comparison between industrial processes at national and sectoral levels, and the development of models for specific factories.
These energy management models can be as complex as prediction consumption models based on time series analysis [24] or analysis and prediction of industrial energy consumption behavior based on big data and artificial intelligence [25]. In this sense, Dakovic et al. [26] provide a comprehensive overview of machine learning applications for addressing energy-related challenges by exploring different energy types and energy reduction opportunities. They found that machine learning algorithms could improve energy efficiency significantly, but their use faces many challenges, such as the need for diverse datasets and interpretable models [26]. Despite these complex models and techniques, one of the most widely used indicators in energy management systems at industrial levels is specific energy consumption (SEC) [27]. SEC is helpful because of its ease of implementation and understanding, and it is calculated from the inputs and outputs of the EAC with Equation (1) [28]. SEC is the ratio between the energy consumption ( E a ) and the compliant production ( W c ) of the EAC during the same period of time [29,30].
S E C = E a [ k W h ] W c [ k g ]
According to Kara and Li [31], SEC reflects the total energy consumption of a unit process. On the other hand, Kent [32] and Lawrence et al. [33] show that SEC as an absolute value is not a good indicator of energy performance and that under this interpretation it can lead to erroneous conclusions and decisions. For an EAC with no significant change in the percentage of non-compliant production, a lower SEC indicates that the EAC is more energy efficient [34]. However, this does not necessarily imply that the same EAC has better energy performance at different production levels since the specific energy consumption is a function of compliant production [29]. Several works use SEC for energy efficiency analysis. Mahamud et al. [35] proposed a methodology based on SEC to assess energy efficiency at the factory level and establish reference points for benchmarking through regression analysis. Estrada et al. [21] proposed an SEC-based strategic decision-making methodology to enhance energy efficiency in polymer production. The study defines six distinct SEC levels and quantifies their differences as energy gaps.
For the implementation of energy management systems, the ISO 50001:2018 standard establishes the importance of periodic review and evaluation of the energy performance of processes [18] at defined times or when significant changes may affect consumption. The standard is not specific on how to carry out such reviews and evaluations. However, it implies the use of complementary methodologies for this purpose. Menghi et al. reviewed these methodologies and classified them into three groups [36]:
  • Group I—Energy analysis: This includes energy audit methods and tools. These provide tools for investigating and systematically analyzing the company’s energy consumers.
  • Group II—Energy assessment methods and tools: These make it possible to establish how energy is consumed within a production process and how this consumption is related to certain aspects of production, such as the technology used, manufacturing parameters, usage patterns, and production planning. In addition, they allow analysis of the effects on energy efficiency and environmental objectives.
  • Group III—Energy-saving measures: These include methods and tools to identify and evaluate improvement opportunities to reduce energy consumption and identify appropriate energy-saving actions by collecting relevant data and analyzing correlations between energy-saving opportunities, risks, and cost benefits.
The methodologies in the first and second groups perform what can be considered energy consumption control, while those in the third group are considered diagnostic methodologies. Monitoring and Targeting (M&T) [32] is a widely used methodology that is classified within energy assessment methods and tools (group II) and has been equally valued for use in both the plastics industry [32] and other industries [37]. With the information on energy consumption and production, M&T establishes a baseline to monitor and control energetic performance. According to ISO 50006:2023, this baseline is the quantitative reference against which changes in energy performance are compared for monitoring, evaluation, or determination of energy savings [38].
The Monitoring and Targeting (M&T) method offers the possibility to understand an EAC’s energy behavior and improve it, seeking to replicate the best energy behaviors of the EAC and avoiding actions that deteriorate its energy performance [29,39,40]. For this purpose, M&T offers control tools and periodic comparative analysis of energy consumption and production, such as the determination of the Performance Characteristic Line (PCL), the Activity-Based Target (ABT), the Performance Characteristic Curve (PCC), and the CUSUM diagrams [32,41]. These M&T tools are based on the fact that the energy consumption of any process has a fixed component and a variable component, just as in a linear equation [42]. The fixed component does not depend on the production carried out. It is associated with the conditions to maintain the process, the energy wasted due to consumption during product changes, constant energy losses, or similar aspects. On the other hand, the variable component depends on the amount of production, which is associated with energy to transform the raw material and can be represented as a constant unit consumption of energy per amount of product produced [43]. Several works report the use of M&T tools for energy efficiency analysis. Cosgrove et al. [39] employed an M&T hierarchical approach to analyze the energy efficiency of a productive process. They introduced an evaluation index system based on ISO 50001 [18], integrating a set of interlinked key performance indicators (KPIs) to assess the energy consumption of the studied process. Benedetti et al. [44] assessed the energy performance of manufacturing processes by evaluating selected indicators. These indices describe the different operational stages and characterize the subprocesses with the highest energy consumption. Taner et al. [45] performed an energy analysis of sugar production, employing statistical evaluation through CUSUM analysis. This approach allowed for identifying specific energy efficiency indices relevant to the sugar factory studied.
Table 1 compares reported energy analysis and assessment studies using SEC or M&T tools. While methodologies for controlling energy consumption are well established and widely used in energy management systems, there is a growing need for specialized and specific diagnostic methodologies. Despite advances in energy management strategies, significant gaps remain in translating energy monitoring data into actionable diagnostic insights for polymer processing industries. Specifically, the literature reveals three critical gaps: (1) existing methodologies often focus on monitoring energy consumption patterns without providing systematic frameworks for diagnosing the root causes of inefficiencies; (2) there is limited integration between energy management and production planning considerations, particularly for batch size optimization and product costing in polymer processing; and (3) practical tools that enable manufacturers to diagnose energy performance issues at multiple operational levels (machine, mold, and product reference) are scarce, especially for Small and Medium Enterprises.
To answer the identified needs, the required diagnostic techniques must go beyond simply monitoring and controlling energy use; they should delve deeper into identifying the root causes of inefficiencies, enabling targeted interventions and optimization strategies. This shift towards specialized diagnostics reflects the increasing complexity of energy systems and the demand for more granular and actionable insights to achieve higher levels of energy performance. This scientific article presents novel diagnostic tools linked to the Energy Gap Method to achieve this objective. Starting from the basis of the M&T approach, the proposed methodology introduces tools such as the Performance Characteristic Line for Diagnostics (PCLD), the Activity-Based Target from Diagnostics (ABTD), and the Performance Characteristic Curve for Diagnostics (PCCD) to determine energy gaps and detect production elements that require specific actions. Those elements are molds, references, materials, heads, and machines. Where M&T focuses on tracking energy consumption against production to identify deviations over time, the EGM introduces a hierarchical model of specific energy consumption levels by criteria that provide a diagnostic framework for identifying improvement opportunities in energy efficiency. The main contributions of this paper are as follows:
  • The introduction of novel analytical tools (PCLD, ABTD, and PCCD) to transform the Energy Gap Method from a theoretical framework into practical diagnostic instruments for polymer processing industries.
  • The proposed methodology enables the determination of optimal production batch sizes, minimum productivity requirements, and identification of critical molds for energy performance intervention.
  • Case studies demonstrate how energy diagnostic tools can guide production scheduling decisions and accurately allocate energy costs to specific products.
  • Integration of energy performance diagnosis with production planning enables manufacturers to optimize both economic and environmental aspects of polymer processing.
  • The diagnostic approach provides accessible decision-making tools for SMEs to overcome the “energy efficiency paradox” in polymer manufacturing.
The rest of this paper is organized as follows: Section 2 describes the methodological framework, beginning with an overview of the Energy Gap Method (EGM) and progressing to the novel analytical tools developed for energy performance diagnosis, namely the PCLD, the ABTD, and the PCCD. Section 3 includes two case studies demonstrating the practical use of these analytical techniques in polymer processing environments: an EPDM rubber profile extrusion line and a thermoplastic injection line. Section 4 compares the Energy Gap Method to the classic Monitoring and Targeting method, showing its complementary nature and differences. Finally, Section 5 concludes the work with a summary of significant findings, an acknowledgment of limitations, and suggestions for future research directions to improve energy performance diagnostics in manufacturing settings.

2. Materials and Methods

New methodologies and tools of energy consumption diagnostics are being developed for EAC diagnosis in polymer processing. With information from Industry 4.0 systems and automated calculation routines, industries can determine parameters such as total consumption and demand under stable or quasi-stable operating conditions of the EAC for each production order at any time. This information is the foundation of the new tools developed from the Energy Gap Method.

2.1. Energy Diagnostic Techniques: The Energy Gap Method (EGM)

The Energy Gap Method (EGM) [21] originally proposes the determination of six different levels of specific energy consumption, with which five energy gaps can be calculated as the difference between pairs of nearby SEC values, as shown in Figure 2. The six levels of specific energy consumption are, in order, as follows: the net specific energy consumption ( S E C n equivalent to the SEC presented in Equation (1)), the gross specific energy consumption ( S E C g ), the stable specific energy consumption ( S E C s ), the machine specific energy consumption ( S E C m ), the reference specific energy consumption ( S E C b ), and the thermodynamic specific energy consumption ( S E C t ). On the other hand, the energy gaps are as follows:
  • The production energy gap ( S E C n S E C g ): Represents the magnitude of energy inefficiency due to non-productive time.
  • Quality energy gap ( S E C g S E C s ): Represents the magnitude of energy inefficiency due to non-compliant product production.
  • Process energy gap ( S E C s S E C m ): Represents the magnitude of energy inefficiency due to operation under low energy efficient process conditions.
  • Technology energy gap ( S E C m S E C b ): Represents the magnitude of energy inefficiency due to the use of low energy efficient technology.
  • R&D energy gap ( S E C b S E C t ): Represents the magnitude of energy inefficiency due to the lack of better technologies.
Equations (2) and (3) describe the necessary conditions for the EGM:
S E C n S E C g S E C s S E C m S E C b S E C t
S E C n S E C t = E G p r o d u c t i o n + E G q u a l i t y + E G p r o c e s s + E G t e c h n o l o g y + E G R + D
Usually, the method prioritizes actions aimed at reducing the largest energy gap in the EAC. In the case of finding several energy gaps similar in magnitude, the reduction in the gap originated by the lowest SEC is favored [21], taking into account the necessary resources and payback analyses. Menghi et al. [36] classify the EGM within the group of Energy Evaluation Methods and Tools as a control method.

2.2. The New Analytical Tools of the Energy Gap Method

Inspired by M&T [46] strategies and tools, the Energy Gap Method (EGM) [21] has developed the Performance Characteristic Line for Diagnostics (PCLD), the Activity-Based Target for Diagnostics (ABTD), and the Performance Characteristic Curve for Diagnostics (PCCD) as analytics tools with the capacity to conduct the following:
  • Determine the minimum batch size per mold and per reference to optimize the energy performance and efficiency of the EAC.
  • Determine the base consumption per mold and per reference to establish opportunities for improvement during changeovers.
  • Determine the effective productivity per mold and per reference that is necessary to achieve adequate energy performance and efficiency of the EAC.
  • Compare the energy performance and efficiency of the EAC before and after implementing technological improvements to determine the feasibility and optimal conditions for replication.
  • Establish criteria for enhancing EAC energy performance and efficiency based on production schedules.
  • Accurately allocate energy costs to specific products to ensure that energy-efficient molds and references are not being burdened with the costs of less efficient ones.
These new analytical tools require the extraction of production, power demand, and energy consumption data for each production order within a defined analysis period. These data are then consolidated by machine, mold, or product reference, enabling a comprehensive view of energy performance at various levels. Consolidating the required energy information for each reference, mold, or machine can be complex due to the volume of data involved. Therefore, automated calculation routines are necessary to efficiently obtain the required values. The analysis period must be sufficiently long to ensure that the collected data are statistically representative, providing a robust foundation for valid and reliable insights. This rigorous approach ensures that the resulting analyses accurately reflect the energy dynamics of the system and support informed decision-making for improved energy performance and efficiency.
Power demand and energy consumption data can be acquired from the systems used to monitor each EAC. However, for diagnostic purposes, connecting the EAC to an energy consumption meter or demand monitor may be enough if sufficient production runs are captured to enrich the analysis. This complements the EGM tools and expands their potential as a diagnostic tool through a new way of tracking specific energy consumption (SEC).

2.2.1. Determining the Performance Characteristic Line for Diagnostics (PCLD) and the Activity-Based Target from Diagnostics (ABTD)

To determine the performance of S E C n , the first step is to obtain the Performance Characteristic Line for Diagnostics (PCLD). The most used method to model energy consumption against a variable is the regression analysis technique. This technique is useful for EACs when a single determining factor is the most influential in consumption. In these circumstances, a linear relationship is a good enough model. The R2, or coefficient of determination, is a measure that indicates the precision of a linear regression model [47]. In this case, energy consumption is correlated with the compliant production of the EAC, as shown in Figure 3. In the PCLD diagram, the correlation between the line equation and the actual points must have a value of 0.7 at least (coefficient of determination R2 ≥ 0.7) to be accepted as an adequate indicator for the selected criterion.
When the correlation is adequate, an expression like Equation (4) could be obtained as follows:
E n e r g y c o n s u m p t i o n k W h = a k W h k g · P r o d u c t i o n c o m p l i a n t k g + b [ k W h ]
where
  • a is the slope of the straight line, also known as the variable load, which is typically measured in [kWh/kg].
  • b is the intercept of the straight line, also known as base load, which is typically measured in [kWh].
The base load in this case represents energy consumption associated with changes in reference, mold, or machine, depending on whether the line is obtained by analyzing data for different references, molds, or machines. The points below the line exhibit better performance than the average, while those above indicate poorer performance. This transformation of the traditional PCL into a diagnostic tool highlights the enhanced analytical capabilities offered by the EGM framework. Therefore, within the novel tools for the EGM, it has been denominated the PCLD, or the Performance Characteristic Line for Diagnostics.

2.2.2. Determining the Activity-Based Target from Diagnostics (ABTD)

The PCLD represents the average behavior of consumption data against compliant production, according to the selected criterion. This implies that there are data above and others below PCLD. As previously established, the points above the average are the points in which there was a lower energy performance, and the points below indicate better use of energy resources. It is then possible to perform a new regression analysis with these last points, which provides an objective or a result, which would be the line achievable if actions are taken to promote superior energy performance of the points that are above the PCLD, as shown in Figure 3. This new line is called the Activity-Based Target from Diagnostics (ABTD). This line allows for the calculation of the improvements and savings expected from the intervention on the EAC if the actions on the low-performance points are effective.

2.3. Determining the Performance Characteristic Curve for Diagnostics (PCCD)

Equation (4) describes the behavior of the PCLD; it is possible to sense that the S E C n in the EAC also responds to a characteristic curve. By dividing Equation (4) by the compliant production, Equation (5) is obtained as follows:
S E C n k W h k g = a k W h k g + b [ k W h ] P r o d u c t i o n c o m p l i a n t k g
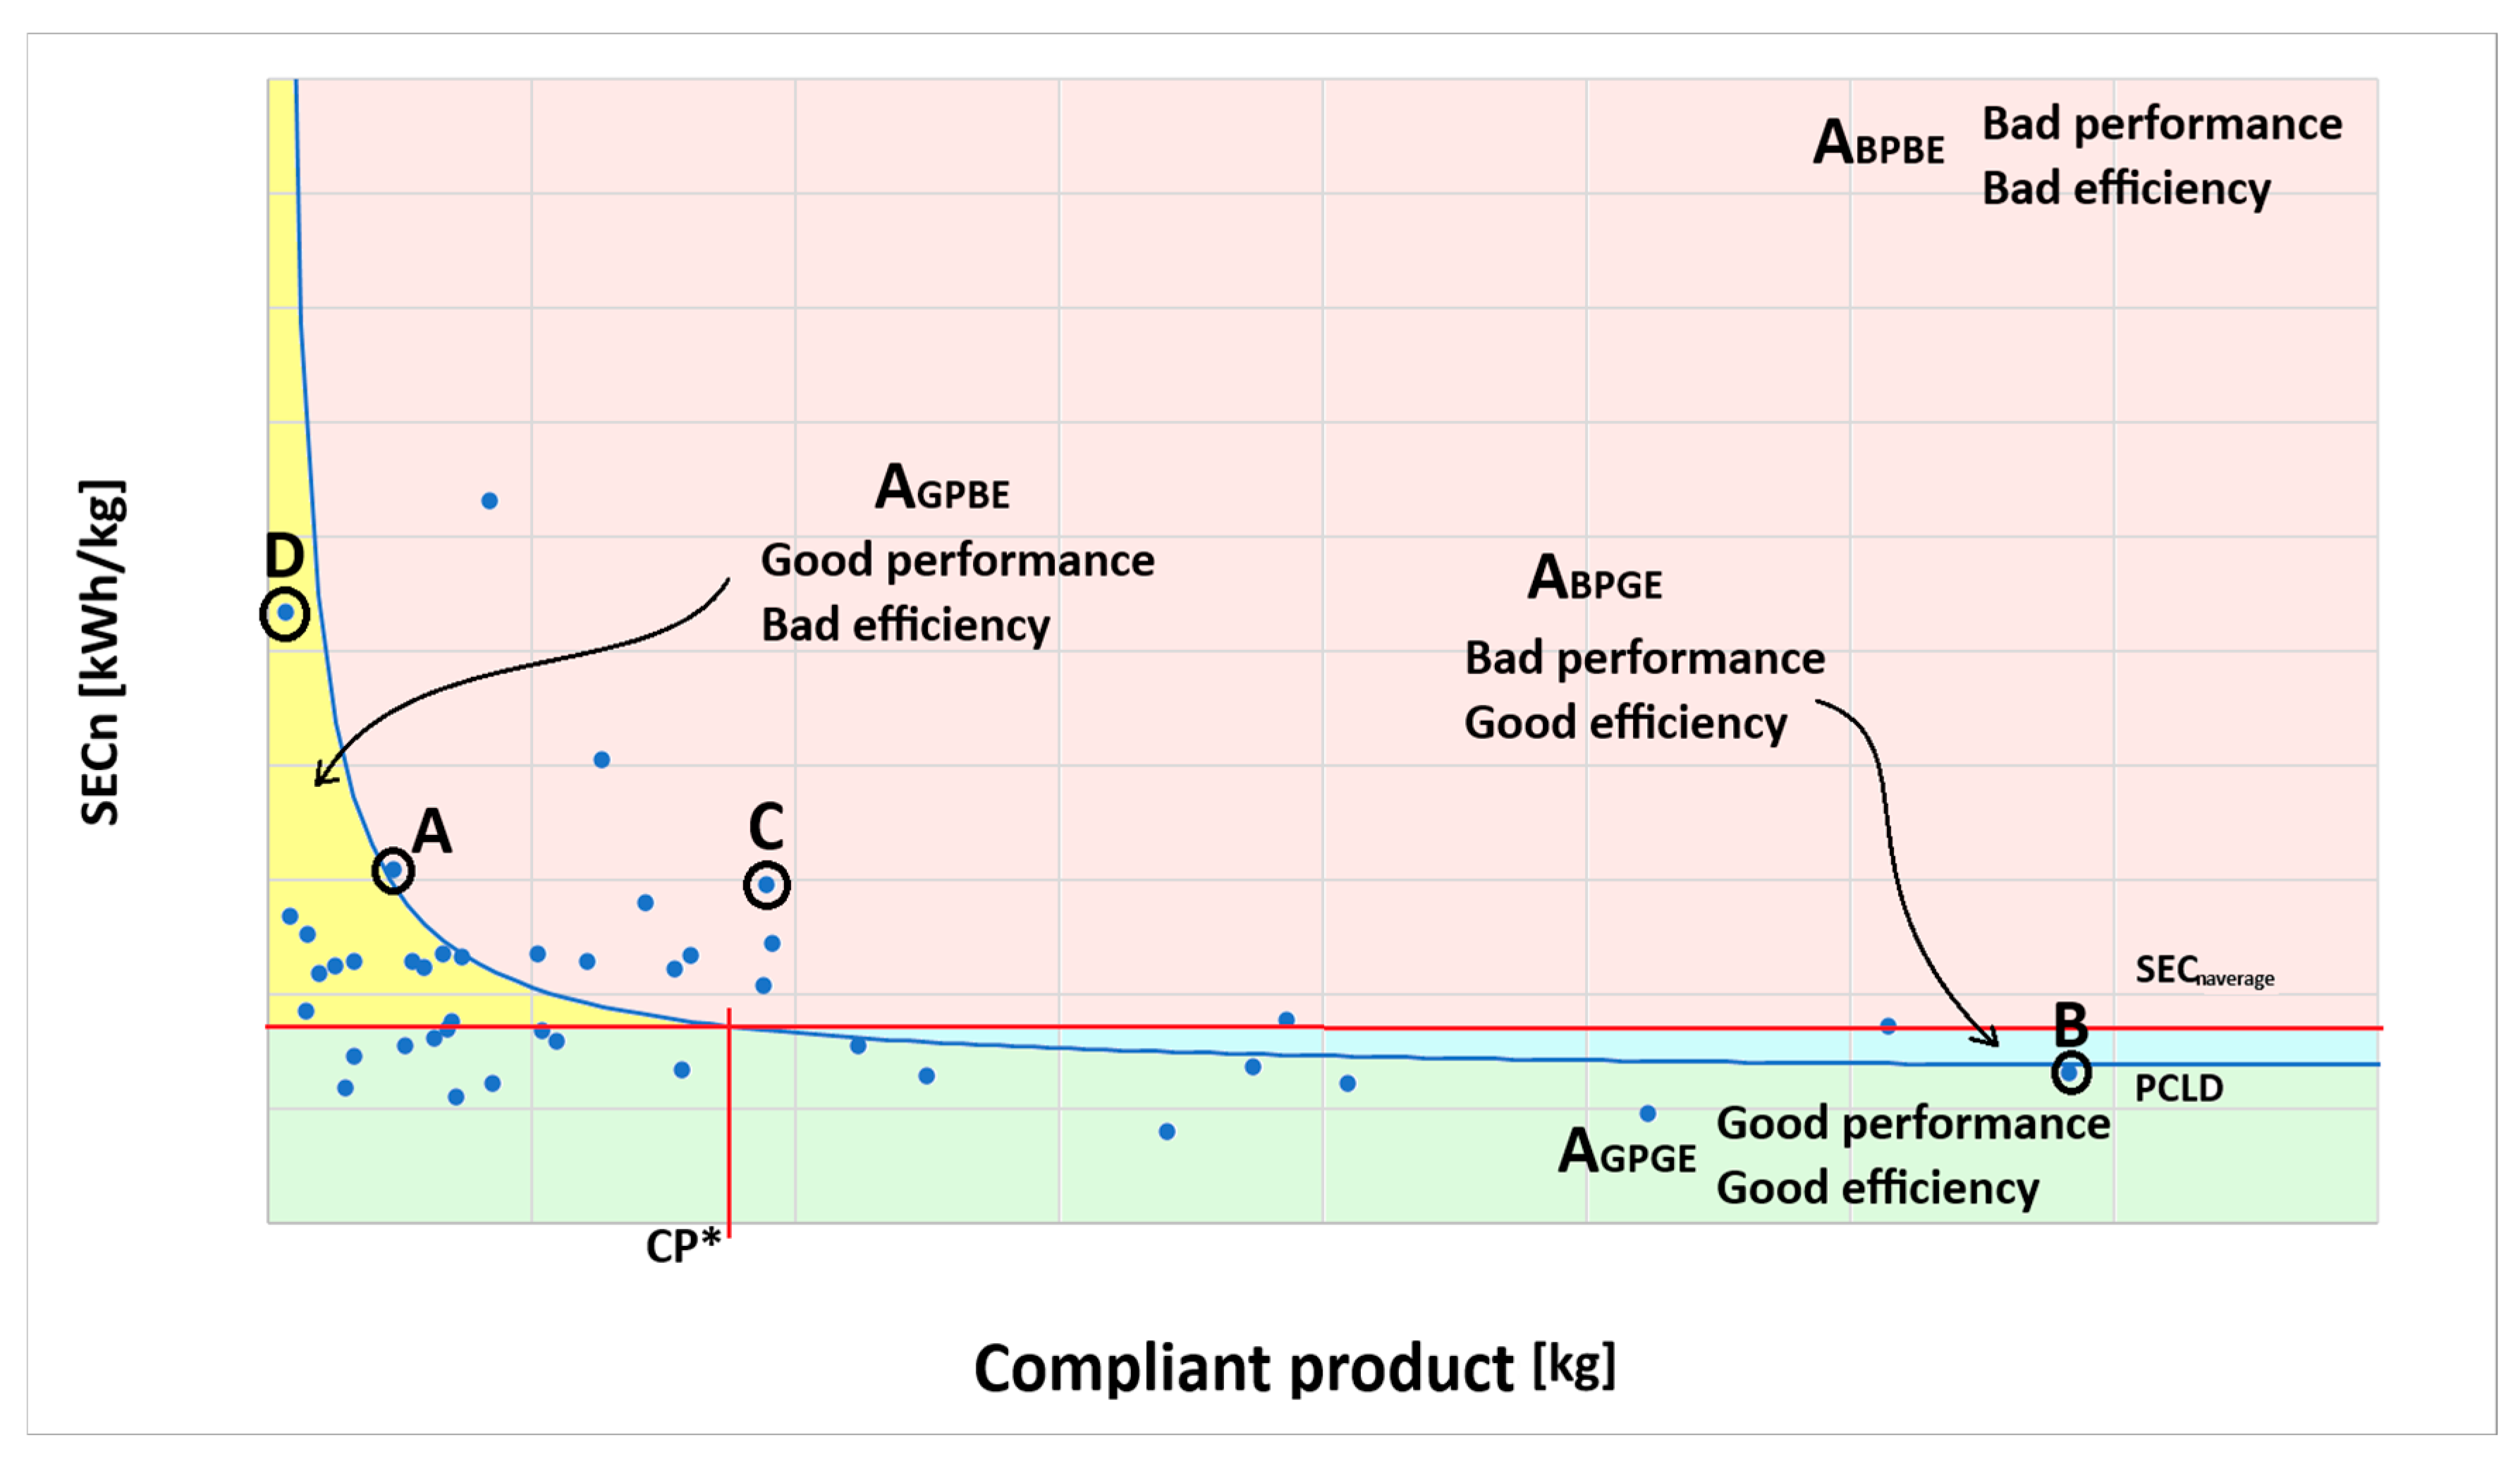
The curve from Equation (5) is denominated as the Performance Characteristic Curve for Diagnostics (PCCD) and it is obtained from the PCLD. The PCCD is represented in a SECn versus compliant production diagram as shown in Figure 4. Two lines are identified on the graph: the PCLD and a horizontal line corresponding to the average net specific consumption for the period under analysis ( S E C n a v e r a g e ). The S E C n a v e r a g e value is calculated as in Equation (6), where n is the number of references, molds, or machines analyzed, as follows:
S E C n a v e r a g e = i n E n e r g y c o n s u m p t i o n i i n P r o d u c t i o n c o m p l i a n t i
All the references, molds, or machines that are above the S E C n a v e r a g e line contribute to increasing the average value. On the contrary, all those below improve it. The intersection between S E C n a v e r a g e and the PCCD defines a compliant production value called C P * . This value represents the minimum lot size according to the selected criterion, from which energy efficiencies in the EAC equal or improve the S E C n a v e r a g e . On the other hand, the points (references, molds, or machines) that are above the PCCD exhibit poor energy performance compared to the average production behavior, while those below show a superior energy performance. Properly differentiating between energy efficiency and energy performance is crucial to properly addressing the actions required for improvement.
To deepen the concept of energy efficiency and performance, let us return to Figure 4. Understanding that the points represent references, molds, or machines, in this graph points A and B have the same energy performance because they are above the PCLD, but point B offers higher energy efficiency. Points A and C have similar energy efficiency, but point C has poorer energy performance because it is above the PCLD. An analysis solely considering S E C n would prioritize the intervention of point D over point C, as it has a lower energy efficiency. However, improving the energy efficiency of point D is just a matter of scheduling a larger batch. In contrast, improving the energy performance of point C requires a planned engineering intervention.
To expand on this analysis, Figure 4 presents the following four well-defined zones:
  • The red area above the line representing S E C n a v e r a g e and above the PCCD: This is an area where points exhibit poor energy performance and low energy efficiency and is called ABPBE. These are critical points whose improvement depends on radical engineering or production decisions. Improving them usually has a high associated cost.
  • The yellow area above the S E C n a v e r a g e value and below the PCCD: This area corresponds to points that have good energy performance, but low energy efficiency and the zone is called AGPBE. To improve these points, it is only required to increase the size of the production batches, preferably above CP*.
  • The blue area (ABPGE) that is above the PCCD and below the S E C n a v e r a g e value: The points that are in this area are not a priority, although it is very likely that during continuous improvement, there will come a time when a new diagnosis will make them points that merit intervention.
  • The green area below the PCCD and below the S E C n a v e r a g e value: This area is named AGPGE and has the points of good energy performance and good energy efficiency.
Considering that S E C n is the actual net specific energy consumption of point i, S E C n P C C D ( P r o d u c t i o n c o m p l i a n t i ) is the specific energy consumption evaluated through the PCCD at the compliant production value of point i, and S E C n a v e r a g e is the average specific energy consumption of the period under analysis, the following can be determined:
  • The points located in the ABPBE area meet the following conditions:
S E C n i S E C n P C C D P r o d u c t i o n c o m p l i a n t i > 0 S E C n i S E C n a v e r a g e > 0
The points located in the AGPBE area meet the following conditions:
S E C n i S E C n P C C D P r o d u c t i o n c o m p l i a n t i 0 S E C n i S E C n a v e r a g e > 0
The points located in the ABPGE area meet the following conditions:
S E C n i S E C n P C C D P r o d u c t i o n c o m p l i a n t i > 0 S E C n i S E C n a v e r a g e 0
The points located in the AGPGE area meet the following conditions:
S E C n i S E C n P C C D P r o d u c t i o n c o m p l i a n t i 0 S E C n i S E C n a v e r a g e 0
From this classification, the application of the gap calculation to each point of interest provides the necessary identification for prioritizing efforts and defining whether the problem should be addressed from production, quality, process, or technology. The PCCD can be used to make technological decisions and establish machines, molds, and/or critical references for intervention. The PCCD can also be employed to define minimum batch sizes to reduce the cost of products associated with the energy cost of production or, alternatively, to transfer the energy cost to the specific product that generates it.

2.4. Determination of SECs Using Diagnostic Tools

In the same way that the PCLD and PCCD are generated for S E C n determination, an analogous analysis can be performed for S E C s , which offers other equally important diagnostic elements. The difference is that S E C s is mass flow dependent. Therefore, what is plotted is the average demand under stable operating conditions against the mass flow.
Stable periods for calculating S E C s can be determined using an algorithm. This algorithm operates periodically, evaluating the data collected within a statistically considerable time interval. At each interval, it calculates the attenuated demand data’s standard deviation and checks the period’s stability. A period is considered stable if the standard deviation does not exceed a statistically representative percentage (a 5% threshold value) of the moving average of all stable intervals above the moving average of demand.
The equation of the energy Performance Characteristic Line under stable conditions has the following form:
A V G P o w e r d e m a n d k W = a · m ˙ k g h + b
In Equation (11), a denotes the variable load in kWh/kg and b is the fixed demand in kW. The latter represents the average demand of the EAC while waiting for a change in reference, mold, or machine. To accept the correlation as satisfactory, it is also valid here to watch for the coefficient of determination to be greater than 0.7. Although the information also allows the determination of an ABTD line for S E C s , this is of little use.
With the equations describing the behavior of S E C n and S E C s of the EAC and if an estimated S E C b is available for the type of technology used, there is enough information to define two combined energy gaps: the production + quality energy gap ( S E C n S E C s ) and the process + technology energy gap ( S E C s S E C b ). In this way, it is possible to establish how the EAC is expected to behave energetically from the moment the production order is assembled in the production schedule.
Another justification is that it is possible to determine the minimum mass flow ( m ˙ * ) at which the EAC must work, as shown in Figure 4. If a horizontal line is drawn at the value of S E C s corresponding to S E C n a v e r a g e , it will cross the PCCD in m ˙ * . It is worth clarifying that, at this point, S E C n S E C s = 0 . Therefore, the value of m ˙ * is the mass flow value to have a stable specific energy consumption value, which does not allow downtime or energy waste in the making of non-compliant products. In this way, the average specific energy consumption does not increase for the period under analysis.
For all the above, it is evident that the determination of the PCCD for S E C n and S E C s has a high value for making decisions on production scheduling, product costing, and even the design and specification of references, molds, and machinery in a polymer processing plant.

3. Case Study: Diagnostics Using PCLD, ABTD, and PCCD Determinations

To illustrate the use of the tools described, a couple of cases will be described to better understand the implementation of the method.

3.1. EAC: EPDM Rubber Profile Extrusion Line

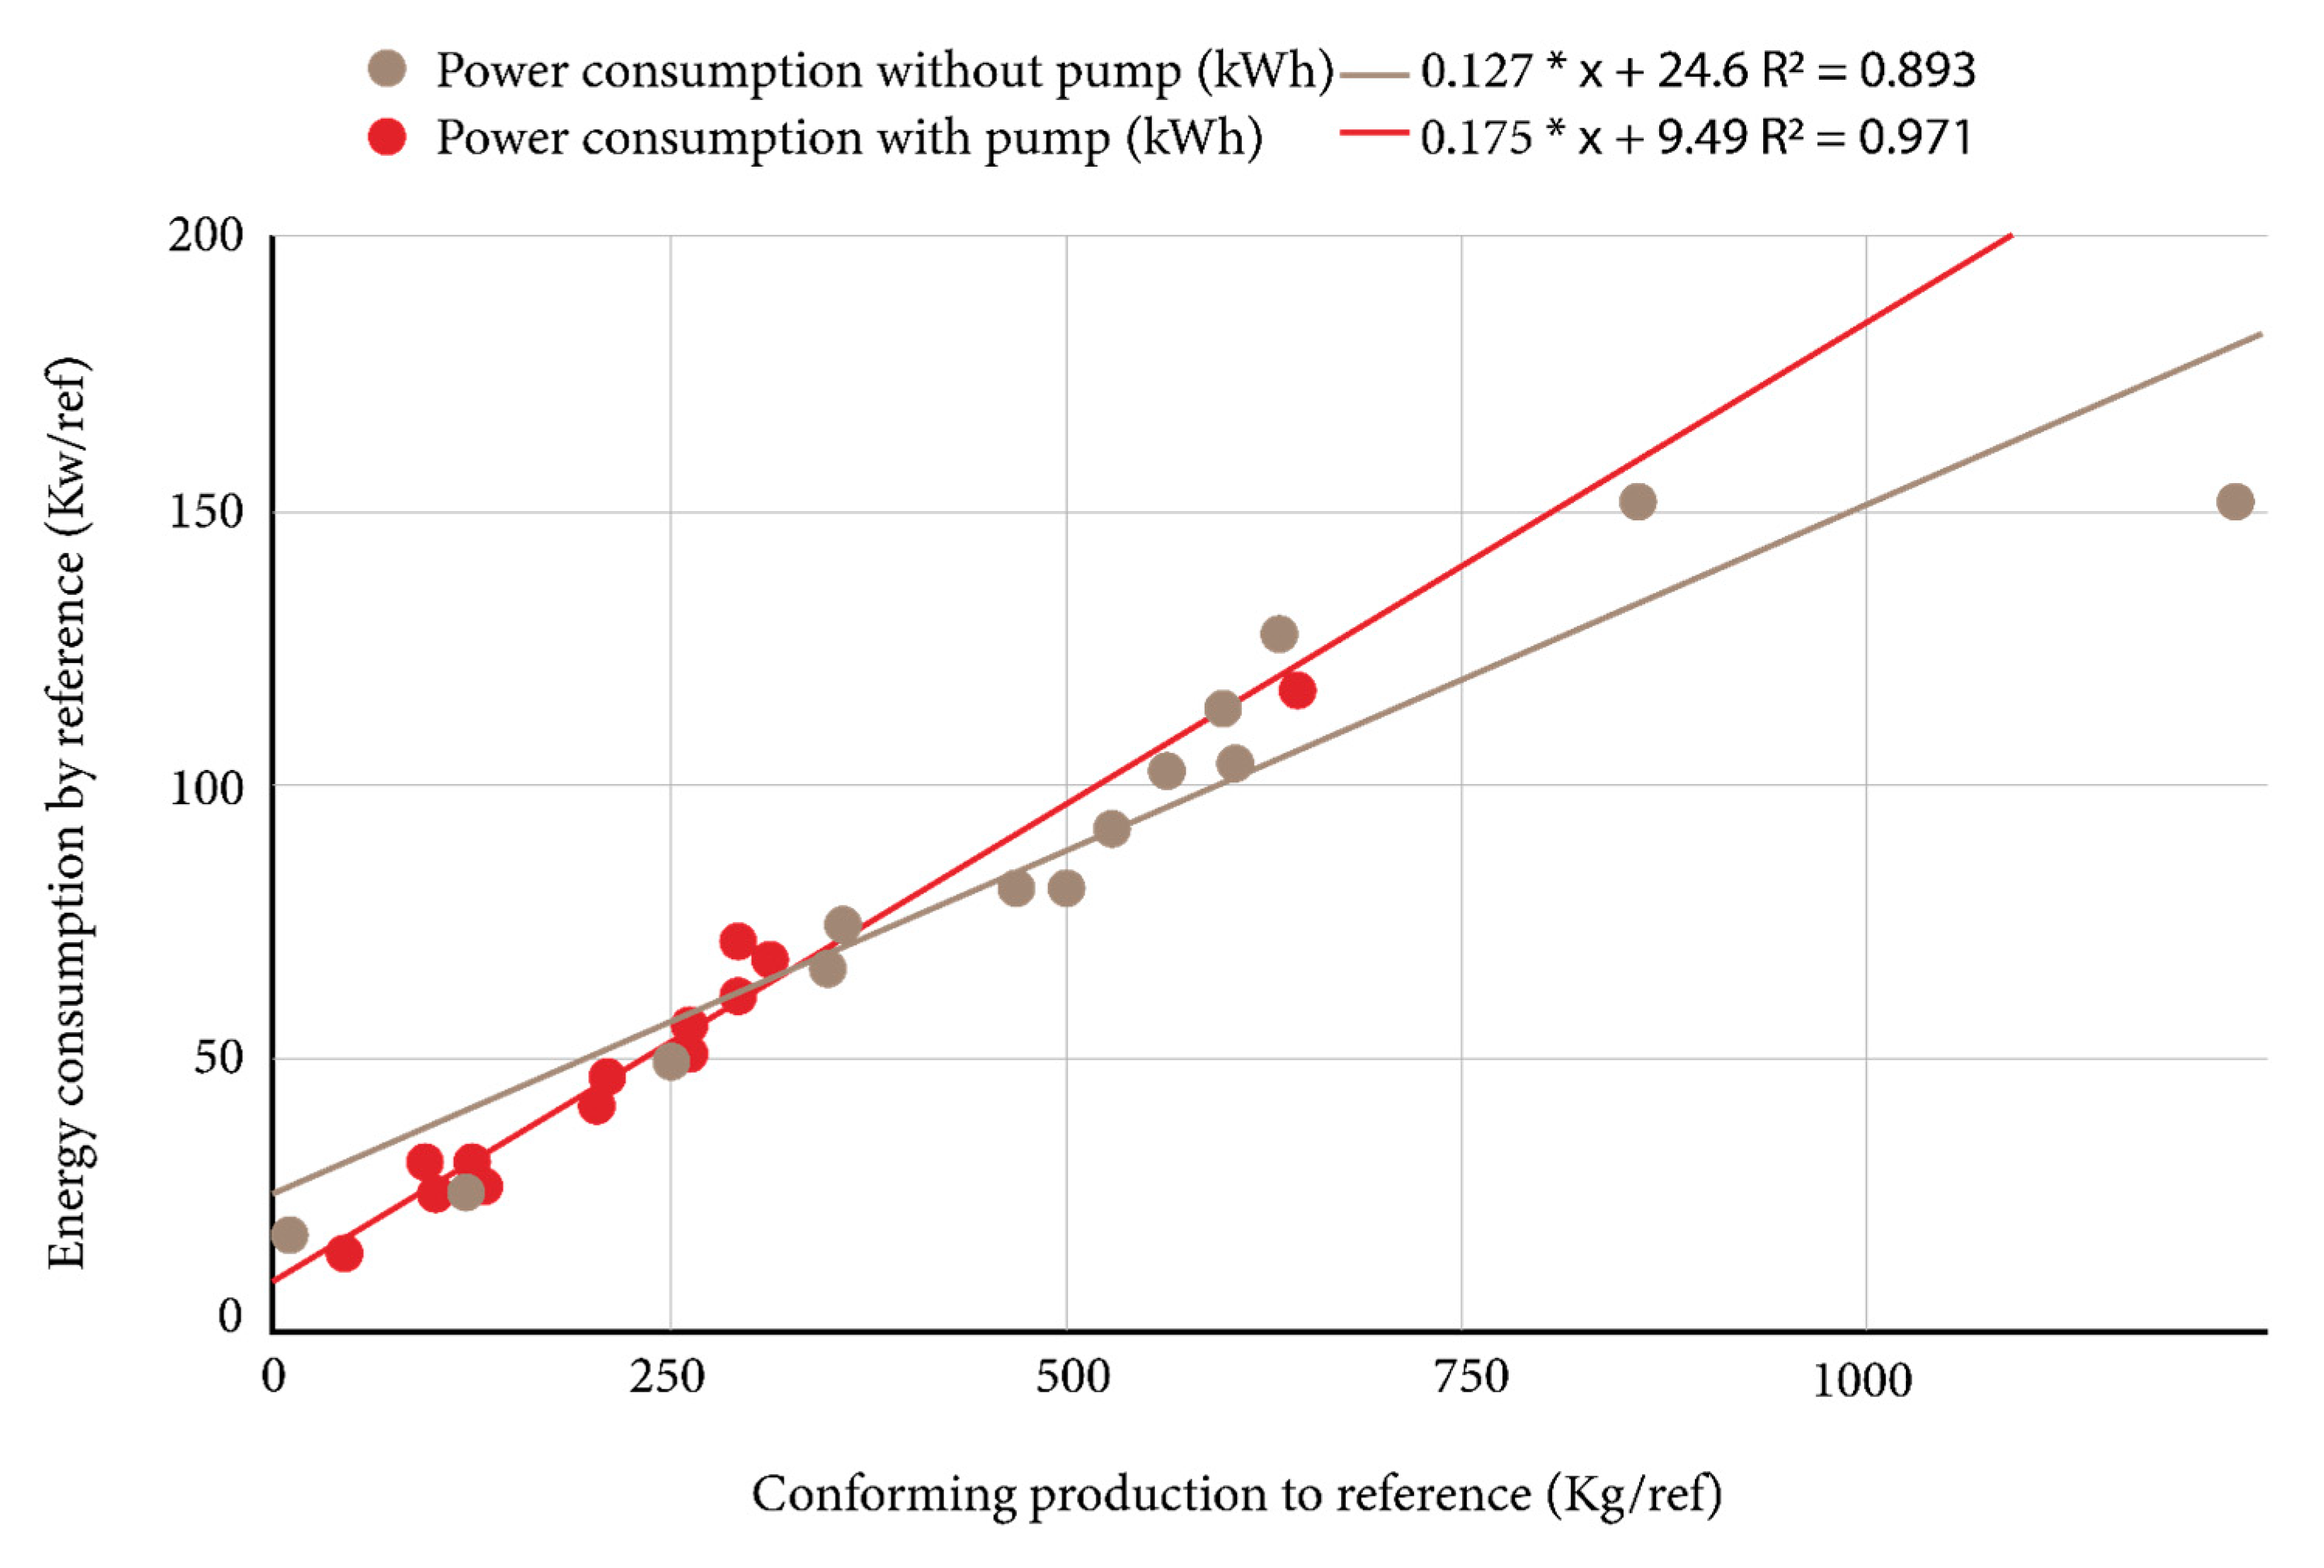
A company dedicated to the manufacture of vulcanized rubber profiles wanted to compare the energy performance of one of its extrusion lines when operating with and without a melt pump. To conduct this, a demand data acquisition system was connected to the line’s totalizer, which recorded information every minute. The data acquisition equipment was connected for 7 days in both cases. In each case, between 12 and 15 product references were produced during the measurement period. Therefore, an analysis was performed by plotting the energy consumption and compliant production of each reference during the measurement period. The data also allowed us to determine the PCLD, as shown in Figure 5.
The trend lines obtained are very representative of the process as both have a correlation coefficient higher than 0.7, with values of 0.971 with a melt pump and 0.893 without a melt pump. In Figure 5, there is a lower base load (9.49 kWh/ref vs. 24.6 kWh/ref) but a larger variable load (0.175 kWh/kg vs. 0.127 kWh/kg) when working with the pump. The lower fixed load means that the melt pump reduces energy consumption to keep the system available to operate during non-productive times. This occurs because it facilitates tuning, as it reaches stability faster during reference changes. On the other hand, the higher variable load is an indicator of reduced line efficiency with the presence of the melt pump. This makes sense since, under these conditions, the line has an additional consumer for similar production levels. However, the performance of the line can best be analyzed from the PCCD or S E C n vs. P r o d u c t i o n c o m p l i a n t diagram shown in Figure 6.
This trend line is important in providing a way of predicting how the production line will behave in terms of net specific energy consumption when production is increased accordingly. In Figure 6, both with and without a melt pump, the efficiency of the production line increases with increasing compliant production, as S E C n decreases with compliant production. On the other hand, the performance of the production line is superior when working with a melt pump, only when the batch size is less than approximately 300 kg. For higher batch sizes, the performance of the extrusion line without a melt pump is better since S E C n is lower for the same level of compliant production, and thus the energy efficiency is higher. This is precisely the meaning of better performance.
Another utility of Figure 6 is the determination of the minimum recommended batch size. When batch sizes are very small, S E C n increases dramatically. In the case of the production line without a pump, the minimum batch size would be approximately 250 kg/ref, while with a pump it could be approximately 125 kg/ref. In this case, the melt pump provides more flexibility for the company when it must deal with small productions. With productions higher than 250 kg/ref, the investment in a melt pump is not justified.
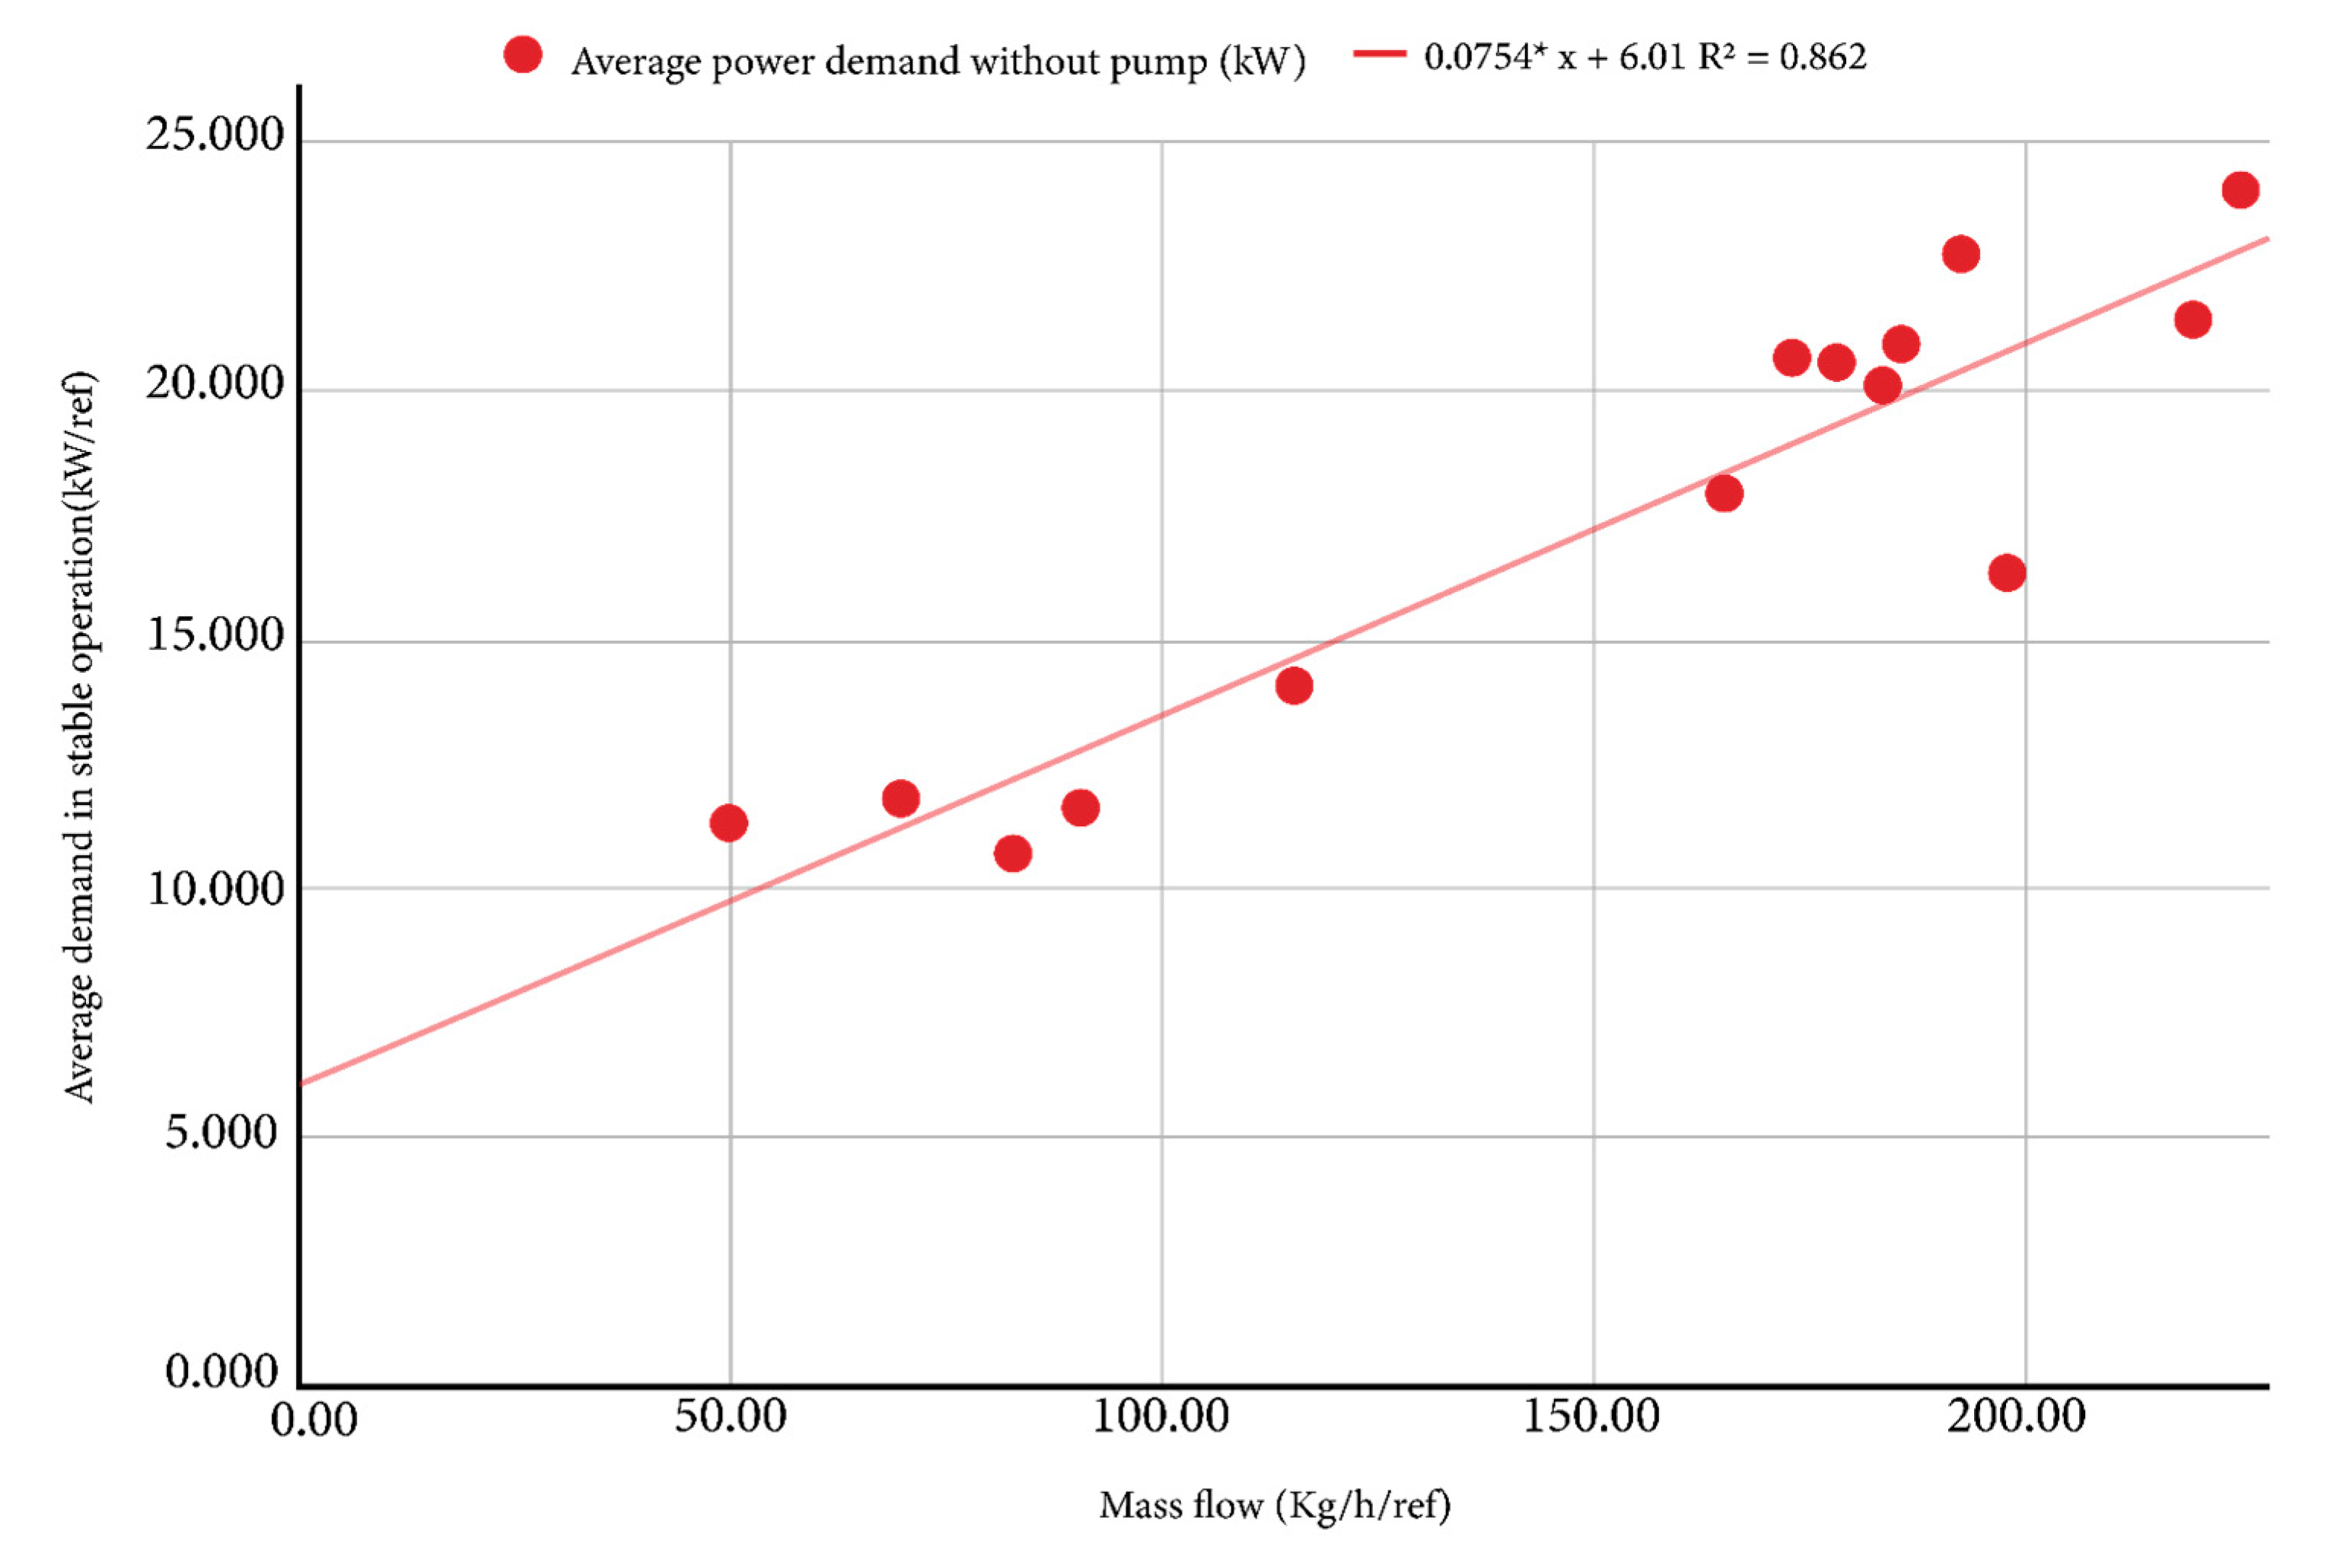
Figure 7 shows the energy performance of the vulcanized rubber extruder without a melt pump under steady-state conditions as a function of process speed or mass flow. The data correlate very well with a straight line, according to Equation (4). The graph shows a high correlation coefficient for this type of case (R2 = 0.862), with a fixed load of 6.01 kW/ref and a variable load of 0.0754 kWh/kg. The variable load is low but consistent with this type of extruder, since in rubber extrusion processes, the screw-cylinder assembly operates as a metering device for the mixture. The mixture is not heated significantly and is not plasticized, so the enthalpy variation is minimal since there is no change in state.
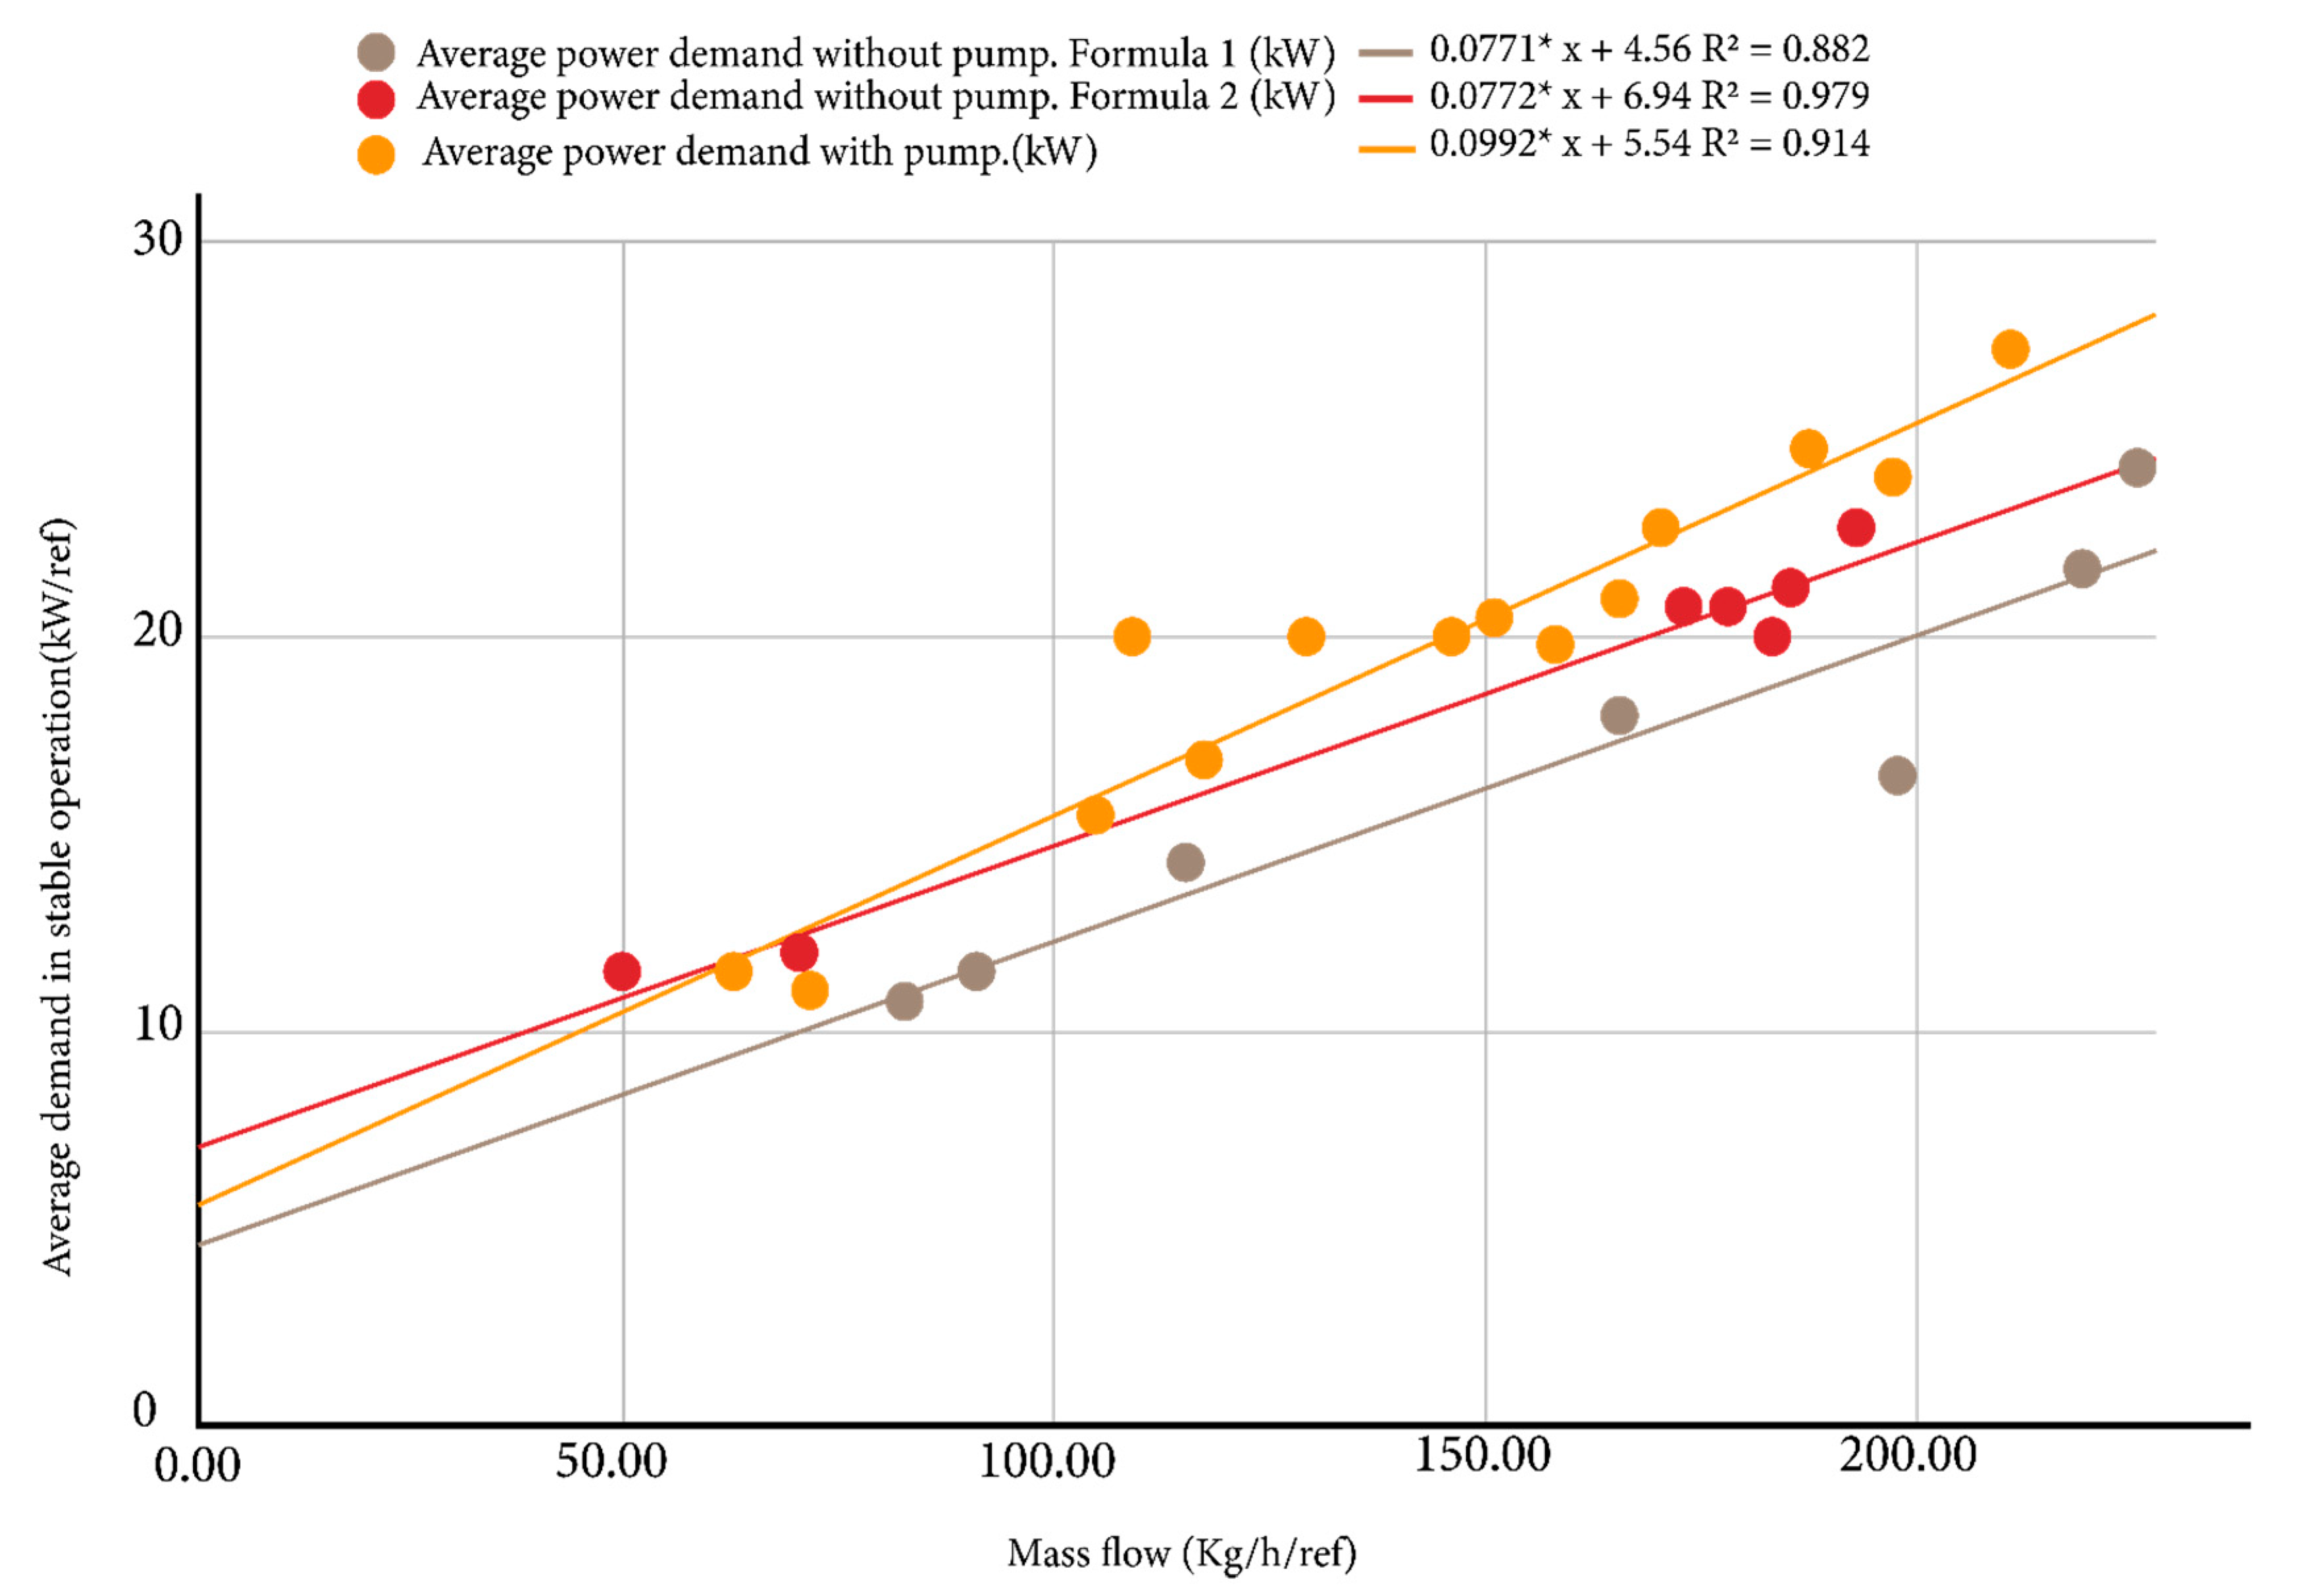
Despite the adequate correlation coefficient of 0.862, it is possible to observe that there are two marked behaviors according to the clusters of data points. By separating these behaviors into two trend lines, Figure 8 is obtained. Figure 8 shows two almost parallel PCLD lines with different energy performances operating without a melt pump (red and brown lines). The correlation coefficient of both lines is higher than the value in Figure 7 (R2 = 0.979 and R2 = 0.882 versus R2 = 0.862), which corroborates that two different extruder behaviors are evident. After reviewing the production data, we found that this behavior was due to the existence of two different rubber formulas used to obtain the products. One formulation called “economic formula” corresponds to the PCLD characterized as formula 2 and the other, called “technical formula”, corresponds to the PCLD characterized as formula (1). The technical formula has a higher cost, but superior energy performance compared to the economic formula.
Figure 8 also includes the behavior of the extruder when the melt pump is coupled. In this case, the variable load is higher and can be explained by the fact that there is an additional consumer connected to the extrusion line, which is the melt pump or gear pump. Among the measured references, profiles were produced with both formulations: the technical formula and the economic formula. However, the correlation coefficient is very high without differentiating between the formulations (R2 = 0.914), indicating that they do not differ in energy performance when the pump controls the extruder flow. Moreover, with the melt pump, the power demand is higher when the process speed exceeds 60 kg/h mass flow. Few references are produced with lower process speeds.
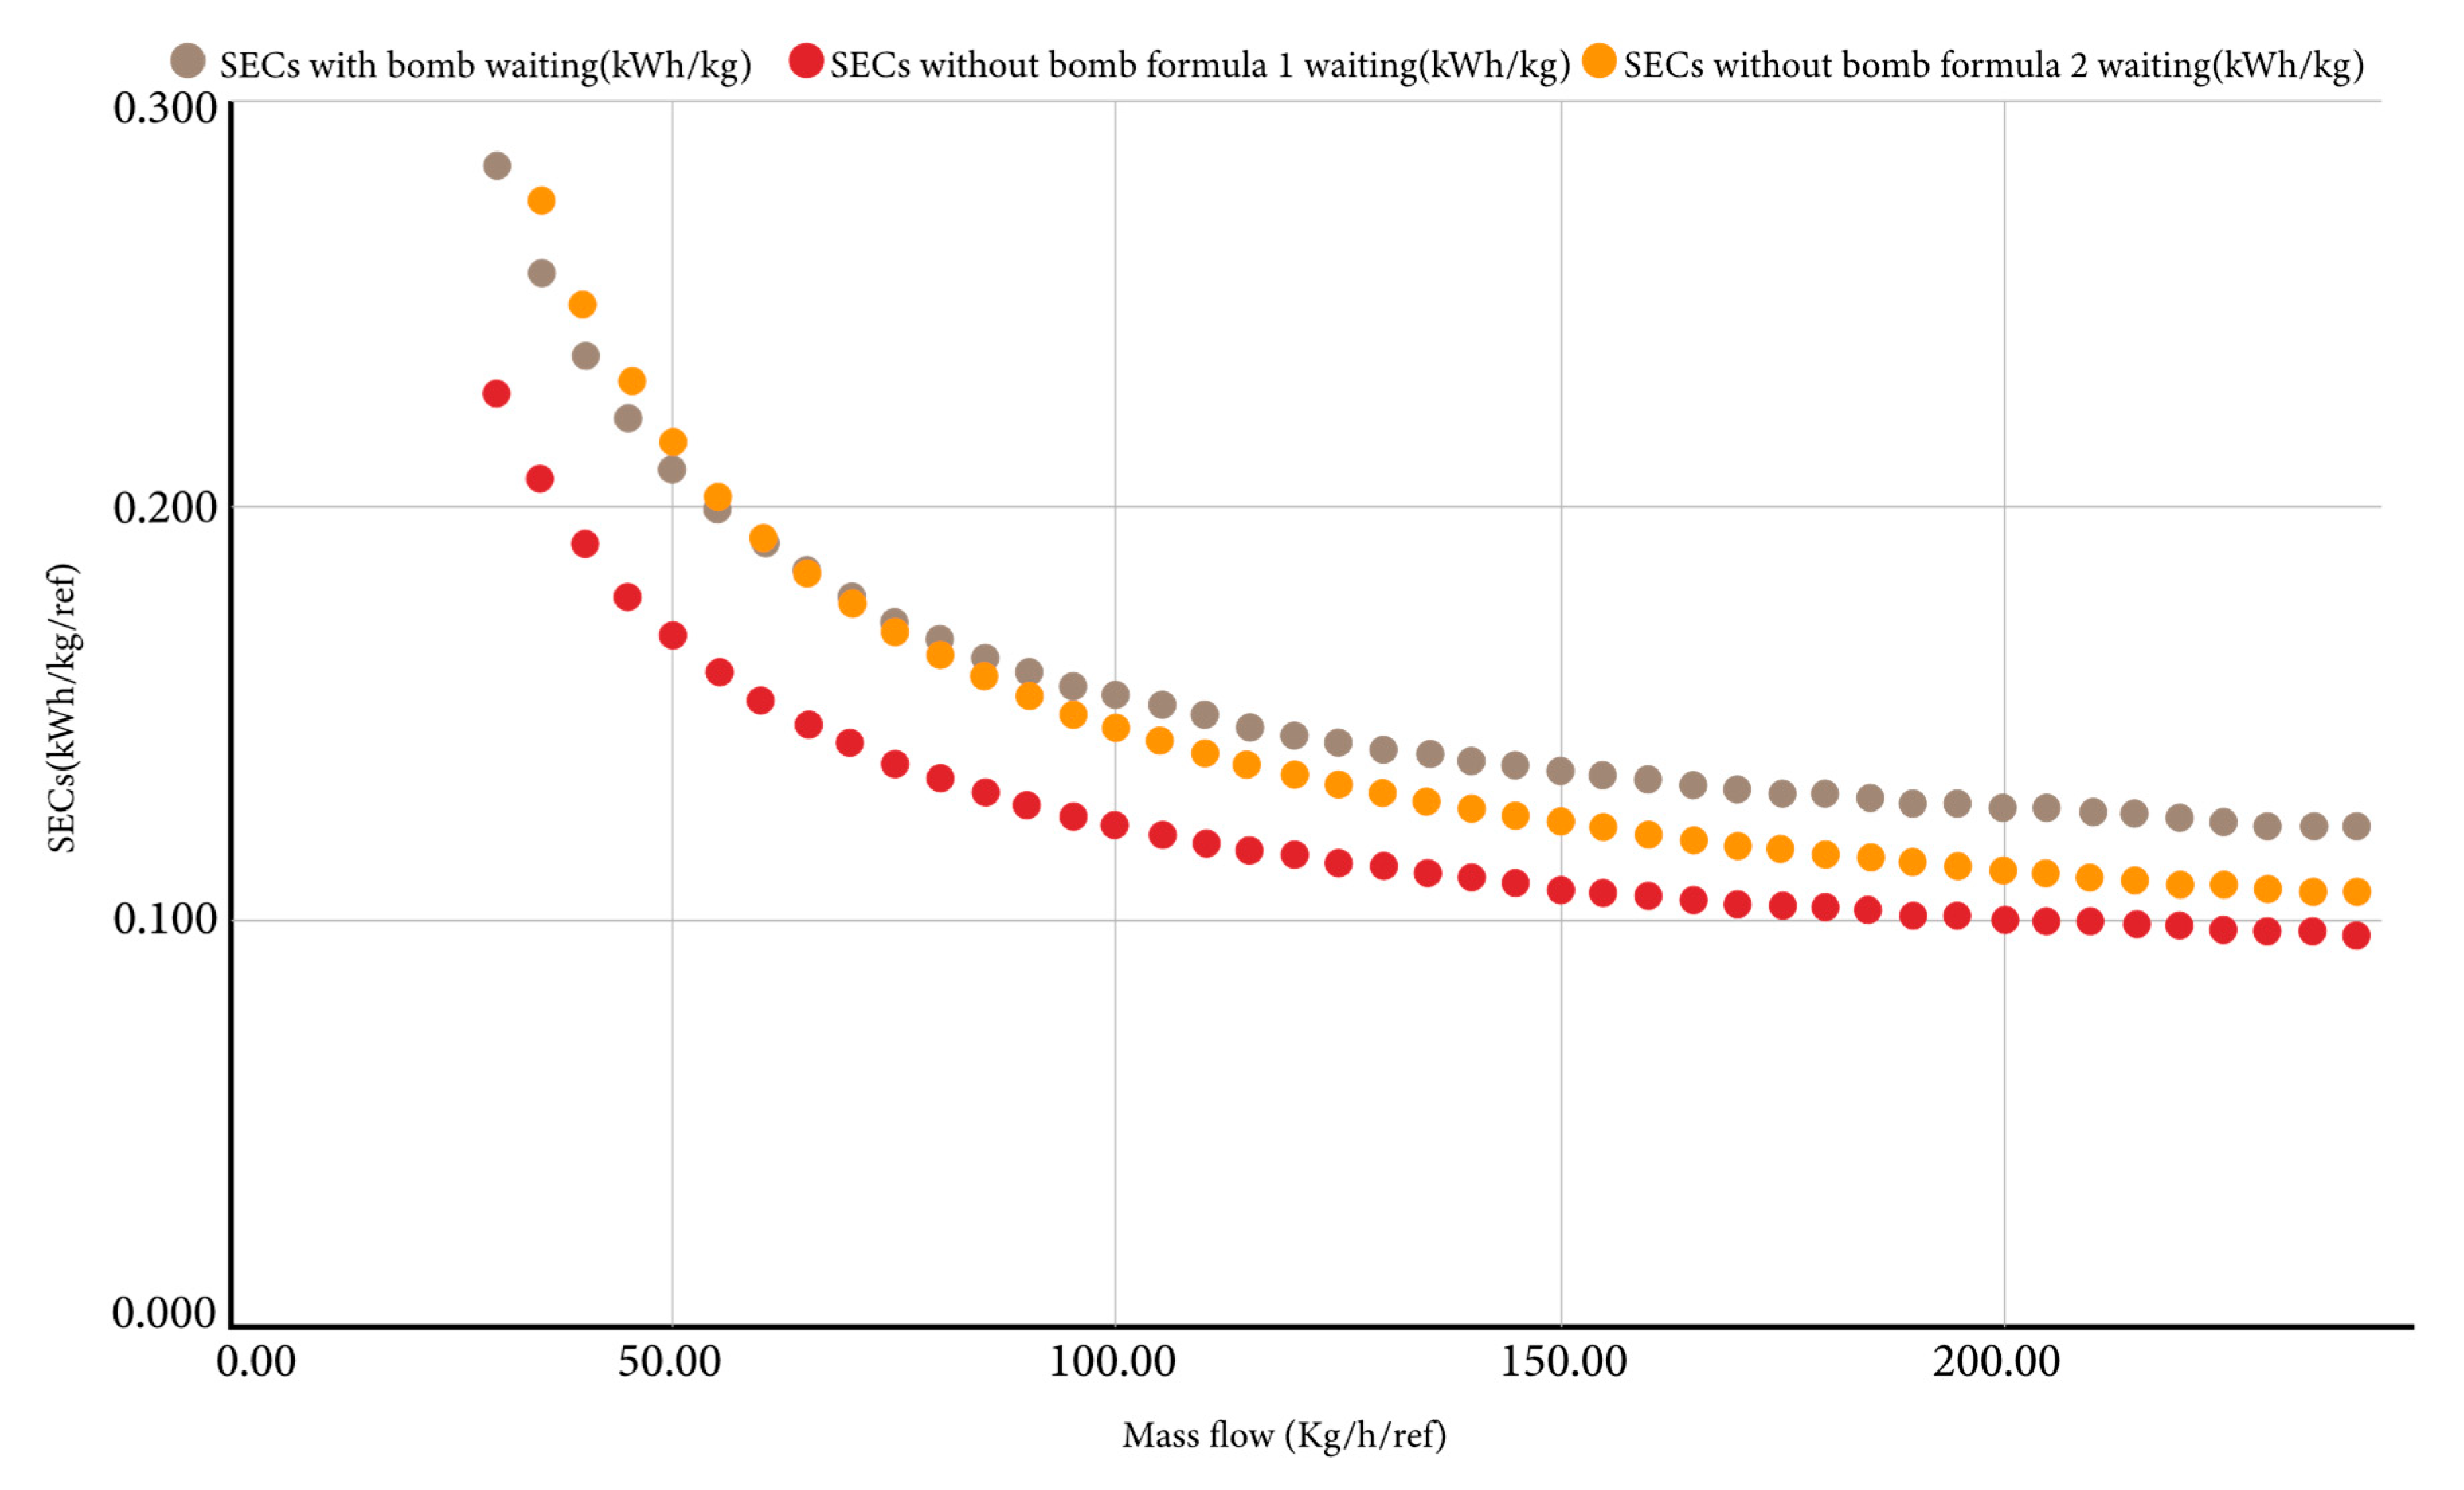
From the linear correlation of the average power data with the mass flow in steady-state operation, it is possible to determine the behavior of S E C s as a function of m ˙ and thus obtain the PCCD at steady-state conditions, which is plotted in Figure 9. The following conclusions can be drawn based on Figure 9:
  • The economic formula (formula (2)) has a higher specific energy consumption at stable operating conditions ( S E C s ) than the technical formula when operated without a melt pump. For example, at a mass flow of 50 kg/h, the difference between formulas is approximately 0.048 kWh/kg. This difference is reduced to 0.001 kWh/kg at a mass flow of 250 kg/h. Both curves are asymptotic at a value of a = 0.077 kWh/kg, which is the theoretical minimum value of S E C s that is possible to obtain from the technology when m ˙ .
  • In comparison, the energy performance of the extruder with a melt pump at high and low process speeds is lower than that of the extruder without a pump. At 50 kg/h it is 0.042 kWh/kg while at 250 kg/h it is 0.026 kWh/kg. The minimum value of S E C s that is possible to have in the vulcanized rubber extruder studied with the melt pump coupling is a = 0.0992 kWh/kg, which is 0.0221 kWh/kg higher than in the extruder without a melt pump. This is not necessarily detrimental if the melt pump allows for reduced non-compliant product or downtime due to reference change to achieve a lower S E C n . Otherwise, its use is not justified.

3.2. EAC: Thermoplastic Injection Line

A company dedicated to the manufacture of household products by thermoplastic injection wants to establish criteria to determine the size of the minimum production batches and the cost of the products based on the energy performance of the process. Moreover, they want to identify actions to improve their energetic performance.
A hydraulic injector with 200 tons of closure and a capacity of 291 g measured with PS has been selected as the EAC. The analysis of 299 production orders, corresponding to the production of 105 references produced in 43 different molds, was conducted over 4 months. Note that this is not a seasonal analysis. The EAC is instrumented to measure every 30 s, with an information system to determine the following (for each production order): start time, end time, product reference, mold used, compliant production, non-compliant production, downtime, part weight, and number of mold cavities. The energy monitoring system is not integrated into the information system, but consumption figures relate to the production order by the start time and end time of the PO. Thus, demand graphs can be obtained for each production order, such as the one shown in Figure 10a.
Due to the measurement frequency, the data have a lot of noise that can make analysis difficult. This requires pre-processing of data for attenuation and noise reduction. Subsequently, the curve is integrated through Simpson’s rule to obtain the consumption and the average demand is established under stable production conditions using a routine developed for this purpose. This way, information on average power demand and base power is obtained, as shown in Figure 10b, for each of the 299 production orders. The consolidated information for the analysis period is presented in Table 2.
The effective productivity and real productivity for the period and each of the POs were calculated as presented in the following equations:
R e a l p r o d u c t i v i t y k g h = P r o d u c t i o n c o m p l i a n t [ k g ] t t o t a l p r o d u c t i o n [ h ]
E f e c t i v e p r o d u c t i v i t y k g h = P r o d u c t i o n c o m p l i a n t P r o d u c t i o n n o n c o m p l i a n t [ k g ] t t o t a l p r o d u c t i o n P r o d u c t i o n d o w n t i m e [ h ]
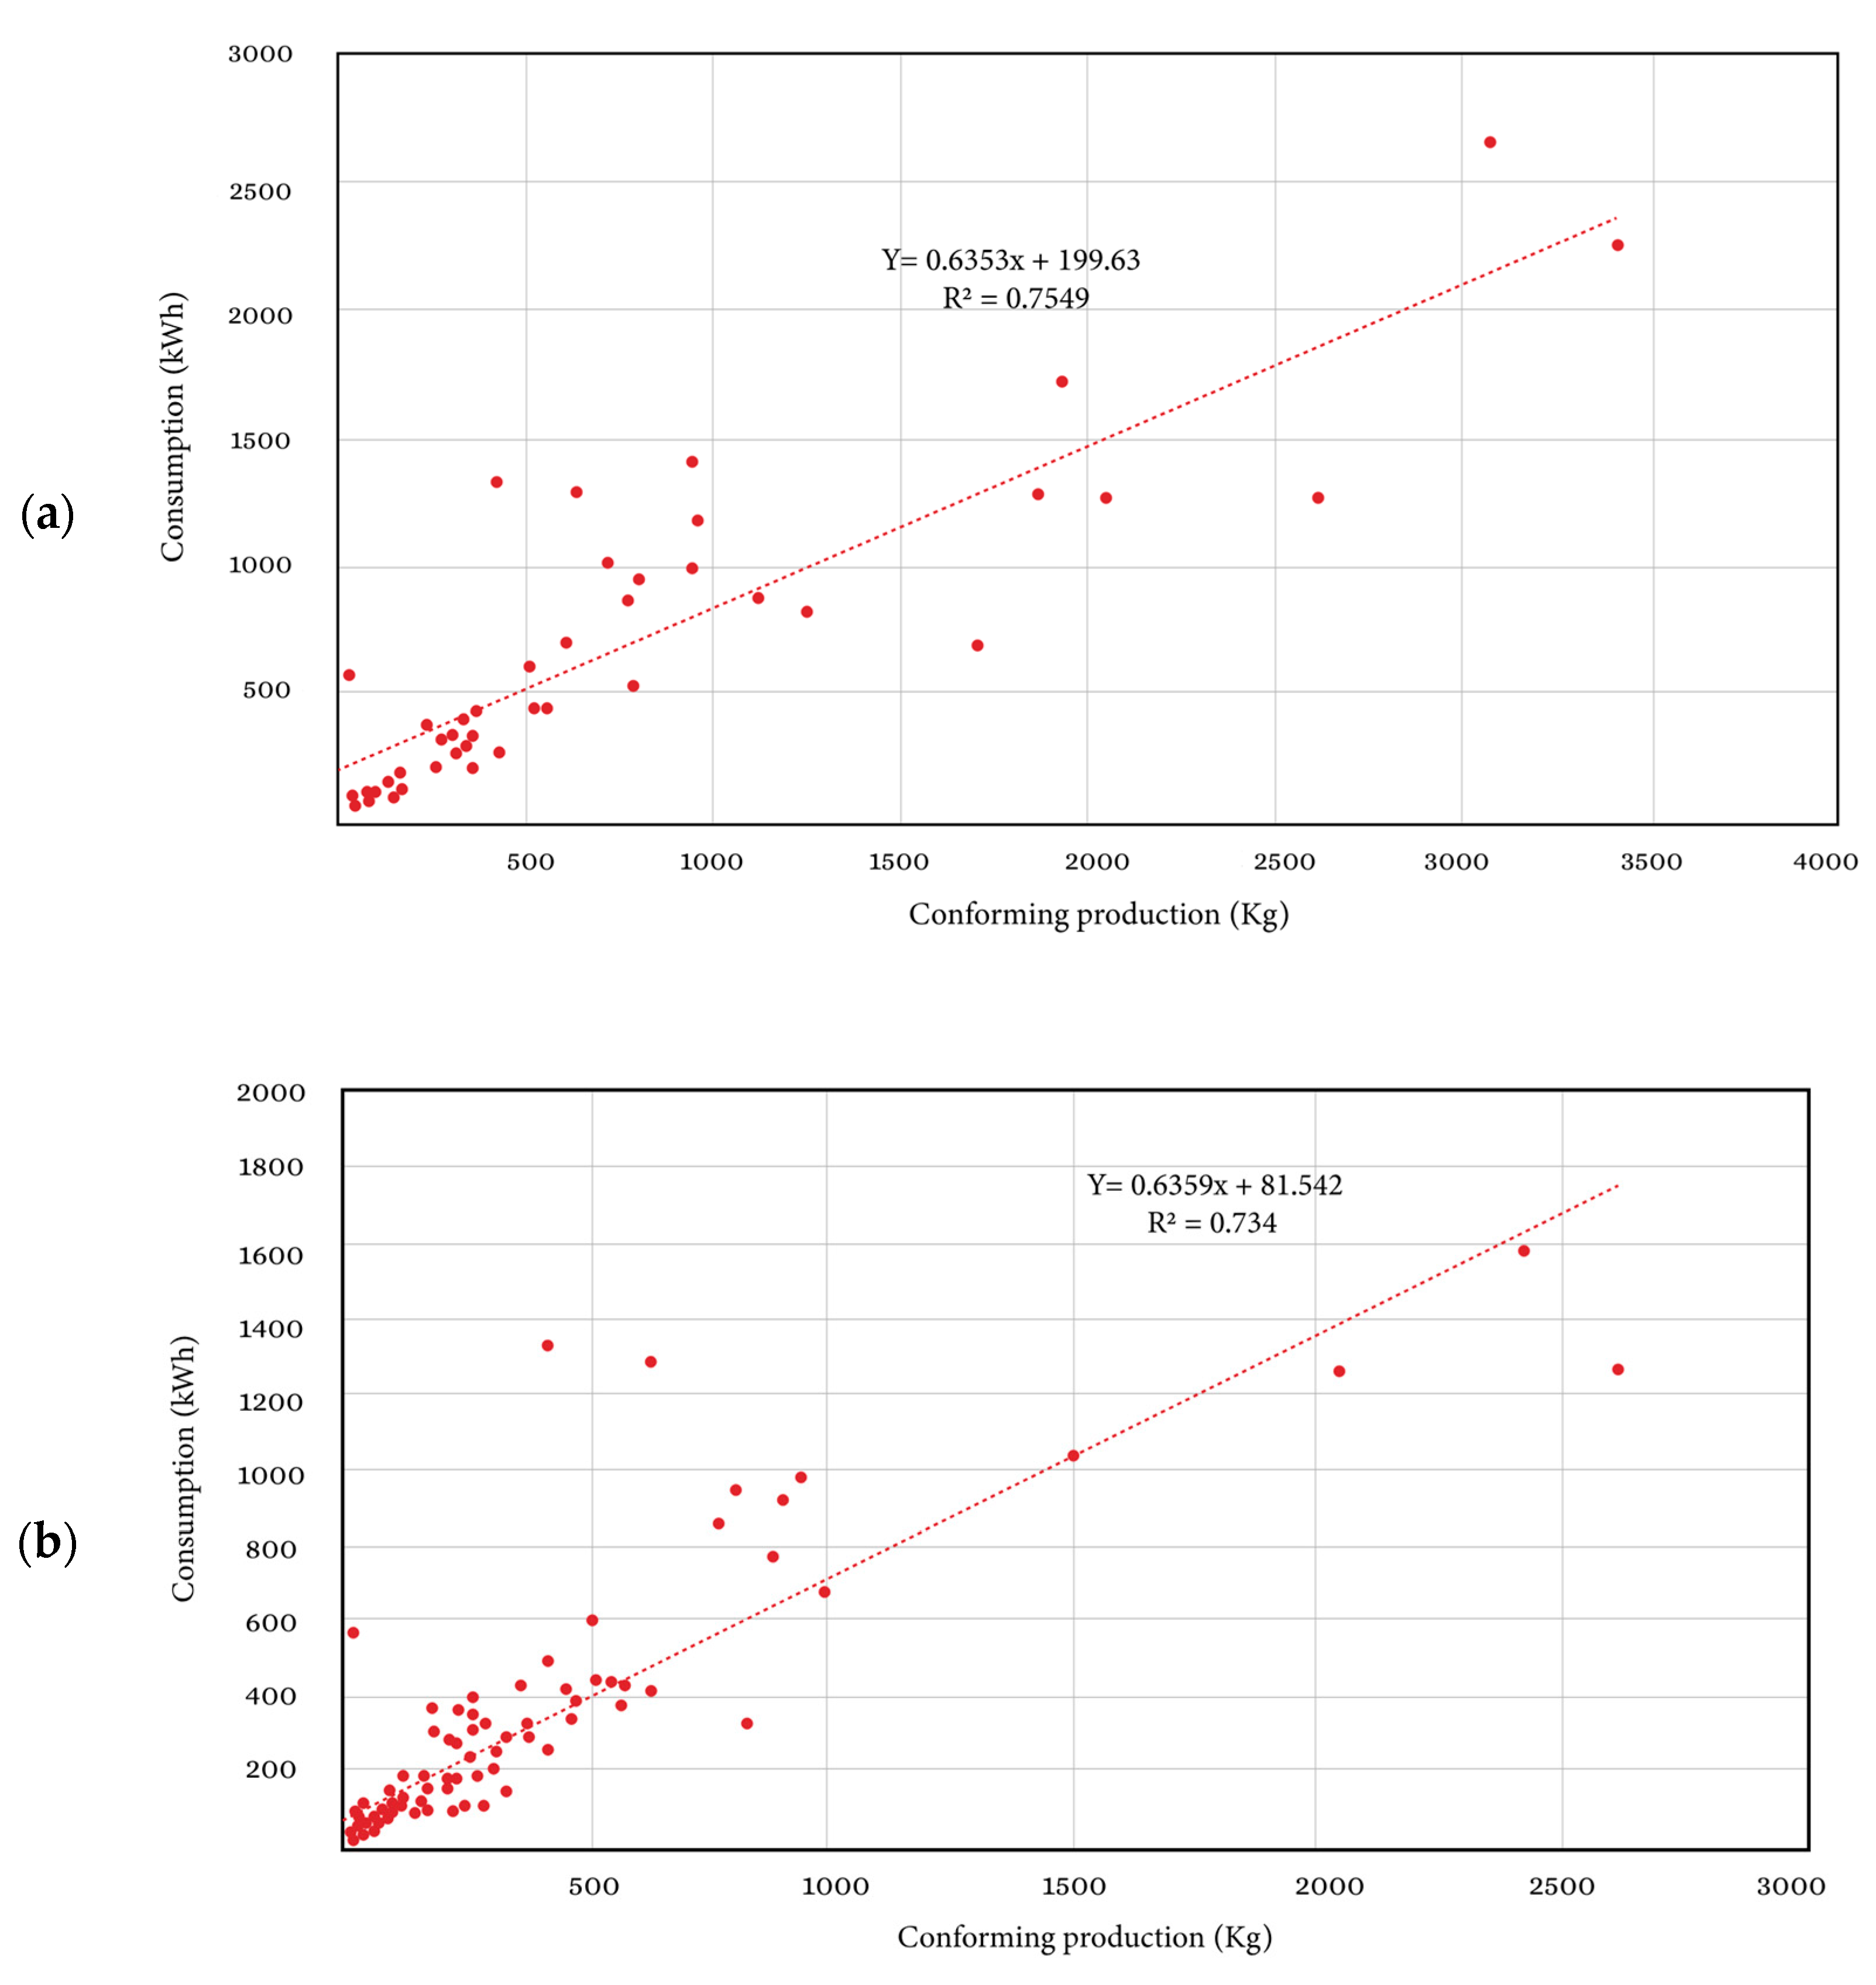
One of the objectives of the proposed methodology is to determine energy gaps and detect production elements that require specific actions. With consolidated information, we want to obtain the PCLD per mold and reference to analyze the dependence of the consumptions concerning the compliant production. The results are shown in Figure 11a,b, respectively. In both cases, the correlation coefficients of 0.7549 and 0.734 are higher than 0.7, indicating that the consumption information can be correlated with the compliant production through a linear regression. Additionally, the base load of the PCLD in Figure 11a has a value of 199.6 kWh per mold assembled, while the PCL in Figure 11b has a base load of 81.5 kWh per product reference produced. These values are congruent since about 2.4 times more references are assembled than molds. In other words, on average, slightly more than two references are produced in each mold. The variable load is very similar (0.6353 kWh/kg vs. 0.6359 kWh/kg, respectively). It should not change since the efficiency with which the EAC consumes energy is independent of the references or the molds if the production composition does not change, which in both cases is the same.
Figure 12 shows the determination of the Performance Characteristic Line for Diagnositics (PCLD) and the Activity-Based Target from Diagnostics (ABTD) for analysis by mold. The PCLD was determined using all the points present in the graph, while the ABTD was obtained by correlating only the points below the PCL and located in the shaded region.
The model of the usual injector performance from the PCL is presented in the following equation:
E n e r g y c o n s u m p t i o n P C L D k W h = 0.635 · P r o d u c t i o n c o m p l i a n t k g + 199.6
The coefficient of determination (R2 = 0.755) is acceptable and allows confidence that the model represents the data’s behavior. According to the model, the injector’s fixed consumption is 199.6 kWh per mold mounted on the machine, while the variable consumption is 0.635 kWh/kg produced.
On the other hand, the ABT has a much better coefficient of determination (R2 = 0.939) and, according to it, the consumption is represented by the following equation:
E n e r g y c o n s u m p t i o n A B T D k W h = 0.565 · P r o d u c t i o n c o m p l i a n t k g + 87.9
If the actions for improving the energy performance of the injection molding machine are undertaken and a PCLD with behavior like the ABTD is achieved, the base load would drop from 199.6 kWh to 87.9 kWh per mold assembly. This means a 56.0% reduction in base load and the variable load would drop from 0.635 kWh/kg to 0.565 kWh/kg, representing a reduction in energy consumption above base load of 11.0% and thus an increase in EAC efficiency. Production must intervene in the molds corresponding to the points above the PCL to achieve the target. The ABTD line is the target for the future PCLD line, and when the target is reached, it is possible to establish a new ABTD line. In a well-managed system, the gap between the PCLD and ABTD lines gradually closes, making it increasingly difficult and costly to reach new targets. There will come a time when no further improvement is possible without significant intervention in EAC technology.
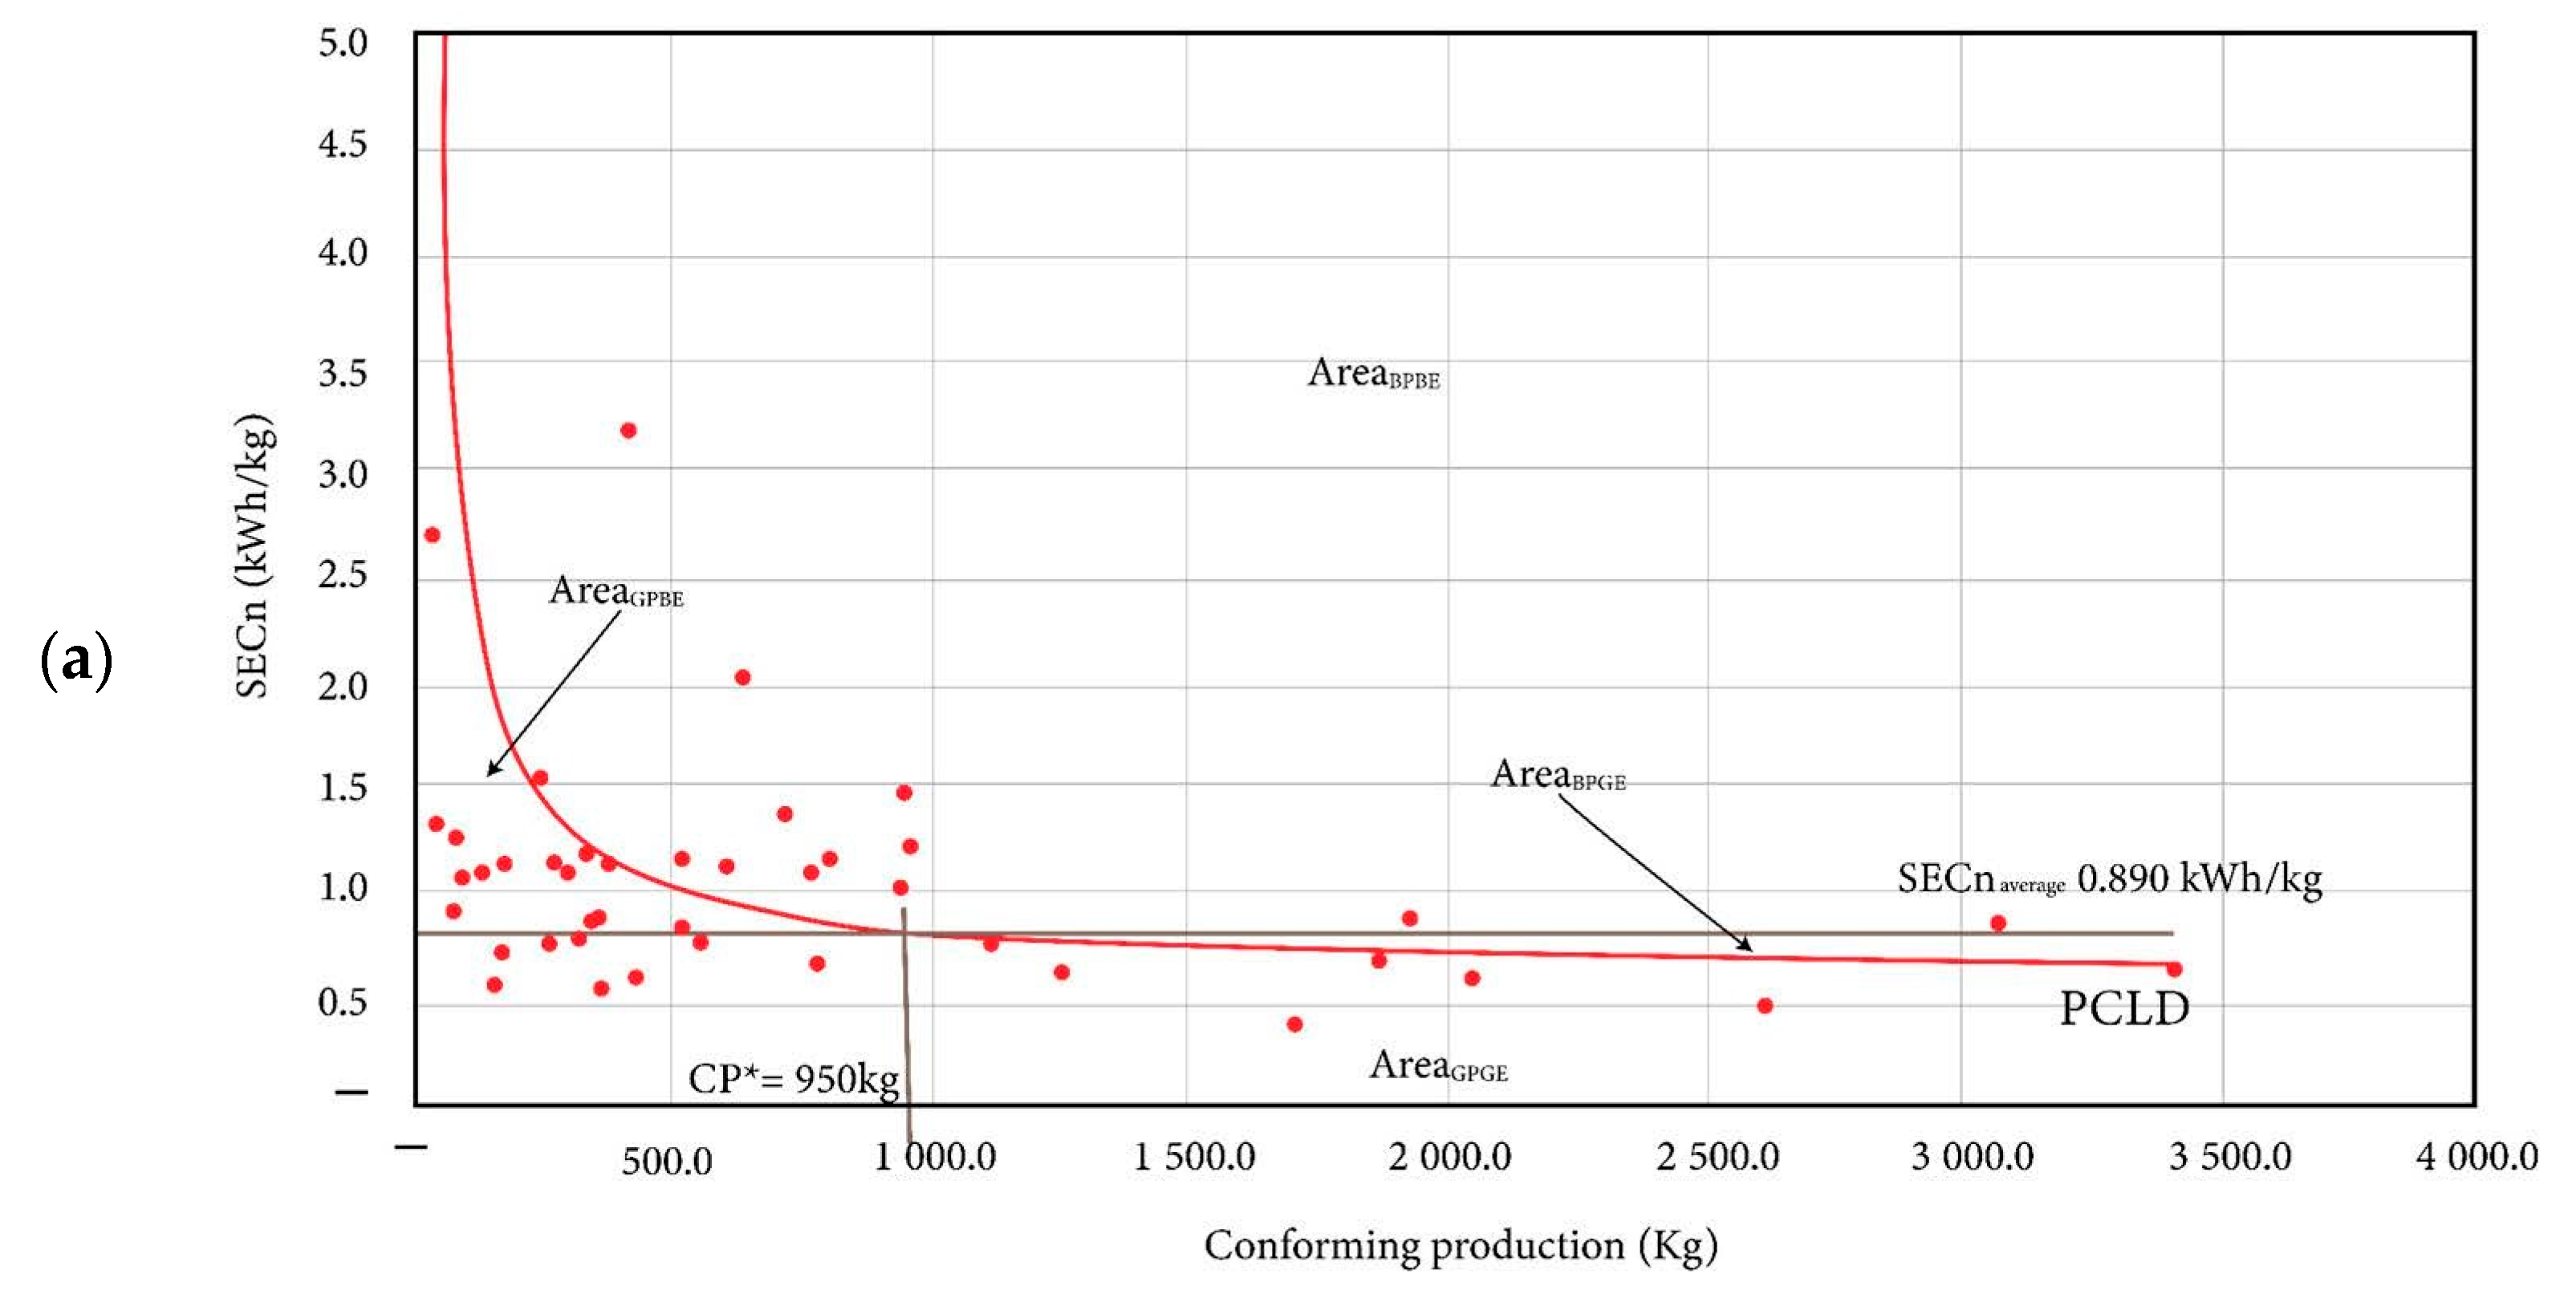
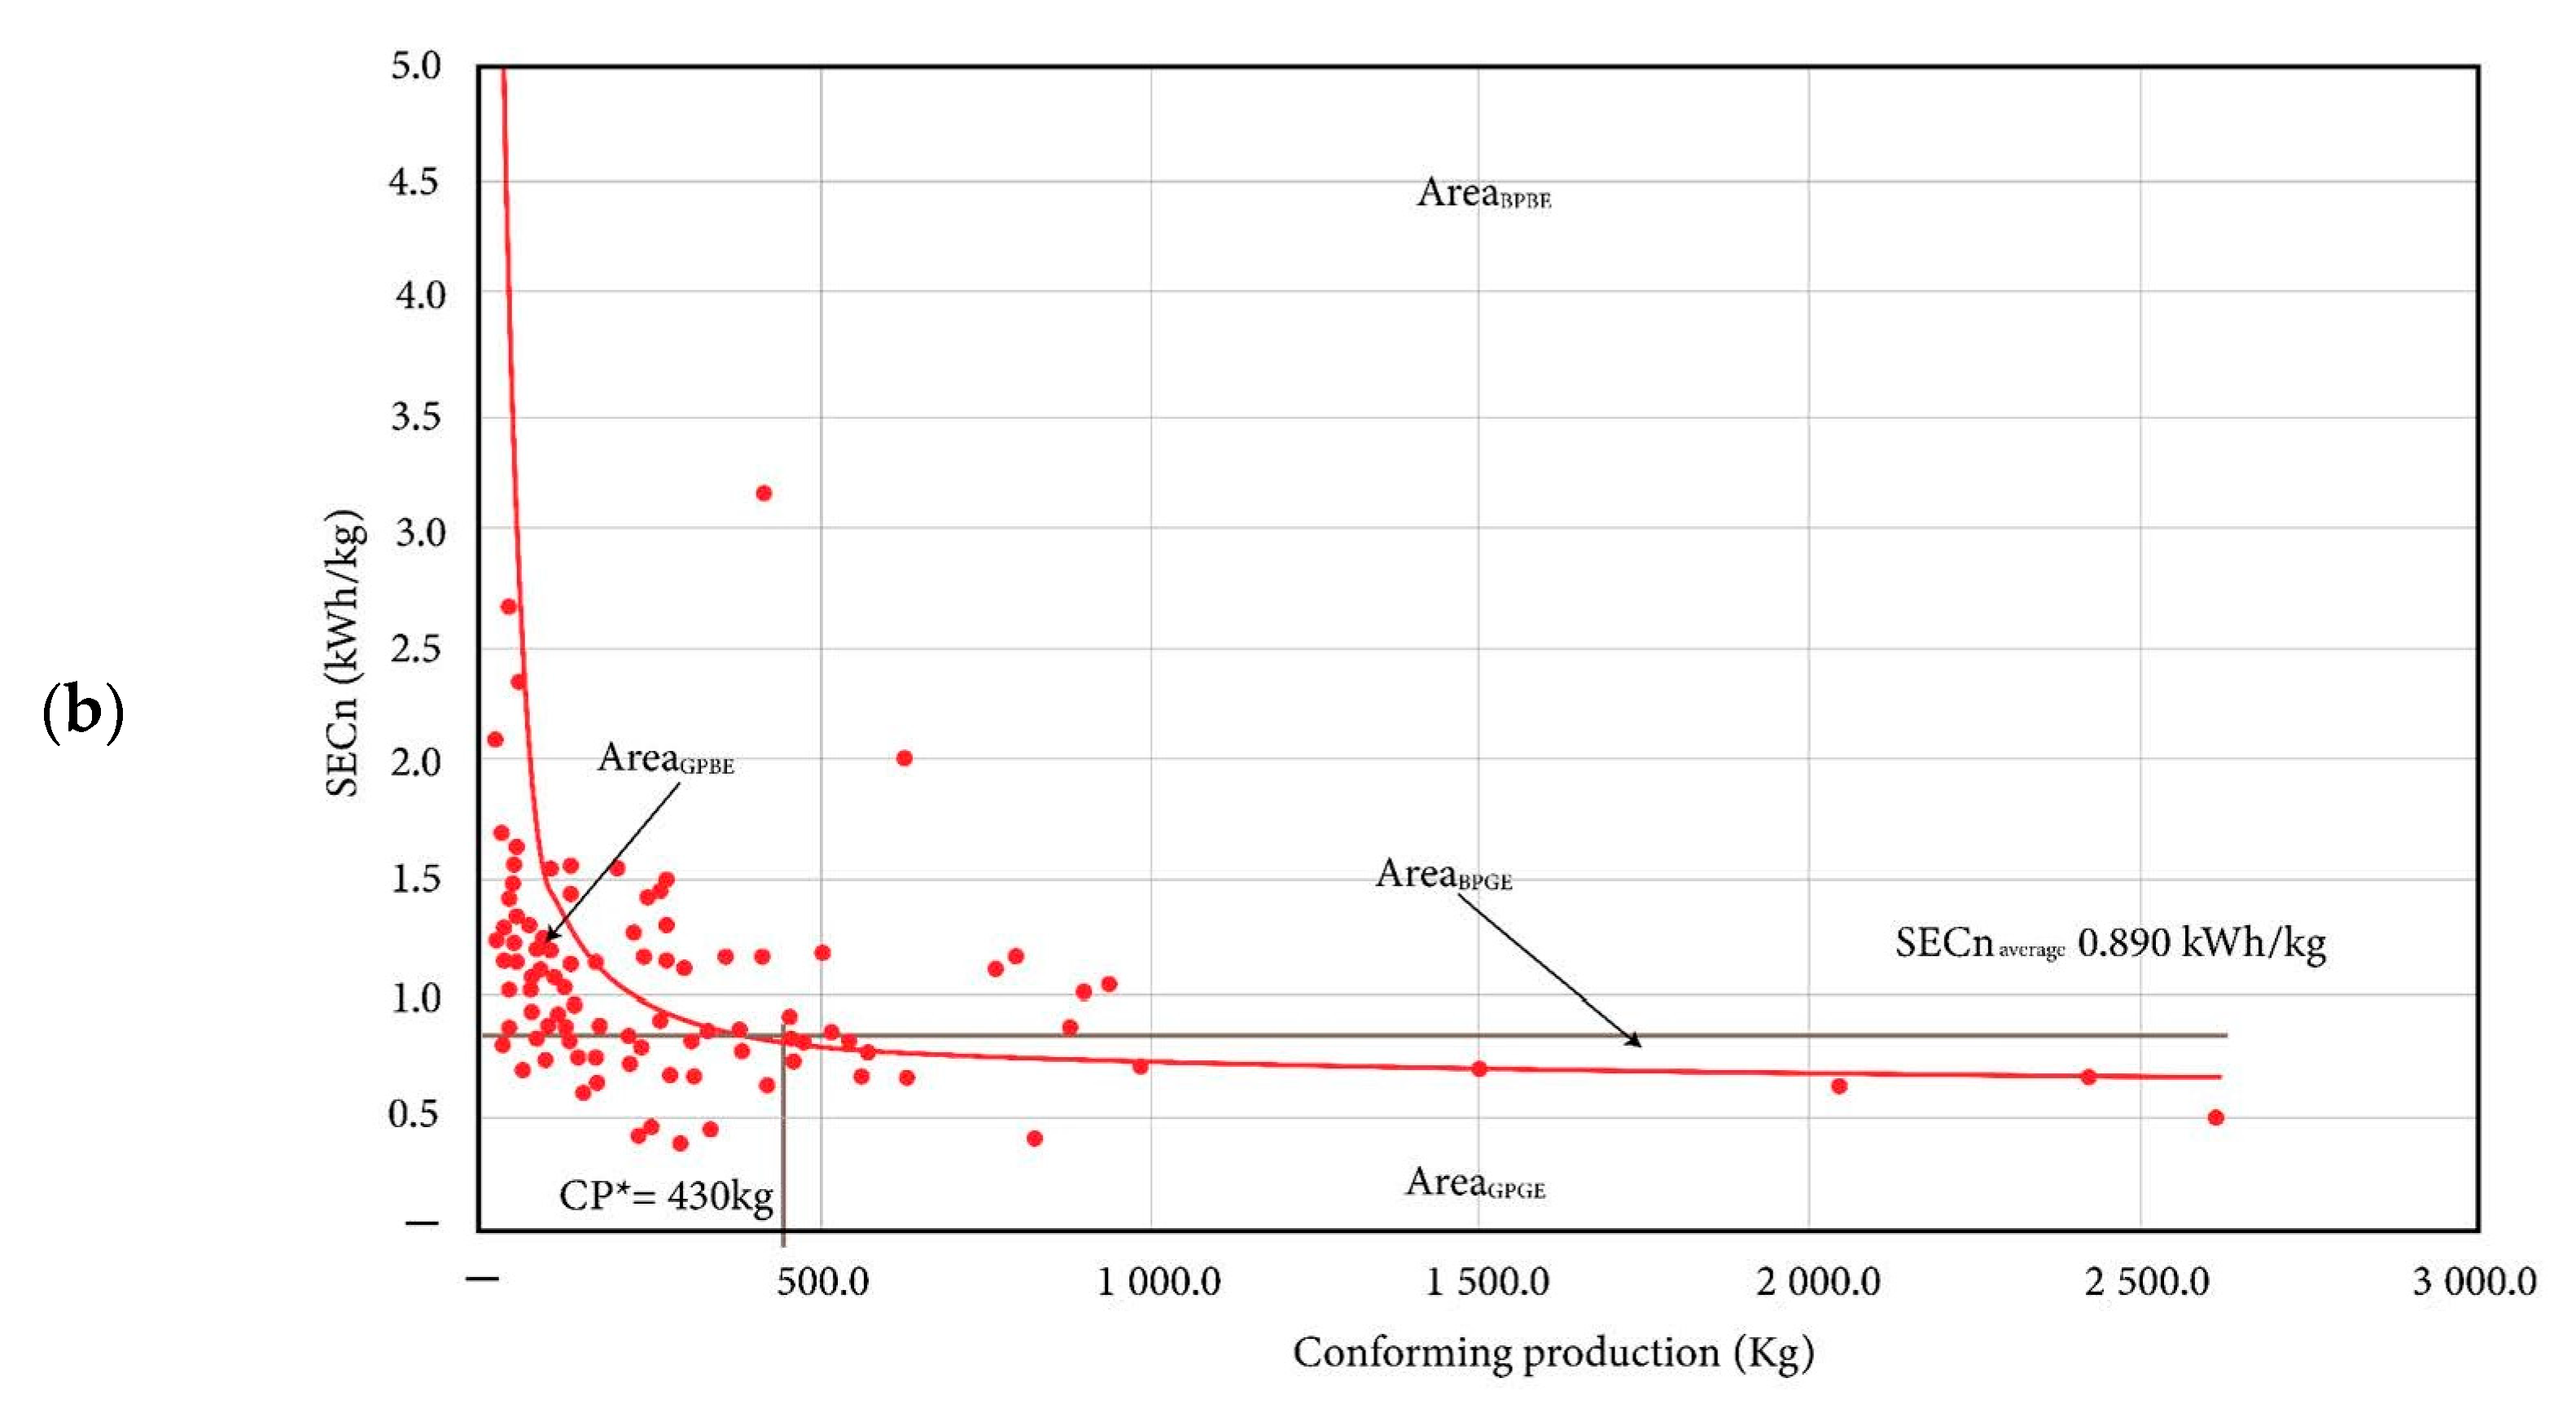
The PCCD analysis determines which molds are used and how the intervention should be conducted. For this purpose, the total consumption is related to the total compliant production of the analysis period in the EAC, resulting in S E C n g l o b a l = 0.890 k W h k g (see Table 3). The PCCD that describes the behavior of S E C n for the analysis by molds is shown in Figure 13a and for the analysis by reference, as shown in Figure 13b. In Figure 13a, all the molds above the Snavg line make the EAC more energy-efficient. In Figure 13b, the points above this line are all references that have the same effect on the energy cost center and thus reduce its energy efficiency. However, the actions to be taken with the molds and references depend on the area where the points are located, as explained in Figure 4.
The most complex intervention is that of molds that exhibit poor energy performance and low energy efficiency. These molds are presented in Table 4, ordered from lowest to highest energy efficiency. These molds require major engineering decisions to improve their performance in the EAC or move them to other machines where they can perform better.
In other words, improving energy efficiency can be as simple as increasing the EAC’s compliant production for the analyzed criterion. In this sense, it is a merit of the commercial or production scheduling area to achieve it. Improving energy performance requires engineering, which is an achievement usually attributable to the plant that manages the EAC. However, good engineering work can help reduce batch sizes to keep the energy efficiency of the EAC under control. Figure 14 depicts the PCCD for the PCLD and the ABTD when the compliant production is classified per injection mold. The minimum recommended production per mold assembly (CP*) is highlighted for each curve. As shown in Figure 14, if the PCLD could meet the values of the ABTD, batch sizes per mold assembly can drop from 950 kg to about 300 kg, making the plant more flexible to meet commercial challenges.
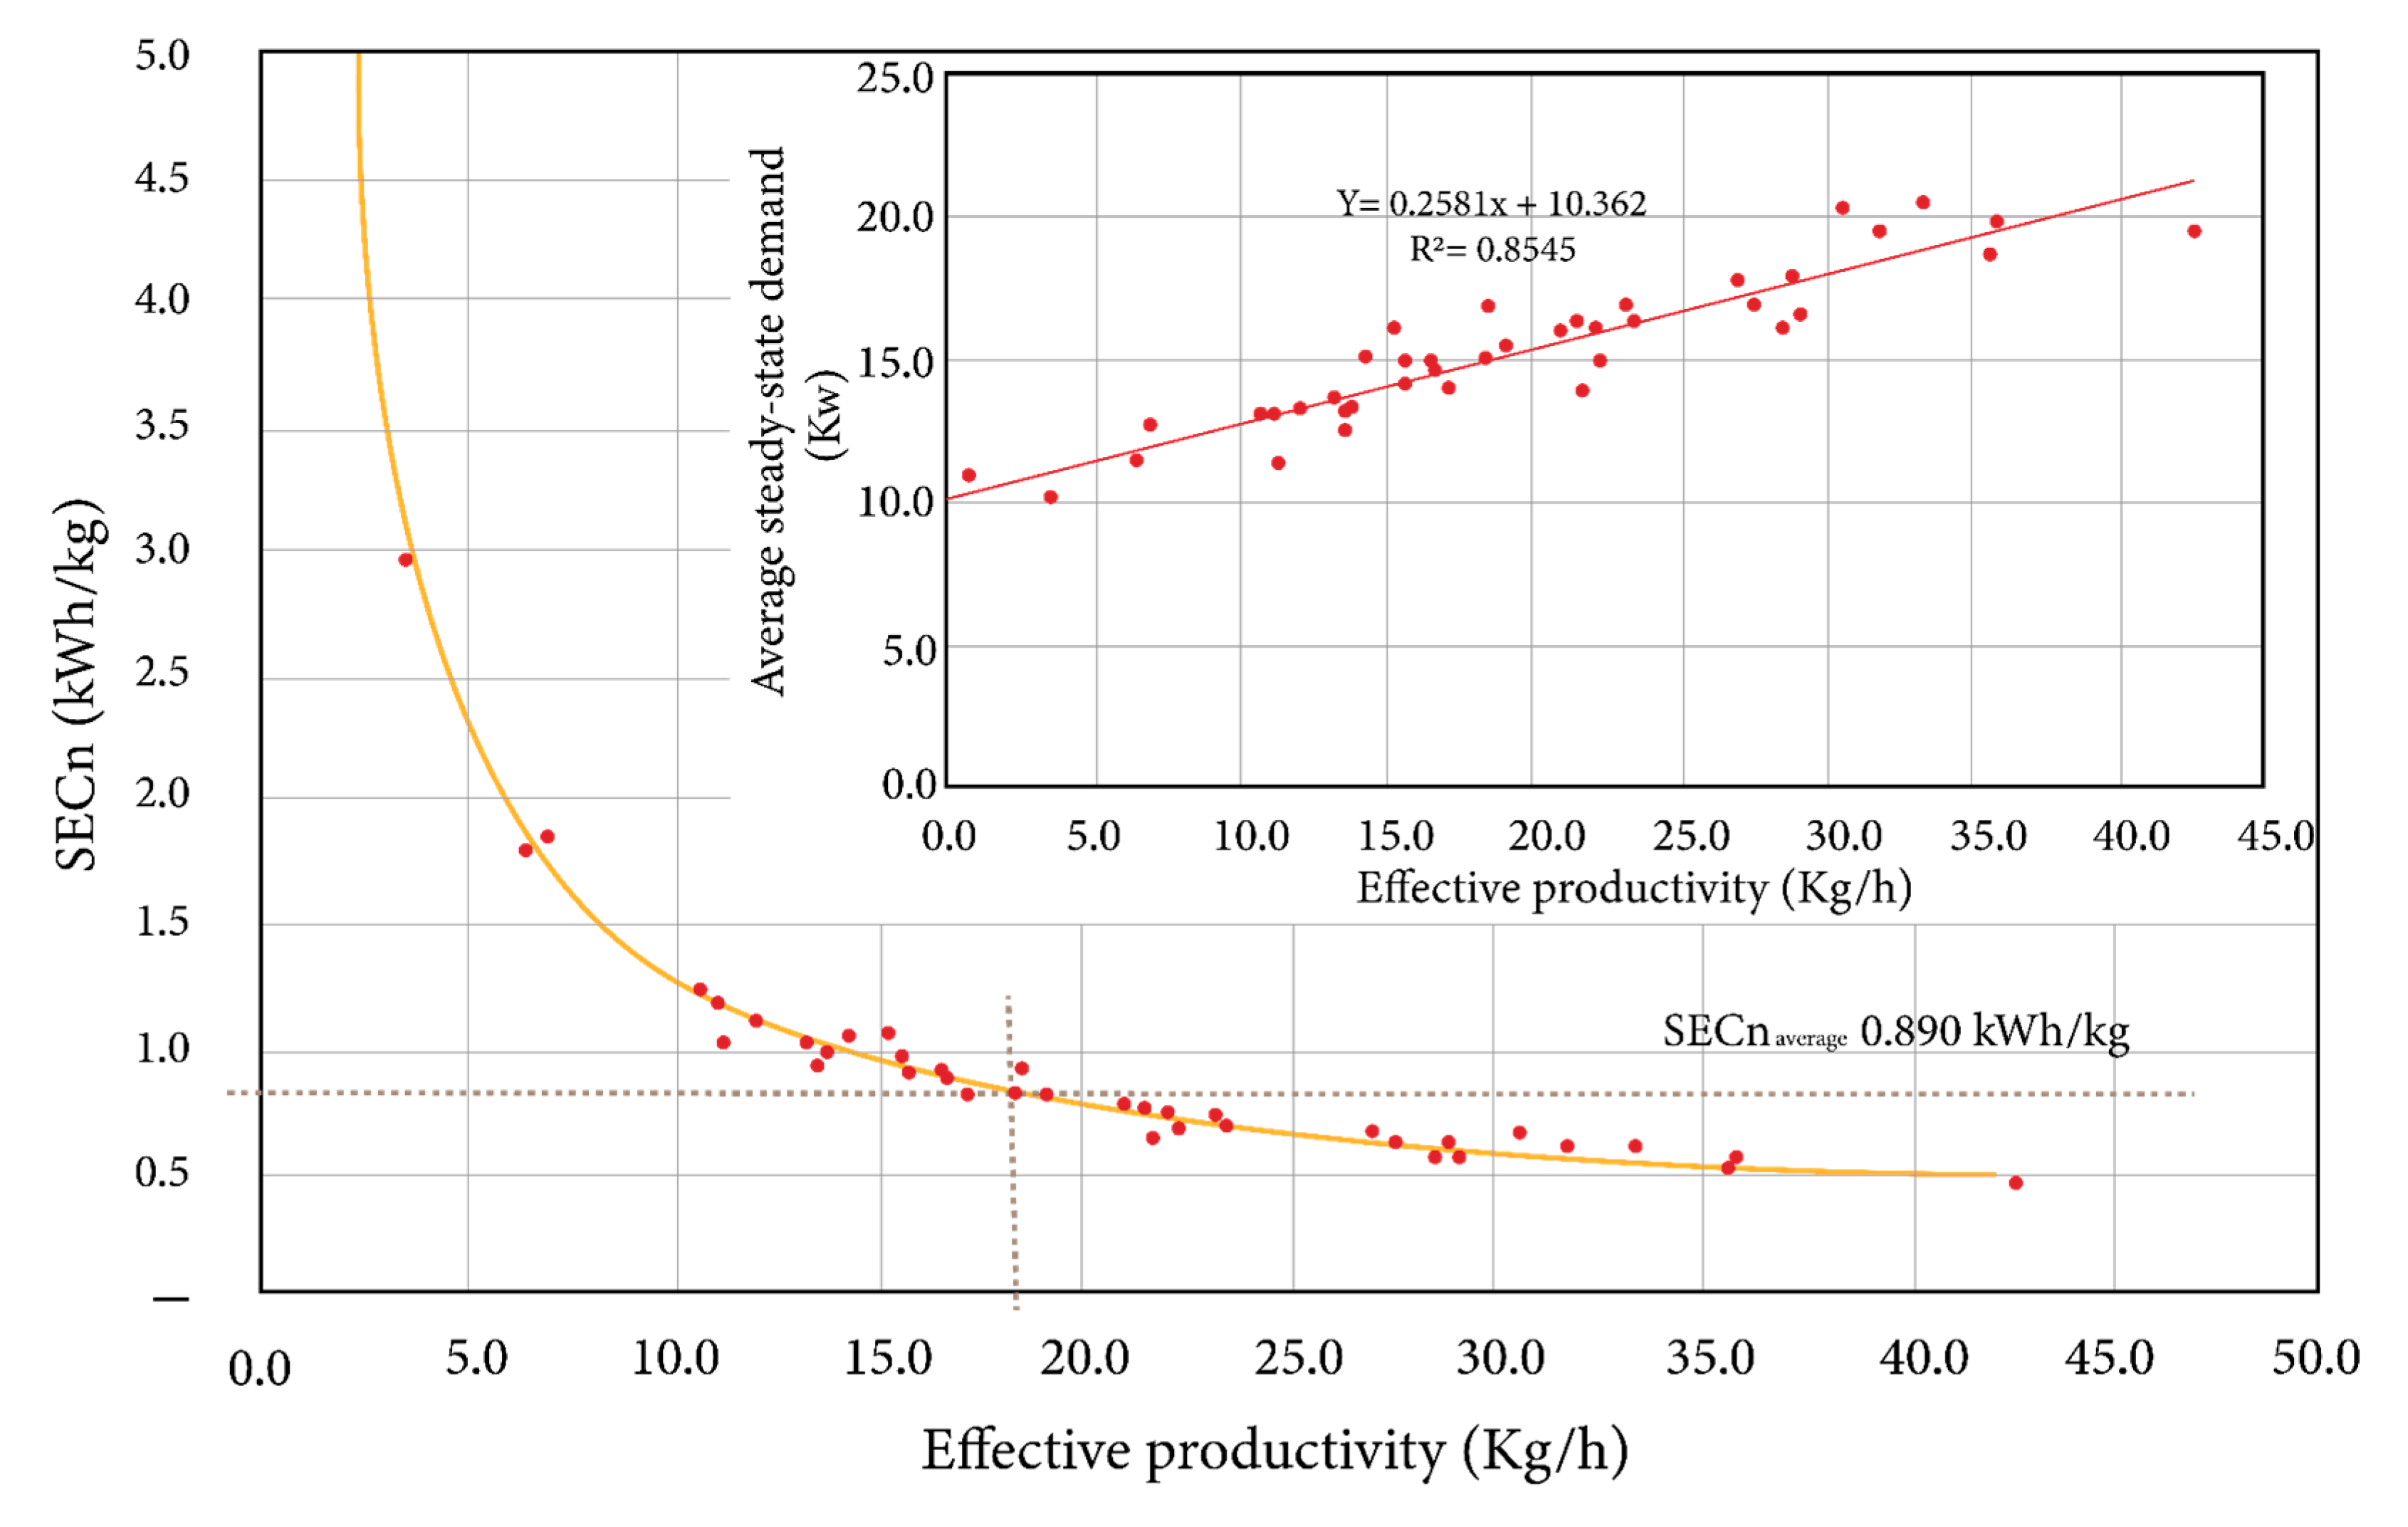
When correlating the average demand in the steady-state operation of the machine against effective productivity, Figure 15 is obtained. There is also a good correlation (R2 = 0.77). Additionally, the PCLD and PCCD were determined for the S E C s . Since there is no record of the EAC mass flow for each mold during steady-state operation, the steady-state demand was correlated with the effective productivity obtained from Equation (13), which is also shown in Figure 15.
In Figure 15, the variable consumption is 0.2851 kWh/kg and the fixed demand is 10.362 kW. But more importantly, it is necessary for the molds to have an effective productivity higher than 18 kg/h to maintain an S E C s lower than 0.890 kWh/kg.
In this context, if both the energy consumption of the injection molding machine under analysis and the cost of energy consumption of the products produced are to be kept under control, production scheduling must concentrate on three factors:
  • When a mold is assembled, it should be used for production runs above 950 kg;
  • When several references are assembled in the same mold, the production batch size per reference cannot be less than 430 kg;
  • Molds that cannot run at an effective productivity of more than 18 kg/h should not be mounted.
These results respond to the specific behavior of the composition of the products assembled in the machine and the characteristics of the machine. It is worth emphasizing that energy cost is not the only factor to be considered, but the example shows how it can be considered in the decision. Finally, the analysis allows modeling the cost of energy invested in the product according to the size of the batch assembled per mold, per reference, and according to the level of productivity in the process. This yields the following results:
Product cost per S E C n per mold:
E C P $ k g = 0.6353 k W h k g + 199.63 k W h P r o d u c t i o n c o m p l i a n t k g × E C $ k W h
Product cost per S E C n per reference:
E C P $ k g = 0.6359 k W h k g + 81.54 k W h P r o d u c t i o n c o m p l i a n t k g × E C $ k W h
Product cost per S E C s per mold:
E C P $ k g = 0.2581 k W h k g + 10.36 k W m ˙ k g / h × E C $ k W h
The product cost will be at least the highest calculated with Equation (16), Equation (17), or Equation (18). It is important to remember that S E C s does not consider production and quality inefficiencies, so the energy cost associated with the production of the product will be higher than the calculated cost.

4. Discussion

Although they use similar tools, the Monitoring and Targeting (M&T) methodology and the Energy Gap Method (EGM) have different advantages. Despite this, both techniques can be considered as complementary. M&T is an energy consumption control methodology for continuously improving the energy cost center’s energy performance and efficiency. On the other hand, the Energy Gap Method is a diagnostic method that seeks to determine the causes of such performance and efficiency, in addition to providing a framework under which areas for improvement are more easily identified and actions are prioritized to achieve improvement objectives. The differences between M&T and the EGM for diagnosis can be better understood based on Table 5.
The difference between control and diagnosis is critical for understanding the comparative advantages of each approach. Control methodologies like M&T excel at identifying deviations from expected patterns, essentially answering “what” is happening with energy consumption. Diagnostic methodologies like the EGM, enhanced with the analytical tools presented in this paper, study “why” these deviations occur and “how” they can be systematically addressed. This distinction becomes particularly important in polymer processing industries, where the complexity of operations and the variety of products, molds, and machines create multiple variables that affect energy performance.
Developing the PCLD, ABTD, and PCCD as analytical tools extends the original Energy Gap Method beyond its theoretical foundation into practical applications that address specific industry challenges. These tools enable several critical capabilities that were previously difficult to achieve. First, the ability to determine minimum batch sizes per mold and per reference represents a significant advance in production planning for energy efficiency. Traditional approaches to batch sizing often focus exclusively on setup costs and inventory considerations, neglecting the energy implications of production decisions. Our case studies demonstrated that energy consumption per kilogram can vary dramatically below certain production thresholds, creating a clear economic incentive to align batch sizes with energy efficiency considerations. Second, these tools bridge the gap between production scheduling and energy management—two domains traditionally operated in isolation within manufacturing organizations. By quantifying the energy implications of production decisions, production planners can incorporate energy considerations into their scheduling algorithms, potentially transforming energy from a fixed overhead cost into a manageable variable expense. Third, the ability to accurately allocate energy costs to specific products addresses a common challenge in manufacturing costing systems. Traditional energy cost allocation methods often distribute energy costs based on machine hours or production volume, potentially penalizing energy performance products with the costs generated by non-performance ones. The methodology presented here enables more equitable and accurate energy cost accounting, supporting better pricing decisions and investment prioritization.

5. Conclusions

The integration of advanced analysis tools based on the Energy Gap Method (EGM) represents a significant advancement in diagnosing and optimizing energy performance in Energy Accounting Centers (EACs) for the polymer industry. This approach overcomes the limitations of traditional monitoring and control methodologies by providing a solid basis for informed decision-making, especially in scenarios where energy and sustainability challenges are increasingly complex.
The methodology expands the scope of the Energy Gap Method (EGM). The EGM goes from relating energy consumption only to the technology used, manufacturing parameters, and usage patterns to allowing production planning to improve energy performance. This will enable decisions to be made to improve energy performance by collecting production planning data and analyzing their composition. Also, classifying intervention points according to the zones defined by the characteristic curves (such as areas of low performance and low efficiency) provides clear guidance for implementing corrective measures. This approach ensures that resources are allocated efficiently, maximizing the impact of improvements.
On the other hand, this paper also raises the significant difference between energy efficiency and energy performance. The former is presented as the net value of the specific energy consumption without considering the amount of production and is differentiated from the latter based on the connection with production. This is due to the use of the straight-line trend equation and its transformation to the curve that estimates the specific energy consumption concerning the amount of product. This study opens new opportunities to explore the combination of the proposed analytical tools with advanced machine learning and artificial intelligence techniques. These technologies could further improve the accuracy of real-time energy performance diagnosis and prediction, thus cementing the EGM’s role as a reference standard in industrial energy optimization.
Finally, while the analytical tools presented in this study demonstrate significant value for energy performance diagnosis, several limitations that point toward future research opportunities should be acknowledged. The quality of analysis heavily depends on data quality, affecting the PCLD and PCCD calculations, which is a particularly relevant challenge for facilities with limited data preprocessing capabilities. The proposed methodology assumes linear relationships between energy consumption and production. This assumption may not hold for all manufacturing scenarios with complex energy consumption patterns or multiple influencing factors beyond production volume. Additionally, the applicability of these tools may vary across different industrial processing environments, especially in facilities with highly variable production patterns. Despite these limitations, they open promising avenues for future research, including developing machine learning algorithms to enhance pattern recognition and predictive capabilities. Future efforts should focus on transforming these analytical tools into user-friendly decision support systems that can be readily integrated into existing production management workflows, potentially addressing the “energy efficiency paradox” while enabling real-time energy performance diagnostics to detect efficiency deviations in polymer processing operations immediately.

Author Contributions

Conceptualization, O.A.E.-R. and F.C.; formal analysis, O.A.E.-R.; funding acquisition, O.A.E.-R.; investigation, O.A.E.-R., N.A.M.-R., J.A.P.-M. and F.C.; methodology, O.A.E.-R., N.A.M.-R., J.A.P.-M. and F.C.; project administration, O.A.E.-R.; resources, O.A.E.-R., N.A.M.-R. and J.A.P.-M.; supervision, O.A.E.-R. and F.C.; validation, O.A.E.-R.; writing—original draft, N.A.M.-R. and J.A.P.-M.; writing—review and editing, J.A.P.-M. All authors have read and agreed to the published version of the manuscript.

Funding

This research was funded by the Colombian Ministry of Science and Technology—MINCIENCIAS through the project “Desarrollo de nuevas tecnologías avanzadas de la industria 4.0 para PyMES y MiPyMES de procesamiento de polímeros para el incremento de la eficiencia energética y productiva”, SIGP code 91911, contract 80740-127-2022.

Data Availability Statement

The datasets presented in this article are not readily available because the data are part of an ongoing study. Requests to access the datasets should be directed to oestrada@sospol.co.

Acknowledgments

The authors acknowledge that portions of the original manuscript were initially written in Spanish and later translated into English using the free version of DeepL Translator (https://www.deepl.com/es/translator). Subsequently, the authors carefully reviewed and refined the text to ensure accuracy, coherence, and adherence to scientific writing standards.

Conflicts of Interest

The authors declare no conflicts of interest. The funders had no role in the design of this study, the collection, analysis, or interpretation of data, the writing of the manuscript, or the decision to publish the results.

References

  1. Nicholson, S.R.; Rorrer, N.A.; Carpenter, A.C.; Beckham, G.T. Manufacturing Energy and Greenhouse Gas Emissions Associated with Plastics Consumption. Joule 2021, 5, 673–686. [Google Scholar] [CrossRef]
  2. May, G.; Psarommatis, F. Maximizing Energy Efficiency in Additive Manufacturing: A Review and Framework for Future Research. Energies 2023, 16, 4179. [Google Scholar] [CrossRef]
  3. International Energy Agency Energy Efficiency 2023—Analysis. Available online: https://www.iea.org/reports/energy-efficiency-2023 (accessed on 2 December 2024).
  4. Kamal, A.; Al-Ghamdi, S.G.; Koc, M. Revaluing the Costs and Benefits of Energy Efficiency: A Systematic Review. Energy Res. Soc. Sci. 2019, 54, 68–84. [Google Scholar] [CrossRef]
  5. Kent, R. Chapter 1-Cost Management. In Cost Management in Plastics Processing, 4th ed.; Kent, R., Ed.; Elsevier: Amsterdam, The Netherlands, 2018; pp. 3–44. ISBN 978-0-08-102269-6. [Google Scholar]
  6. Thollander, P.; Palm, J. Improving Energy Efficiency in Industrial Energy Systems: An Interdisciplinary Perspective on Barriers, Energy Audits, Energy Management, Policies, and Programs; Springer: London, UK, 2013; ISBN 978-1-4471-4161-7. [Google Scholar]
  7. Cai, W.; Wang, L.; Li, L.; Xie, J.; Jia, S.; Zhang, X.; Jiang, Z.; Lai, K. A Review on Methods of Energy Performance Improvement towards Sustainable Manufacturing from Perspectives of Energy Monitoring, Evaluation, Optimization and Benchmarking. Renew. Sustain. Energy Rev. 2022, 159, 112227. [Google Scholar] [CrossRef]
  8. Kazmer, D.; Peterson, A.M.; Masato, D.; Colon, A.R.; Krantz, J. Strategic Cost and Sustainability Analyses of Injection Molding and Material Extrusion Additive Manufacturing. Polym. Eng. Sci. 2023, 63, 943–958. [Google Scholar] [CrossRef]
  9. Keränen, T.; Enwald, H. Everyday Energy Information Literacy and Attitudes towards Energy-Related Decisions: Gender Differences among Finns. Resources 2023, 12, 70. [Google Scholar] [CrossRef]
  10. Koetse, M.J.; Groot, H.L.F.D.; Nijkamp, P. Barriers to Investment in Energy-Saving Technologies of Small Firms: The Energy-Efficiency Paradox Revisited. Stud. Reg. Sci. 2008, 38, 1–15. [Google Scholar] [CrossRef]
  11. Fresner, J.; Morea, F.; Krenn, C.; Aranda Uson, J.; Tomasi, F. Energy Efficiency in Small and Medium Enterprises: Lessons Learned from 280 Energy Audits across Europe. J. Clean. Prod. 2017, 142, 1650–1660. [Google Scholar] [CrossRef]
  12. Bunse, K.; Vodicka, M.; Schönsleben, P.; Brülhart, M.; Ernst, F.O. Integrating Energy Efficiency Performance in Production Management—Gap Analysis between Industrial Needs and Scientific Literature. J. Clean. Prod. 2011, 19, 667–679. [Google Scholar] [CrossRef]
  13. Kent, R. Chapter 1-Introduction to Energy Management. In Energy Management in Plastics Processing, 3rd ed.; Kent, R., Ed.; Elsevier: Amsterdam, The Netherlands, 2018; pp. 3–32. ISBN 978-0-08-102507-9. [Google Scholar]
  14. Diaz, C.J.L.; Ocampo-Martinez, C. Energy Efficiency in Discrete-Manufacturing Systems: Insights, Trends, and Control Strategies. J. Manuf. Syst. 2019, 52, 131–145. [Google Scholar] [CrossRef]
  15. Ma, S.; Huang, Y.; Cai, W.; Leng, J.; Xu, J. Integrated Sustainable Benchmark Based on Edge-Cloud Cooperation and Big Data Analytics for Energy-Intensive Manufacturing Industries. J. Manuf. Syst. 2024, 74, 1037–1056. [Google Scholar] [CrossRef]
  16. ElMaraghy, H.A.; Youssef, A.M.A.; Marzouk, A.M.; ElMaraghy, W.H. Energy Use Analysis and Local Benchmarking of Manufacturing Lines. J. Clean. Prod. 2017, 163, 36–48. [Google Scholar] [CrossRef]
  17. Wójcicki, K.; Biegańska, M.; Paliwoda, B.; Górna, J. Internet of Things in Industry: Research Profiling, Application, Challenges and Opportunities—A Review. Energies 2022, 15, 1806. [Google Scholar] [CrossRef]
  18. ISO 50001:2018; Sistemas de Gestión de La Energía—Requisitos Con Orientación Para Su Uso. International Organization for Standardization: Geneva, Switzerland, 2018.
  19. Fitzgerald, P.; Therkelsen, P.; Sheaffer, P.; Rao, P. Deeper and Persistent Energy Savings and Carbon Dioxide Reductions Achieved through ISO 50001 in the Manufacturing Sector. Sustain. Energy Technol. Assess. 2023, 57, 103280. [Google Scholar] [CrossRef]
  20. Costantini, V.; D’Angeli, M.; Mancini, M.; Martini, C.; Paglialunga, E. An Econometric Analysis of the Energy-Saving Performance of the Italian Plastic Manufacturing Sector. Energies 2024, 17, 811. [Google Scholar] [CrossRef]
  21. Estrada, O.; López, I.D.; Hernández, A.; Ortíz, J.C. Energy Gap Method (EGM) to Increase Energy Efficiency in Industrial Processes: Successful Cases in Polymer Processing. J. Clean. Prod. 2018, 176, 7–25. [Google Scholar] [CrossRef]
  22. Estrada Ramírez, O.A. Estudio de La Influencia Del Proceso de Plastificación En La Eficiencia Energética Del Proceso de Extrusión Monohusillo. Ph.D. Thesis, Universidad Nacional de Colombia, Bogota, Colombia, 2021. [Google Scholar]
  23. May, G.; Stahl, B.; Taisch, M.; Kiritsis, D. Energy Management in Manufacturing: From Literature Review to a Conceptual Framework. J. Clean. Prod. 2017, 167, 1464–1489. [Google Scholar] [CrossRef]
  24. Jallal, M.A.; González-Vidal, A.; Skarmeta, A.F.; Chabaa, S.; Zeroual, A. A Hybrid Neuro-Fuzzy Inference System-Based Algorithm for Time Series Forecasting Applied to Energy Consumption Prediction. Appl. Energy 2020, 268, 114977. [Google Scholar] [CrossRef]
  25. Wu, Q.; Ren, H.; Shi, S.; Fang, C.; Wan, S.; Li, Q. Analysis and Prediction of Industrial Energy Consumption Behavior Based on Big Data and Artificial Intelligence. Energy Rep. 2023, 9, 395–402. [Google Scholar] [CrossRef]
  26. Đaković, D.; Kljajić, M.; Milivojević, N.; Doder, Đ.; Anđelković, A.S. Review of Energy-Related Machine Learning Applications in Drying Processes. Energies 2023, 17, 224. [Google Scholar] [CrossRef]
  27. Siitonen, S.; Tuomaala, M.; Ahtila, P. Variables Affecting Energy Efficiency and CO2 Emissions in the Steel Industry. Energy Policy 2010, 38, 2477–2485. [Google Scholar] [CrossRef]
  28. Abeykoon, C.; Pérez, P.; Kelly, A.L. The Effect of Materials’ Rheology on Process Energy Consumption and Melt Thermal Quality in Polymer Extrusion. Polym. Eng. Sci. 2020, 60, 1244–1265. [Google Scholar] [CrossRef]
  29. Marchi, B.; Zanoni, S. Investments in Energy Efficiency with Variable Demand: SEC’s Shifting or Flattening? In Advances in Production Management Systems: Innovative Production Management Towards Sustainable Growth; Umeda, S., Nakano, M., Mizuyama, H., Hibino, N., Kiritsis, D., Von Cieminski, G., Eds.; IFIP Advances in Information and Communication Technology; Springer International Publishing: Cham, Switzerland, 2015; Volume 459, pp. 705–714. ISBN 978-3-319-22755-9. [Google Scholar]
  30. Zhou, L.; Li, J.; Li, F.; Meng, Q.; Li, J.; Xu, X. Energy Consumption Model and Energy Efficiency of Machine Tools: A Comprehensive Literature Review. J. Clean. Prod. 2016, 112, 3721–3734. [Google Scholar] [CrossRef]
  31. Kara, S.; Li, W. Unit Process Energy Consumption Models for Material Removal Processes. CIRP Ann. 2011, 60, 37–40. [Google Scholar] [CrossRef]
  32. Kent, R. Chapter 2-Energy Benchmarking. In Energy Management in Plastics Processing, 3rd ed.; Kent, R., Ed.; Elsevier: Amsterdam, The Netherlands, 2018; pp. 33–78. ISBN 978-0-08-102507-9. [Google Scholar]
  33. Lawrence, A.; Thollander, P.; Andrei, M.; Karlsson, M. Specific Energy Consumption/Use (SEC) in Energy Management for Improving Energy Efficiency in Industry: Meaning, Usage and Differences. Energies 2019, 12, 247. [Google Scholar] [CrossRef]
  34. Estrada, O.; Ortiz, J.C.; Hernández, A.; López, I.; Chejne, F.; del Pilar Noriega, M. Experimental Study of Energy Performance of Grooved Feed and Grooved Plasticating Single Screw Extrusion Processes in Terms of SEC, Theoretical Maximum Energy Efficiency and Relative Energy Efficiency. Energy 2020, 194, 116879. [Google Scholar] [CrossRef]
  35. Mahamud, R.; Li, W.; Kara, S. Energy Characterisation and Benchmarking of Factories. CIRP Ann. 2017, 66, 457–460. [Google Scholar] [CrossRef]
  36. Menghi, R.; Papetti, A.; Germani, M.; Marconi, M. Energy Efficiency of Manufacturing Systems: A Review of Energy Assessment Methods and Tools. J. Clean. Prod. 2019, 240, 118276. [Google Scholar] [CrossRef]
  37. Arabeyyat, O.S.; Ragha, L.A. The Use of Energy Management ISO 50001 to Increase the Effectiveness of Water Treatment Plants: An Application Study on the Zai Water Treatment Plant. MethodsX 2024, 12, 102661. [Google Scholar] [CrossRef]
  38. ISO 50006:2023; Energy Management Systems—Evaluating Energy Performance Using Energy Performance Indicators and Energy Baselines. International Organization for Standardization: Geneva, Switzerland, 2023.
  39. Cosgrove, J.; Doyle, F.; Littlewood, J.; Wilgeroth, P. A Methodology for Electricity Monitoring and Targeting (M&T) in an Irish Precision Engineering SME. Int. J. Sustain. Eng. 2017, 10, 233–240. [Google Scholar] [CrossRef]
  40. Roberts, J.G.; Hazel, B.G. Energy Monitoring and Targeting. J. Soc. Dye. Colour. 1985, 101, 180–183. [Google Scholar] [CrossRef]
  41. Afkhami, B.; Akbarian, B.; Beheshti, A.N.; Kakaee, A.H.; Shabani, B. Energy Consumption Assessment in a Cement Production Plant. Sustain. Energy Technol. Assess. 2015, 10, 84–89. [Google Scholar] [CrossRef]
  42. Gutowski, T.G.; Dahmus, J.B.; Thiriez, A. Electrical Energy Requirements for Manufacturing Processes. In Proceedings of the Proceedings of LCE, Leuven, Belgium, 31 May–2 June 2006; pp. 623–628. [Google Scholar]
  43. Prias Caicedo, O.F.; Campos Avell, J.C.; Rojas Rodríguez, D.B.; Palencia Salas, A. Implementación de un Sistema de Gestión de la Energía: Guía con Base en la Norma ISO 50001, 2nd ed.; RED COLOMBIANA DE CONOCIMIENTO EN EFICIENCIA ENERGÉTICA-RECIEE: Bogotá, Colombia, 2019; ISBN 978-958-761-597-5. [Google Scholar]
  44. Benedetti, M.; Cesarotti, V.; Introna, V. From Energy Targets Setting to Energy-Aware Operations Control and Back: An Advanced Methodology for Energy Efficient Manufacturing. J. Clean. Prod. 2017, 167, 1518–1533. [Google Scholar] [CrossRef]
  45. Taner, T.; Sivrioğlu, M.; Topal, H.; Dalkılıç, A.S.; Wongwises, S. A Model of Energy Management Analysis, Case Study of a Sugar Factory in Turkey. Sādhanā 2018, 43, 42. [Google Scholar] [CrossRef]
  46. Kent, R.J. Energy Management in Plastics Processing: Strategies, Targets, Techniques, and Tools, 4th ed.; British Plastics Federation: London, UK, 2024; ISBN 978-1-399-98641-0. [Google Scholar]
  47. Asuero, A.G.; Sayago, A.; González, A.G. The Correlation Coefficient: An Overview. Crit. Rev. Anal. Chem. 2006, 36, 41–59. [Google Scholar] [CrossRef]
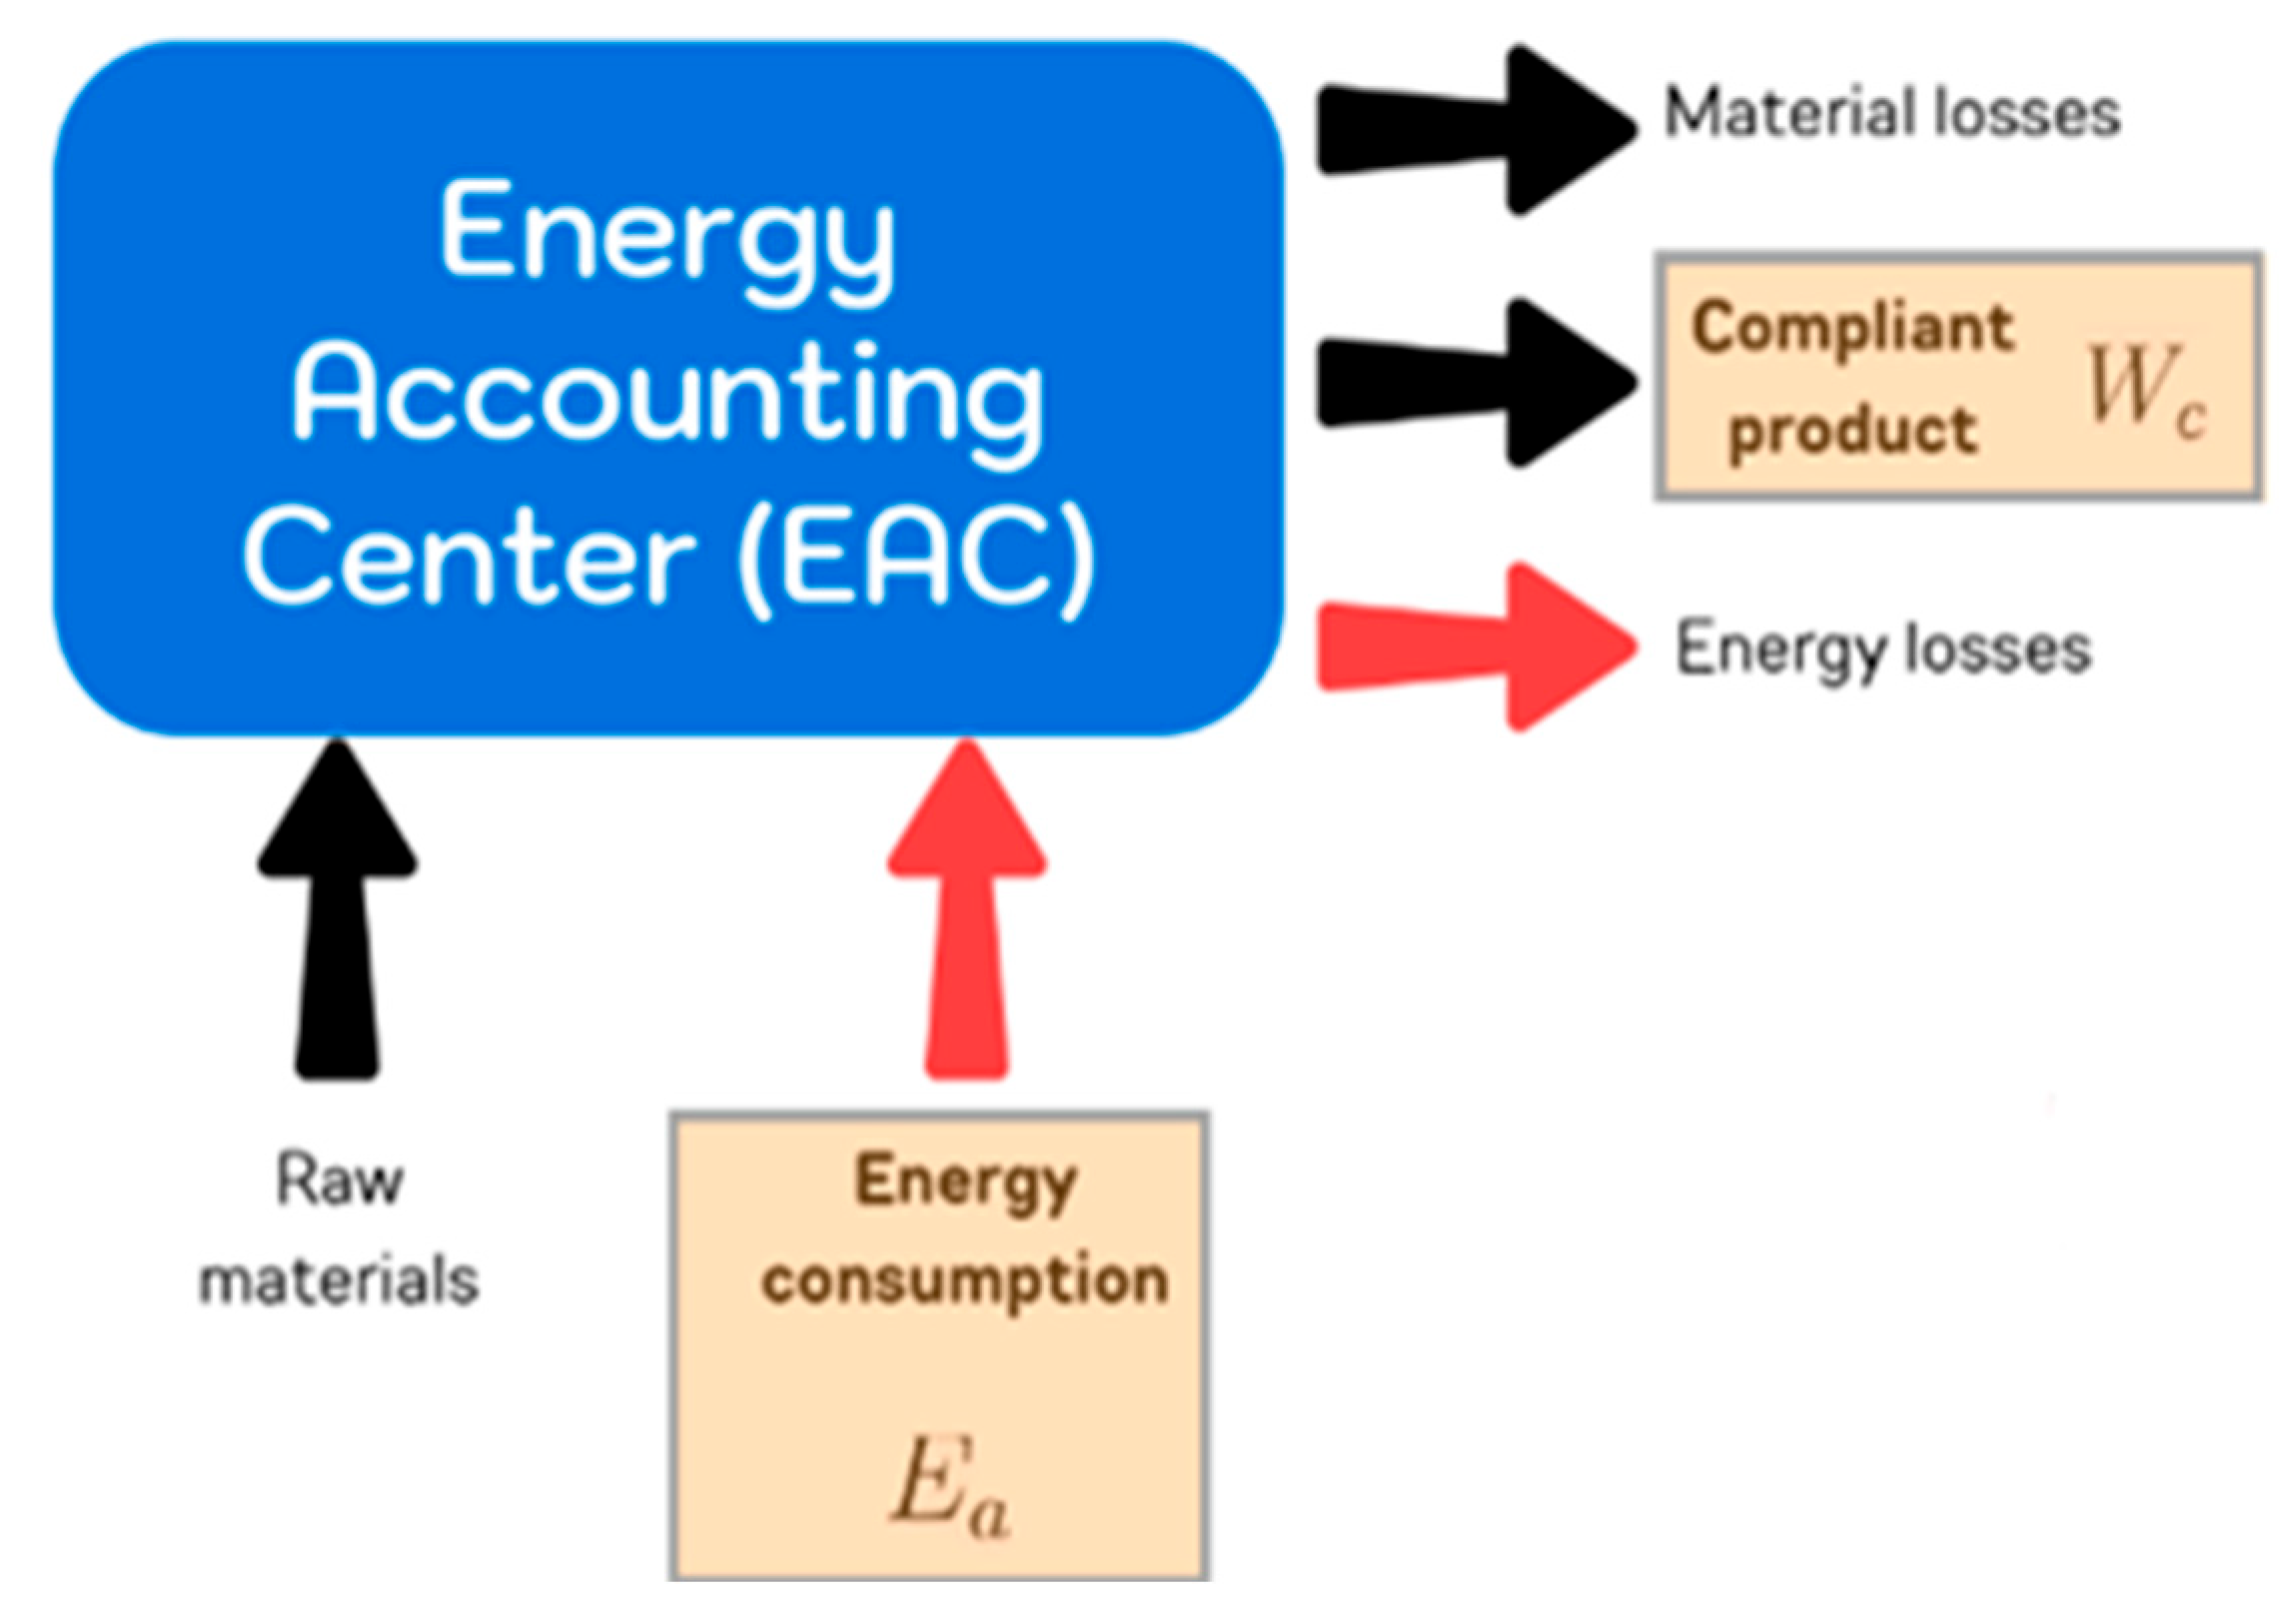
Figure 1. A diagram for an Energy Accounting Center (EAC) [21] including inputs and outputs. E a denotes the energy consumption in the EAC and W c is the compliant production.
Resources 14 00060 g001
Figure 2. Depiction of the six different SEC levels and the corresponding five energy gaps in the EGM [21].
Resources 14 00060 g002
Figure 3. An illustrative diagram of energy consumption versus compliant production showing both the PCLD (blue) and the ABTD (yellow).
Resources 14 00060 g003
Figure 4. The Performance Characteristic Curve for Diagnostics (PCCD) for S E C n from the PCLD (blue) and the corresponding S E C n a v e r a g e (red). The different background colors identify the performance vs. efficiency zones.
Resources 14 00060 g004
Figure 5. The PCLD diagram for the vulcanized rubber profile extruder when operating with a melt pump (red) and without a melt pump (brown).
Resources 14 00060 g005
Figure 6. The PCCD diagram for the vulcanized rubber profile extruder with a melt pump (red) and without a melt pump (brown).
Resources 14 00060 g006
Figure 7. Plot of average demand in steady-state operation vs. mass flow for the vulcanized rubber extruder operating without a melt pump.
Resources 14 00060 g007
Figure 8. Plot of average demand in steady-state operation vs. mass flow for the vulcanized rubber extruder with a pump (yellow) and without a melt pump for formula 1 (red) and formula 2 (brown).
Resources 14 00060 g008
Figure 9. Plot of S E C s vs. mass flow for the vulcanized rubber extruder with a pump (brown) and without a melt pump for formula 1 (red) and formula 2 (yellow).
Resources 14 00060 g009
Figure 10. Demand versus time graphs for Production Order 888961, working with mold MOL4143 and part number 2-1004817. (a) Plot throughout the entire production period. (b) Demand versus time plot attenuated to 1/20 and with the determination of fixed consumption and average demand under steady-state production conditions.
Resources 14 00060 g010
Figure 11. The PCLD diagram of energy consumption versus production composition. (a) The PCLD when the compliant production is classified per injection mold used. (b) The PCLD when the compliant production is classified by each produced reference.
Resources 14 00060 g011
Figure 12. The ABTD (brown) and PCLD (red) diagrams when the compliant production is classified per injection mold used.
Resources 14 00060 g012
Figure 13. The PCCD of S E C n for thermoplastic injection line. (a) The PCCD when the compliant production is classified per injection mold. (b) The PCCD when the compliant production is classified by reference product.
Resources 14 00060 g013aResources 14 00060 g013b
Figure 14. The PCCD analysis for the PCLD (red) and ABTD (yellow) when the compliant production is classified per injection mold. The minimum recommended production per mold assembly (CP*) is highlighted for each curve.
Resources 14 00060 g014
Figure 15. Graph of S E C s vs. effective productivity per mold (yellow) and average demand in steady-state operation vs. effective productivity (red line, in the upper right corner). The minimum recommended production per mold assembly (CP*) is highlighted in dotted lines (brown).
Resources 14 00060 g015
Table 1. Comparison of reported studies on energy analysis and assessment using SEC or M&T tools.
ArticleClassificationStrategies & ToolsIndicator
[45]Energy analysisCUSUM, M&T-
[35]Energy analysisRegression analysisSEC
[44]Energy assessmentISO 50006, M&TEnergy performance indicator (EnPI)
[39]Energy assessmentISO 50001, M&TKey performance indicator (KPI)
[21]Energy assessmentEnergy Gap MethodSEC
Table 2. Consolidated consumption and production information for the EAC of the thermoplastic injection line.
ParameterValueUnits
Number of production orders analyzed299None
Start date of analysis8 August 2023 23:22Date and time
End date of analysis24 January 2024 14:00Date and time
Consumption for the period36,217.7kWh
Total production for the period41,824.89kg
Compliant production for the period40,689.47kg
Non-compliant production for the period1135.42kg
Total production time for the period3738.13h
Total downtime for the period817.25h
Effective production time of the period2920.88h
Average actual productivity of the period10.88kg/h
Average effective productivity of the period14.32kg/h
SECn for the period0.890kWh/kg
Table 3. SEC values of molds with satisfactory energy performance and low energy efficiency.
MoldSECn [kWh/kg]SECn Average [kWh/kg]Compliant Production [kg]SECn PCCD [kWh/kg]SECn-SECn PCCD
[kWh/kg]
SECn-SECn Average
[kWh/kg]
MOL137392.67300.8934.06.5028−3.82981.7830
MOL80811.34190.8941.65.4286−4.08670.4519
MOL7061.26370.8975.43.2831−2.01940.3737
MOL140871.18080.89330.91.2386−0.05780.2908
MOL140821.16450.89365.91.1809−0.01650.2745
MOL68831.14770.89272.91.3668−0.21910.2577
MOL89681.14490.89163.61.8558−0.71100.2549
MOL143191.12790.89126.02.2193−1.09140.2379
MOL140371.12080.89293.91.3145−0.19370.2308
MOL64461.09490.8995.32.7311−1.63620.2049
MOL83220.92890.8971.13.4430−2.51410.0389
MOL137392.67300.8934.06.5028−3.82981.7830
Table 4. SEC values for molds with poor energy performance and low energy efficiency.
MoldSECn [kWh/kg]SECn Average [kWh/kg]Compliant Production [kg]SECn PCCD [kWh/kg]SECn-SECn PCCD
[kWh/kg]
SECn-SECn Average
[kWh/kg]
MOL848121.27970.8926.78.111913.167820.3897
MOL145753.16160.89419.01.11172.04992.2716
MOL78612.02540.89632.40.95101.07441.1354
MOL43411.54820.89236.71.47880.06940.6582
MOL152021.48170.89945.30.84650.63520.5917
MOL152821.40270.89715.20.91440.48830.5127
MOL152031.22900.89955.50.84420.38470.3390
MOL152291.18200.89510.21.02650.15550.2920
MOL152161.17180.89801.00.88450.28730.2818
MOL68641.15040.89604.30.96560.18470.2604
MOL152071.11530.89771.50.89410.22120.2253
MOL89641.04320.89938.60.84800.19520.1532
MOL39790.89150.891929.80.73870.15280.0015
Table 5. Characteristics and differences between the Monitoring and Targeting (M&T) methodology and the Energy Gap Method (EGM).
M&TEGM with Proposed Tools
It is a control methodology.Diagnostic method
Analyses are performed for selected energy cost centers.Analyses are performed for selected energy cost centers.
It uses the determination of the Performance Characteristic Line, the determination of the objective based on the activity, the Performance Characteristic Curve, and the CUSUM diagrams as tools to establish the consumption behavior.It employs Monitoring and Targeting tools such as the PCLD, ABTD, and PCCD, which are used in diverse ways to determine energy gaps and detect production elements that require specific actions.
The analysis is performed over given periods of time, and information about consumption and compliant production is obtained at regular time intervals, which can be days, weeks, or months.The analysis is conducted using criteria such as products, molds, references, materials, heads, and machines, so the analysis periods are not regular.
The tools are used at regular time intervals to perform continuous and comparative consumption analysis, allowing early decisions to be made and ensuring compliance with the goals.The tools are used when necessary to determine the causes of a specific performance or observed efficiency of the EAC, define actions, and ensure compliance with the goals.
Disclaimer/Publisher’s Note: The statements, opinions and data contained in all publications are solely those of the individual author(s) and contributor(s) and not of MDPI and/or the editor(s). MDPI and/or the editor(s) disclaim responsibility for any injury to people or property resulting from any ideas, methods, instructions or products referred to in the content.