Article

Evaluation of the Migration Potential of Printed Plastic Films into the Aquatic Environment

Institute of Energy and Fuel Processing Technology, Zamkowa 1, 41-803 Zabrze, Poland
Resources 2025, 14(4), 58; https://doi.org/10.3390/resources14040058
Submission received: 28 January 2025 / Revised: 21 March 2025 / Accepted: 25 March 2025 / Published: 31 March 2025
(This article belongs to the Special Issue Risk Assessment of Water Resources)

Abstract

:
This study aimed to evaluate the degree of contamination of water matrices (deionised water, spring water, tap water) in a 14-week experiment using film samples from commercial bags printed with water- and solvent-based inks. The effect of different lighting conditions on leaching and ecotoxicity was also investigated. Samples were exposed for 24 h to natural sunlight and to no light in a darkroom. A significant increase in contaminants in the aqueous matrices was observed in regard to the 12-week leaching potential of the components from the films in regard to all the lighting variants and aqueous matrices analysed: an increase in dissolved organic carbon (DOC), total organic carbon (TOC), and total suspended solids (TSS). Based on the procedures carried out, the relationship between the lighting conditions and the amount of the constituents released into the aqueous matrices was not confirmed. The concentration of total organic carbon in all the samples peaked between weeks 6 and 9 of the study, followed by a gradual reduction in leaching. This phenomenon could be linked to the gradual depletion of the substances present in the samples or to the achievement of a concentration equilibrium between the aqueous matrix and the sample and/or to the formation of deposits on the surface of the films, which hindered the migration of the substances into the solutions. Ecotoxicity tests performed between 7 and 14 weeks showed most samples’ toxic and highly toxic effects on the growth of Lemna minor fronds and Sinapis alba/Lepidium sativum roots. In contrast, no toxic effects were observed in regard to most of the samples during screening mortality tests on Daphnia magna and Artemia salina. This study highlights the need for further research into the effects of plastic pollution on the aquatic environment.

1. Introduction

Plastic products are an integral part of our daily lives. Disposable packaging, nearly 40% of the total production, are lightweight, inexpensive, and durable [1,2]. It is estimated that nearly 5% of plastic is transported through wastewater, inland waterways, wind, and tides, ultimately ending up in the marine environment [3,4]. It is estimated that 6 million tons of plastic ends up in rivers or shorelines each year, of which 1.7 million tons ends up in the ocean [5].
The most common plastics in the water environment are polyethylene (PE), polypropylene (PP), polyethylene terephthalate (PET), and nylon [6]. Plastic waste is the most abundant form of waste found in water and is highly fragmented during degradation. During its decomposition, polychlorinated biphenyls (PCBs) and dioxins are released into the sea or rivers, and microplastics are formed. The factors that make them resistant to degradation include its high molecular weight, highly stable C-C and C-H bonds, highly hydrophobic character, and a lack of easily oxidising groups that undergo hydrolysis [4,5,6]. Experimental studies also confirm the presence of metallic compounds in plastic leachates. However, the studies on the matter are not consistent, due to the large diversity in the production methods of plastics [7,8].
Plastic products are not toxic per se, but they can, when deposited in the microbenthos, cause changes in biochemical degradation processes. Degradation is the partial or complete breakdown of a polymer, under the influence of environmental factors, such as temperature, light, water, mechanical action, and microorganisms [6,9].
Both biodegradable and conventional bags create anoxic conditions in sediments, which are caused by blocking oxygen access to sediments. The consequences of altered aerobic conditions include a change in the structure of benthic communities, and a decrease in organic matter content, and also a reduction in the concentration of chlorophyll a and c, as a result of covering the bottom of aquatic environments with waste, which causes a decrease in the biomass content of primary producers in the sediment [2]. The result is a reduction in the amount of available food for organisms at higher trophic levels.
Conventional plastics show high resistance to aging and minimal biological degradation. However, factors that significantly accelerate the process include water salinity, UVB radiation, and the oxidative effects of oxygen [10,11]. Hydrolytic degradation, thermo-oxidative degradation, photo-degradation, biodegradation, and mechanical degradation can occur. However, photo-degradation is considered the dominant mechanism. The degradation rate increases with increasing temperature and oxygen availability. Material deterioration occurs through pitting, cracking, discoloration, increased brittleness, decreased elasticity, erosion, and, ultimately, the formation of smaller pieces of material -macro- and microplastics [1].
An additional factor that increases the harmful effects of plastics on aquatic environments is the presence of organic and inorganic additives, such as dyes, pigments, plasticisers, antioxidants, stabilisers, and metals [10]. Heavy metals, including cadmium and lead, are contained in pigments used to make plastic bags. High concentrations of copper, zinc, and barium have been reported in samples, due to their presence in pink and yellow pigments in plastics made of polyethylene film [12,13]. In addition, temperature and insolation affect the leaching of metals [14]. Dyes are classified as secondary contaminants [14]. Furthermore, solvents and lubricants are used at various stages of production and are present in detectable amounts in polyethylene products [13,14,15].
Plastic materials are often made more attractive through the use of printing techniques, flexographic printing works well for flexible substrates. Polyethylene film in roll form is ideal for use in regard to this technique [16]. Most films require preparation before the printing process is started. In particular, films widely used in the packaging industry, namely PE and PP, need to be activated before printing to raise their very low level of free energy.
Flexographic printing uses low viscosity liquid inks, typically water-based inks, solvent-based inks, and UV-curable inks [16]. Printing is carried out using a plate made of synthetic rubber, a photopolymer. Raster rollers are responsible for transferring the appropriate amount of ink. The rollers are made of a steel or an aluminium core coated with ceramic or carbon fibre [16]. Modern water-based inks are used in flexographic printing for economic and environmental reasons. The concentration of the pigment in water-based inks is higher than in solvent-based inks. This reduces ink consumption, eliminates solvent fumes, and reduces the flammability of inks. For environmental and health reasons, traditional inks containing organic solvents are being replaced by water-based inks. However, their presence in the environment can still pose problems [17].
Water-based inks can have poorer printing properties than solvent-based inks [17,18]. In contrast, the incorporation of new ink ingredients enables them to be applied to non-absorbent substrates, guaranteeing high quality printing. The chemical basis of water-based inks is similar to that of solvent-based inks; they contain binders in the form of resins, pigments, and additives that improve adhesion and abrasion resistance, etc. Water-based paints have lower total VOC emissions. On the other hand, these paints contain more reactive or polar compounds, including biocides, glycols, glycol ethers, and other solvents with a high molecular weight [19]. However, the content of organic solvents in water-based inks should not exceed 1% [16]. Their viscosity allows for a sharp raster dot. Low-density polyethylene (LDPE) and high-density polyethylene (HDPE) can be distinguished among polyethylene films [16,18]. Their advantages include the ability to print on absorbent and non-absorbent substrates, fast ink drying, and high printing speed. Most layered pigments are based on a substrate material, such as mica, alumina, silica, glass, iron oxide, graphite, or aluminium flakes [20]. Pearl pigments, especially gold and red pigments, have increased adhesion. Lightfastness is a very important parameter characterizing the quality of prints [20]. The share of water-based inks in terms of the flexographic ink market has been increasing for about 10 years, mainly due to the environmental aspects [21].
The aim of this study was to evaluate the migration potential of components present in/on flexographically printed polyethylene films into the aqueous environment. The influence of various water matrices, as well as light conditions, on changes in the physicochemical and ecotoxicological quality of the solutions was evaluated.

2. Materials and Methods

2.1. Study Material

Low-density polyethylene (LDPE) film samples, with dimensions of 3 × 3 cm and a thickness of 30 ± 5 microns, were the subjects of this study. Flexographic printing was performed using a printing form made of plastic, placed on raster rollers. Three individual film fragments were selected for each analysis, with a total coverage of the raster surface of the control fields ranging from 70 to 75%. The samples with the same foil characteristics were designated with the symbols AP (1), L (2), D (3), and MK (4). The samples labelled MK (4) were characterised by the multitonality of the overprint obtained by the raster printing. A large number of small raster dots creates colour transitions, but also causes overlapping of successive layers of ink. The print on the samples marked AP (1), D (3), and MK (4) was made with water-based inks, while the print on sample L (2) was made with solvent-based inks. All the samples were t-shirt bags commonly used in the retail trade (however, these were fresh products that had not been used before).
Figure 1a–l presents a summary of the images taken with an optical microscope (magnification: 4×, 10×), showing the quality of the print at strategic points, such as edges and tonal transitions. Changes within these locations were analysed throughout the study.

2.2. Experiment Procedure

The film samples were placed in closed transparent glass 150 mL reactors with different water solutions (matrix): deionised water, medium mineralised water (spring water), and tap water. Selected physicochemical parameters of the water matrices on day “0” of the study are shown in Table 1. The effect of the duration/type of illumination in the reactors (0 h/natural day light/24 h) on the sample–illumination relationship was also evaluated. Darkroom analyses (0 h) were conducted in constant temperature (21 °C) and humidity (10%) conditions. The samples placed in an incubator in varying temperature and humidity conditions (laboratory location: Gliwice, Poland) were illuminated for the entire study period (24 h) using a light bulb (light colour temperature: 4000 K; light angle: 360°; lumens: 470 mL) or in natural day light conditions (research from 1st March to 3rd June 2023; lumens: 100–750 mL; ambient temperature: 19–22 °C). Any losses in the volume of the matrix solutions due to evaporation were replenished three times a week, always after sampling as part of the ongoing analyses. Replenishing the matrix during the taking of measurements carries the risk of errors being introduced. That is why it was conducted many times a week, and the loss of liquid in the reactors never exceeded 1 mL. The sample was taken before replenishing the incubators with “fresh” matrix. This was to ensure better mixing of the samples over time, and to limit the sudden decrease in the amount of impurities in the sample due to their dilution. The study was conducted for 14 weeks, including 12 weeks of matrix sampling for the determination of selected physicochemical parameters. In the 7th, 9th, 10th, and 14th week of the study, samples were collected for the ecotoxicological analyses. Six independent replicates were prepared for each analysed variant (sample–matrix interaction analysis).

2.3. Physicochemical Analyses

The pH was determined by the potentiometric method, while the conductivity was determined by conductometry (multi-parameter meter inoLab® 740/WTW, Measuring and Analytical Technical Equipment, Warsaw, Poland). The content of dissolved substances in the water matrices was periodically measured using a portable meter (digital multi-parameter meter, HQ1000, Hach, Hachioji, Japan). The turbidity of the samples was determined using a portable Turbidimeter (TN-100/EUTECH Instruments, Waltham, Canning Vale, WA, USA). The absorbance of the filtered samples was determined using a single beam spectrophotometer (UV VIS Cecil 1000, Analytik Jena AG, Jena, Germany). The optical path length of the cuvette was 1 cm. The UVA254 value was determined based on the measurement method provided by the US EPA [22], and the final result was expressed in m–1. The concentration of total organic carbon and dissolved organic carbon (after using a 0.45 µm syringe filter) was determined by catalytic combustion, with a detection limit of 4 μg/L (TOC-L series, Shimadzu, Kyoto, Japan).
The presented results are average values (with standard deviation) from six independent measurements for each of the analysed variants of the water matrix, lighting conditions, and a sample of the printed foil. Most detailed results are summarized in the Supplementary Materials.

2.4. Ecotoxicological Assessment

2.4.1. Lemna Minor Inhibition Test

The assessment of the changes in the phytotoxicity involved a method that was based on the OECD recommendations [23], using L. minor as the indicator organism. The assessment of the phytotoxicity of the matrices was made based on the observation of either stimulation or inhibition of the growth in the number of fronds in regard to a 7-day test (from day t1 = 0 to day t2 = 7). The results are presented as the mean values of three performed repetitions. The control vessel contained fresh matrices that were used for the research. The average specific growth rate for a specific period is calculated as the logarithmic increase in the growth variables, namely the frond numbers, using the formula detailed below for each replicate of the control and treatments:
μ i j = ( ln N j l n ( N i ) t
where μi-j is the average specific growth rate from time i to j; Ni is the measurement variable in the test or control vessel at time i; Nj is the measurement variable in the test or control vessel at time j; and t is the time period from i to j.
The percentage inhibition of the growth rate (Ir(%)) may then be calculated for each test concentration (treatment group), according to the following formula:
I r % = μ C μ T μ C · 100
where Ir is the percentage inhibition in regard to the average specific growth rate; μC is the mean value for μ in the control sample; and μT is the mean value for μ in the treatment group. Negative frond growth inhibition values mean that stimulation of their growth occurred. To estimate the size of the toxic effect in the form of the percentage inhibition of frond growth, a toxicity classification was used, according to which [24]: Ir < 25%—non-toxic, Ir = 25.1–50%—low toxicity, Ir = 50–75%—toxic, Ir = 75.1–100%—high toxicity, Ir < 0%—growth simulation.

2.4.2. Germination Test

Germination tests were carried out using watercress (Lepidium sativum) and white mustard (Sinapis alba). A total of 5 mL of the test sample was poured into a Petri dish, and then 10 L. sativum and S. alba seeds were sown using each of the samples; the plates were placed in a laboratory incubator (Elkon) at a temperature of 25 ± 0.5 °C. The number of sprouted seeds and the length of the roots were measured after 72 h.
The presented results are the mean values of three performed repetitions. The phytotoxicity test included a test with fresh matrices, as well as the control. The examined effects of the phytotoxicity included the relative seed germination (RSG), the plant’s relative root growth (RRG), and the germination index (GI) [24,25]:
R S G % = n u m b e r   o f   s e e d s   g e r m i n a t e d   i n   t e s t   s a m p l e n u m b e r   o f   s e e d s   g e r m i n a t e d   i n   c o n t r o l · 100
R R G % = m e a n   r o o t   l e n g h t   i n   t e s t   s a m p l e m e a n   r o o t   l e n g h t   i n   c o n t r o l · 100
G I % = ( R S G · R R G ) 100
The toxicity classification, presented in Table 2, was used to interpret the germination index values [24,25].

2.4.3. Crustacean Mortality Test

The Daphnia magna mortality screening test was conducted, based on the US EPA recommendations [26]. The organisms came from own test culture. For the test, 5 mL samples of the aqueous solutions were used, which were placed in test wells, and then newborn crustaceans (10 individuals) were introduced into them. The plates were incubated at 20 °C in the dark. Determination of the number of immobilised or killed organisms was made after 48 h for each of the samples and the control sample (using an optical microscope, ×10 magnification), which is a standard medium for the cultivation of Daphnia magna. The toxic effect was defined as the percentage of killed and/or immobilised test organisms, E (%).
Similarly, the mortality test involving Artemia salina crustacean larvae was carried out. The organisms were obtained from a test culture created according to our own methodology, based on the experience presented in the literature [27]. The studies were carried out in the second/third stage of larval development, which is considered the most sensitive time. In regard to the analysed samples, 5 mL of the sample was placed into the test well, and then 10 larvae were introduced. The number of dead and/or immobilised organisms was determined after 48 h of the test (using an optical microscope, ×10 magnification). The toxicity effect E (%) was calculated for each of the samples of the tested aqueous solutions of the matrices and the control sample, which was a brine solution used for the cultivation of crustaceans (6):
E % = 100 · ( E K E T ) E K
where EK is the observed effect of the control sample, and ET is the observed effect of the test sample (water matrices with foil samples). According to accepted standards, an animal was considered dead when it was immobile, i.e., unable to swim, or no movement of the limbs or anus was observed within 15 s after gently moving the test container. The results were related to the duration of the observation in a given test. A system was used for the classification of the toxicity, which is based on the magnitude of the observed toxicity effect E (%) induced in the indicator organism used [28].
The MS Excel Analysis ToolPak (2023) add-in was used for the statistical processing of the data.

3. Results and Discussion

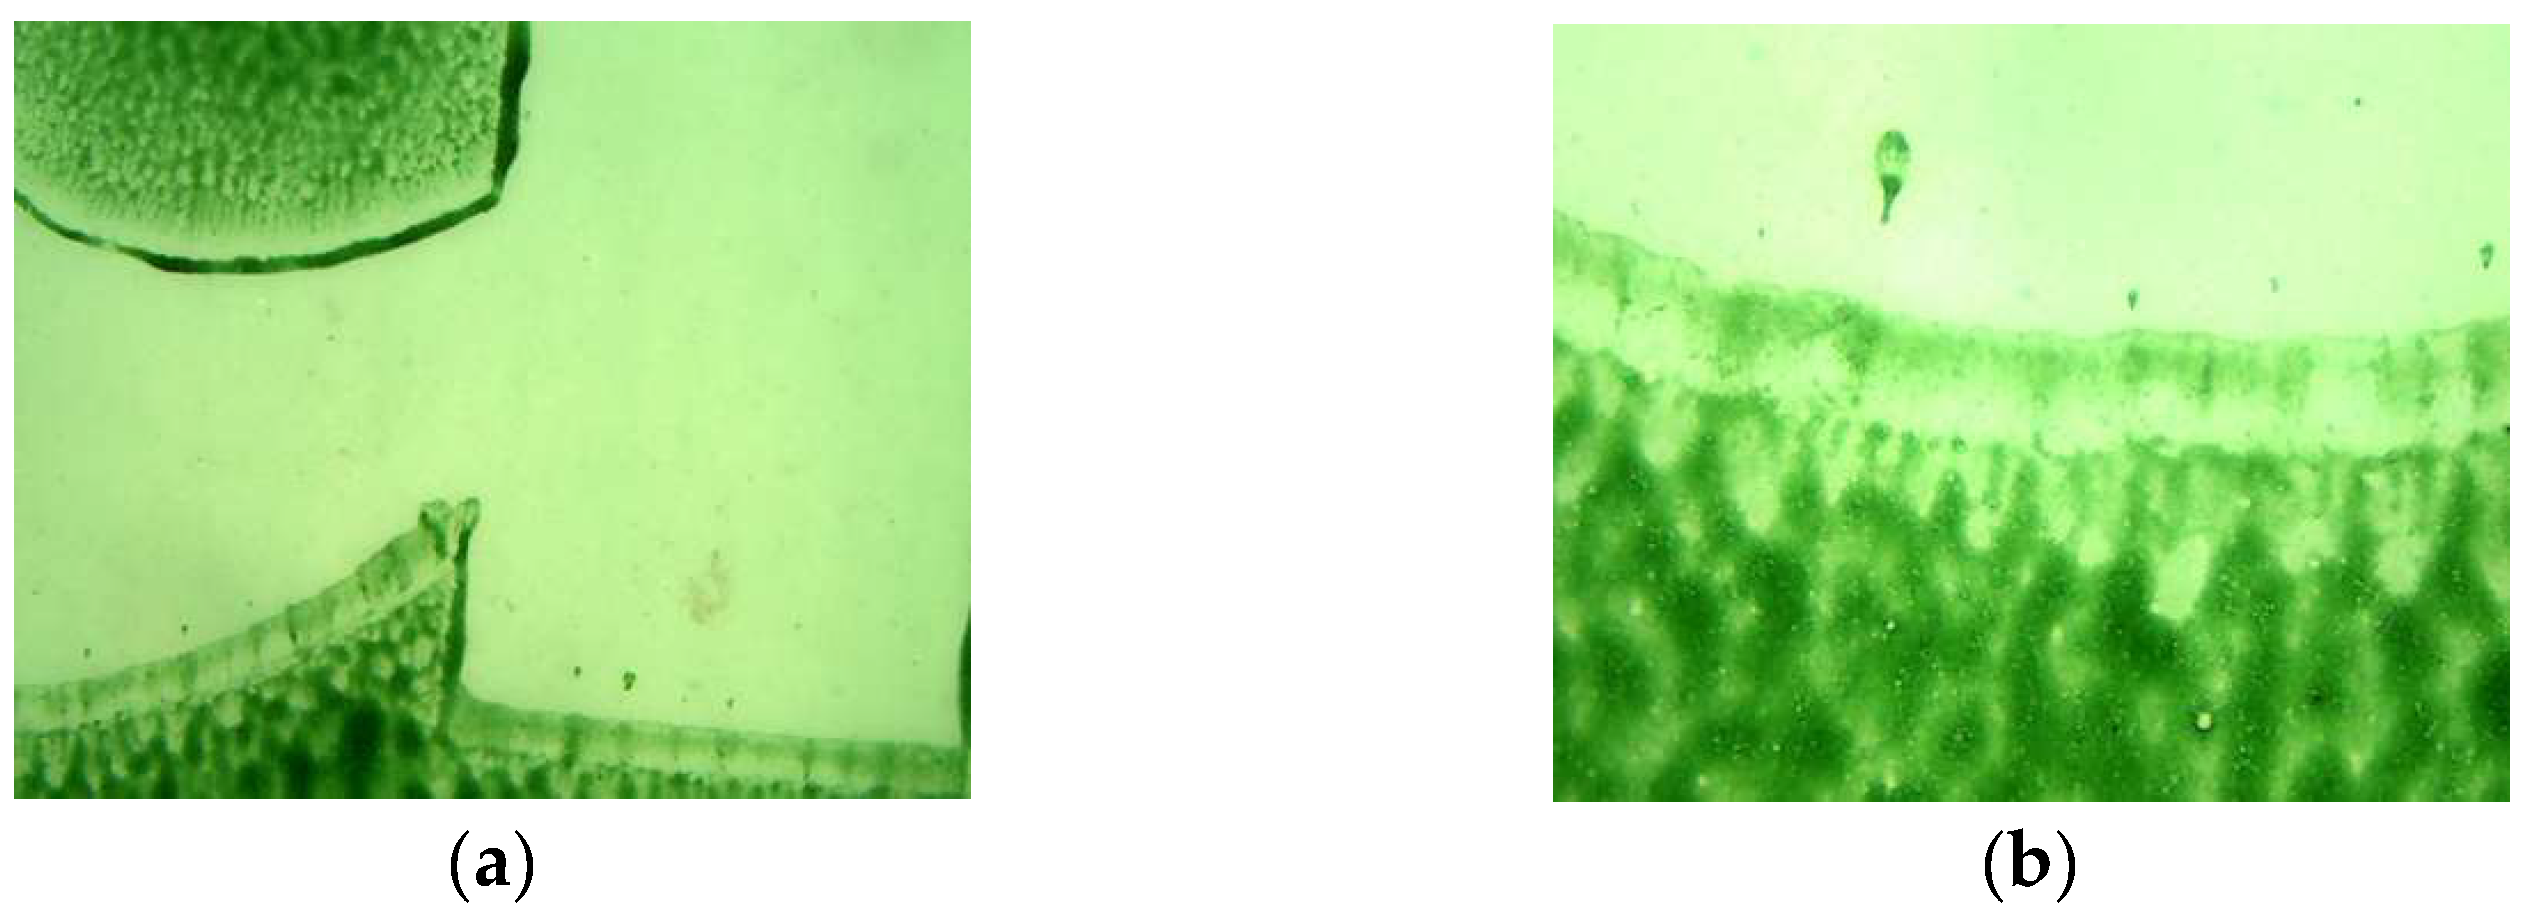
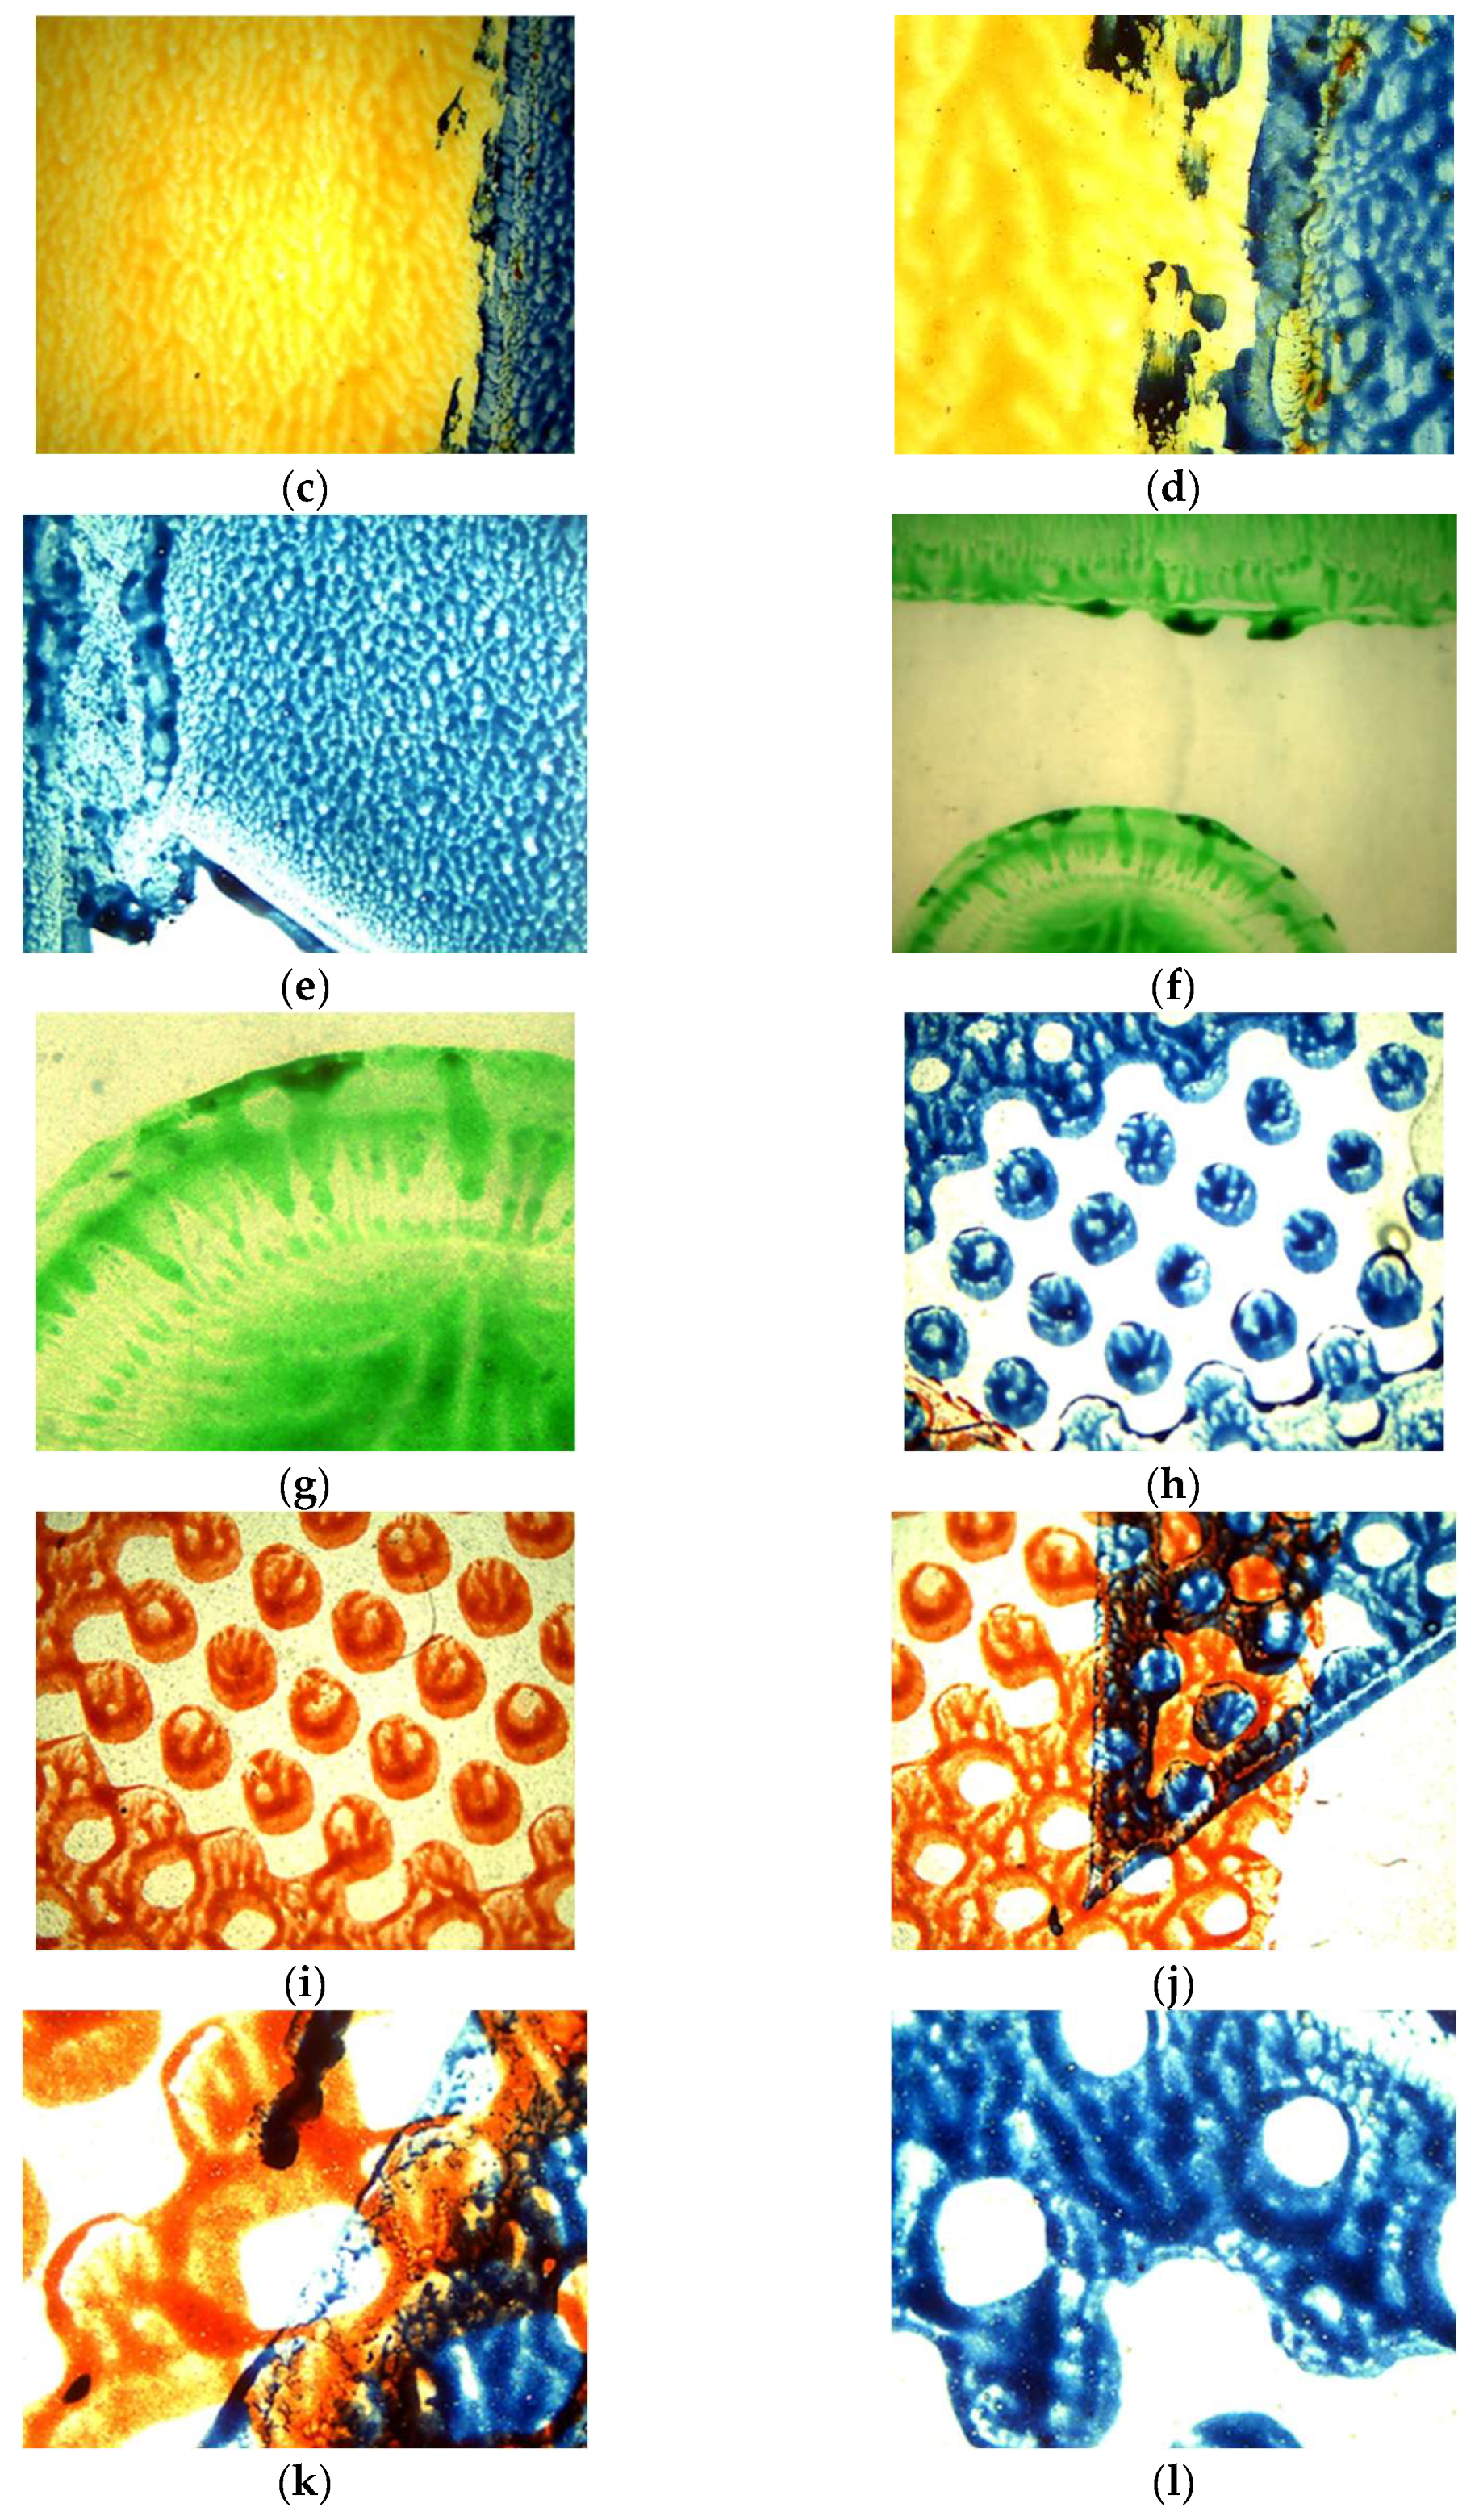
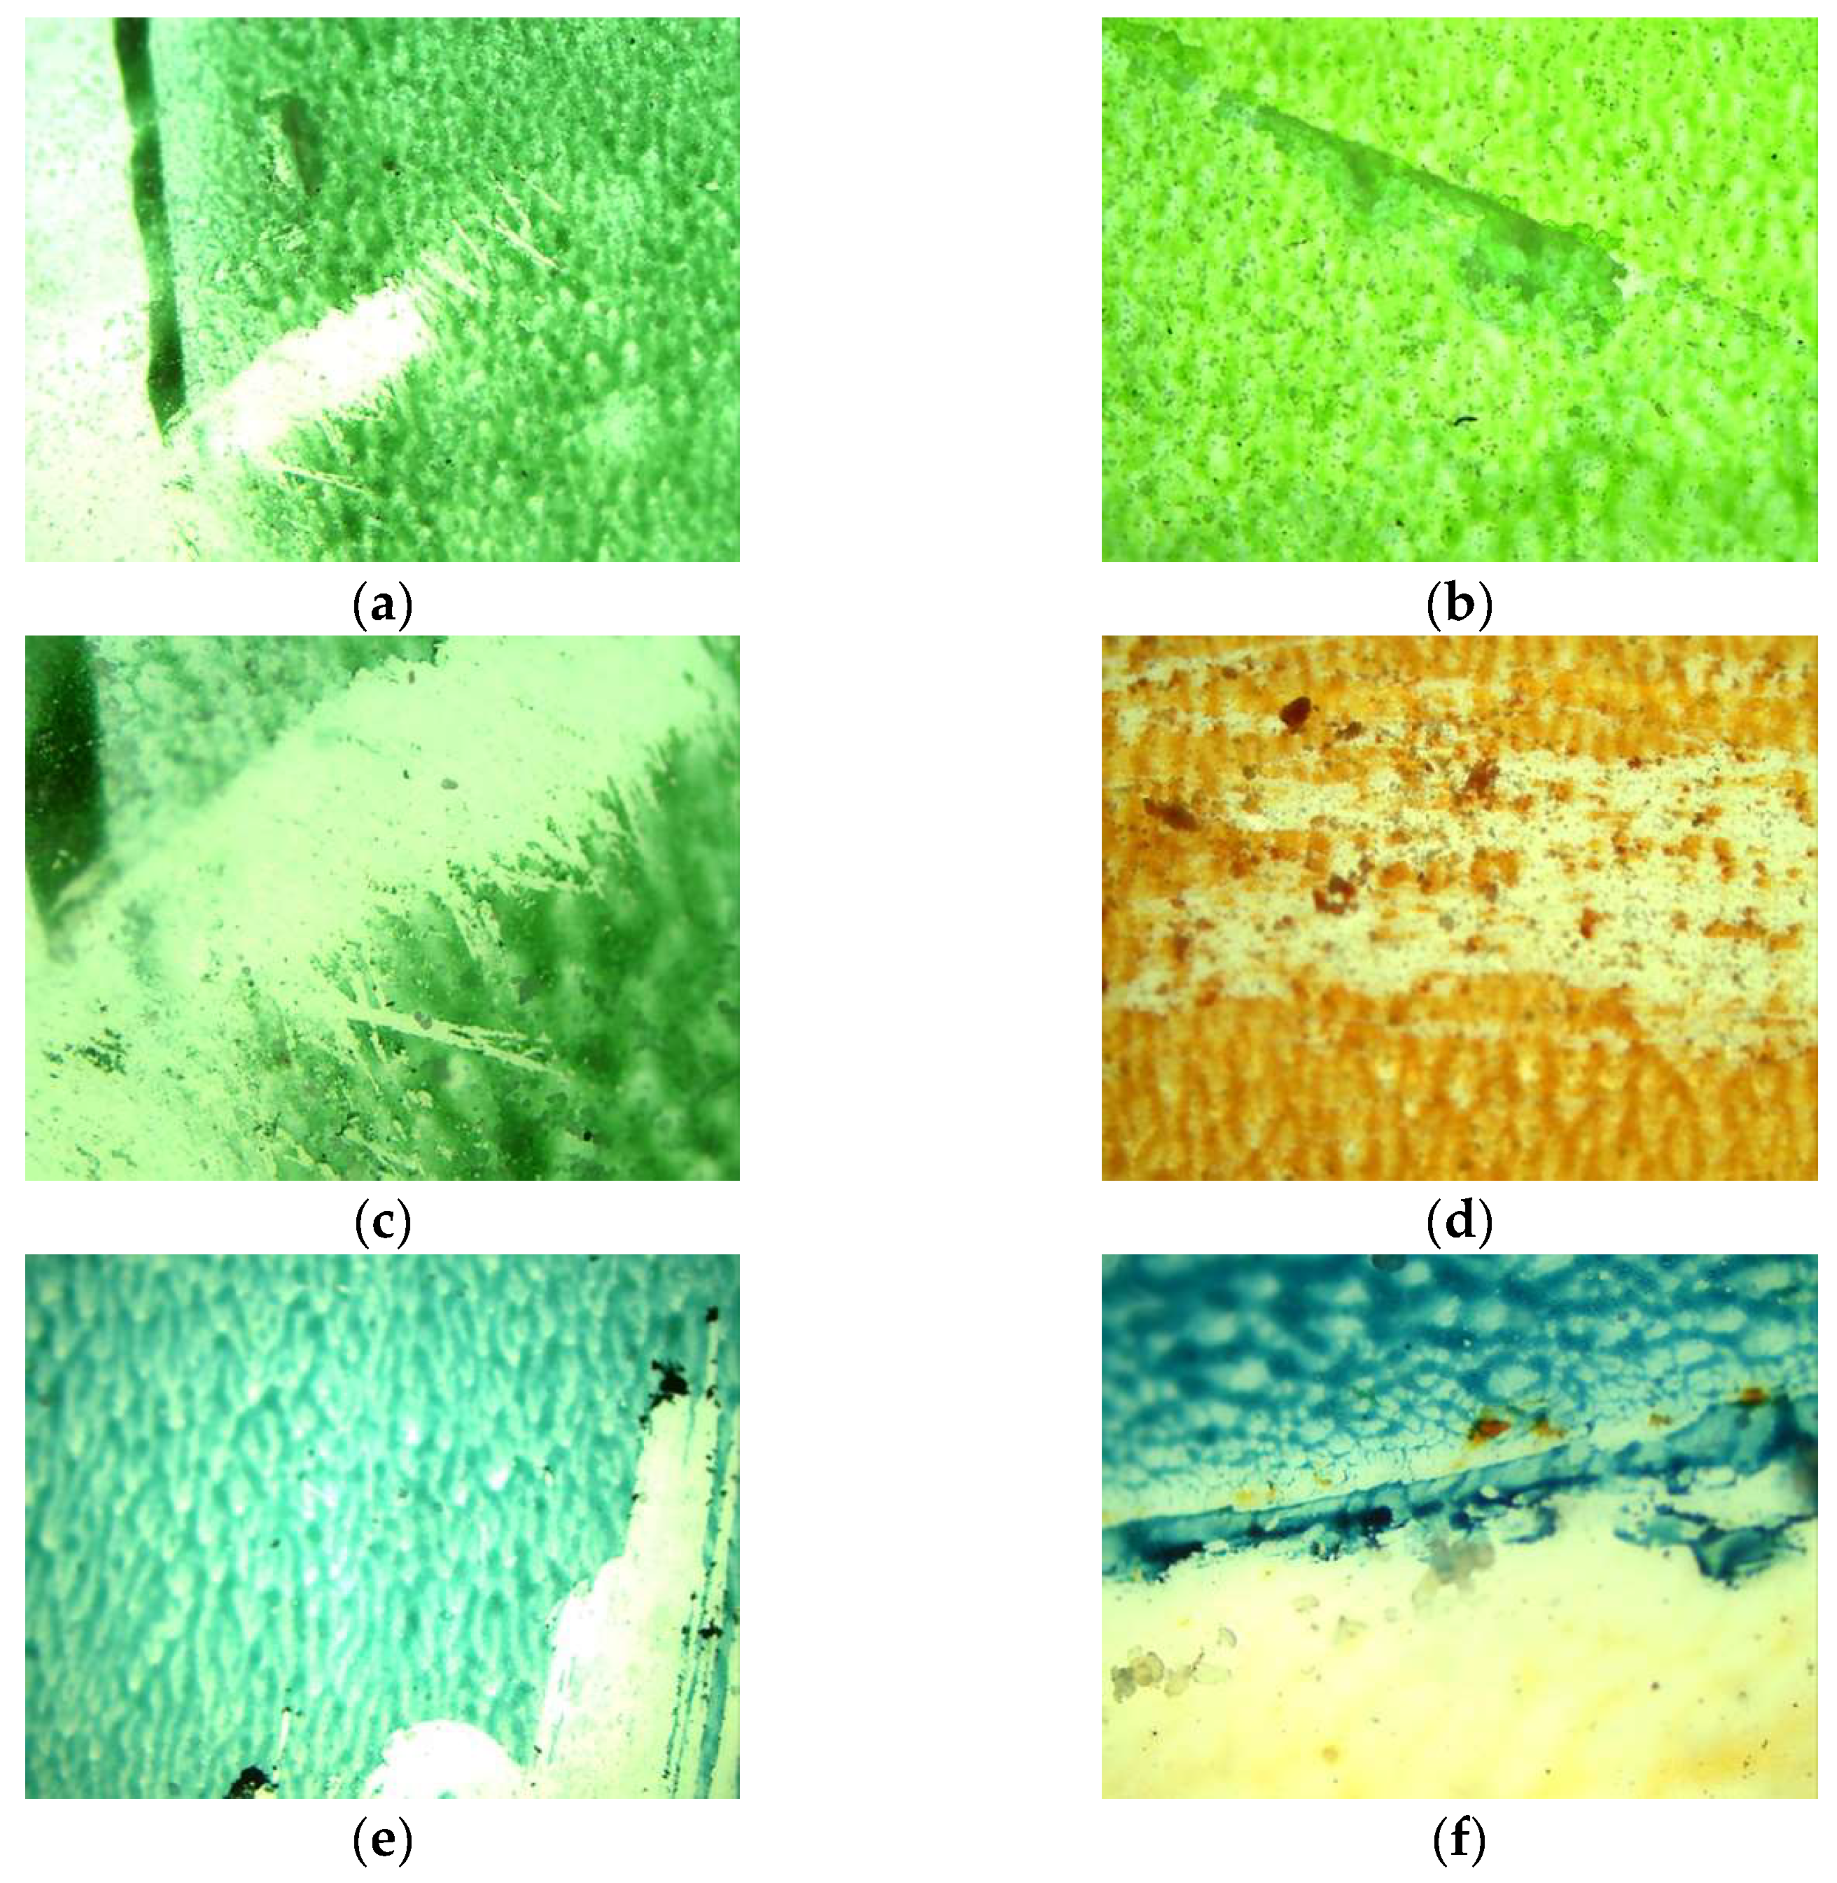
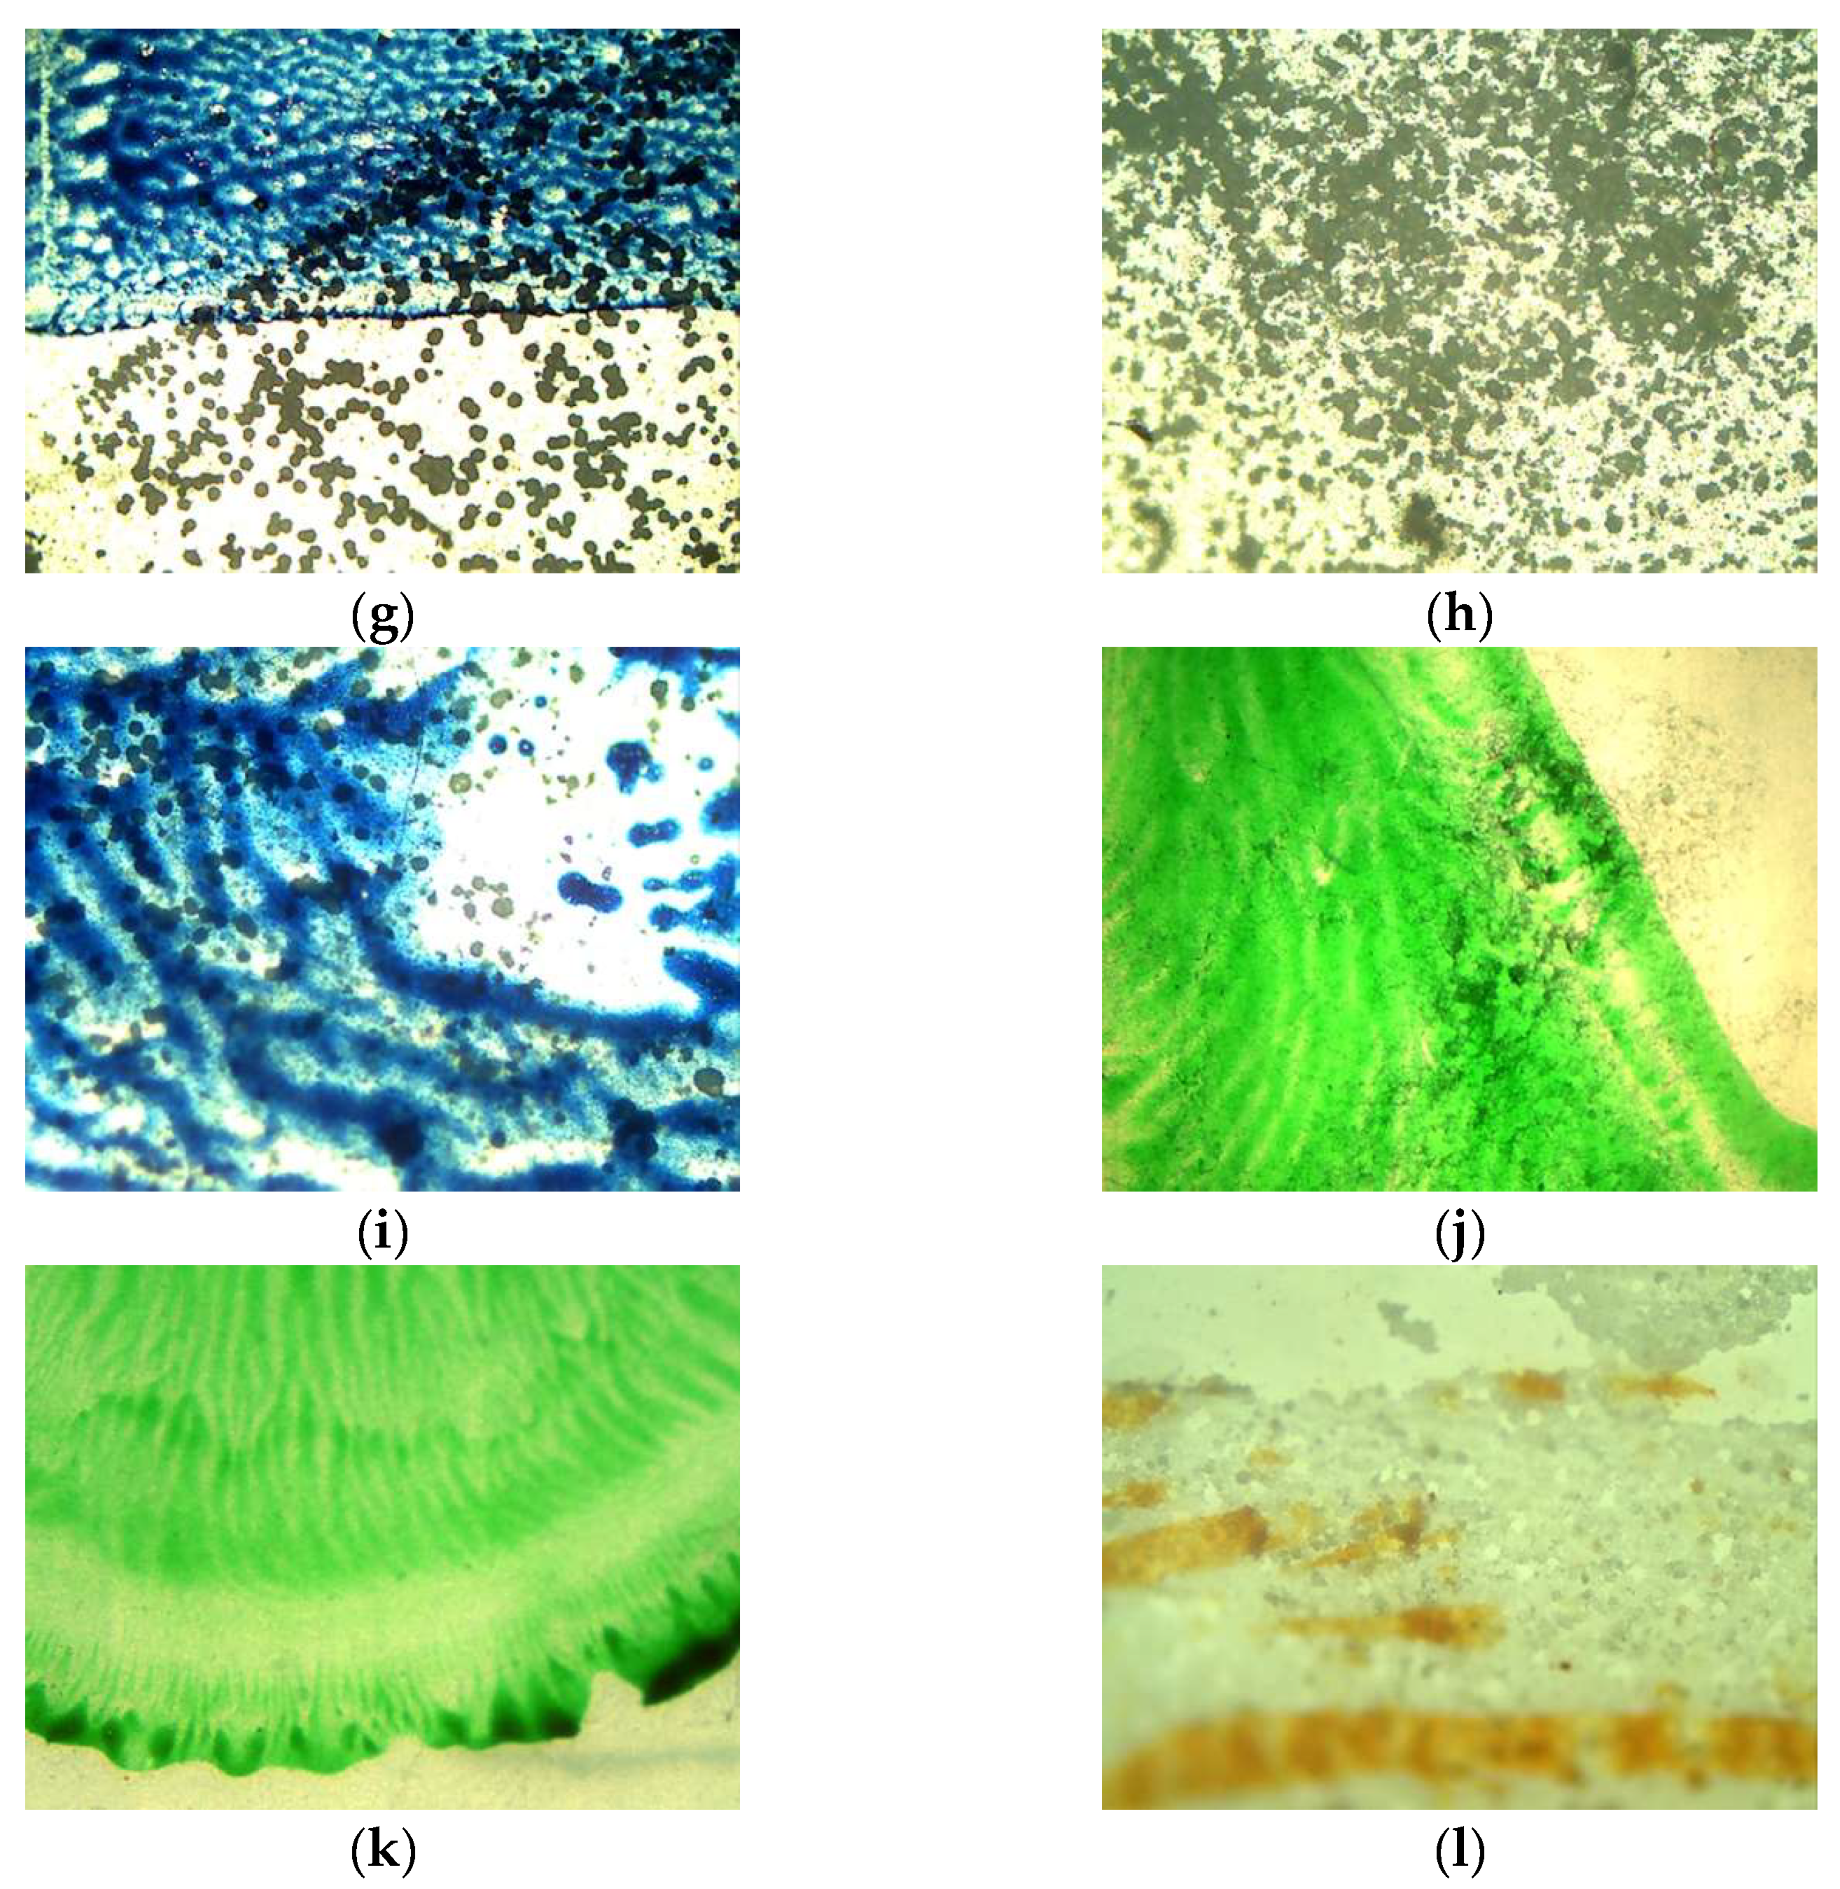
3.1. Visual Characteristics of the Changes in Film and Print Quality

After penetrating into the aquatic environment, plastics will gradually degrade, resulting in weight loss, a change in appearance due to the fading or washing of prints, deterioration of the mechanical properties, and an increase in the brittleness of the plastic [13]. Most of the symptoms of plastic surface degradation described in the literature occurred in the course of the conducted experiments. The appearance of the samples at the beginning of the experiment and after 14 weeks of contact with the aqueous matrices was compared. Selected sample images are presented in Figure 1 (the condition of the samples at the beginning of the experiment) and Figure 2 (the condition of the samples after 14 weeks). An increase in the brittleness of the film samples was observed for samples AP (1), D (3), and MK (4), but to a lesser extent for sample L (2). Differences were also reported in terms of print quality after the experiments. Prints made with water-based dyes (AP (1), D (3)) were less durable (Figure 2a–e). The dye was easily washed off, scratched off, and the colour was lighter. Among the water-based dyes, raster printing proved to be more durable (Figure 2g,i). In the case of a print made with solvent-based dye (L (2)), slight changes in the print quality (within the shape of the dots) and no discolouration were observed (Figure 2k). Moreover, in the matrices involving tap water and spring water subject to 24 h of illumination and natural light, persistent mineral deposits formed on the film samples (Figure 2d,g–i,l). A dependence between the film quality, print condition, and the amount of illumination used was observed. Although changes in the film structure, an increase in brittleness (assessed using force and touch) and damage to the print, were also observed in the darkroom, in stable conditions, and at a constant temperature, these changes were much smaller than those of the illuminated samples (in regard to the visual evaluation method).
Because the experiment was conducted under controlled conditions, simulating only some of the factors present in natural aquatic ecosystems, the degradation of the materials was much slower. Studies show that film fragments placed in the natural environment degrade abiotically within the first few weeks, but that biotic degradation is faster due to biofilm adhesion (approximately 4 weeks). The successive accumulation of organisms on the surface of plastics immersed in water takes place in the natural environment. However, the type of polymer, the size of the available surface, or its roughness have an impact on the course of this process. The formation of cracks, cavities, or a grooved texture is usually observed in plastics collected in the field. The deterioration of plastics, the reduction in their mechanical properties, leads to gradual disintegration, fragmentation, and the formation of microplastics, which have various properties [29]. The water matrices used in the experiments presented here were not sterile, but contained little microbial contamination that could have come from the environment, namely air or biofilms present in the water systems from which the tap water was collected. Therefore, it is assumed that they did not contribute significantly to the degradation of the plastic samples during the tests.
Plastics may show increased persistence at the bottom of reservoirs, seabeds, and in sediments, due to the reduced impact of UV radiation, lower temperatures, or lower oxygen concentrations, which translates into slower degradation [30,31]. Such observations have been confirmed in darkroom experiments.
Studies focus strongly on the impact of the marine environment on the degradation and decomposition of plastics, while less attention has been paid to the impact of the freshwater environment [2,32]; thus, this paper focuses on these aquatic matrices. In freshwater environments, photodegradation constitutes the main factor contributing to the deterioration of plastic samples. Freshwater environments differ from marine environments in terms of the physico-chemical and biological properties of water, including the spectrum and intensity of sunlight [13,33]. Sunlight is crucial in terms of changing the structure of plastics, as well as the properties of the prints themselves. As the intensity of light increases, the rate of photo-oxidation and, thus, the rate of plastic decomposition also increase [33,34]. The second significant factor consists of temperature, which promotes thermodegradation. In natural conditions, plastic degradation starts with photodegradation, followed by hydrolysis and thermo-oxidation processes. And the plastic breaks down into low-molecular-weight compounds that can then be metabolised by microorganisms [35,36]. Abiotic thermodegradation increases with increasing temperature, with the rate of reaction doubling for every 10 degrees C. Temperature has an impact on the mobility of polymer chains, which then influences the enzymatic activity during microbial degradation and also the rate of hydrolysis through free radical formation, the oxygen diffusion rate, and moisture content [29,35,37]. In the conducted experiments, constant temperature conditions were ensured only in the darkroom (21 °C), while the samples exposed to natural light and 24 h lighting were subject to variable diurnal conditions (18 to 25°). Conditions in favour of plastic degradation and fragmentation in the aquatic environment may increase in the future due to climate change. The observed increase in global temperatures works in favour of rising temperatures in aquatic environments and prolonged periods of hot weather due to intense solar radiation [38,39], which may translate into an increase in microplastic particles and chemicals leaching from plastics. This relationship between climate change and microplastics has already been confirmed by Ferreira et al., 2020 [40].

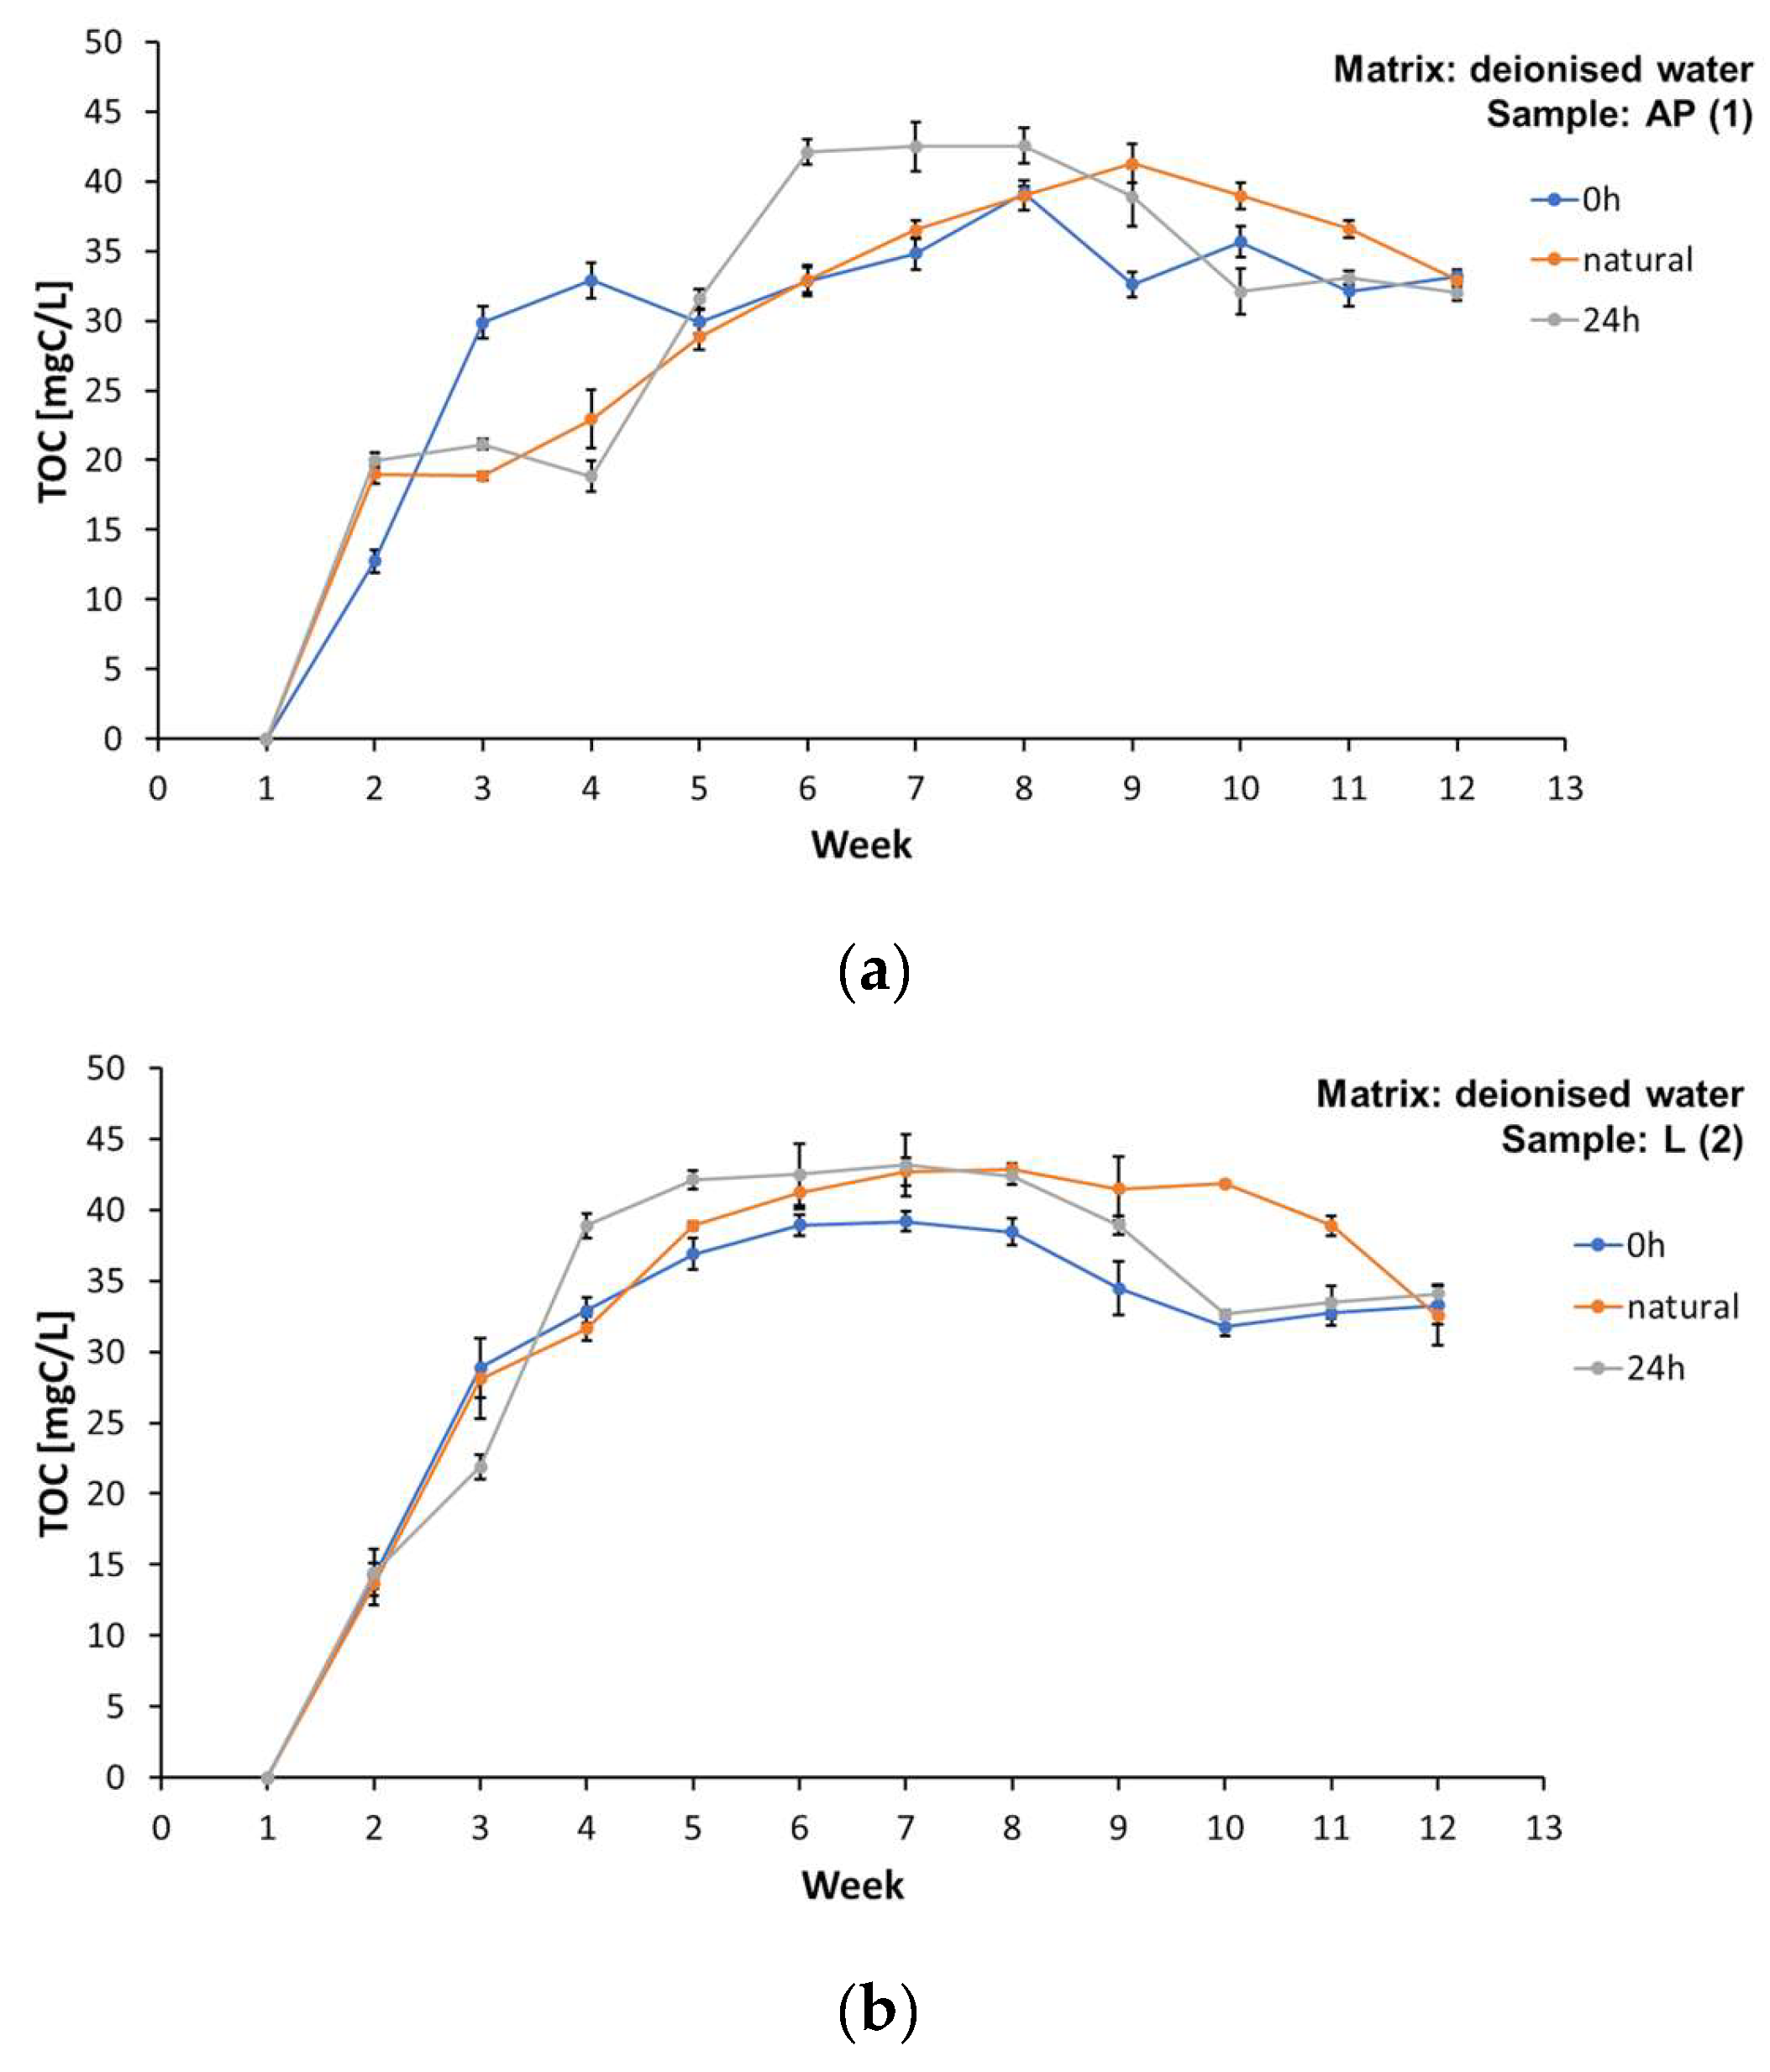
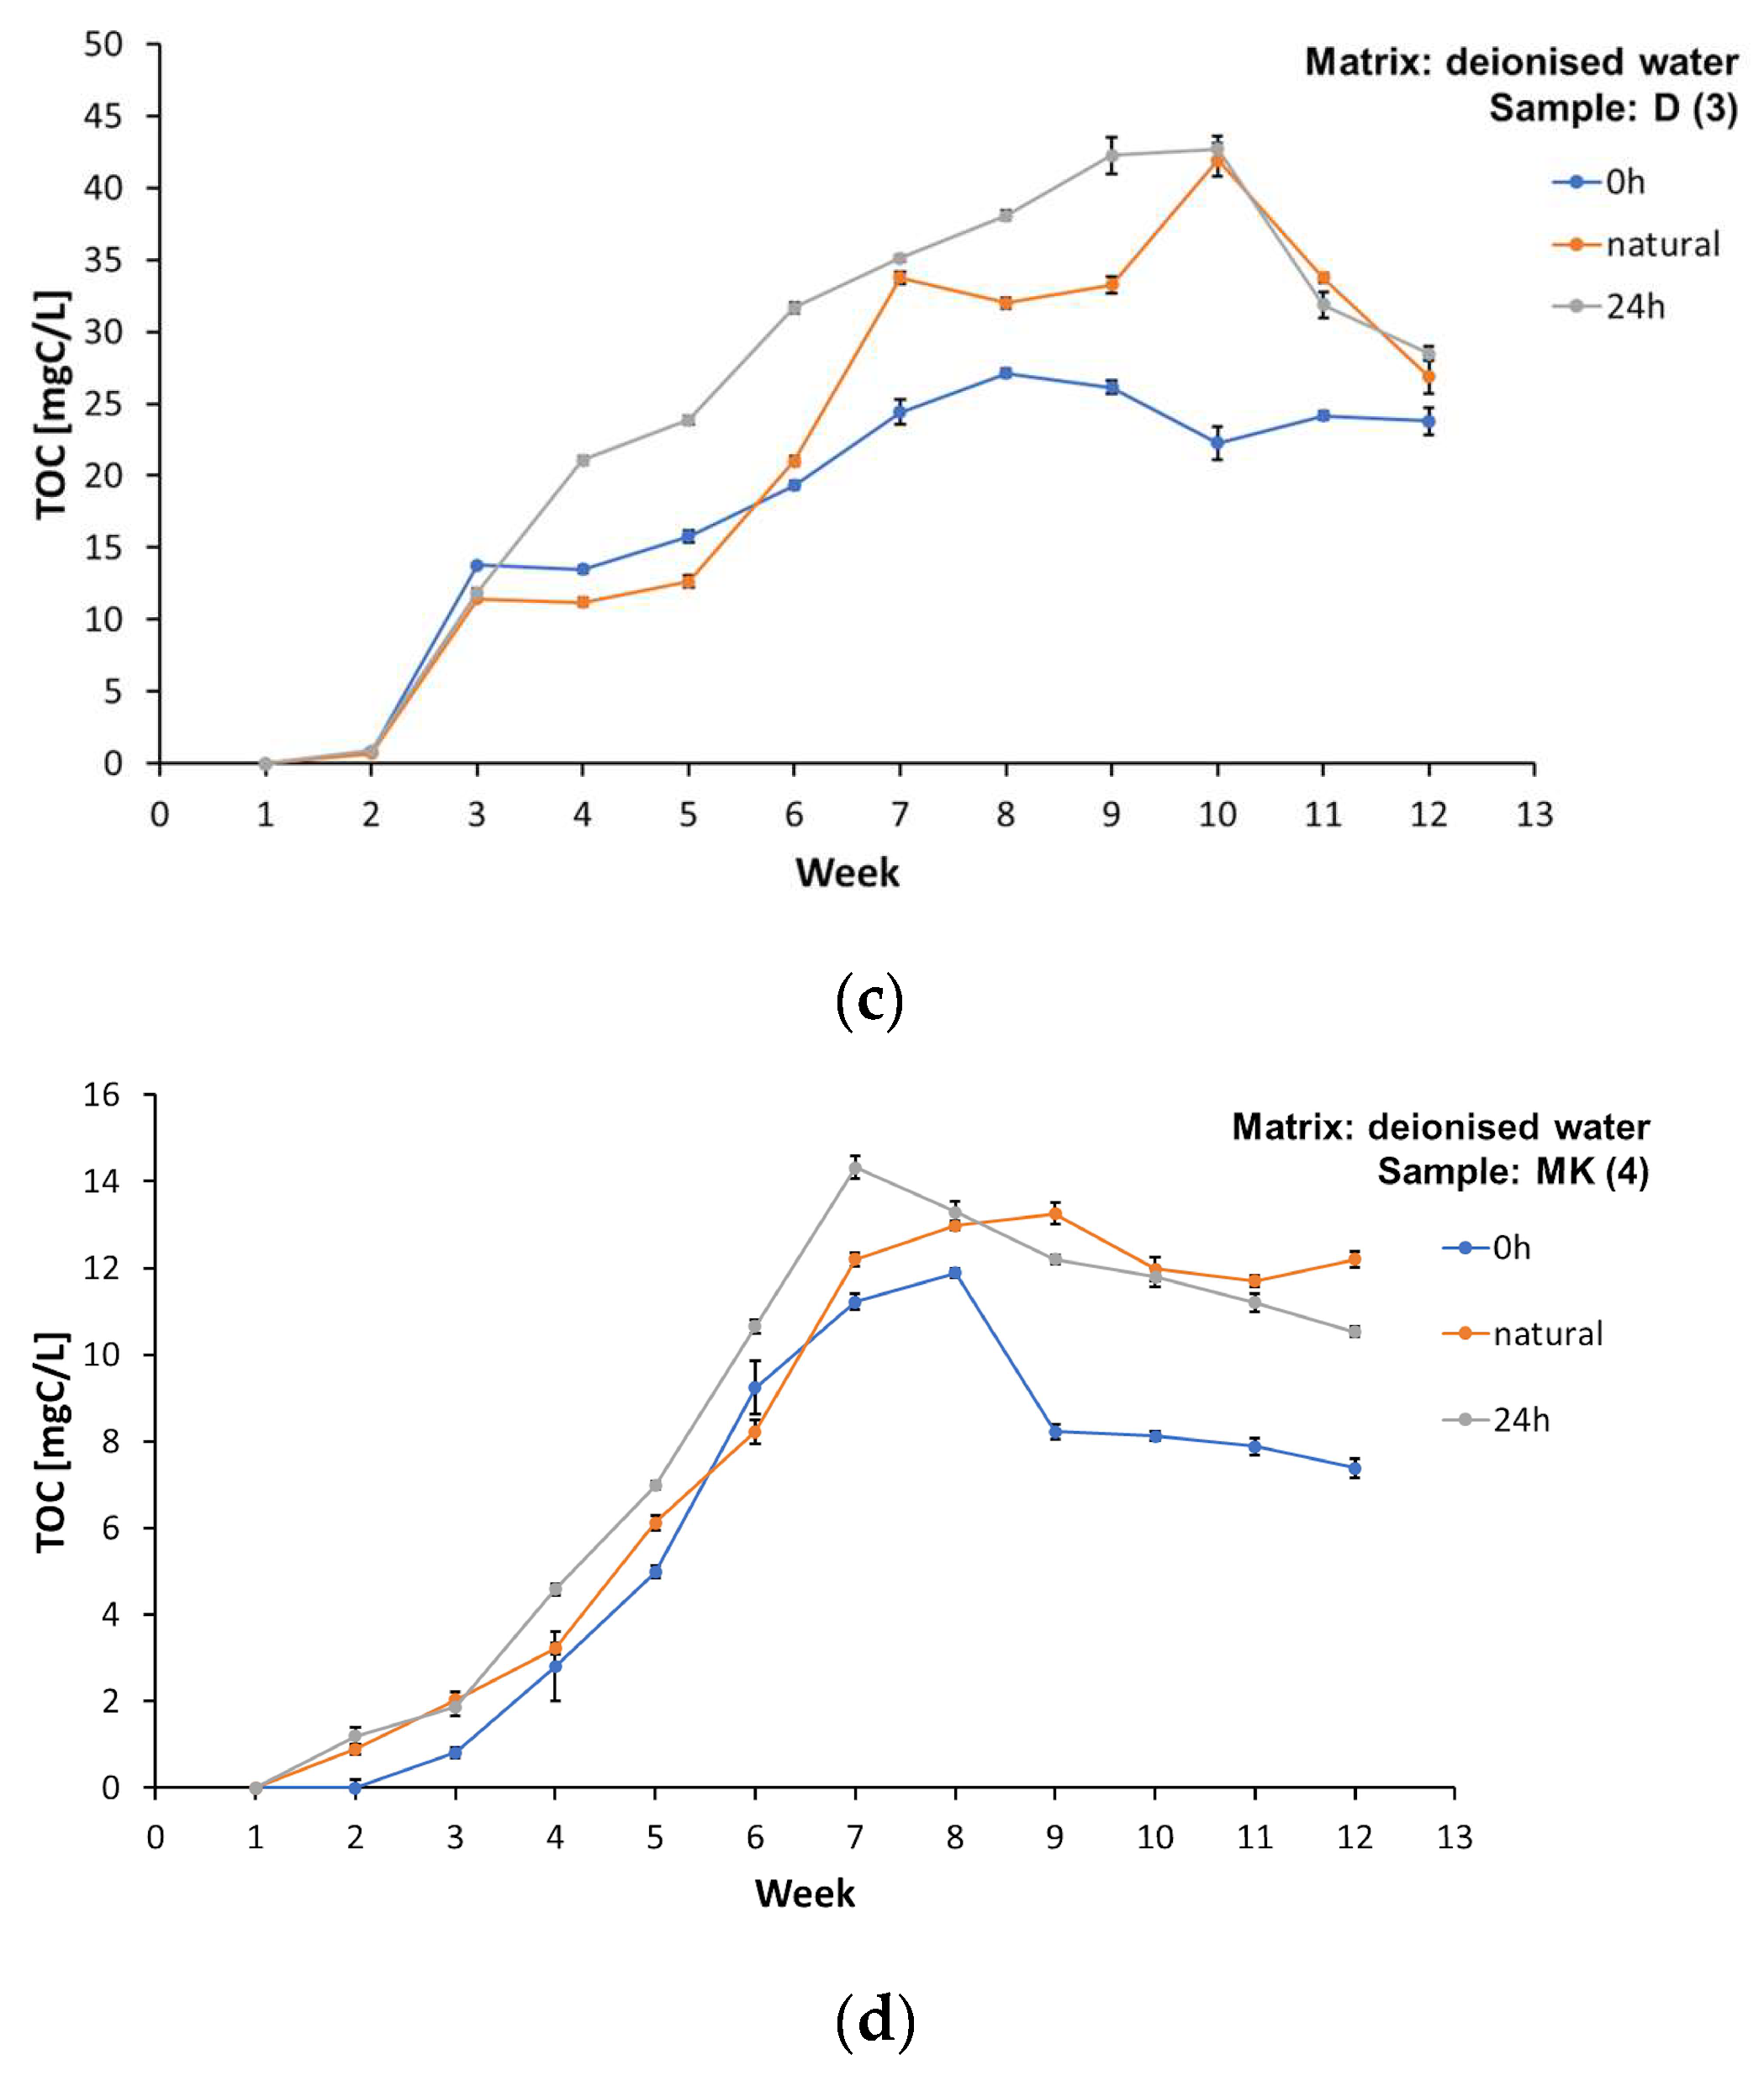
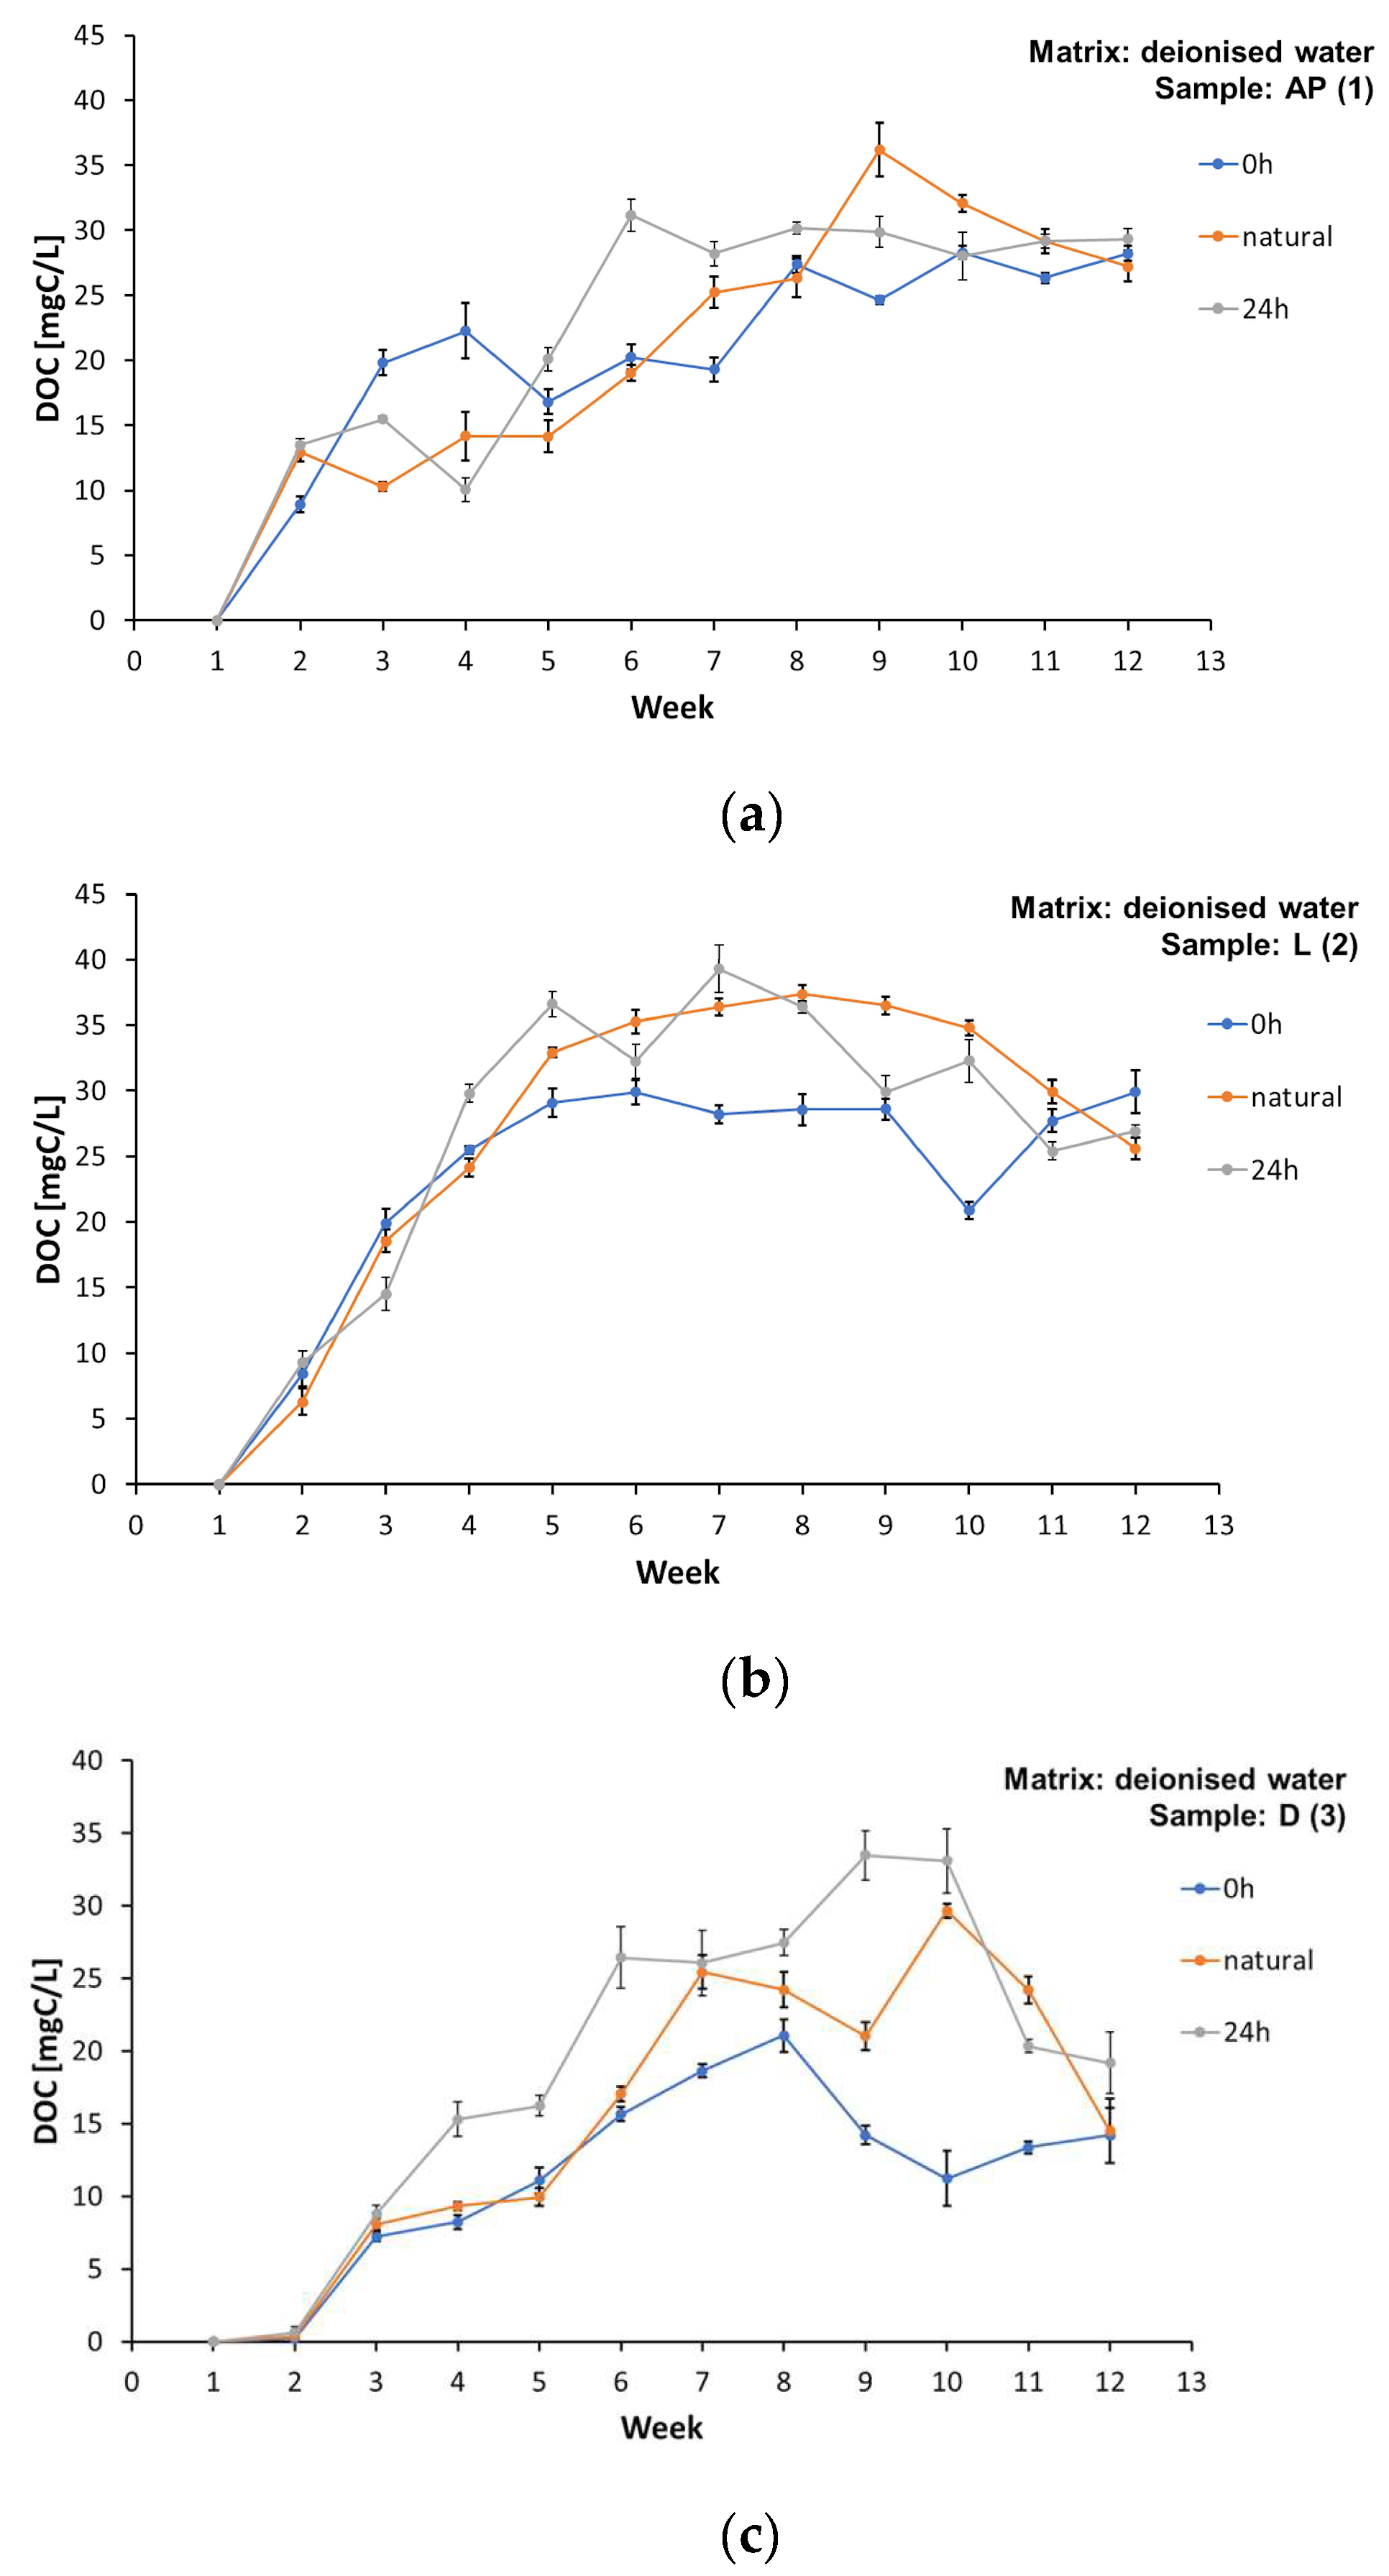
3.2. Analysis of the Change in the Organic Carbon Concentration in Water Matrices

Plastics contain numerous chemical additives in the form of plasticisers, stabilisers, antioxidants, flame retardants, pigments, and others, which are designed to facilitate the production processes and improve their mechanical properties. Degradation processes may occur both in regard to polymer chains and among additives, changing the chemical composition of the materials by breaking bonds or reacting with other pollutants present in the environment [41,42,43,44]. The weight loss of plastics can be used to assess their degradation and the release of chemicals from them. However, it is often not sufficient to prove the mineralisation of the samples tested [45]. In addition, these types of determinations require an appropriate sample size and a high-accuracy scale. An indirect parameter that allows the assessment of the mass loss of plastics and the amount of migration of chemical substances into aqueous solutions (leaching) is the measurement of the concentration of total organic carbon (TOC) (and dissolved organic carbon (DOC)) [46]. Total organic carbon is a measure of the amount of organic compounds contained in a water sample, both dissolved and in the form of suspended particles and sediments; hence, after filtering the samples using syringe filters (0.45 µm), we obtain a residue called dissolved organic carbon (DOC). Dissolved organic carbon contained in water is a potential source of carbon and energy for heterotrophic organisms and may contribute to increasing the metabolism of microorganisms responsible for the biodegradation process of plastics [47,48,49].
A significant change in total organic carbon concentrations was observed over 12 weeks of total organic carbon measurements in all the samples analysed (Figure 3). Detailed values are presented in Tables S1, S3, S5, and S7 in the Supplementary Materials.
Higher TOC values were found in the samples of the water matrices involving spring water and tap water (Supplementary Materials, Tables S1, S3, S5, and S7). The TOC concentration in samples AP (1), L (2), D (3), and MK (4) subject to illumination of 0 h/matrix involving spring water is presented in Tables S1, S3, S5, and S7 of the Supplementary Materials. Detailed values of the TOC concentration in samples AP (1), L (2), D (3), and MK (4) subject to illumination 0 h/matrix involving tap water are presented in Tables S1, S3, S5, and S7 of the Supplementary Materials.
All the samples tested released carbon compounds into the aqueous matrices (Figure 3a–d). The TOC values in most of the experiments performed were higher for the illuminated samples. Importantly, the highest concentration values of dissolved organic carbon were observed between the 6th and 9th week of the study, and, in the last two weeks, the TOC values gradually decreased. This phenomenon can be attributed to the deposits formed on the surface of the foil samples, which blocked the release of some of the substances, and to the gradual depletion of easily washed-out compounds. Lower TOC values were also obtained in the MK (4) samples subject to illumination of 0 h/matrix involving deionized water, which coincides with the visual observations regarding the durability of prints (the print using the raster technique showed higher durability and lower washability) (Supplementary Materials, Table S7). This may confirm that at least some of the compounds released into the water matrices, characterised as TOC, are substances originating from prints made with water-based paints on plastics. Significantly higher TOC values were not found in the water matrix samples with prints made with solvent inks, marked as L (2) (Supplementary Materials, Table S3).
A similar situation was observed in the case of dissolved organic carbon (Supplementary Materials, Tables S2, S4, S6, and S8). All the film samples leached DOC into the water matrices regardless of the light level and water matrix type (Figure 4a–d). Detailed values of the DOC concentrations in samples AP (1), L (2), D (3), and MK (4) under different lighting conditions in the matrices made of deionised water, spring water, and tap water are listed in the Supplementary Materials, Tables S2, S4, S6, and S8. Dissolved organic carbon constituted a significant part of the TOC amount, over 60%. The maximum DOC concentration in the water matrices was achieved between the 7th and 9th week of the study. However, such a marked decrease in the DOC was observed, but not in all the cases, in the last weeks of the experiments, as was the case with the TOC. The observations obtained partially confirm the results of the research by Romera-Castillo et al. [43,45]; however, we must take into account that the authors focused on much smaller particles in the microplastics range (0.50–5.00 mm). Research from 2018 confirmed an exponential decrease in the concentration of DOC leached into aqueous solutions until constant values were reached [46], with the final amount of dissolved organic carbon varying depending on the tested material. The studies confirmed that LDPE and HDPE particles released much more DOC; however, in the case of packaging polyethene, no clear differences in the DOC concentration were noted between the illuminated samples and the samples placed in a darkroom [46], which is confirmed by the experiments presented in this study. The authors emphasise that part of the leached DOC was lost due to sorption of the plastic and the release of volatile components [43,46]. Since the samples of the foils tested in these experiments were located in closed reactors, it was also possible to confirm the observations by Romera-Castillo et al. [43] regarding a specific “chemical” odour that appeared in the following weeks of the study and persisted until the end of the observations. This may be confirmed by the release of volatile products from the film surface during degradation.
Plastics do not generally undergo chemical changes when they enter the aquatic environment, but they can release the chemicals they contain. However, the amount of pollutants released depends on their concentration in the plastic and on the concentration of the pollutants already present in the aqueous matrix [42]. Thus, the inhibition of the release of TOC and DOC may be due not only to the depletion of easily extractable components from the film samples, but also to the achievement of an equilibrium in regard to the concentrations in the plastic and the matrix.

3.3. Change in pH and Total Dissolved Solids (TDS)

Changes in the reaction (pH) and TDS of the water matrices were monitored periodically during the study’s 2nd, 4th, 8th, and 10th weeks. The matrix samples for the TOC and DOC determinations required preparation and filtration. However, the samples for the TDS determinations were not prepared according to this procedure, as such the results should be treated as additional information only. The changes in the values of the tested parameters in the deionised water matrix are shown in Figure 5 and the other detailed numerical values are shown in the Supplementary Materials, Tables S9 and S10. The pH decreased slightly during the ongoing measurements (Supplementary Materials, Table S10) in all the samples analysed, without any relation to the light intensity, matrix type, or sample type. On the other hand, a strong increase in the TDS values was observed, especially after the 8th week of testing. The TDS concentration in the AP (1), L (2), D (3), and MK (4) samples subject to lighting of 0 h/matrix involving deionised water increased from the 8th to the 10th week (ppm) (Figure 5a–d). Detailed values are presented in Table S9 of the Supplementary Materials. The TDS concentration in the AP (1), L (2), D (3), and MK (4) samples subject to lighting 0 h/matrix involving spring water increased from the 8th to the 10th week (ppm) (all the values are detailed in Table S9 of the Supplementary Materials). The TDS value characterises the inorganic salts present in the water and, partly, the amounts of biological material [50], so it can be used as a general parameter to characterise the change in contamination in the aqueous matrices studied.
Studies using biodegradable commercial bags and HDPE have shown that these materials can alter the leachate quality by increasing the TDS values and altering the pH values [50]. The increased fragility associated with plastic degradation also contributed to the changes in the parameters studied [50].

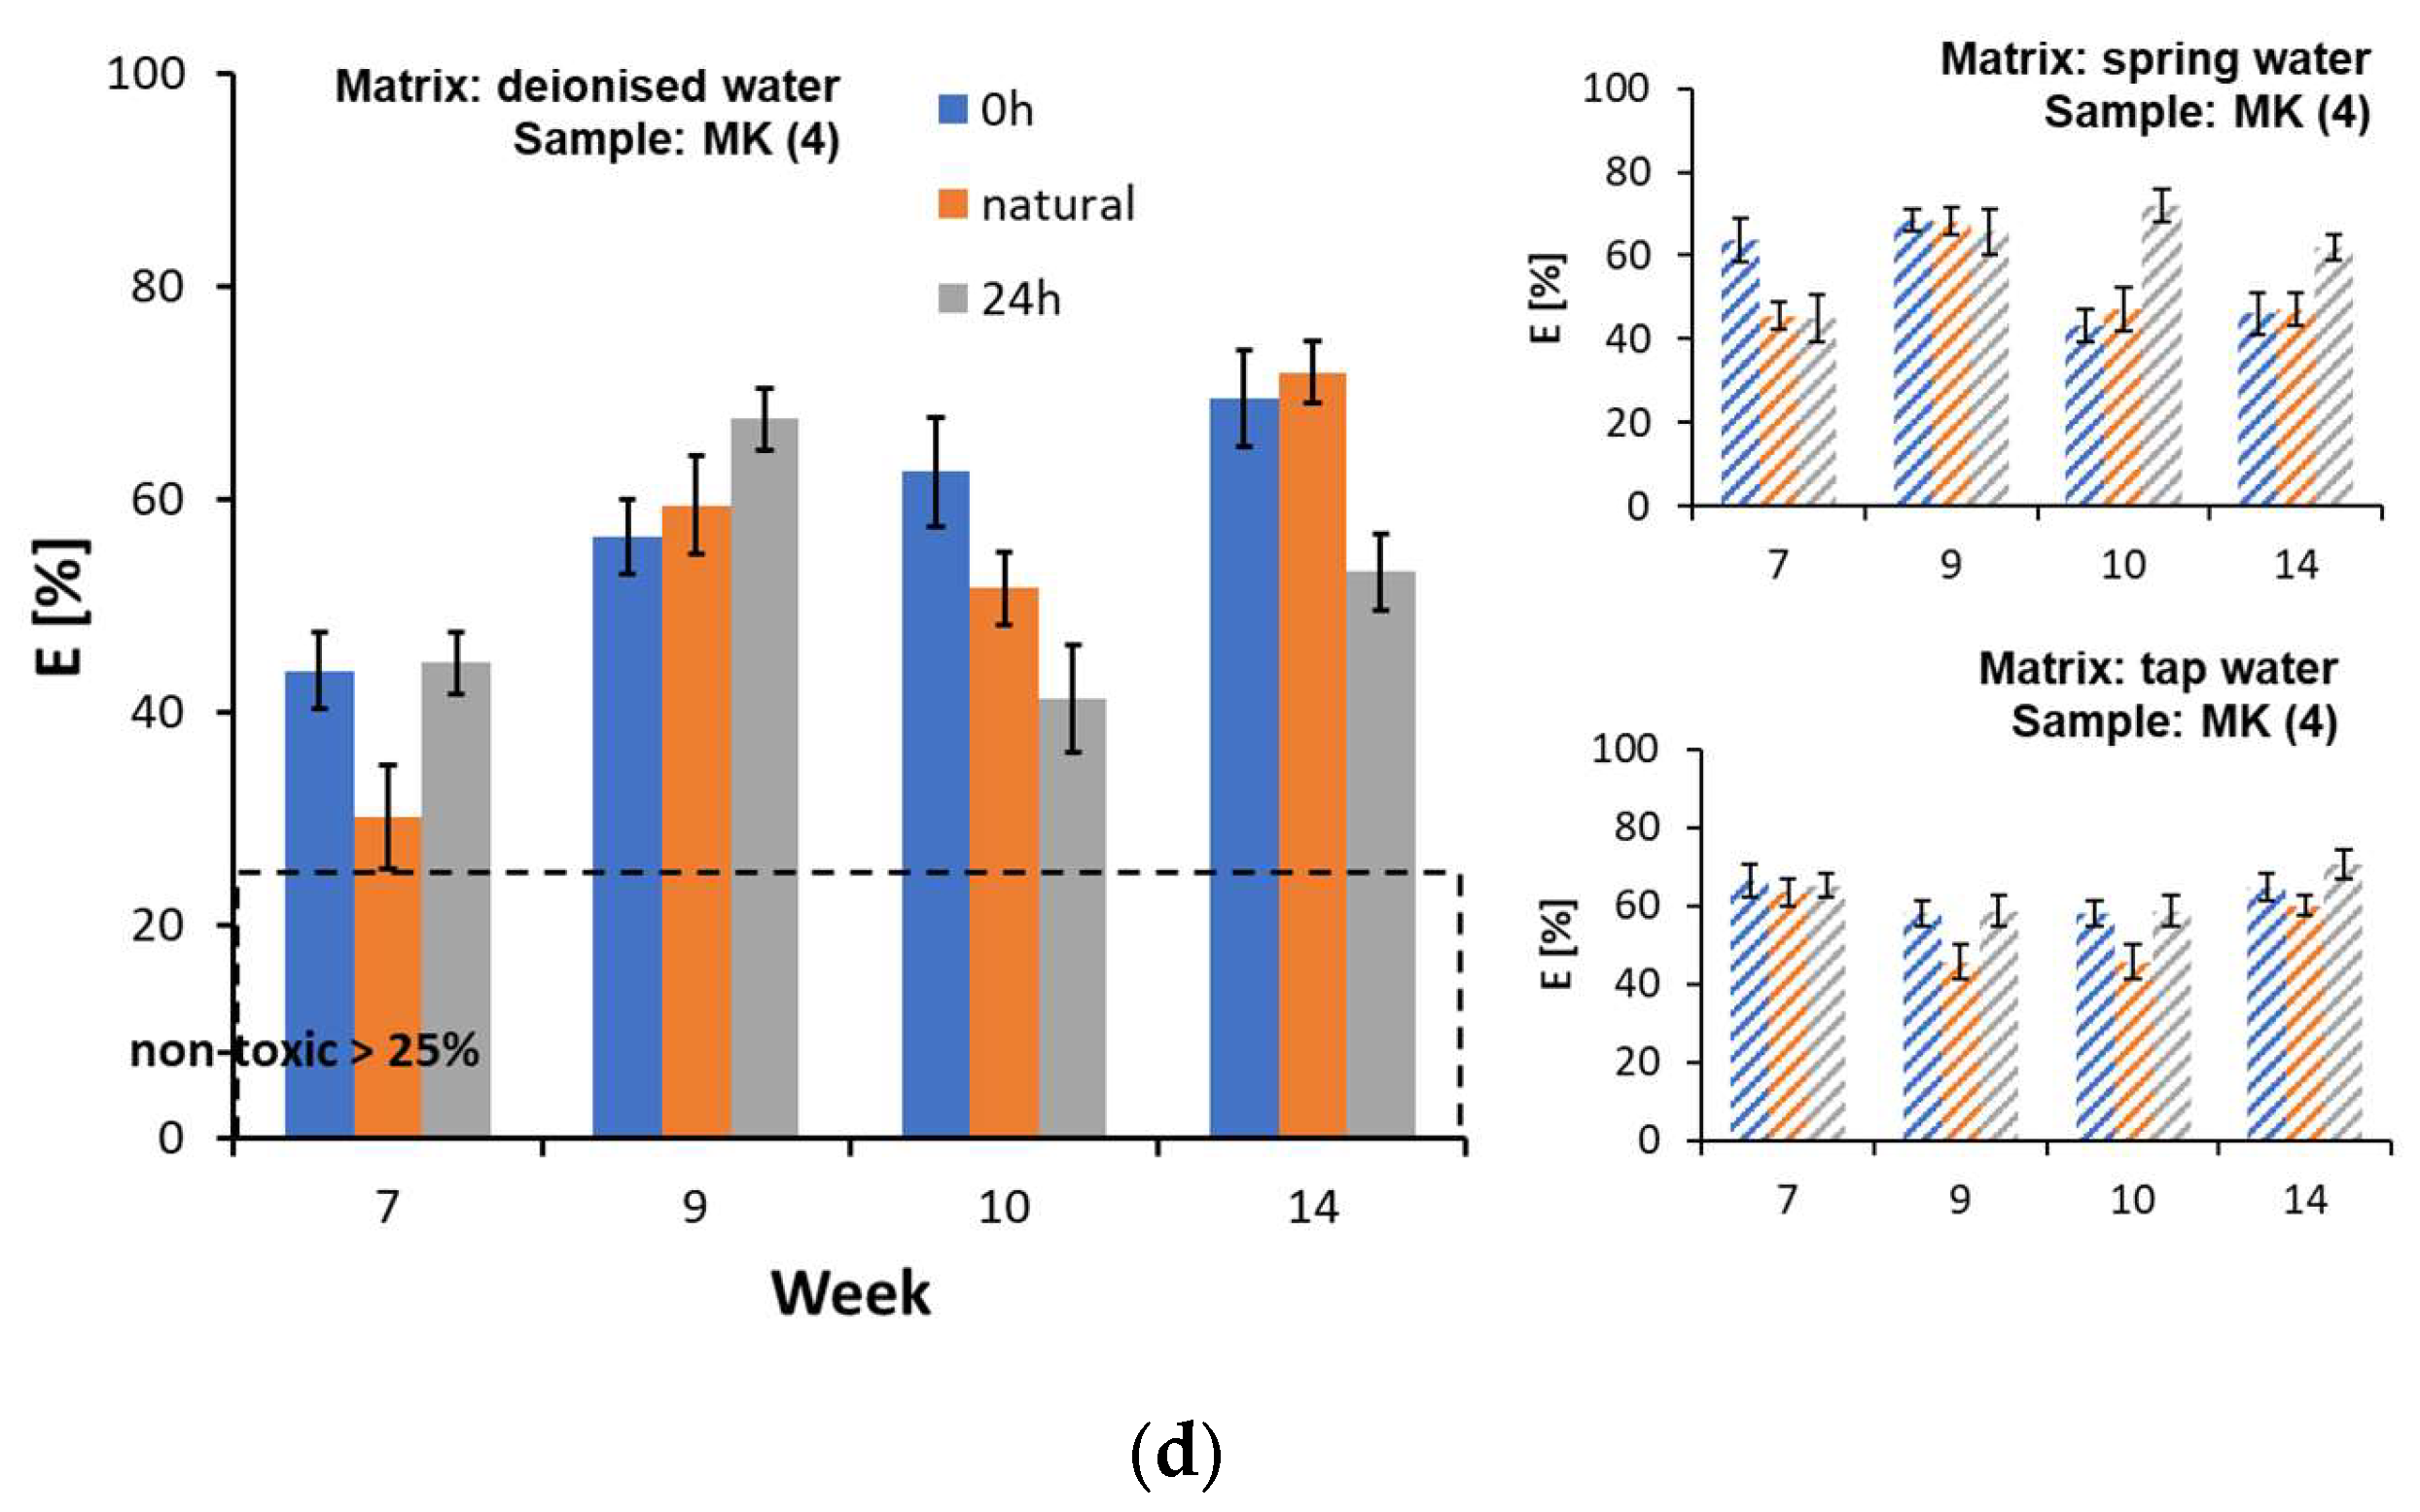
3.4. The Impact of Pollution on the Growth of Lemna Minor Fronds

As a change in the quality of the water matrix containing printed film samples was observed, selected ecotoxicological risk tests were performed. The process of leaching of the components can have a significant impact on the aquatic environment and pose a threat to living organisms [51,52]. Studies have shown that plastics and the prints on their surface can release, for example, phthalates, bisphenols or benzotriazoles, and flame retardants into the aquatic environment [52]. However, identifying potentially toxic compounds in plastic bags is difficult as the amount and composition of the additives used can vary greatly. This has an impact on the crystallinity, biodegradability, surface properties, oxidation resistance, and the residual plastic monomers formed [51,53,54]. The same products are made from different regranulates, whose chemical composition is unknown, as the plastic bags are not intended for direct contact with food.
In regard to the inhibition tests of Lemna minor frond growth, almost all of the tested water matrix samples were classified as toxic after a 7-week contact time with the film samples (Figure 6a–d and Supplementary Materials, Table S11). The highest value of the growth inhibition parameters was recorded for sample AP (1) in the tap water matrix in week 9 of testing (Ir = 80.15 ± 3.78%) (Figure 5a) and for sample L (2) in deionised water in week 9 of testing (Ir = 80.94 ± 2.96%) (Figure 5b). An increase in chlorosis was observed within the fronds, which may indicate an impact of the substances released from the film samples on the photosynthetic processes. In regard to the tests with Lemna minor, the correlation between the extension of the test duration and the gradual reduction in the substances leached from the samples was partially confirmed. However, it was not possible to establish a clear relationship, as this part of the study only covered the period from week 7 to week 14. In the experiments with Lemna minor, there was also no clear effect of irradiation of the film samples on the increase in toxicity of the water matrices. In contrast, chlorosis was observed more frequently in the matrix samples from the darkroom, which could indicate the presence of a larger number of toxic compounds that do not decompose when exposed to light.
Until now, studies have focused primarily on the potential of leaching chemicals from microplastic particles, where the speed of the process depends, among other things, on the size, surface area polarity, and molecular weight of the pollutants. Studies have also suggested that the photodegradation process and increased contact time with the water matrix increases the amount of released substances [42]. In a biotic environment, releasing chemical substances from plastics can occur through diffusion, desorption, and erosion, leading to leaching and the extraction of additives into the surrounding environment. In addition, many dynamic physical, chemical, and biological transformations take place in the natural environment. As most plastic additives do not form covalent bonds with the polymer matrix, which means that they retain their individual chemical properties, they can easily enter the aqueous environment. Observations show that the printing degradation process also proceeds rapidly, according to which additional substances are transported into the environment [55].
Long-term experiments conducted by Zhu et al. in 2020 [56] confirmed that sunlight affects the leaching of chemicals from plastic particles, leading to the formation of reactive forms of oxygen. The effect of particle size on the leaching process was emphasised; smaller plastic fragments can have a higher release potential. In the experiment presented here, fragments of a 30 × 30 mm film were analysed and although no fragmentation of the samples occurred during the study period, the degradation processes showed colour changes, an increase in brittleness, and cracks in the material, indicating the start of the degradation process.

3.5. The Impact of Pollution on the Germination of Sinapis alba and Lepidium sativum

Germination tests taking advantage of Sinapis alba and Lepidium sativum showed a higher sensitivity of the germinated seeds compared to Lemna minor fronds (Supplementary Materials, Tables S12–S14). The root length constitutes a very sensitive parameter, and a number of environmental factors can cause growth inhibition, deformation, or damage [57]. An initially non-toxic effect of the water matrices on the growth of Sinapis alba root length was observed, in all the analysed cases, during week 7 of the study (Figure 7a–d). Then, the growth inhibition values increased at weeks 9, 10, and 14 of the study, and the analysed water matrices were toxic in regard to the germinating seeds. An increase in root inhibition was also observed in the studies taking advantage of Lepidium sativum, but this did not depend so significantly on the duration of the study. Also in the germination tests, the relationship between the matrix type and lighting conditions and the size of the toxic effect was not confirmed (Figure 7a–d; Supplementary Materials, Tables S12–S14). A visual observation of the deposition of deposits on the surface of the foil samples was carried out, the results of which are shown in selected photos presented in Figure 2g–i,l. The obtained results of the growth inhibition, germination inhibition, or mortality of crustaceans can be related to the increase in the amount of substances washed out from the foil into the water matrix, and, therefore, to the increase in chemical compounds to which the test organisms may be sensitive. Available studies show the effect of leachate in plastics on the growth and development of germinating Lepidium sativum seeds [58,59]. Among the abnormalities noted, not only was the root length shortened, but also thickened roots, twisted hypocotyls, or distorted and/or extra cotyledons were indicated. Such deformations were also observed in the conducted experiment concerning samples from week 10 and week 14 of the study. Stephan Pflugmacher et al., in 2021, in their study, emphasise that the observed phytotoxic effect decreases along with the prolonged ageing of plastics, which may indicate a reduction in the leaching of toxic substances [59]. A number of studies are available that confirm the significant toxicity of substances leached out of plastics, for example, involving the use of Daphnia magna crustaceans, Nitocra spinipes invertebrates, and Acartia tonsa, or microalgae [3,18,60,61].
It was determined that the plastic leachate in freshwater causes acute toxicity to Daphnia magna [59] and female Acartia tonsa. Whereas toxicity in regard to Nitocra spinipes was observed only after irradiating the plastic samples [18]. In the conducted experiment, toxic effects were observed for samples AP (1) (Supplementary Materials, Table S15), L (2) (Supplementary Materials, Table S16), and MK (3) (Supplementary Materials, Table S18). In the case of the D (3) samples, a low toxicity of the selected water matrices taken after 14 weeks of testing was noted. This was particularly the case after 24 h of illumination and natural lighting, which shows that a certain amount of the compounds causing the sensitivity of the indicator organisms used may have leached into the water matrices.

4. Conclusions

Despite the widespread interest in the impact of plastics on the aquatic environment, there are still a limited number of studies looking at the impact of materials during the first phase after their entry into the environment. In the experiments presented, fragments of printed plastic bags were gradually degraded in an aqueous environment. A change in structure due to discolouration and an increase in brittleness was observed. In addition, there was a significant deterioration in the quality of the imprints on the test samples, a reduction in their adhesion and, consequently, abrasion. A higher resistance to the test conditions was observed in the solvent-based paints. An increase in the degree of decomposition can contribute to the weakening of the stresses in the material and the gradual release of pollutants into the environment. The effect of plastic bag fragments on selected properties of freshwater matrices, deionised water, spring water, and tap water, was analysed. No clear correlation was observed between the type of water matrix and the intensity of leaching of the components from the film. However, the concentration of total organic carbon showed the highest values between the sixth and ninth week of testing and gradually decreased in the following weeks, which might indicate that some of the leached components were depleted or that an equilibrium in terms of their concentrations in the matrix and the material had been reached. In addition, the formation of deposits on the films was observed in some samples, which may have resulted in limiting the transport of ingredients into the solution. There was no confirmed correlation between the irradiation of the samples and an increase in the amount of components released into the aqueous matrices. In the cases studied, the lighting and type of matrix did not influence the level of toxic effect. Phytotests with Sinapis alba showed high toxicity at week 10 of the tests, which could be related to the peak in toxicant concentrations in the matrices. Samples of the aqueous matrices after 7 weeks of testing were characterised by low to high toxicity in the growth inhibition tests of Lemna minor fronds. Significantly, only a minor influence on the increased mortality of Daphnia magna and Artemia salina was observed during the test period. According to the toxicity classification used, the aqueous matrix samples reached a low level of toxicity at week 14 of the study and the toxic effect values were at their highest.
The analysis shows the impact that plastics have on the aquatic environment during the first phase of degradation. Additives contained in plastics can enter the environment long before microplastic particles are formed and can harm the organisms living there.

Supplementary Materials

The following supporting information can be downloaded at: https://www.mdpi.com/article/10.3390/resources14040058/s1, Table S1: Changes in the TOC (mgC/L) concentration in the water matrices: sample AP (1); Table S2: Changes in the DOC (mgC/L) concentration in the water matrices: sample AP (1); Table S3: Changes in the TOC (mgC/L) concentration in the water matrices: sample L(2); Table S4: Changes in the DOC (mgC/L) concentration in the water matrices: sample L(2); Table S5: Changes in the TOC (mgC/L) concentration in the water matrices: sample D (3); Table S6: Changes in the DOC (mgC/L) concentration in the water matrices: sample D (3); Table S7: Changes in the TOC (mgC/L) concentration in the water matrices: sample MK (4); Table S8: Changes in the DOC (mgC/L) concentration in the water matrices: sample MK (4); Table S9: Changes in the TDS (mg/L) concentration in the water matrices; Table S10: Changes in the pH (-) value in the water matrices; Table S11: The magnitude of the toxic effect obtained in Lemna minor growth tests; Table S12: The magnitude of the toxic effect obtained in plant tests—Germination Index (%) for samples marked AP (1); Table S13: The magnitude of the toxic effect obtained in plant tests—Germination Index (%) for samples marked L (2); Table S14. The magnitude of the toxic effect obtained in plant tests for samples marked D (3); Table S15: The magnitude of the toxic effect obtained in plant tests for samples marked AP (1); Table S16: The magnitude of the toxic effect obtained in plant tests for samples marked L (2); Table S17: The magnitude of the toxic effect obtained in plant tests for samples marked D (3); Table S18: The magnitude of the toxic effect obtained in plant tests for samples marked MK (4).

Funding

This research received no external funding. APC was financed from the Institute of Fuel and Energy Technology’s own funds.

Data Availability Statement

The author confirms that the data from this study are available within this manuscript and Supplementary Materials. The raw data from this study are available from the author, upon reasonable request.

Conflicts of Interest

The author declares that there are no conflicts of interest.

Statements and Declarations

This work was created as part of the statutory research activity of the Faculty of Environmental Engineering and Energy, Silesian University of Technology.

References

  1. Iniguez, M.E.; Conesa, J.A.; Fullana, A. Recyclability of four types of plastics exposed to UV irradiation in a marine environment. Waste Manag. 2018, 79, 339–345. [Google Scholar] [PubMed]
  2. Zhang, K.; Hamidian, A.H.; Tubić, A.; Zhang, Y.; Fang, J.K.H.; Wu, C.; Lam, P.K.S. Understanding plastic degradation and microplastic formation in the environment: A review. Environ. Pollut. 2021, 274, 116554. [Google Scholar] [PubMed]
  3. Li, L.; Zuo, J.; Duan, X.; Wang, S.; Hu, K.; Chang, R. Impacts and mitigation measures of plastic waste: A critical review. Environ. Impact Assess. Rev. 2021, 90, 106642. [Google Scholar]
  4. Bellas, J.; Gil, I. Polyethylene microplastics increase the toxicity of chlorpyrifos to the marine copepod Acartia tonsa. Environ. Pollut. 2020, 260, 114059. [Google Scholar]
  5. Ritchie, H. How much Plastic Waste Ends up in the Ocean? Available online: https://ourworldindata.org/how-much-plastic-waste-ends-up-in-the-ocean (accessed on 12 February 2025).
  6. Senga Green, D.; Boots, B.; Blockley, D.J.; Rocha, C.; Thompson, R. Impacts of Discarded Plastic Bags on Marine Assemblages and Ecosystem Functioning. Environ. Sci. Technol. 2015, 49, 5380–5389. [Google Scholar]
  7. Fauser, P.; Vorkamp, K.; Strand, J. Residual additives in marine microplastics and their risk assessment—A critical review. Marine Pollut. Bull. 2022, 177, 113467. [Google Scholar]
  8. Catrouillet, C.; Davranche, M.; Khatib, I.; Fauny, C.; Wahl, A.; Gigault, J. Metals in microplastics: Determining which are additive, adsorbed, and bioavailable. Environ. Sci. Process. Impact 2021, 4, 553–558. [Google Scholar]
  9. Julienne, F.; Delorme, N.; Lagarde, F. From macroplastics to microplastics: Role of water in the fragmentation of polyethylene. Chemosphere 2019, 236, 124409. [Google Scholar]
  10. Morales-Méndez, J.D.; Silva-Rodríguez, R. Environmental assessment of ozone layer depletion due to the manufacture of plastic bags. Heliyon 2018, 4, e01020. [Google Scholar]
  11. Du, H.; Xie, Y.; Wang, J. Microplastic degradation methods and corresponding degradation mechanism: Research status and future perspectives. J. Hazard. Mater. 2021, 418, 126377. [Google Scholar]
  12. Fotopoulou, K.N.; Karapanagioti, H.K. Degradation of Various Plastics in the Environment. In Hazardous Chemicals Associated with Plastics in the Marine Environment. The Handbook of Environmental Chemistry; Takada, H., Karapanagioti, H.K., Eds.; Springer: Cham, Switzerland, 2017; Volume 78, pp. 71–92. [Google Scholar]
  13. Alam, O.; Billah, M.; Yajie, D. Characteristics of plastic bags and their potential environmental hazards. Resour. Conserv. Recycl. 2018, 132, 121–129. [Google Scholar] [CrossRef]
  14. Laskar, N.; Kumar, U. Plastics and microplastics: A threat to environment. Environ. Technol. Innov. 2019, 14, 100352. [Google Scholar] [CrossRef]
  15. Borusiewicz, R.; Kowalski, R. Volatile organic compounds in polyethylene bags: A forensic perspective. Forensic Sci. Int. 2016, 266, 462–468. [Google Scholar] [CrossRef] [PubMed]
  16. Izdebska-Podsiadły, J. Flexographic Printing. In Printing on Polymers: Fundamentals and Applications; Izdebska-Podsiadły, J., Sabu, T., Eds.; Elsevier: Amsterdam, The Netherlands, 2016; pp. 1–20. [Google Scholar]
  17. Balea, A.; Monte, M.C.; de la Fuente, E.; Negro, C.; Blanco, A. Application of cellulose nanofibers to remove water-based flexographic inks from wastewaters. Environ. Sci. Pollut. Res. 2017, 24, 5049–5059. [Google Scholar] [CrossRef]
  18. Bejgarn, S.; MacLeod, M.; Bogdal, C.; Breitholtz, M. Toxicity of leachate from weathering plastics: An exploratory screening study with Nitocra spinipes. Chemosphere 2015, 132, 114–119. [Google Scholar] [CrossRef]
  19. Ernstgård, L.; Löf, A.; Wieslander, G.; Norbäck, D.; Johanson, G. Acute effects of some volatile organic compounds emitted from water-based paints. Environ. Sci. Pollut. Res. Int. 2007, 49, 880–889. [Google Scholar] [CrossRef]
  20. Gajadhur, M.; Łuszczyńska, A. Influence of pearlescent pigments on light-fastness of water-based flexographic inks. Dye. Pigment. 2017, 138, 119–128. [Google Scholar] [CrossRef]
  21. Izdebska, J.; Żołek-Tryznowska, Z.; Świętoński, A. Correlation between plastic films properties and flexographic prints quality. J. Graph. Eng. Des. 2015, 6, 19–25. [Google Scholar] [CrossRef]
  22. Potter, B.B.; Wimsatt, J. Method 415.3, Rev. 1.2: Determination of Total Organic Carbon and Specific UV Absorbance at 254 nm in Source Water and Drinking Water; U.S. Environmental Protection Agency: Washington, DC, USA, 2009.
  23. OECD. Test No. 221: Lemna sp. Growth Inhibition Test. In OECD Guidelines for the Testing of Chemicals, Section 2; OECD Publishing: Paris, France, 2006. [Google Scholar]
  24. Baran, A.; Tarnawski, M. Phytotoxkit/Phytotestkit and Microtox® as tools for toxicity assessment of sediments. Ecotoxicol. Environ. Saf. 2012, 98, 19–27. [Google Scholar] [CrossRef]
  25. Hoekstra, N.J.; Bosker, T.; Lantinga, E.A. Effects of cattle dung from farms with different feeding strategies on germination and initial root growth of cress (Lepidium sativum L.). Agric. Ecosyst. Environ. 2002, 93, 189–196. [Google Scholar] [CrossRef]
  26. United States Environmental Protection Agency. Methods for Measuring the Acute Toxicity of Effluents and Receiving Waters to Freshwater and Marine Organisms. EPA-821-R-02-012; U.S. Environmental Protection Agency: Washington, DC, USA, 2002.
  27. United States Environmental Protection Agency. Chronic Marine and Estuarine Manual. EPA 821-R-02-014; U.S. Environmental Protection Agency: Washington, DC, USA, 2002.
  28. Persoone, G.; Marsalek, B.; Blinova, I.; Törökne, A.; Zarina, D.; Manusadzianas, L.; Nałecz-Jawecki, G.; Tofan, L.; Stepanova, N.; Tothova, L.; et al. A Practical and User Friendly Toxicity Classification System with Microbiotests for Natural Waters and Wastewaters. Environ. Toxicol. 2003, 18, 395–402. [Google Scholar] [CrossRef]
  29. Ali, S.S.; Elsamahy, T.; Koutra, E.; Kornaros, M.; El-Sheekh, M.; Abdelkarim, E.A.; Zhu, D.; Sun, J. Degradation of conventional plastic wastes in the environment: A review on current status of knowledge and future perspectives of disposal. Sci. Total Environ. 2021, 771, 144719. [Google Scholar] [CrossRef] [PubMed]
  30. Chamas, A.; Moon, H.; Zheng, J.; Qiu, Y.; Tabassum, T.; Jang, J.H.; Abu-Omar, M.; Scott, S.L.; Suh, S. Degradation Rates of Plastics in the Environment. ACS Sustain. Chem. Eng. 2020, 8, 3494–3511. [Google Scholar] [CrossRef]
  31. Wayman, C.; Niemann, H. The fate of plastic in the ocean environment—A minireview. Environ. Sci. Process. Impacts 2021, 23, 198–212. [Google Scholar] [CrossRef] [PubMed]
  32. Coyle, R.; Hardiman, G.; O’ Driscoll, K. Microplastics in the marine environment: A review of their sources, distribution processes, uptake and exchange in ecosystems. Case Stud. Chem. Environ. Eng. 2020, 2, 100010. [Google Scholar] [CrossRef]
  33. Schwarz, A.E.; Ligthart, T.N.; Boukris, E.; van Harmelen, T. Sources, transport, and accumulation of different types of plastic litter in aquatic environments: A review study. Mar. Pollut. Bull. 2019, 143, 92–100. [Google Scholar] [CrossRef]
  34. Ding, R.; Tong, L.; Zhang, W. Microplastics in Freshwater Environments: Sources. Fates and Toxicity. Water Air Soil Pollut. 2021, 232, 181. [Google Scholar] [CrossRef]
  35. Napper, I.E.; Thompson, R.C. Environmental Deterioration of Biodegradable. Oxo-biodegradable, Compostable, and Conventional Plastic Carrier Bags in the Sea, Soil, and Open-Air Over a 3-Year Period. Environ. Sci. Technol. 2019, 53, 4775–4783. [Google Scholar] [CrossRef]
  36. Yuan, J.; Ma, J.; Sun, Y.; Zhou, T.; Zhao, Y.; Yu, F. Microbial degradation and other environmental aspects of microplastics/plastics. Sci. Total Environ. 2020, 715, 136968. [Google Scholar] [CrossRef]
  37. Almeida, M.P.D.; Gaylarde, C.; Pompermayer, F.C.; Lima, L.D.S.; Delgado, J.D.F.; Scott, D.; Neves, C.V.; Vieira, K.S.; Baptista Neto, J.A.; Fonseca, E.M. The Complex Dynamics of Microplastic Migration through Different Aquatic Environments: Subsidies for a Better Understanding of Its Environmental Dispersion. Microplastics 2023, 2, 62–77. [Google Scholar] [CrossRef]
  38. Michel, A.; Schaefli, B.; Wever, N.; Zekollari, H.; Lehning, M.; Huwald, H. Future water temperature of rivers in Switzerland under climate change investigated with physics-based models. Hydrol. Earth Syst. Sci. 2022, 26, 1063–1087. [Google Scholar]
  39. Woolway, R.I.; Kraemer, B.M.; Lenters, J.D.; Merchant, C.J.; O’Reilly, C.M.; Sharma, S. Global lake responses to climate change. Nat. Rev. Earth Environ. 2020, 1, 388–403. [Google Scholar]
  40. Ferreira, M.; Thompson, J.; Paris, A.; Rohindra, D.; Rico, C. Presence of microplastics in water, sediments and fish species in an urban coastal environment of Fiji, a Pacific small island developing state. Mar. Pollut. Bull. 2020, 153, 110991. [Google Scholar] [PubMed]
  41. Li, Y.; Liu, C.; Yang, H.; He, W.; Li, B.; Zhu, X.; Liu, S.; Jia, S.; Li, R.; Tang, K.H.D. Leaching of chemicals from microplastics: A review of chemical types, leaching mechanisms and influencing factors. Sci. Total Environ. 2024, 906, 167666. [Google Scholar]
  42. Romera-Castillo, C.; Mallenco-Fornies, R.; Saá-Yánez, M.; Álvarez-Salgado, X.A. Leaching and bioavailability of dissolved organic matter from petrol-based and biodegradable plastics. Mar. Environ. Res. 2022, 176, 105607. [Google Scholar]
  43. Bridson, J.H.; Gaugler, E.C.; Smith, D.A.; Northcott, G.L.; Gaw, S. Leaching and extraction of additives from plastic pollution to inform environmental risk: A multidisciplinary review of analytical approaches. J. Hazard. Mater. 2021, 414, 125571. [Google Scholar]
  44. Oberbeckmann, S.; Labrenz, M. Marine Microbial Assemblages on Microplastics: Diversity, Adaptation, and Role in Degradation. Ann. Rev. Mar. Sci. 2020, 2, 209–232. [Google Scholar]
  45. Romera-Castillo, C.; Pinto, M.; Langer, T.M.; Álvarez-Salgado, X.A.; Herndl, G.J. Dissolved organic carbon leaching from plastics stimulates microbial activity in the ocean. Nat. Comm. 2018, 9, 1430. [Google Scholar]
  46. Shetty, A.; Goyal, A. Total organic carbon analysis in water—A review of current methods. Mater. Today Proc. 2022, 65, 3881–3886. [Google Scholar]
  47. Kaplan, L.A.; Newbold, J.D. 10—Surface and Subsurface Dissolved Organic Carbon. Streams and Ground Waters. In Aquatic Ecology; Jones, J.B., Mulholland, P.J., Eds.; Academic Press: Cambridge, MA, USA, 2000; pp. 237–258. [Google Scholar]
  48. Abdulrazzak, I.A.; Bierk, H.; Abdulrazzaq, A.A. Monitoring and evaluation of the water pollution. IOP Conf. Ser. Mater. Sci. Eng. 2020, 881, 012101. [Google Scholar]
  49. Balestri, E.; Menicagli, V.; Ligorini, V.; Fulignati, S.; Raspolli Galletti, A.M.; Lardicci, C. Phytotoxicity assessment of conventional and biodegradable plastic bags using seed germination test. Ecol. Indic. 2019, 102, 569–580. [Google Scholar]
  50. Kalčíková, G.; Gotvajn, A.Ž.; Kladnik, A.; Jemec, A. Impact of polyethylene microbeads on the floating freshwater plant duckweed Lemna Minor. Environ. Pollut. 2017, 230, 1108–1115. [Google Scholar] [CrossRef] [PubMed]
  51. Chen, Q.; Gao, Z.; Wu, Y.; Li, H.; Jiang, J.; Yang, Y.; Xu, L.; Shi, H. Insight into chemical features of migrated additives from plastics and associated risks to estuarine ecosystem. J. Hazard. Mat. 2023, 448, 130861. [Google Scholar] [CrossRef]
  52. Chen, Q.; Allgeier, A.; Yin, D.; Hollert, H. Leaching of endocrine disrupting chemicals from marine microplastics and mesoplastics under common life stress conditions. Environ. Int. 2019, 130, 104938. [Google Scholar]
  53. Gewert, B.; Plassmanna, M.M.; MacLeod, M. Pathways for degradation of plastic polymers floating in the marine environment. Environ. Sci. Process. Impacts 2015, 17, 1513. [Google Scholar] [CrossRef]
  54. Yang, H.; Li, X.; Guo, M.H.; Cao, X.; Zheng, X.; Bao, D. UV-induced microplastics (MPs) aging leads to comprehensive toxicity. Mar. Pollut. Bull. 2023, 189, 114745. [Google Scholar]
  55. Xu, S.; Ma, J.; Ji, R.; Pan, K.; Miao, A.-J. Microplastics in aquatic environments: Occurrence, accumulation, and biological effects. Sci. Total Environ. 2020, 703, 134699. [Google Scholar]
  56. Zhu, K.; Jia, H.; Sun, Y.; Dai, Y.; Zhang, C.; Guo, X.; Wang, T.; Zhu, L. Long-term phototransformation of microplastics under simulated sunlight irradiation in aquatic environments: Roles of reactive oxygen species. Water Res. 2020, 173, 115564. [Google Scholar]
  57. Mateos-Cárdenas, A.; Scott, D.T.; Seitmaganbetova, G.; van Pelt Frank, N.A.M.; O’Halloran, J.; Jansen Marcel, A.K. Polyethylene microplastics adhere to Lemna minor (L.), yet have no effects on plant growth or feeding by Gammarus duebeni (Lillj.). Sci. Total Environ. 2019, 689, 413–421. [Google Scholar]
  58. Pflugmacher, S.; Sulek, A.; Mader, H.; Heo, J.; Noh, J.H.; Penttinen, O.P.; Kim, Y.; Kim, S.; Esterhuizen, M. The Influence of New and Artificial Aged Microplastic and Leachates on the Germination of Lepidium sativum L. Plants 2020, 7, 339. [Google Scholar]
  59. Pflugmacher, S.; Tallinen, S.; Kim, Y.J.; Kim, S.; Esterhuizen, M. Ageing affects microplastic toxicity over time: Effects of aged polycarbonate on germination, growth, and oxidative stress of Lepidium sativum. Sci. Total Environ. 2021, 790, 148166. [Google Scholar] [PubMed]
  60. Schiavo, S.; Oliviero, M.; Chiavarini, S.; Dumontet, S.; Manzo, S. Polyethylene, Polystyrene, and Polypropylene leachate impact upon marine microalgae Dunaliella tertiolecta. J. Toxicol. Env. Health Part A 2020, 84, 249–260. [Google Scholar]
  61. Luo, H.; Liu, C.; He, D.; Sun, J.; Li, J.; Pan, X. Effects of aging on environmental behavior of plastic additives: Migration, leaching, and ecotoxicity. Sci. Total Environ. 2022, 849, 157951. [Google Scholar] [CrossRef] [PubMed]
Figure 1. Photos of selected samples of PE film used in the tests (foil samples before testing, new fragments): no. sample (magnification), printing technique/type of paint. All the photos were taken using a camera attached to an optical microscope. (a) Sample 1—AP (4×), flexographic printing/water-based paint. (b) Sample 1—AP (10×), flexographic printing/water-based paint. (c) Sample 2—L (4×), flexographic printing/water-based paint. (d) Sample 2—L (10×), flexographic printing/solvent-based paint. (e) Sample 2—L (4×), flexographic printing/solvent-based paint. (f) Sample 3—D (4×), flexographic printing/water-based paint. (g) Sample 3—D (10×), flexographic printing/water-based paint. (h) Sample 4—MK (4×), flexographic printing (raster)/water-based paint. (i) Sample 4—MK (4×), flexographic printing (raster)/water-based paint. (j) Sample 4—MK (4×), flexographic printing (raster)/water-based paint. (k) Sample 4—MK (10×), flexographic printing (raster)/water-based paint. (l) Sample 4—MK (10×), flexographic printing (raster)/water-based paint.
Resources 14 00058 g001aResources 14 00058 g001b
Figure 2. Microscopic photos of selected print samples after 14 weeks of research: (a) 1—AP (4×) (matrix: tap water/lighting: natural); (b) 1—AP (4×) (matrix: tap water/lighting: natural); (c) 1—AP (10×) (matrix: tap water/lighting: natural); (d) 3—D (4×) (matrix: deionised water/lighting: 0 h); (e) 3—D (4×) (matrix: spring water/lighting: 0 h); (f) 3—D (10×) (matrix: spring water/lighting: 0 h); (g) 4—MK (4×) (matrix: tap water/lighting: 0 h); (h) 4—MK (10×) (matrix: tap water/lighting: 0 h); (i) 4—MK (10×) (matrix: tap water/lighting: 0 h); (j) 2—L (4×) (matrix: deionised water/lighting: 0 h); (k) 2—L (10×) (matrix: deionised water/lighting: 0 h); (l) 3—D (4×) (matrix: tap water/lighting: 0 h).
Resources 14 00058 g002aResources 14 00058 g002b
Figure 3. Concentration of total organic carbon (TOC) in the matrix involving deionised water during the test period from week “0” to week 13, for samples: (a) AP (1), (b) L (2), (c) D (3), and (d) MK (4).
Resources 14 00058 g003aResources 14 00058 g003b
Figure 4. Concentration of dissolved organic carbon (DOC) in the matrix made of deionised water during the test period from week “0” to week 13, for samples: (a) AP (1), (b) L (2), (c) D (3), and (d) MK (4).
Resources 14 00058 g004aResources 14 00058 g004b
Figure 5. Changes in pH and TDS values in the matrix made of deionized water in selected research weeks: (a) AP (1), (b) L (2), (c) D (3), and (d) MK (4).
Resources 14 00058 g005aResources 14 00058 g005b
Figure 6. Inhibition of the growth of Lemna minor fronds in the presence of water matrices by plastic samples: (a) AP (1), (b) L (2), (c) D (3), and (d) MK (4).
Resources 14 00058 g006aResources 14 00058 g006b
Figure 7. Changes in germination index values in Sinapis alba and Lepidium sativum root growth tests for plastic samples: (a) AP (1), (b) L (2), (c) D (3), and (d) MK (4).
Resources 14 00058 g007aResources 14 00058 g007b
Table 1. Physicochemical parameters of the water matrices used in the research (mean value ± standard deviation).
Parameter (Unit)Matrix
Deionised WaterSpring WaterTap Water *
pH (-)5.92 ± 0.087.82 ± 0.127.25 ± 0.16
EC (µS/cm)3.24 ± 0.16382.00 ± 2.18535.00 ± 2.26
Turbidity (NTU)0.00 ± 0.000.00 ± 0.000.00 ± 0.00
TDS (ppm)0.00 ± 0.000.28 ± 0.120.32 ± 0.18
UV254 (m−1)0.00 ± 0.000.00 ± 0.001.20 ± 0.28
TC (mgC/L)5.56 ± 0.2836.19 ± 0.8947.49 ± 0.68
TOC (mgC/L)0.00 ± 0.000.82 ± 0.120.08 ± 0.02
DOC (mgC/L)0.00 ± 0.000.00 ± 0.000.00 ± 0.00
* Information on the number of microorganisms in tap water during the test period, in accordance with the Polish Regulation of the Minister of Health of 7 December 2017 on the quality of water intended for human consumption, namely coliform bacteria 0 CFU/100 mL; Enterococci 0 CFU/100 mL; Escherichia coli 0 CFU/100 mL; total number of microorganisms at (22 ± 2) °C after 72 h 1–5 CFU/1 mL.
Table 2. Toxicity classification based on the germination index, GI [24,25].
Germination Index ValueEffect
GI ≥ 100Growth stimulation
100 > GI ≥ 80Non-toxicity
80 > GI ≥ 50Moderate toxicity
50 > GIHigh toxicity
Disclaimer/Publisher’s Note: The statements, opinions and data contained in all publications are solely those of the individual author(s) and contributor(s) and not of MDPI and/or the editor(s). MDPI and/or the editor(s) disclaim responsibility for any injury to people or property resulting from any ideas, methods, instructions or products referred to in the content.

