Article

Comparison of Growth, Yield, and Carbon Dioxide Emission After Cultivation of Five Edible Mushrooms

by
Preuk Chutimanukul
1,2,*,
Pawarisa Phetkaew
1,
Siripong Sukdee
1,
Ornprapa Thepsilvisut
1,2 and
Hiroshi Ehara
3
1
Department of Agricultural Technology, Faculty of Science and Technology, Thammasat University, Pathumthani 12120, Thailand
2
Center of Excellence in Agriculture Innovation Centre Through Suply Chain and Value Chain, Thammasat University, Pathumthani 12120, Thailand
3
International Center for Research and Education in Agriculture, Nagoya University, Nagoya 464-8601, Japan
*
Author to whom correspondence should be addressed.
Resources 2025, 14(4), 55; https://doi.org/10.3390/resources14040055
Submission received: 25 December 2024 / Revised: 17 March 2025 / Accepted: 26 March 2025 / Published: 27 March 2025

Abstract

:
The increasing problem of carbon dioxide emissions has become a significant concern, with mushroom production identified as one of the contributing factors. This is because the mushroom production process emits carbon dioxide through respiration, and the carbon dioxide emitted by the mushrooms contributes to an increase in greenhouse gases. The carbon dioxide emitted by mushrooms can be utilized in various applications, such as supporting vegetable cultivation in greenhouses. However, the amount of carbon dioxide emitted by mushrooms varies. Thus, this study aimed to investigate the growth, yield, and carbon dioxide emissions in five edible mushrooms, namely Pleurotus pulmonarius, Lentinus squarrosulus, P. ostreatus, P. citrinopileatus, and P. cystidiosus. The experiment found that the fresh weight, dry weight, and biological efficiency percentage of P. ostreatus were the highest at 65.71, 11.18 g, and 28.22 percent, respectively. In contrast, the fresh weight, dry weight, and biological efficiency percentage of L. squarrosulus were the lowest, at 24.90, 3.80 g, and 9.90 percent, respectively. On the other hand, the carbon dioxide emitted from L. squarrosulus was the highest, ranging from 854.00 to 8369.67 ppm, while the carbon dioxide emitted from P. cystidiosus was the lowest, ranging from 606.00 to 861.00 ppm.

1. Introduction

Mushrooms are widely regarded as a nutritious food choice, offering a rich source of essential nutrients and health-enhancing compounds. They are a highly nutritious food as they contain a lot of protein, vitamins, and minerals and are low in fat [1]. Additionally, they have bioactive compounds that can be used in medicine [2]. This has made mushrooms an increasingly popular food, as they are considered to be rich in beneficial nutrients and minerals. Currently, mushroom consumption is trending upward in line with the health food market. Recently, Thailand produced more than 600,000 mushroom bags, with an economic value of approximately 8.7 million dollars, cultivating various economically significant mushroom species, such as Pleurotus pulmonarius (Fr.) Quél., Lentinus squarrosulus (Mont.) Singer, P. ostreatus (Jacq. ex Fr.) P. kumm., P. citrinopileatus Singer., and P. cystidiosus O.K. Mill [3]. The growing demand for mushrooms has led to an increase in their cultivation, which, in turn, contributes to carbon dioxide emissions. Mushrooms emit carbon dioxide as a natural byproduct of their metabolic and respiratory processes during mushroom growth [4]. This is because mushrooms are fungi that use oxygen for respiration [5]. However, research studies have shown that mushroom cultivation has a lower carbon footprint than other agricultural systems, as the carbon dioxide emitted from the decomposition of substrate, but the carbon dioxide emitted by mushrooms is a by-product [6]. The amount of carbon dioxide emitted from different mushroom species varies [7]. However, the various rates of carbon dioxide emission will affect the yield of mushrooms, as high concentrations of carbon dioxide inhibit mushroom growth [8]. Therefore, it is necessary to sequester carbon dioxide for use in plant cultivation. Carbon dioxide enhances the photosynthesis process in plants [9]. There have been reports of using carbon dioxide emitted by mushrooms in plant cultivation, such as the carbon dioxide from P. eryngii. In the amount of 108.8 to 150.8 micrograms per kilogram with romaine lettuce [10]. Additionally, there has been a study on the carbon dioxide emission of Lentinula edodes [11]. However, there have been no reports on the carbon dioxide emission of five mushroom species: P. pulmonarius, L. squarrosulus, P. ostreatus, P. citrinopileatus, and P. cystidiosus. Therefore, this leads to the objective of comparison of growth, yield, and carbon dioxide emissions in five edible mushrooms.

2. Materials and Methods

2.1. Analyses of the Physicochemical Properties and Nutrient Content of Mushroom Substrate Before and After Cultivation

Prior to cultivation, the substrate’s physicochemical properties and nutrient content were evaluated by oven-drying it for 72 h at 70 °C, using a pH meter PC950, Apera Instrument (Columbus, OH, USA), measuring its electrical conductivity (EC) with a conductivity meter Eutech CON 2700, Thermo Fisher Scientific (Waltham, MA, USA), determining its moisture content in accordance with Horwitz [12], and analyzing its organic carbon (OC) using a CHNS/O Analyzer model 628 series, Leco Corporation (St. Joseph, MI, USA), organic matter (OM) (calculated by organic carbon ×1.724), and the C:N ratio, which is determined by dividing the organic carbon value by nitrogen.

2.2. Substrate Preparation and Mushroom Cultivation

The cultivation substrate was prepared using commercial recipes, specifically rubber wood sawdust (8), rice husk (1.5), and limes (0.5), which were well mixed. The substrate’s moisture content was adjusted to 80% with water. A total of 750 g of substrate was placed into plastic bags, autoclaved for 30 min at 121 °C and 15 pounds of pressure per square inch (psi), and then allowed to equilibrate at ambient temperature for a full day. The inoculum of five edible mushrooms from Saraburi province—P. pulmonarius, L.squarrosulus, P. ostreatus, P. citrinopileatus, and P. cystidiosus—consisting of 5 g of mycelium from commercial sources was then added to the substrate-containing container. The plastic bags holding the inoculated substrate were then placed in a greenhouse with regulated environmental conditions, maintaining a temperature of 20 ± 2 °C and a relative humidity of 80 ± 5%. Over 30 days, the mycelium was allowed to cover the entire substrate block. The experiment was conducted from March to May 2024.

2.3. Study of Growth and Yield in Five Mushroom Species

The first batch of mushrooms was harvested after the caps were left open for an additional 7 days. In the meantime, the temperature was maintained at 25 ± 2 °C, and the relative humidity was kept at 85 ± 5%. The mushrooms were also watered for 15 min at 9:00 AM, 1:00 PM, and 5:00 PM.
Then, the diameter of the fruit bodies of all mushroom species (in centimeters) was measured using a vernier caliper. To determine yield, the fruit bodies of all mushroom species were harvested, and the obtained yield was measured as the fresh weight and dry weight (in grams). The biological efficiency (%) was calculated using the following equation:
Biological   efficiency   ( % ) = Fresh   weight   of   mushrooms   ( g ) Dry   weight   of   substrate   after   harvest   ( g )   ×   100

2.4. Carbon Dioxide Emission of Five Mushroom Species

The Extech CO260 device was utilized to record the amount of carbon dioxide (ppm) over 7 days, starting from the first day when the mycelium began growing into mushrooms. Simultaneously, the carbon dioxide levels were measured twice a day, once at 5:00 AM and again at 5:00 PM, with a 12 h interval between measurements.

2.5. Statistical Analysis

The study was conducted in a completely randomized design (CRD), with five mushroom species—P. pulmonarius, L.squarrosulus, P. ostreatus, P. citrinopileatus, and P. cystidiosus—and six biological replicates for each species. Each biological replicate consisted of five bags. The experimental data were analyzed using a one-way analysis of variance, followed by Duncan’s multiple range test. Observed differences were deemed to have statistical significance when the p-value was less than 0.05. Statistical analyses were conducted using IBM SPSS Statistics 21.

3. Results and Discussion

3.1. Analyses of the Physicochemical Properties and Nutrient Content of Mushroom Substrate Before and After Cultivation

The study analyzed the physicochemical characteristics and nutrient composition of the substrate before cultivating all mushroom species using commercial substrate formulas. The substrate was found to contain nitrogen, phosphorus, and potassium at concentrations of 0.46%, 0.0034%, and 0.21%, respectively (Table 1). The substrate’s physical and chemical properties included an electrical conductivity of 2.113 dS m−1, a pH of 7.77, an organic carbon content of 34.86%, and an organic matter content of 60.10%. The carbon-to-nitrogen ratio was 78.44%. It has been reported that a pH value of 7.00 in mushroom cultivation materials is suitable for nutrient breakdown and mushroom growth [13], while values of electrical conductivity above 1.6 dS m−1 should be avoided, as they can adversely affect mycelium growth and mushroom yield [14]. The C/N ratio serves as a source of nutrients that mushrooms absorb from the substrate through the mycelium and transfer to the mushroom fruiting body [15]. Additionally, phosphorus and potassium are essential nutrients for mushroom growth. Although they are required in small amounts, they still significantly impact the growth of mushroom mycelium [16].
The research also showed significant differences in nitrogen content, potassium content, pH, electrical conductivity, organic carbon content, organic matter content, and the C/N ratio across all experimental treatments (Table 1). The results ranged from 0.29% to 0.91%, 0.21% to 0.30%, 4.78 to 5.20, 1.765 to 2.469 dS m−1, 31.40% to 35.69%, 54.14% to 61.53%, and 34.66 to 118.22, respectively. However, no significant differences were observed in phosphate content between the treatments, with values ranging from 0.0011% to 0.0012%.
The pH value of the post-cultivation material tends to decrease because, during mycelium incubation, the spawn releases organic acids due to the activity of microorganisms in the cultivation material. This microbial activity leads to fermentation processes that increase acidity [17]. Similarly, the electrical conductivity tends to decrease because the mushroom mycelium absorbs nutrients for growth, which reduces the nutrient concentration in the cultivation material. Additionally, microorganisms use organic matter and carbon to form new microbial cells during fermentation, releasing nutrients the mushrooms need for growth. The nitrogen content fluctuates, resulting in uncertain changes in the C/N ratio of the post-cultivation material, leading to variations in the C/N ratio [18]. On the other hand, the increase in the C/N ratio of P. pulmonarius L. squarrosulus is due to the breakdown of nitrogen in the growing material, which causes the rise in the C/N ratio after cultivation. This, in turn, impacts the growth of mycelium and the yield of the mushrooms [19]. Furthermore, microbial decomposition of organic matter releases additional nutrients that the mushrooms absorb for growth. The phosphorus content also decreases in the post-cultivation material, as nutrients are consumed by the mycelium during its incubation for mushroom growth [20].

3.2. Study of Growth and Yield in Five Mushroom Species

The research on the growth and yield of all mushroom species found significant differences in the number of caps, cap diameter, fresh weight, dry weight, and biological efficiency (%) (Table 2 and Figure 1). P. citrinopileatus produced the highest number of caps, with an average of 60.17, and P. pulmonarius exhibited the largest cap diameter, measuring 4.88 cm. Additionally, P. ostreatus achieved the highest fresh weight (65.71 g), dry weight (11.18 g), and biological efficiency (28.22).
The yield and biological efficiency of mushrooms are the most important parameters for evaluation, as they are directly influenced by the efficiency of the substrates used for mushroom production [21]. Additionally, the researchers observe that the biological efficiency follows the same trend as fresh and dry weights. However, the differences in growth and yield can be attributed to internal factors, such as the unique fungal patterns and biomass characteristics, which vary significantly between species (Figure 1).

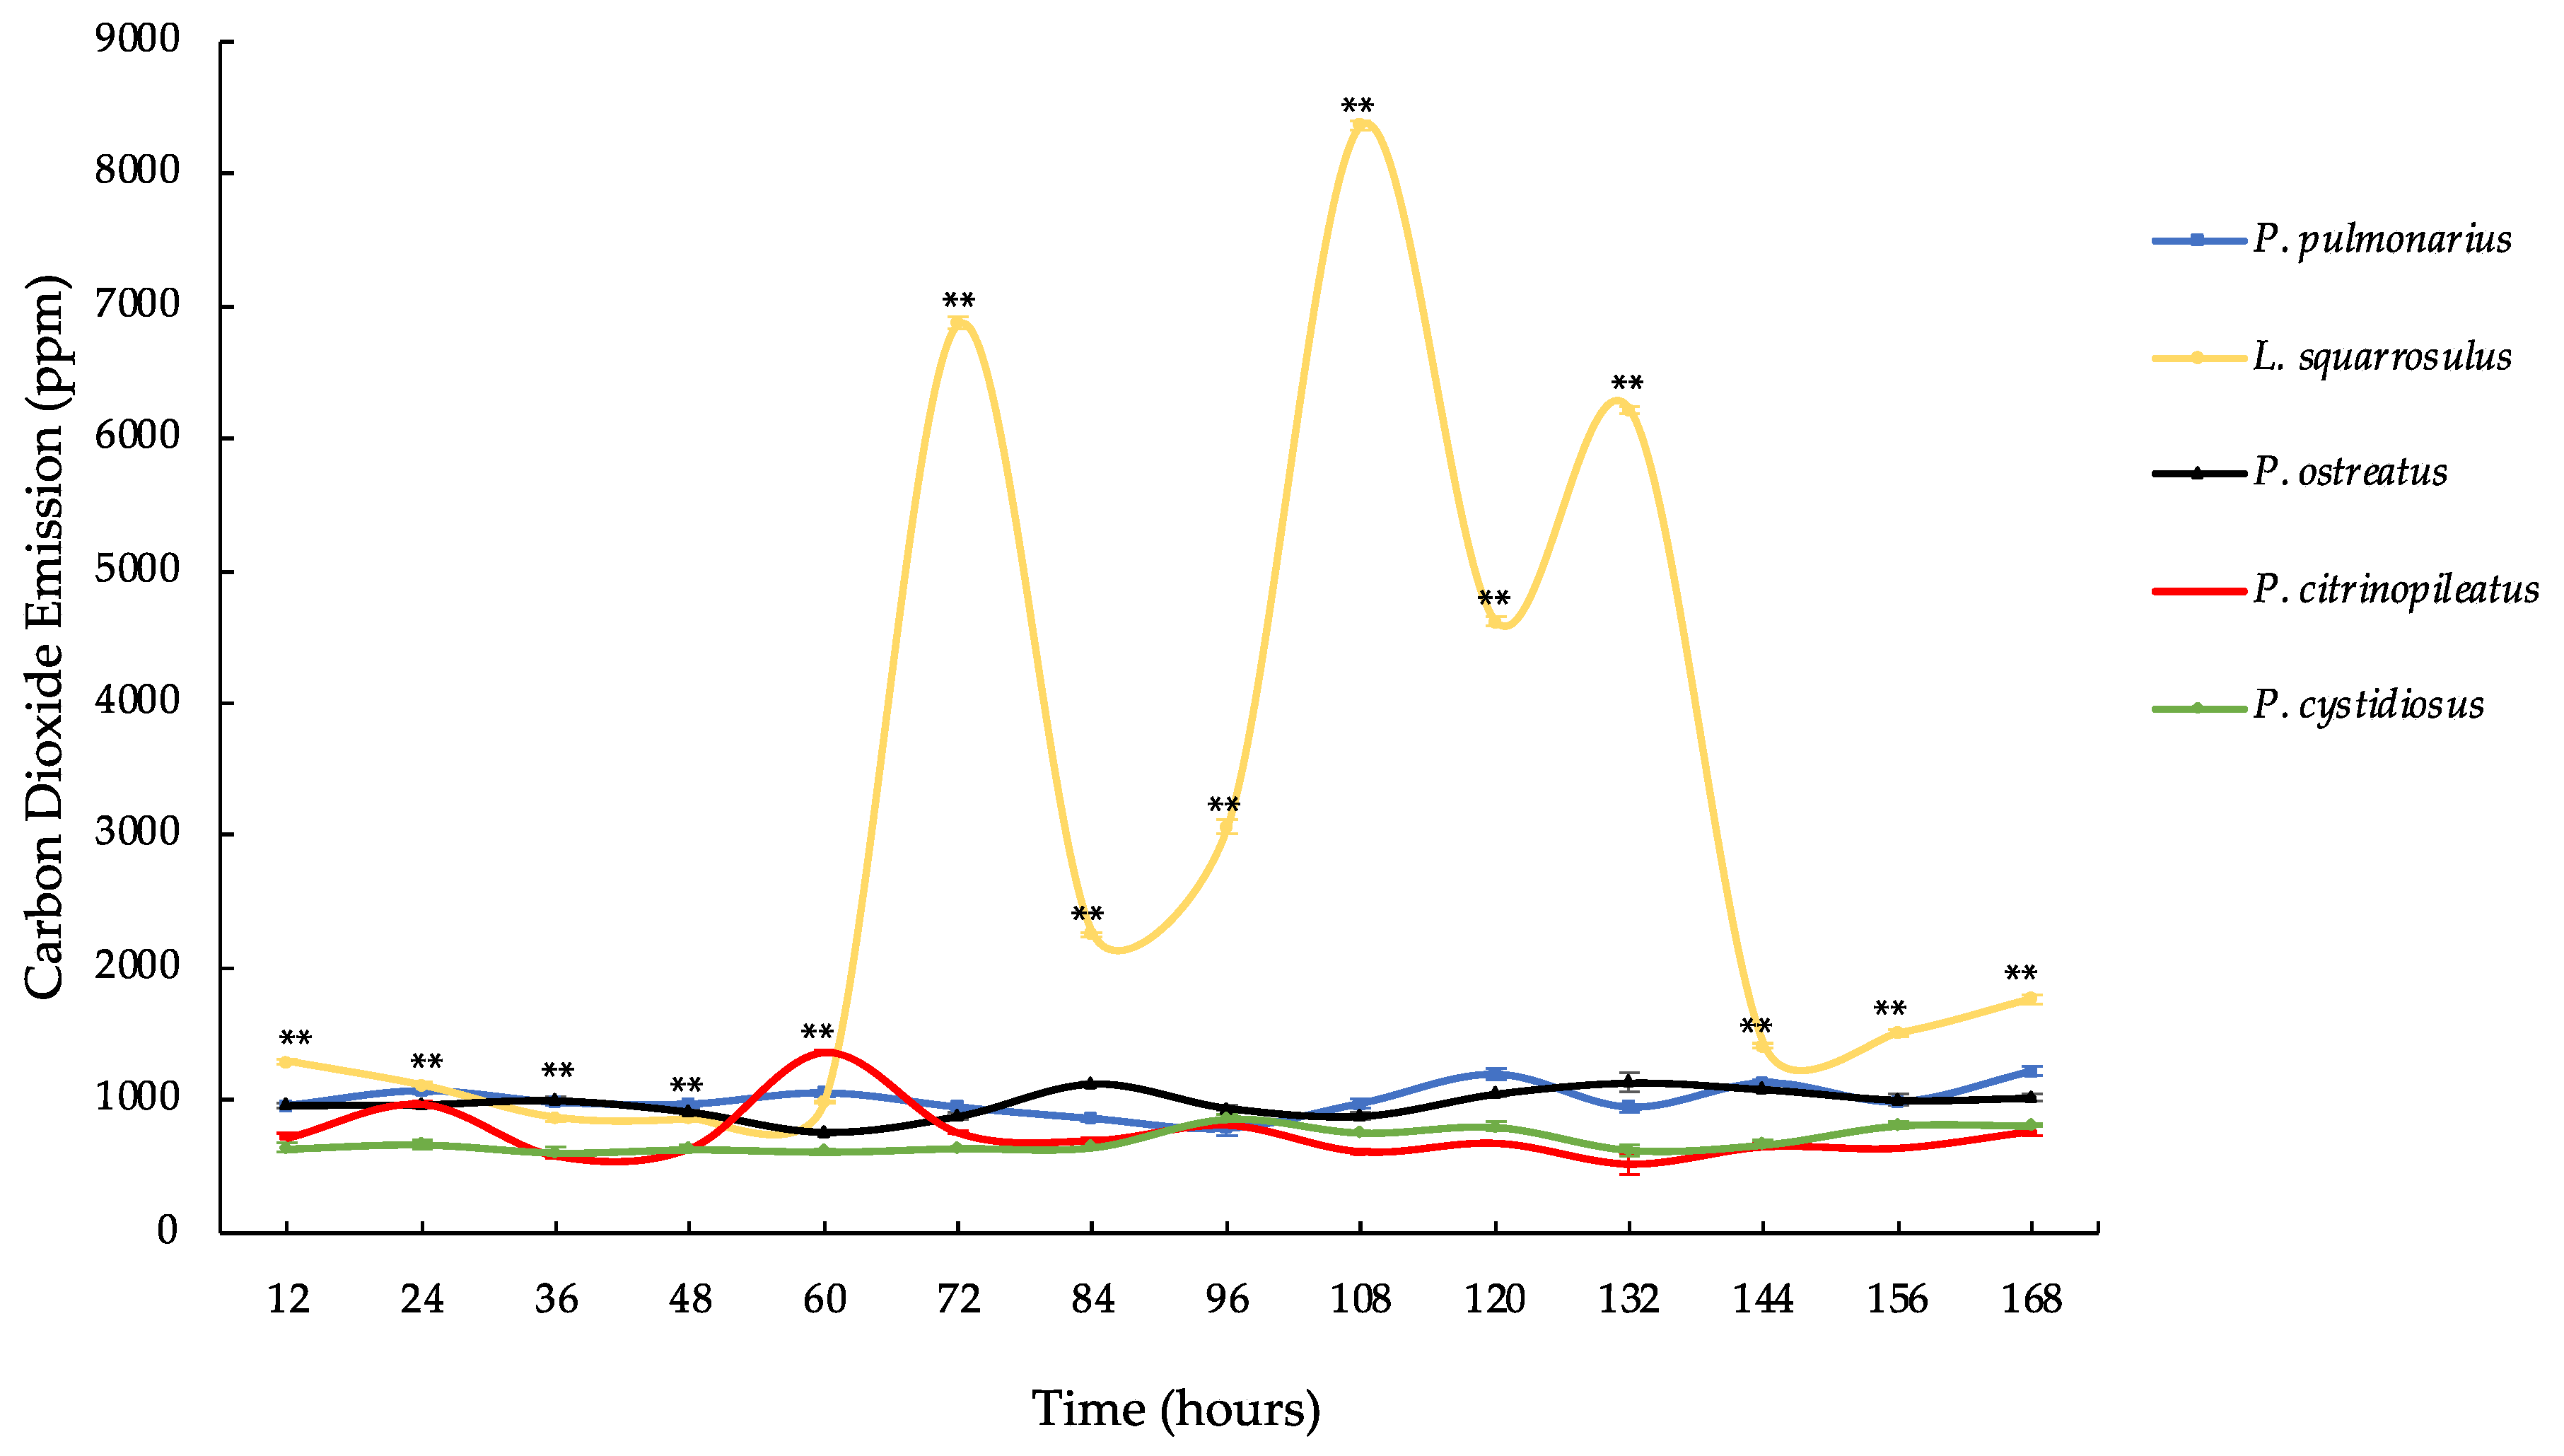
3.3. Carbon Dioxide Emission of Five Mushroom Species

A one-week evaluation of the carbon dioxide emissions from all mushroom species showed significant differences across all mushroom species (Figure 2 and Table S1). From days 1 to 7, P. pulmonarius, L. squarrosulus, P. ostreatus, P. citrinopileatus, and P. cystidiosus emitted carbon dioxide at levels ranging from 787.33 to 1211.33, 854.00 to 8369.67, 753.33 to 1135.33, 518.33 to 1360.00, and 606.00 to 861.00 ppm, respectively. Based on these findings, we may conclude that L. squarrosulus produced the most emissions by 72, 108, and 132 h equal to 6864.67, 8369.67, and 6210.67 ppm, respectively, whereas P. cystidiosus produced the least. The experiment found that the L. squarrosulus exhibited low growth and yield, despite having the highest carbon dioxide emitted. In contrast, P. ostreatus showed high growth and yield, but its carbon dioxide emission was not the highest. This is because high concentrations of carbon dioxide can inhibit mushroom growth [8], which aligns with the findings of Jung and Son [10]. When mushrooms emit carbon dioxide, it is important to maintain the carbon dioxide concentration at an appropriate level, as high carbon dioxide levels can be more detrimental to mushroom growth than beneficial, potentially limiting yield [22]. Furthermore, the report by Qu et al. [11] states that when carbon dioxide is emitted in high amounts, it may reduce growth and yield because high levels of carbon dioxide hinder the respiration process of mushrooms and create an unsuitable environment for growth. If higher yields are desired, carbon dioxide must be removed from the greenhouse. Therefore, further research should focus on capturing carbon dioxide for use in plant cultivation and enhancing mushroom yield in the future. This study could also serve as a foundational reference for examining other greenhouse gas emissions from mushrooms in the future.

4. Conclusions

This study identified notable differences in growth performance and yield across five mushroom species. Among these, P. ostreatus exhibited the highest productivity, achieving a fresh weight of 65.71 g, a dry weight of 11.18 g, and a biological efficiency of 28.22%. In contrast, L. squarrosulus emitted the highest levels of carbon dioxide, ranging from 854.00 to 8369.67 ppm during cultivation, but showed lower growth and yield. These findings underline the dual impact of mushroom farming on both agricultural productivity and environmental factors, particularly greenhouse gas emissions. This study provides foundational data on the relationship between mushroom farming and carbon dioxide emissions, contributing valuable insights for developing sustainable practices and future research aimed at mitigating environmental impacts associated with edible mushroom production.

Supplementary Materials

The following supporting information can be downloaded at: https://www.mdpi.com/article/10.3390/resources14040055/s1. Table S1: Carbon dioxide emitted of five mushroom species in a week.

Author Contributions

Conceptualization, P.C.; methodology, P.C. and P.P.; validation, P.C., P.P. and S.S.; formal analysis, P.C., P.P. and S.S.; investigation, P.C., P.P. and S.S.; resources, P.C., P.P. and S.S.; data curation, P.C.; writing—original draft preparation, P.C., P.P.; writing—review and editing, P.C., O.T. and H.E.; supervision, P.C.; project administration, P.C.; funding acquisition, P.C. All authors have read and agreed to the published version of the manuscript.

Funding

This work was supported by the Thailand Science Research and Innovation Fundamental Fund fiscal year 2023.

Data Availability Statement

The data supporting the findings of this study are included in the article. Please contact the relevant authors for any questions.

Acknowledgments

The authors would like to thank the Department of Agricultural Technology, Faculty of Science and Technology, Thammasat University, and the Center of Excellence in Agricultural Innovation through the Supply Chain and Value Chain for providing technical support and equipment.

Conflicts of Interest

The authors declare no conflicts of interest.

References

  1. Kongsomboonwet, S. Medicinal mushroom and health. Food J. 2011, 41, 361–366. [Google Scholar]
  2. Wattanasiritham, S.L. Medicinal mushroom polysaccharides. Food J. 2020, 50, 33–41. [Google Scholar]
  3. The Collection of Production and Marketing Data for Economic Mushrooms and Edible Wild Mushrooms in Thailand. Available online: https://waa.inter.nstda.or.th/stks/pub/2021/20210817-economic-mushroom-market.pdf (accessed on 10 October 2024).
  4. Mushroom and Mushroom Production. Available online: http://wb.yru.ac.th/xmlui/handle/yru/6381 (accessed on 10 October 2024).
  5. Thavivongse, S.; Buppachat, M. Grey Oyster Mushroom for Food Security Versus CO2 Emission. J. Environ. Res. Dev. 2013, 7, 1363–1368. [Google Scholar]
  6. Meilleur, M.-A.; Bastien, D.; Monfet, D. Modeling Mushrooms’ Carbon Dioxide Emission and Heat Exchange Rates for Synergistic Cultivation with Leafy Greens. Sustainability 2023, 15, 6740. [Google Scholar] [CrossRef]
  7. Pavlík, M.; Fleischer, P.; Fleischer, P., Jr.; Pavlík, M., Jr.; Šuleková, M. Evaluation of the Carbon Dioxide Production by Fungi under Different Growing Conditions. Curr. Microbiol. 2020, 77, 2374–2384. [Google Scholar] [CrossRef] [PubMed]
  8. Lin, R.; Zhang, L.; Yang, X.; Li, Q.; Zhang, C.; Guo, L.; Yu, H.; Yu, H. Responses of the Mushroom Pleurotus ostreatus under Different CO2 Concentration by Comparative Proteomic Analyses. J. Fungi. 2022, 8, 652. [Google Scholar] [CrossRef]
  9. Zi-Piao, Y.E. A Review on Modeling of Responses of Photosynthesis to Light and CO2. Chin. J. Plant Ecol. 2010, 34, 727–740. [Google Scholar] [CrossRef]
  10. Jung, D.-H.; Son, J.-E. CO2 Utilization Strategy for Sustainable Cultivation of Mushrooms and Lettuces. Sustainability 2021, 13, 5434. [Google Scholar] [CrossRef]
  11. Qu, Y.; Zhang, L.; Yu, H.; Song, C.; Zhang, M.; Tan, Q.; Shang, X. CO2 Release from Lentinula edodes Strains under Different Cultivation Modes. Acta Edulis Fungi 2020, 36, 37–44. [Google Scholar] [CrossRef]
  12. Horwitz, W.; International, A. Official Methods of Analysis of AOAC International, 17th ed.; Current Through Revision; AOAC International: Gaithersburg, MD, USA, 2002. [Google Scholar]
  13. Imtiaj, A.; Jayasinghe, C.; Lee, G.W.; Shim, M.J.; Rho, H.S.; Lee, H.S.; Hur, H.; Lee, W.M.; Lee, U.Y.; Lee, T.S. Vegetative Growth of Four Strains of Hericium erinaceus Collected from Different Habitats. Mycobiology 2008, 36, 88–92. [Google Scholar] [CrossRef] [PubMed]
  14. Pardo-Giménez, A.; Pardo-González, J.E. Evaluation of Casing Materials made from Spent Mushroom Substrateand Coconut Fibre Pith for Use in Production of Agaricus bisporus (Lange) Imbach. Span. J. Agric. Res. 2008, 6, 683–690. [Google Scholar] [CrossRef]
  15. Dissasa, G. Cultivation of Different Oyster Mushroom (Pleurotus species) on Coffee Waste and Determination of Their Relative Biological Efficiency and Pectinase Enzyme Production, Ethiopia. Int. J. Microbiol. 2022, 2022, 5219939. [Google Scholar] [CrossRef] [PubMed]
  16. Seephueak, P.; Preecha, C.; Seephueak, W. Effect of Nutrient in Palm Oil Sludge on Mycelium Growth of Auricularia polytricha (Mont.) Sacc. Khon Kaen Agric. J. 2016, 44 (Suppl. S1), 219–224. [Google Scholar]
  17. Tesfaw, A.; Tadesse, A.; Kiros, G. Optimization of Oyster (Pleurotus ostreatus) Mushroom Cultivation Using Locally Available Substrates and Materials in Debre Berhan, Ethiopia. J. App. Biol. 2015, 3, 015–020. [Google Scholar] [CrossRef]
  18. Han, J.; Sun, R.; Huang, C.; Xie, H.; Gao, X.; Yao, Q.; Yang, P.; Li, J.; Gong, Z. Effects of Different Carbon and Nitrogen Ratios on Yield, Nutritional Value, and Amino Acid Contents of Flammulina velutipes. Life 2024, 14, 598. [Google Scholar] [CrossRef] [PubMed]
  19. Wang, Q.; Juan, J.; Xiao, T.; Zhang, J.; Chen, H.; Song, X.; Chen, M.; Huang, J. The Physical Structure of Compost and C and N utilization During composting and Mushroom Growth in Agaricus bisporus Cultivation with Rice, Wheat, and Reed-Based Composts. Appl. Microbiol. Biotechnol. 2021, 105, 3811–3823. [Google Scholar] [CrossRef] [PubMed]
  20. Hultberg, M.; Oskarsson, C.; Bergstrand, K.-J.; Asp, H. Benefits and Drawbacks of Combined Plant and Mushroom Production in Substrate Based on Biogas Digestate and Peat. Environ. Technol. Innov. 2022, 28, 102740. [Google Scholar] [CrossRef]
  21. Ejigu, N.; Sitotaw, B.; Girmay, S.; Assaye, H. Evaluation of Oyster Mushroom (Pleurotus ostreatus) Production Using Water Hyacinth (Eichhornia crassipes) Biomass Supplemented with Agricultural Wastes. Int. J. Food Sci. 2022, 2022, 9289043. [Google Scholar] [CrossRef] [PubMed]
  22. Kitaya, Y.; Tani, A.; Kiyota, M.; Aiga, I. Plant Growth and Gas Balance in A Plant and Mushroom Cultivation System. Adv. Space Res. 1994, 14, 281–284. [Google Scholar] [CrossRef] [PubMed]
Figure 1. Growth and yield of five mushroom species: (a) P. pulmonarius; (b) L. squarrosulus; (c) = P. ostreatus; (d) = P. citrinopileatus, and (e) = P. cystidiosus.
Resources 14 00055 g001
Figure 2. Carbon dioxide emissions from the five mushroom species over the course of one week. Data are represented as means ± standard deviation (n = 5). An asterisk (**) indicates statistically significant differences at p ≤ 0.01.
Resources 14 00055 g002
Table 1. Nutrient and physicochemical content in substrates before and after.
Mushroom SpeciesNutrient Content in SubstratesPhysical—Chemical Content in SubstratesC/N Ratio
N (%)P (%)K (%)pHEC (dS/m)OC (%)OM (%)
Before 0.46 ± 0.070.0034 ± 0.000.21 ± 0.017.77 ± 0.102.113 ± 0.1234.86 ± 0.3360.10 ± 0.5678.44 ± 2.95
AfterP. pulmonarius0.29 ± 0.03 d 1/0.0012 ± 0.000.22 ± 0.014.96 ± 0.04 c1.959 ± 0.40 c33.62 ± 0.82 a57.97 ± 1.42 a118.22 ± 0.87 a
L. squarrosulus0.40 ± 0.03 c0.0011 ± 0.000.29 ± 0.014.78 ± 0.04 d2.116 ± 0.25 b35.24 ± 1.26 a60.77 ± 2.17 a88.50 ± 2.24 b
P. ostreatus0.46 ± 0.04 b0.0012 ± 0.000.30 ± 0.025.05 ± 0.13 c2.469 ± 0.18 a35.69 ± 1.03 a61.53 ± 1.78 a77.26 ± 1.43 c
P. citrinopileatus0.48 ± 0.02 b0.0012 ± 0.000.21 ± 0.035.20 ± 0.10 b1.765 ± 0.20 d31.44 ± 2.39 b54.21 ± 4.12 b65.93 ± 1.77 d
P. cystidiosus0.91 ± 0.06 a0.0011 ± 0.000.25 ± 0.015.39 ± 0.17 a2.004 ± 0.09 c31.40 ± 1.42 b54.14 ± 2.45 b34.66 ± 0.55 e
F-test**ns************
C.V. (%)7.424.153.051.962.634.444.441.95
1/ Values are expressed as means ± standard deviations (n = 5). Means with different letters in the same column are significantly different according to DMRT at p ≤ 0.05. ** denotes significant differences at p ≤ 0.01, while ns indicates non-significant differences.
Table 2. Growth and yield of five mushroom species.
Mushroom SpeciesNumber of Caps Diameter of Cap (cm)Fresh Weight
(g)
Dry Weight
(g)
Biological Efficiency (%)
P. pulmonarius10.23 ± 0.43 c 1/4.88 ± 0.18 a51.53 ± 0.11 d9.65 ± 0.30 b19.89 ± 0.82 b
L. squarrosulus3.67 ± 0.48 d2.28 ± 0.81 e24.90 ± 0.81 e3.80 ± 0.46 d9.90 ± 0.87 d
P. ostreatus27.00 ± 0.59 b3.84 ± 0.12 c65.71 ± 0.82 a11.18 ± 0.77 a28.22 ± 0.90 a
P. citrinopileatus60.17 ± 0.79 a2.71 ± 0.30 d53.37 ± 0.93 c7.00 ± 0.57 c19.41 ± 0.60 b
P. cystidiosus3.92 ± 0.28 d4.30 ± 0.10 b55.95 ± 0.82 b7.11 ± 0.49 c17.80 ± 0.34 c
F-test**********
C.V. (%)2.538.811.527.004.00
1/ Values are expressed as means ± standard deviations (n = 5). Means with different letters in the same column are significantly different according to DMRT at p ≤ 0.05. ** indicates significant differences at p ≤ 0.01.
Disclaimer/Publisher’s Note: The statements, opinions and data contained in all publications are solely those of the individual author(s) and contributor(s) and not of MDPI and/or the editor(s). MDPI and/or the editor(s) disclaim responsibility for any injury to people or property resulting from any ideas, methods, instructions or products referred to in the content.

