Abstract
This article assesses the use of solar photovoltaic radiation as a renewable resource for a region of the Isthmus of Tehuantepec in Mexico, where a 163.2 kW grid-connected photovoltaic system is located. The study aims to understand the system’s performance under the specific location conditions and to demonstrate the feasibility of installing photovoltaic systems in the Isthmus region. System monitoring was conducted for one year, with monthly and daily averages of normalized performance parameters determined. A three-month study of the power quality was conducted to assess compliance with interconnection and power quality requirements for power plants with a rated power Pn ≤ 500 kW. Results show higher energy production in the spring–summer months (138.946 MWh) than in autumn–winter (136.500 MWh), while the best overall performance occurred in autumn–winter (PR = 85% vs. 79.5% in spring–summer), probably due to cooler photovoltaic module temperatures. The final yield and PR indicate stable and predictable operation, even without maintenance, with PR = 82.3%. This supports the feasibility of photovoltaic installations in the southwestern region of Mexico. The present work is particularly relevant as it advances understanding of photovoltaic performance in understudied regions with substantial solar potential, such as the Isthmus of Tehuantepec, where policy prioritizes wind resource exploitation over solar energy.
1. Introduction
According to Xu et al. [1], solar photovoltaic energy has traditionally been evaluated for buildings and rarely for rugged or tropical terrain. Grid-connected photovoltaic (PV) systems have expanded rapidly worldwide. Solar PV has led renewable electricity capacity additions for the past decade, growing from 139 GW in 2013 to 1589 GW by the end of 2023 [2]. This growth is principally driven by declining technology costs, making PV more accessible for residential and commercial applications [2,3], and the urgent need to reduce greenhouse gas emissions. PV is particularly attractive due to abundant solar resources globally and its relatively low maintenance [4,5,6,7,8].
These advantages make solar photovoltaic (PV) systems increasingly competitive globally, and one of the renewable energy sources that contributes most to advancing towards sustainable development, by promoting clean, reliable, and increasingly accessible energy generation with a great capacity to foster energy resilience in vulnerable communities. It contributes directly to SDG 7 (Affordable and Clean Energy), SDG 13 (Climate Action), and SDG 9 (Industry, Innovation, and Infrastructure). It also has a significant impact on SDGs 1, 3, 4, and 11 by reducing energy costs, improving quality of life, promoting social inclusion, and supporting sustainable communities [9,10].
Recent research shows how solar photovoltaic energy contributes to progress toward sustainable development through design innovations and efficiency improvements for integrating solar energy in urban environments. These innovations promote the sustainability and resilience of urban infrastructure, reduce the carbon footprint, and enhance economic viability [11]. The strategic and financial analysis of the profitability of residential photovoltaic (PV) systems integrated with battery energy storage (BES) emerges as a topic of interest that directly influences SDG 7, where prosumers will play a significant role in the energy transition [12].
Moreover, limitations and research gaps have been identified in energy management technologies (EMSs) at the scale of smart cities. The emphasis is on sustainable cities in which smart buildings are the main actors in the energy market, driven by technologies such as the Internet of Things (IoT), Artificial Intelligence (AI), Big Data, Distributed Generation (DG), and the Integration of PV Systems and Energy Storage (ESS) [13]. Solar photovoltaic energy is key to advancing toward sustainable and smart cities, given its strong capacity to integrate with buildings, infrastructures, and urban networks, promote energy resilience, and ensure energy supply security [9,10,13,14].
The increasing prevalence of PV systems necessitates performance and sustainability evaluation. The International Energy Agency’s (IEA) Photovoltaic Energy Systems Programme (PVPS), specifically Task 13, addresses this by improving PV system reliability through monitoring, collecting, analyzing, and disseminating information on technical performance, failures, and sizing recommendations [15]. Consequently, the IEA-PVPS has identified key performance indicators (KPIs) focused on operational efficiency, financial viability, and sustainability to facilitate informed decision-making [16].
The performance ratio (PR) is a crucial performance indicator used in various methodologies for evaluating photovoltaic systems [17,18,19]. Continuous monitoring of numerous photovoltaic installations globally has enabled the identification of the main reasons for their low performance, and these studies have proven essential for achieving improved operation of photovoltaic systems today. The PR values of the most recent installations range from 0.50 to 0.85, reflecting enhancements in the quality of new photovoltaic systems [20].
The performance of photovoltaic systems is influenced by the climatic and environmental conditions of their location; thus, assessing their performance in specific contexts is crucial for optimizing their operation and ensuring their viability [21,22,23]. Research has documented the behavior of grid-connected photovoltaic systems across various regions, taking into account multiple factors that impact their performance, such as dust accumulation on the module surfaces and panel temperatures. It has been shown that accumulated dirt can decrease energy generation by up to 5.6% in warm climates, depending on the level of particles and environmental conditions [24,25]. Furthermore, the role of wind has been explored as a natural cooling mechanism, enhancing panel efficiency under high-temperature conditions [26,27], along with the annual performance dependence on solar radiation variability, which is affected by latitude, altitude, and the optimal tilt angle [28,29,30]. These studies underscore the significance of environmental conditions and the implications of installing photovoltaic systems in diverse geographical locations, enabling the identification of environmental and socioeconomic risks associated with their implementation, and providing valuable insights to enhance the efficiency and viability of these systems in various contexts [31,32,33,34,35].
Other studies have concentrated on comparing photovoltaic systems utilizing various module technologies, assessing their performance at the same location [36,37,38,39]. Additionally, they have explored different configurations of photovoltaic systems, such as rooftops, facades, and floating installations [40,41,42,43], as well as the development of control models aimed at enhancing the stability and efficiency of grid-connected photovoltaic systems [23,44,45]. These investigations highlight the significance of considering local conditions alongside technological, environmental, and social factors to thoroughly evaluate the performance and feasibility of these systems [46].
A widely adopted methodology for assessing the performance of photovoltaic systems is the one proposed by Haeberlin, which facilitates the analysis of essential parameters such as the overall performance ratio (PR) and energy conversion efficiency [47,48]. Numerous studies have employed this methodology to compare systems with varying inverter configurations, revealing notable differences in the energy produced under specific conditions [49,50].
Research on the performance evaluation of photovoltaic (PV) systems in Mexico has been limited. A few studies address solar PV energy in Mexico from perspectives ranging from large-scale monitoring to case-based assessments of technical and economic feasibility. One study conducted a statistical, comparative analysis of specific productivity parameters, the evolution of the total number of PV plants, and the correlation between specific productivity and daily irradiation of PV plants in Mexico, using data mining of online monitoring systems (SunnyPortal) [51]. However, given the volume of information, these studies do not adequately detail the performance of the various plants through key performance indicators. Other works have focused on evaluating the environmental benefits and energy savings of a grid-connected PV system in Mexico City (ICyTDF) and on conducting an in situ analysis of the performance of modules fabricated with different technologies (monocrystalline, polycrystalline, amorphous, and CdS/CdTe) under the city’s specific environmental conditions [52].
A comparative performance study was conducted for two identical grid-connected PV systems of 2.4 kWp each, installed in two distinct climatic locations, Tepic, Nayarit, and Temixco, Morelos, to determine the energy delivered to the grid and the performance ratio (PR) in both sites [53]. Other works have focused on simulation, optimization, and sensitivity analyses of grid-connected PV systems: a case study in Guerrero (UPEG) [54] and a technical and economic feasibility study of a grid-connected PV system in Santo Domingo Tehuantepec, Oaxaca, proposed as a sustainable urbanization option for southeastern Mexico, contributing to the Sustainable Development Goals (SDGs 7, 11, and 13) [55]. In both cases, HOMER was used to analyze economic sensitivity and optimized viability in light of the challenges of the Mexican market. Our proposal centers on evaluating a photovoltaic plant through key performance parameters and a power quality analysis, enabling a more specific and comprehensive description of the system’s performance at the Isthmus of Tehuantepec, an area characterized by strong winds and high solar irradiance.
The development of the photovoltaic industry in Mexico is primarily concentrated in the northern and central regions of the country, where 60% of all installed capacity (≥0.5 MW) is found in the states of Sonora, Aguascalientes, Chihuahua, and Coahuila. Additionally, around 60% of all installed Distributed Generation capacity (<0.5 MW) is in the states of Jalisco, Nuevo León, Chihuahua, Guanajuato, the State of Mexico, Coahuila, Michoacán, Sonora, and Yucatán [56].
The Isthmus of Tehuantepec is situated in southwest Mexico, within the state of Oaxaca, where there is significant potential for solar and wind resources. The wind potential is among the highest globally, with wind power density values of ≥800 W/m2 [57] and solar radiation of ≥5.6 kWh/m2/day [58]. It is a region with ambitious development plans from the Mexican government, owing to its strategic location on global maritime shipping routes [59]. In this context, the relocation of industries in the Isthmus region will lead to significant energy demand in the future, which can be met primarily through renewable sources: wind and photovoltaic energy. The wind industry has experienced rapid growth in the Isthmus region, with an electric power generation capacity of approximately 2758 MW [60]; however, the photovoltaic industry remains almost nonexistent in the area. Given the strategic importance of the Isthmus region and the increasing global expansion of electric power production from photovoltaic solar energy, due to its viability, safety, and profitability, it is anticipated that its development in the region will accelerate in the medium term.
This study was conducted in the Isthmus of Tehuantepec, where no performance studies of grid-connected PV systems have been reported to date. The objective of this research was to evaluate the grid-connected photovoltaic system located at the Universidad del Istmo (UNISTMO), Tehuantepec campus, to understand its performance under the specific environmental conditions of the site, utilizing standardized performance parameters and other performance variables. Additionally, an analysis of the energy quality produced by the system was conducted to determine whether it meets the technical interconnection and power quality requirements for Pn ≤ 500 kW power plants. The present work is particularly relevant as it advances understanding of photovoltaic performance in understudied regions with substantial solar potential, such as the Isthmus of Tehuantepec, where policy prioritizes wind resource exploitation over solar energy
2. Materials and Methods
2.1. Solar Resource Potential and Photovoltaic System
According to [61], solar radiation must be analyzed, such as daily and seasonal, to determine its fluctuations. Some authors, such as [62], used the Geographic Information System (GIS), which is the most commonly used method. In Mexico, global solar radiation has been registered between 5 kWh/m2/day to 6.5 kW/m2/day [63] in the zone of Tehuantepec Isthmus; this value is around 5.5 kWh/m2/day [64].
The photovoltaic system is located at Universidad del Istmo (UNISTMO), Tehuantepec Campus, in Santo Domingo Tehuantepec, Oaxaca, Mexico, at coordinates 16°17′19″ N; 95°14′24″ W. The system is mounted on a covered parking lot, oriented directly south, with an inclination angle of 16°. A photographic image of the photovoltaic system is presented in Figure 1.
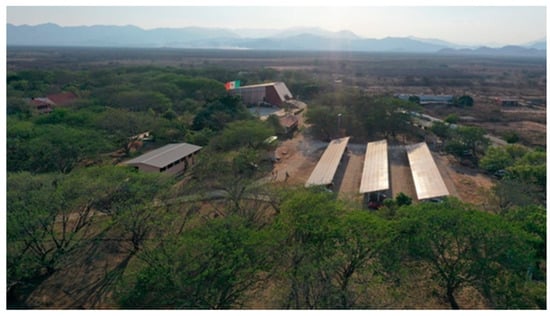
Figure 1.
Photovoltaic system at the Universidad del Istmo, Tehuantepec campus.
The system consists of 10 photovoltaic arrays. Each array is composed of 48 ECO GREEN ENERGY: EGE-340 M-72 monocrystalline silicon modules, arranged in four strings, each with 12 modules in series. The electrical characteristics of the modules and arrays are shown in Table 1. Each photovoltaic array is connected to a 15 kW Fronius Symo inverter. The ten inverters output to a distribution panel that connects to a 320 KVA 13200-220/127 V transformer; via underground transition, it connects to a bidirectional meter, which allows measuring the amount of energy received from the grid, the energy produced by the system, and the energy delivered to the electrical grid.

Table 1.
Electrical characteristics at standard test conditions (STCs) of each PV array and photovoltaic module.
Irradiance data on the horizontal plane, ambient temperature, and wind speed were collected from a Davis Vantage Pro2TM meteorological station installed at the photovoltaic system, as illustrated in Figure 2. The daily solar energy or irradiation on the surface of the photovoltaic array was estimated from the radiation on the horizontal surface, utilizing the Liu–Jordan isotropic sky model [65], which is described in section I of the Supporting Information. Electrical data from the photovoltaic system, used for performance analysis, was sourced from Fronius inverters and solar module datasheets.
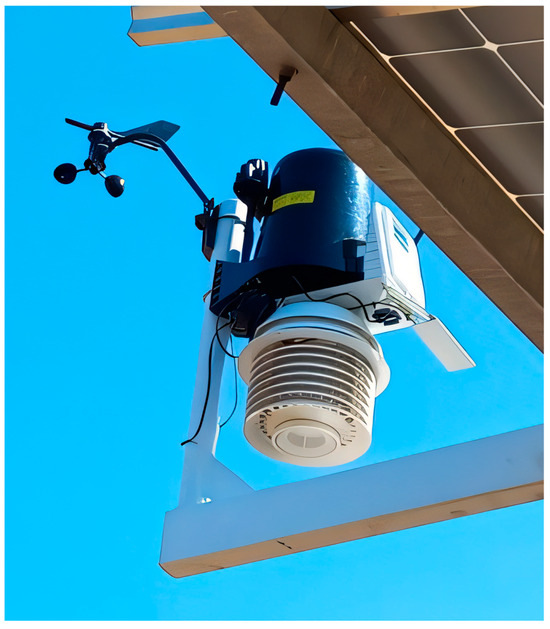
Figure 2.
The weather station is situated within the photovoltaic system.
The photovoltaic system was monitored for one year, from April 2022 to March 2023. The measurement interval for both the climatological and electrical databases was five minutes. Over this twelve-month period, ten photovoltaic arrays were studied, representing approximately 1,051,200 data points for each measured quantity. No planned cleaning of the photovoltaic system was conducted during this time; however, occasional rainfall occurred in May (3 days), June (8 days), July (3 days), August (6 days), September (10 days), October (2 days), and January (1 day).
For power quality measurements, a Fluke 438-II three-phase power quality analyzer was utilized, which is configured to measure a three-phase photovoltaic system with four wires, i.e., three phases and one neutral wire. It was connected to the distribution board where the 10 inverters are linked. Figure 3 illustrates the equipment connection in the low-voltage AC circuit of the electrical installation. Voltage and current measurements for each phase of the photovoltaic system were taken at the distribution board located immediately after the power electronic converters. The power quality analyzer Fluke 438-II complies with the IEC 61000-4-30 Class A standard, which means that it is a high-precision classification for power quality meters. It is configured to measure a three-phase photovoltaic system connected in star with four wires, i.e., three phases and one neutral wire. These measurements were conducted over a period of 53 days, from 11 March to 2 May 2023, and the data readings were averaged and stored in five-minute intervals, as stipulated by the grid code [66].
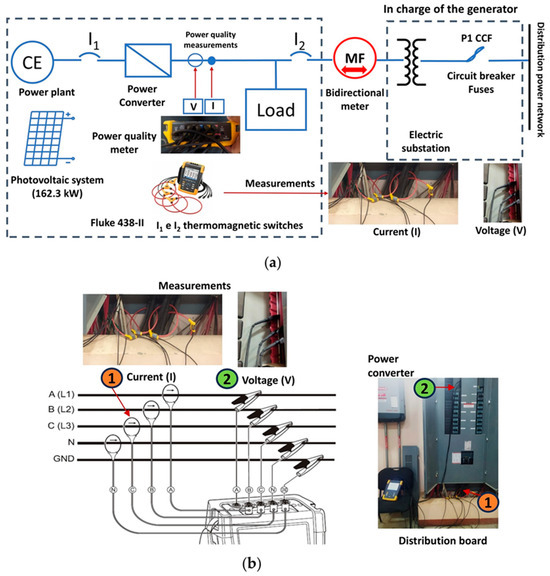
Figure 3.
Power quality measurements of the photovoltaic system. (a) Interconnection diagram and (b) Interconnection of the Fluke 438-II to a three-phase distribution board.
2.2. Determination of Normalized Yields
For system performance evaluation, normalized performance parameters were calculated using the “Häberlin methodology” [47]. The key performance parameters determined in this study were reference yield (), array yield (), final yield (), performance ratio (PR), total capture losses (), system losses (), DC energy output AC energy output (), array efficiency (), system efficiency (), and inverter efficiency ().
The YR is defined as the number of hours of irradiance, G0, needed to achieve the energy HG on the surface of the photovoltaic array during the reference period, t. It can be calculated as follows:
where HGI represents the average daily solar energy reaching the surface of the photovoltaic generator, and G0 is the irradiance under standard conditions, which is equal to 1 kW/m2.
The YA is defined as the number of hours that the generator must operate at its nominal power Po to produce direct current energy in the array:
The final yield, , is defined as the time in hours that the photovoltaic system operates at its nominal power, P0, to produce a useful output energy, , where = , representing the alternating current energy at the inverter output.
The PR represents the relationship between the actual energy generated and the energy that the ideal system would generate, without losses, under the same temperature and radiation conditions. It can also be defined as the proportion of energy that is available for export to the grid, subtracting the energy lost due to various environmental factors and the energy consumed in the operation process. It can be calculated as
The energy loss can originate from various sources and, depending on the methodology, can be classified into total capture losses () and system losses (Ls). Capture losses include temperature-related losses (), when the array temperature differs from 25 °C, and miscellaneous losses (), induced by various factors. These can include losses due to wiring, string diodes, low irradiance, shading, soiling, snow accumulation, irradiance non-uniformity, mismatch, etc. Total capture losses can be calculated using
System losses are defined as the losses incurred during the inverter’s DC-to-AC conversion.
The array’s efficiency was calculated using the following expression:
where A is the array area and is the direct current energy, expressed in kWh, determined as
where τ is the time interval in hours and is the output power of the photovoltaic array measured in kW. The system efficiency, considering each array–inverter configuration as a system, was calculated as follows:
The values of the energy were obtained directly from the electrical output data of the system. The inverter efficiency ( for a grid-connected system was calculated as the ratio of the final yield to the array yield:
The normalized yield, energy loss, efficiency, and PR values for the entire system were calculated from monthly daily averages. The monthly DC energy was the sum of the daily values, obtained using Equation (8), for each month and for each specific array.
2.3. Power Quality Analysis
Figure 3 shows the single-line diagram of the interconnection scheme for the 162.3 kW photovoltaic system with the load of UNISTMO and the electrical distribution grid. The PV system is classified as type MT1, since its nominal power is ≤250 kW and because the interconnection voltage with the electrical distribution grid is 1 kV < VLL ≤ 35 kV [67]. Net energy metering at the installation is performed using the billing meter (MF), which is located on the low-voltage side of the electrical substation. It is important to mention that the MF meter is bidirectional; furthermore, these must comply with the CFE G0000-48 specification for multifunction meters in electrical systems [68]. The thermal–magnetic circuit breakers I1 and I2, which are used for the protection and disconnection of the PV system, must be selected according to the characteristics of the type of generation installed and with NOM-001-SEDE for electrical installations. Circuit breaker I1 allows disconnecting the PV system from the low and medium-voltage electrical networks. The setting of I1, for its operation as overcurrent protection, is determined based on the maximum output power of the power plant (Pout). Circuit breaker I2 allows the protection and disconnection of the particular electrical installation. I2 is selected and calibrated according to the load characteristics and the short-circuit current level at the point of interconnection. The interconnection fuse allows manual or automatic disconnection between the installation and the distribution circuit.
Generally, power plants smaller than 0.5 MW must have the following protections: (a) overcurrent (50/51, 50 N, 51 V, 51 NT, 67/67 N), (b) overvoltage (59, 59 N), (c) voltage unbalance (60), (d) undervoltage (27, 27 N), (e) over- and under-frequency (81), (f) negative sequence (46, 47), and (g) neutral displacement protection. The electrical protection of the photovoltaic system must comply with the technical interconnection requirements described in [56] for power plants with Pn ≤ 500 kW. The ranges and operating times of the variables are as follows: frequency (f), voltage (V), and unbalance (%). It indicates that the operating ranges for these variables, for uninterrupted photovoltaic system operation, are 58.8 Hz ≤ f < 61.2 Hz for electrical frequency and 0.90 pu ≤ V < 1.10 pu for voltage.
Immediate disconnection of the photovoltaic system typically occurs in any of the following cases: (a) for frequency, when 58.2 Hz ≤ f ≤ 62.8 Hz, and (b) for voltage, when 0.90 pu ≤ V ≤ 1.10 pu.
The power quality requirements for the 162.3 kW photovoltaic system are described in Table 2 for the following variables: (a) maximum negative sequence voltage and current unbalance, (b) maximum voltage variations ΔV/V (%) for voltage ranges V ≤ 1 kV, (c) flicker, and (d) harmonic distortion. The table shows that the maximum permitted unbalance for negative sequence voltage and current are VNeg, max = 3% and Imax = 5%.

Table 2.
General requirements of power quality for power plants with Pn ≤ 500 kW [66,67].
The voltage unbalance is calculated using the following expression:
where
This is the average voltage of a polyphase system. The maximum voltage variation ΔV/V (%) for voltages V ≤ 1 kV is 3.5% for 0.0–0.0083 variations per minute.
The severity of voltage flicker is measured using the indicators Pst and Plt. The combined severity of periodic voltage amplitude variations caused by multiple installations can be determined using the following expressions:
Table 2 specifies that the maximum short-term and long-term flicker values are Pst = 0.9 and Plt = 0.70, respectively [3]. The total harmonic distortion for voltage (THDv) is calculated as
The THDv for the photovoltaic system should be below 5%, and individual odd harmonics, from h3 to h9, should be under 4.0% [66,67]. Even harmonic components, from h2 to h8, should remain below 1%.
3. Results
3.1. Analysis of Climatological Conditions
The irradiation on the surface of the photovoltaic generator for each day of the year studied is shown in Figure 4. As observed, most of the daily irradiation data for the months analyzed fall between 5 kWh/m2 and 7 kWh/m2. This indicates consistently high irradiation at the site and on the photovoltaic generator surface throughout most of the period.
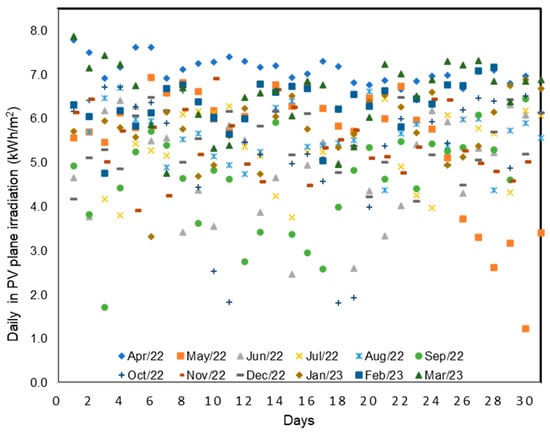
Figure 4.
Daily solar irradiation on the plane of the photovoltaic generator located in the Isthmus of Tehuantepec.
Figure 5 shows the monthly average daily radiation values on the surface of the photovoltaic generator, in kWh/m2/day, the wind speed in m/s, and the monthly average daily ambient temperature for each month of the study period, from April 2022 to March 2023. The number of rainy days at the system’s installation site is also included. As can be seen in Figure 5, the highest ambient temperature values occur in July, August, April, and May, with average temperatures around 30 °C. Regarding the radiation incident on the photovoltaic generator surface, April exhibited the highest average daily radiation (7.1 kWh/m2/day), followed by March (6.5 kWh/m2/day) and February (6.3 kWh/m2/day).
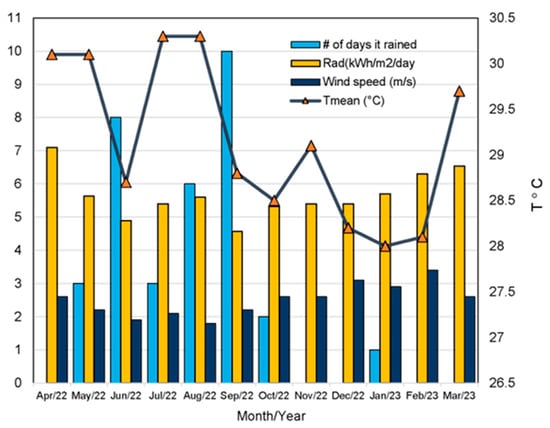
Figure 5.
Weather conditions at the site of the studied photovoltaic system.
La Ventosa, Oaxaca, is among the locations with the highest wind speeds globally. The study system site is located 60 km (approximately 47 min) from La Ventosa and thus experiences high average wind speeds throughout the year. Wind speed average values measured at the system surface ranged between 1.8 and 3.4 m/s.
In 2022, occasional rain occurred in May, June, July, August, September, and October, with September having the highest rainfall incidence. During the studied period in 2023, it rained only one day at the end of January, which was highly unusual.
This section may be divided by subheadings. It should provide a concise and precise description of the experimental results, their interpretation, as well as the experimental conclusions that can be drawn.
3.2. System Performance Analysis
In this study, each array–inverter was considered a subsystem with a nominal power of 16.32 kWp, and the performance evaluation was conducted independently for each subsystem. The normalized yield parameters (, , , , and ) were obtained, along with the energy values in direct current () and alternating current (); the efficiency of the arrays (A1–A10), the array–inverter subsystems (A-I1–A-I10), and the inverters.
The final yield (YF), total capture losses (LC), and system losses (LS) for each array–inverter (A-I) subsystem during each month of the study year are illustrated in Figure 6. YF, depicted by the blue bar, represents the amount of AC energy produced by the subsystem per kilowatt peak of installed power and delivered to the grid. LC, shown by the orange bar, reflects the energy loss resulting from the photovoltaic generator’s inability to capture energy, which may arise from various factors. LS, indicated by the gray bar, denotes the losses incurred during the conversion of direct current to alternating current by the inverter. A consistent performance pattern is observed across all subsystems (A-I1-A-I10). In all instances, the highest YF values were recorded in February, March, and April, with the peak value occurring in February. The greatest LC values were noted in April, while the lowest were in September. Overall, similar values for energy production and losses were observed in each specific month, suggesting that there were no malfunctions of any array–inverter and indicating that the losses are primarily attributable to climatic and environmental conditions.
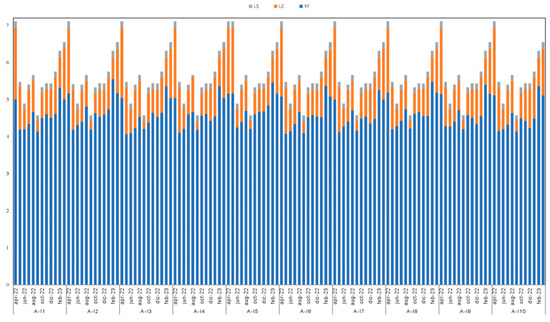
Figure 6.
Final yield (YF), capture losses (LC), and system losses (LS) of the ten photovoltaic subsystems under study during the period from April 2022 to March 2023.
For the entire system (163.2 kWp), the average values of YF, total array capture losses, and system LS are presented in Figure 7; the figure also shows the PR values obtained each month.
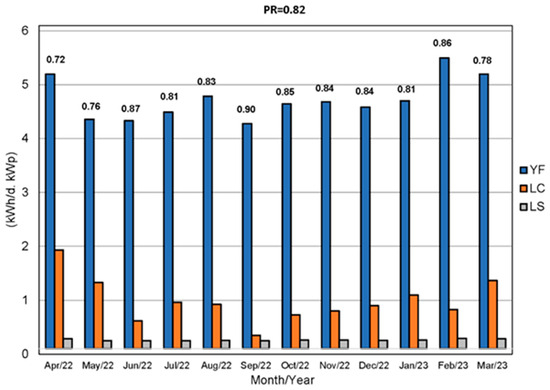
Figure 7.
Final yield (YF), performance ratio (PR), capture losses (LC), and system losses (LS) of the 163.2 kW PV system, during the period from April 2022 to March 2023.
The highest YF values, or in other words, the highest energy produced per productive unit in the daily average of the entire photovoltaic system, corresponded to February with 5.397 kWh/d. kWp, followed by March with 5.1 kWh/d. kWp and April with 5.099 kWh/d. kWp. This coincides with the highest incident radiation values and, therefore, with higher YR values. The greatest capture losses were observed in April, with 1.829 kWh/d. kWp, representing approximately 25.7% of the energy lost that month. Although module temperature readings were not taken, we can assume, given the high incident radiation and ambient temperature, that the energy losses in April are mainly due to higher module temperature and soiling. The same explanation applies to the system’s performance in May and March. As shown, these months have the lowest PR values, with April being the lowest (0.72), followed by May (0.76) and March (0.78).
The lowest capture losses occur in September, with values below 10%. As shown in Figure 7, September recorded the highest and, consequently, the lowest losses on average. Although the reference yield was lowest that month ( = 4.575 kWh/kWp), as was the energy produced by the array ( = 21,188.969 kWh) and by the system ( = 20,455.029 kWh) (see Figure 8 and Table 3), the PR values indicate that in September, the photovoltaic system made better use of the incident radiation for conversion to electrical energy, with a PR of 0.9, meaning 90% of the energy reaching the system was converted and sent to the grid. The average incident radiation, ambient temperature, and wind speeds observed in September (see Figure 5) may suggest lower photovoltaic module temperatures compared to other months. Additionally, it was the month with the most rainfall, so the modules remained clean almost all the time. A similar explanation applies to the system’s performance in June, when it achieved a PR of 0.869 and a capture loss percentage of around 10%.
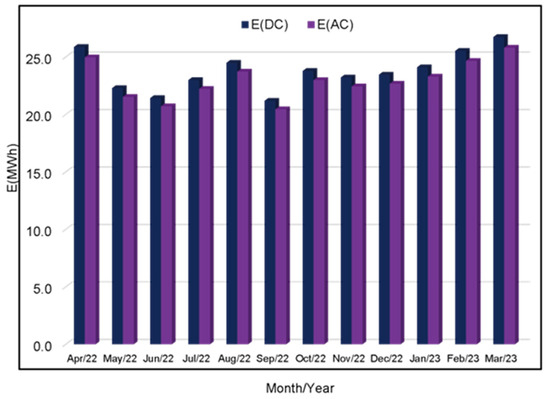
Figure 8.
Energy produced by the 163.2 kW photovoltaic system from April 2022 to March 2023.

Table 3.
Energy values in alternating current and direct current, performance ratio, and efficiencies (array, system, and inverter), calculated for the photovoltaic system studied.
In general, system losses remained low, averaging between 3.4% and 3.6% on a daily and monthly basis.
In February, a PR of 0.862 was achieved, and after April and March, it was the month with the highest energy production (Figure 8); thus, it can be considered the month with the best overall performance of the photovoltaic system among all months studied. This could be due to lower module temperatures, as the lowest average ambient temperature and highest average wind speed were observed in this month. In May, June, and September, the energy values produced by the photovoltaic system were lower compared to other months. For June and September, this can be explained by examining the average monthly solar radiation or reference yield. As shown in Table 4 and Figure 5, these months have the lowest incident radiation values, i.e., YR (4.89 for June and 4.58 for September), which led to reduced energy production. The lower energy values in May can be explained by two factors: (1) higher module temperature due to elevated ambient temperatures and radiation and (2) module soiling that reduces radiation capture, given that rains in May occurred only on the last three days of the month (25, 26, and 30), leaving the modules dirty for most of the period.

Table 4.
Data on normalized energy yields and performance ratios obtained from the photovoltaic system during the study period. The mean values, standard deviation, and coefficient of variation are presented.
Although February had the best overall performance, the system produced the most energy during the spring–summer months (March–August), with 138.946 MWh AC, compared to 136.500 MWh AC in the autumn–winter months (September–February). The annual average PR for the entire system was around 82.3%, indicating overall energy losses of approximately 17.7% during the year studied. While the highest energy production corresponded to the spring–summer months, the best performance was recorded in the autumn–winter months, with an average seasonal PR of 85%, compared to 79.5% in the spring–summer period.
The PR values of the photovoltaic system correlate with the efficiencies obtained by the array (ηA) in converting solar radiation into direct current, and by the system (ηA-I) in converting solar radiation into alternating current, as shown in Figure 9. The months with the best PR are those in which the highest efficiencies in the studied system were recorded. It can be observed that the highest system efficiencies were achieved in September (15.8%), June (15.2%), and February (15.1%). The lowest efficiencies correspond to April (12.6%), May (13.3%), and March (13.7%).
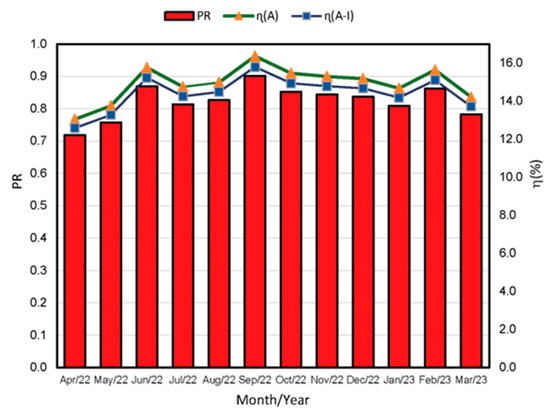
Figure 9.
Performance ratio, array (A), and system (A–I) efficiency of the 163.2 kW PV system during the period from April 2022 to March 2023.
The overall loss coefficient (PR) is a parameter that indicates how much energy is ultimately delivered to the grid; consequently, it also reflects energy losses, i.e., energy that did not reach the grid. These losses are divided into those associated with direct current energy (DC) and alternating current energy(AC). Analyzing DC energy losses in more detail, we can consider several factors that simultaneously influence them: irradiance irregularity due to cloudiness, the rise in module temperature when radiation and ambient temperature are very high, and so on. Sometimes, high wind speeds can reduce module temperature; however, moderate gusts can lead to greater dust deposition on the surface of the panels. Rain contributes to panel cleaning, although on rainy days, irradiance is usually low. Therefore, to quantitatively estimate a particular effect, a more precise study is required to minimize the effects of other variables. Nevertheless, it is possible to correlate the energy produced on a day or a month with the specific environmental conditions of that period. Figure S1 in the supplementary information presents a graph comparing PR and YR values for array five for the 31 days of October (Figure S1a) and the 30 days of November (Figure S1b). If we compare the PR values of October (two rainy days) and November (zero rainy days), for days with similar irradiance—even on a day with lower irradiance in the month when it did rain—we can appreciate the influence of panel cleaning on PR.
A statistical analysis was conducted on the normalized yield variables YR, YF, and PR to better understand the performance of the photovoltaic system under study and to assess its stability and consistency. Table 4 summarizes the monthly average daily final yield, the reference yield, and the performance ratio, along with the standard deviation and coefficient of variation for each variable by month.
Relatively low values of the standard deviation and coefficient of variation are observed in YR. The low standard deviation values in the months studied indicate stable and sunny climate conditions in the region where the photovoltaic system is located, with consistent solar radiation that is low in variability, predictable, and stable throughout most of the year. In May, June, September, and October, the standard deviation was slightly higher than 1 kWh/kWp, indicating cloudy days during those months, which aligns with the results shown in Figure 4 and Figure 5. The moderate to low values of the coefficient of variation indicate little variation in radiation from day to day, showing that the study region experiences few climatic fluctuations.
Most months, the standard deviation values of YF were relatively low, below 1 kWh/kWp, except in May, September, and October. This indicates that the final yield of the photovoltaic system is consistent in the months studied; that is, the daily YF values do not deviate significantly from their average. The low values of the coefficient of variation for YF indicate little variability in the daily final yield of the photovoltaic system relative to its average final yield. Essentially, the energy production yields during the studied months are stable and predictable, consistent with what was observed for YR.
In the case of PR, similarly low values of the standard deviation and coefficient of variation are observed. These low standard deviation values indicate little variability or fluctuation in the study variables. These results indicate that the photovoltaic system is operating in a stable and predictable way. Analyzing these values is important because it allows for comparison with results from subsequent years to detect issues, correct them, and ensure stable and efficient operation over time.
The efficiency of the inverters in each month studied is shown in Figure 10. It can be observed that this remained on average around 96.5% for almost all months of the year, except in August, when efficiency decreased to slightly below 96%.
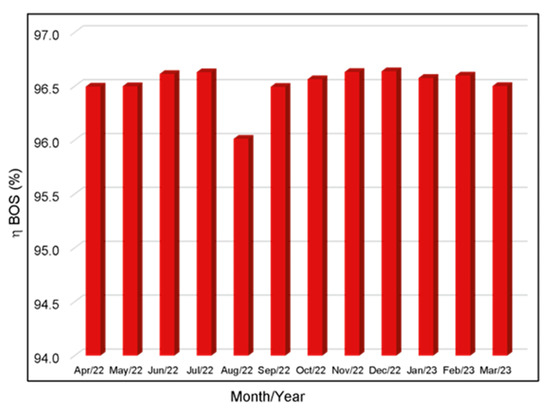
Figure 10.
Inverter efficiencies by month during the study period from April 2022 to March 2023.
As observed in Table 3, the efficiency values remained between 96.63% and 96.01, with the maximum in November and the minimum in August, a difference of 0.63%. A day-by-day study of each inverter’s efficiency was conducted for August, as shown in the upper graph of Figure 11. It was observed that Inverter 4 exhibited large variations in efficiency on almost all days in August, with the highest variations on days 2, 5, 25, and 29; and the largest system losses (Ls), as expected, also corresponded to those days, as shown in the bottom graph of Figure 11. Given that it was the only inverter that had irregular behavior, and only this month, we speculate that the malfunction of Inverter 4 was primarily due to inadequate MPPT tracking. We assume that poor MPPT tracking resulted from loose connections within the inverter, which led to power loss and, consequently, prevented the MPPT algorithm from properly calculating the MPP. The remaining inverters operated stably during the study period, maintaining a nearly constant efficiency of around 96.5%.
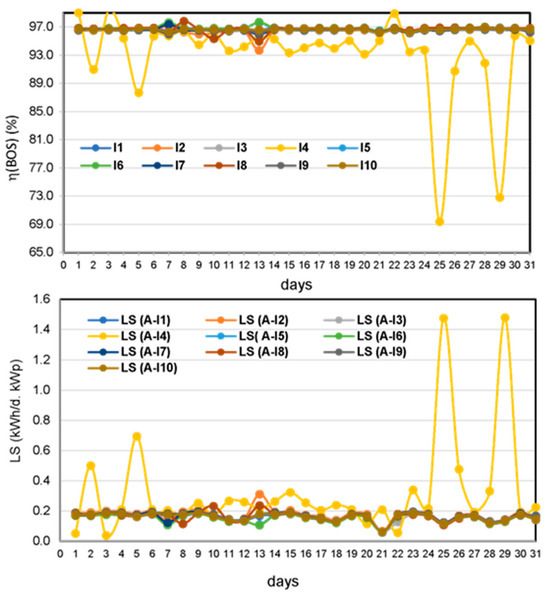
Figure 11.
Inverter efficiencies and system losses in the month of August 2022.
Beyond the solar potential and technical performance assessment, an evaluation of the land use efficiency and scalability of such photovoltaic systems is crucial for future planning in the Isthmus of Tehuantepec. The studied 163.2 kWp installation occupies a total surface area of approximately 2255.55 m2, which includes spacing for maintenance access and the mounting structure on the covered parking lot. This translates to a land use requirement of roughly 13.82 m2 per kWp installed.
The annual energy production of the system was 275.446 MWh AC (sum of E~AC~ from Table 3). Therefore, the specific energy yield per unit area is calculated to be 122.1 kWh per square meter per year (kWh/m2/year). This metric is a direct indicator of how effectively the available area is utilized for energy generation under the local climatic conditions.
To contextualize the region’s potential for larger-scale deployments, these values can be extrapolated. For instance, a hypothetical 1 MWp photovoltaic power plant, utilizing similar technology and layout, would require an estimated area of 13,820 m2 (approximately 1.38 hectares). Based on the annual specific yield observed, this 1 MWp plant could generate approximately 1687 MWh of electricity per year.
The Isthmus of Tehuantepec possesses vast areas of land with high solar irradiation, but it is also a region of ecological and social importance. The relatively low land-use requirement, coupled with the high specific energy yield demonstrated in this study, underscores the efficiency of photovoltaic technology in this location. This efficiency suggests that significant energy contributions could be achieved with a modest land footprint. For future large-scale projects, strategies such as dual land use (e.g., agrivoltaics, where agriculture and solar generation coexist) or the utilization of non-arable land could further optimize resource use and minimize environmental impact [69].
Incorporating this land-use perspective links the favorable technical performance demonstrated in this study with broader considerations of sustainability and resource availability essential for the region’s strategic energy planning.
Although this work was limited to conducting a technical evaluation of the energy performance and power quality of the PV system located in the Isthmus of Tehuantepec, we acknowledge the need for more exhaustive research that incorporates indicators relevant at the local level. Examples include the following: (i) local employment opportunities generated by photovoltaic projects, training and skills development [70,71,72]; (ii) participation and governance mechanisms, community-consent processes, benefit-sharing agreements, and transparency [70,71,72,73,74,75]; (iii) equitable access to electricity for vulnerable households (affordability, connection rates, and price stability) [70,71,73]; (iv) health, safety, and working conditions in construction and maintenance [72,73,74,75,76,77]; (v) land-use implications and considerations of cultural heritage [76,77]; and (vi) resilience to grid disruptions and climate-related stresses [73,78]. By combining the results of the technical analysis of photovoltaic performance with sociocultural indicators—such as community satisfaction, perceptions of ownership, and capacity-building outcomes—the evaluation can reveal whether technical advances translate into tangible social benefits and can support the design of evidence-based policies and projects tailored to the Isthmus’s unique social, economic, and ecological landscape.
3.3. Power Quality Analysis
The variables considered in the power quality analysis included the following: (a) electrical frequency; (b) the daily rms voltage profile; (c) the daily profiles of active (P3ϕ), reactive (Q3ϕ), and apparent (S3ϕ) power; (d) the daily profile of rms line current (IL) and peak line current (IL;peak); (e) short-term (Psti) and long-term (Plti) flickers; (f) total harmonic distortion in voltage (THDV) and current (THDI); and finally; (g) negative sequence voltage unbalance (UVNeg).
Figure 12 shows the electrical frequency throughout the measurement period. It is observed that this parameter remains within the range of 59.87 Hz ≤ f ≤ 60.08 Hz. The average frequency during the measurement period was 60.0013 Hz. It was verified that the photovoltaic system operated uninterruptedly, as required by the grid code [66].
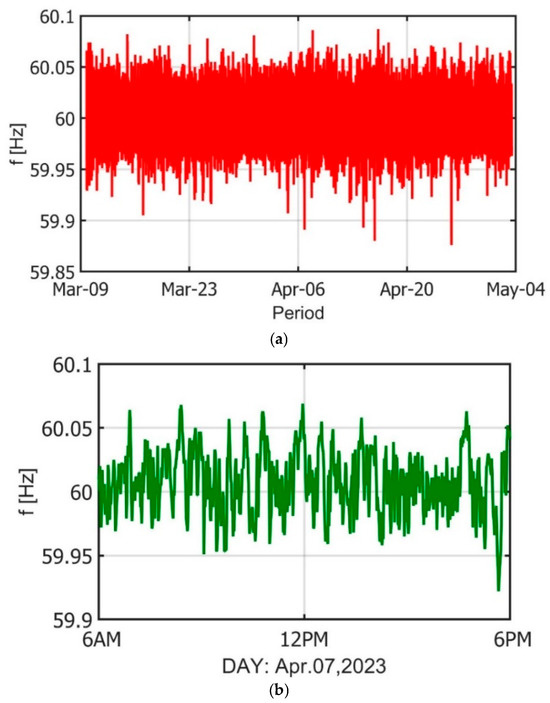
Figure 12.
Frequency for (a) the period of 9 March to 4 May 2023, as well as (b) for 7 April 2023.
The line-to-line rms voltage (VLL) and line-to-neutral rms voltage (VLN) measurements for each phase A, B, and C, over the entire power quality measurement period, are shown in Figure 13. It can be seen in Figure 13a that the average line-to-neutral rms voltage variations range from 123.77 V to 130.07 V, with VLN,A > VLN,B > VLN,C. Figure 13b shows the daily line-to-neutral rms voltage profile for 7 April 2023, where the maximum voltages were VLN,A = 135.79 V, VLN,B = 133.46 V, and VLN,A = 130.33 V. Figure 13c shows that the average line-to-line rms voltage variations range from 217.34 V to 225.63 V, with VAB > VBC > VCA. Figure 13d shows the daily line-to-line rms voltage profile for April 7, 2023, where the maximum voltages are VAB = 234.14 V, VBC = 229.29 V, and VCA = 228.08 V. In Figure 13b,d, it can be observed that the maximum rms voltages, VLN and VLL, occur between 9:00 a.m. and 12:00 p.m.
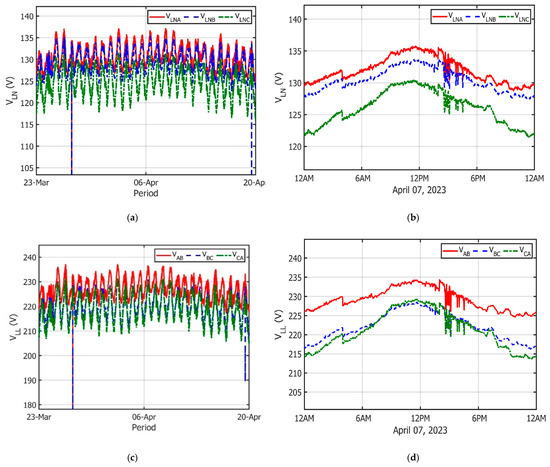
Figure 13.
RMS voltages, (a) VLN (period 23 March to 20 April 2023), (b) VLN (7 April 2023), (c) VLL (period 23 March to 20 April 2023), (d) VLL (7 April 2023).
Additionally, the rms voltage variations observed between 2:00 p.m. and 3:00 p.m. in Figure 13b,d are due to shadows caused by clouds on the photovoltaic system. In Figure 13a,c, two transient voltage dips are observed, caused by the interconnection of electrical loads to the low-voltage electrical grid. The observed voltage drops (ΔV) were greater than 10% of the nominal voltage.
Figure 14 shows the daily profiles of P3ϕ in kW, reactive power (Q3ϕ) in kVAR, apparent power (S3ϕ) in kVA, and power factor fp = cos(θ) obtained from power quality measurements on 7 April 2023. The maximum power values for this day were P3ϕ = 25.2 kW, Q3ϕ = 25.2 kW, S3ϕ = 29.2 kVA, and fp = 0.86. The energy production on 7 April 2023 started at 7:13 a.m. and ended at 5:25 p.m. The period during which the apparent power was S3 ≥ 25 kVA occurred from 11:20 a.m. to 3:10 p.m. The effect of shadows caused by clouds results in transient fluctuations in the values of active, reactive, and apparent power (P3ϕ, Q3ϕ, and S3ϕ). Furthermore, the power factor observed in the measurements is less than 90% during the operating hours of the photovoltaic system inverters. The effect of cloud shadows can cause voltage instability and introduce power quality problems to the power grid. When this occurs, the control of inverters is unable to dynamically adjust the power factor of the PV system due to the hardware limitations associated with their computing processing capacity. Thus, the voltage variations are associated with power factor variations in the PV system.
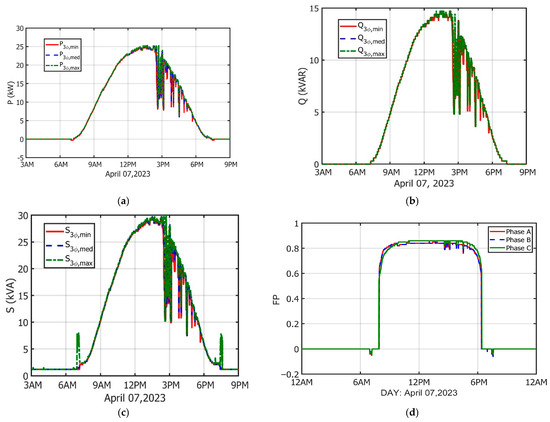
Figure 14.
Profile of power generation on 7 April 2023: (a) P3ϕ, (b) Q3ϕ, (c) S3ϕ, and (d) power factor (cos (θ)).
Figure 15 illustrates the line rms currents (IL) and line peak currents (IL,peak) recorded during the measurement period. Figure 15a,b indicates that the average line rms current is IL ≤ 100 A. Conversely, the line peak current is IL,peak ≤ 1076 A. The IL,peak values represent transient overcurrent resulting from the switching effect of the electronic power in the inverters of the photovoltaic system. The magnitude of IL,peak is at least 10 times greater than IL.
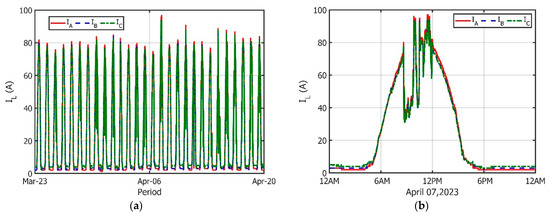
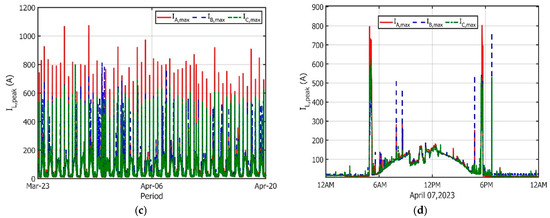
Figure 15.
Currents: (a) RMS line current (IL) for the period from 23 March to 20 April 2023, (b) IL measured on 7 April 2023, and (c) Peak line currents (IL,peak) and (d) IL.peak measured on 7 April 2023.
Short- and long-term flicker measurements, Pst and Plt, respectively, are shown in Figure 16 for the entire power quality measurement period. The flickers were calculated over 1 min intervals [66]. Figure 16a,b indicates that the short-term average flickers for the entire measurement period range between 0.125 < Pst at 1 min ≤ 0.13888. Figure 16c,d shows that the long-term average flickers for the entire measurement period range between 0.152 < Plt at 1 min ≤ 0.179. The short- and long-term flickers comply with the grid code since Psti ≤ 0.9 and Plti ≤ 0.7 [65]. However, it is important to note that Pst at 1 min > 0.9 and Plt at 1 min > 0.7 occurred at least 13 times during the entire power quality measurement period. Figure 16b,d shows that these events coincide with periods of cloud shadowing.
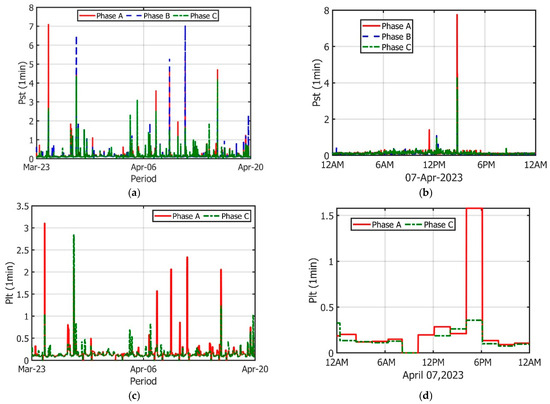
Figure 16.
Flickers, (a) Pst (1 min) for the full period, (b) Pst (1 min) measured on 7 April 2023, (c) Plt (1 min) for the full period, and (d) Plt (1 min) measured on 7 April 2023.
Figure 17 shows the total harmonic distortion measurements for voltage and current, THDV and THDI, respectively, over the entire period of power quality monitoring. Figure 17a,b indicate that the total harmonic distortion for voltage remains within the range 2.0% ≤ THDV < 4.86%, thus complying with the grid code [66]. Figure 17b shows that the maximum THDV occurs at 6:00 p.m., coinciding with the disconnection time of the lighting and air conditioning loads at UNISTMO, at the end of the workday. On the other hand, the total harmonic distortion for current, shown in Figure 17c,d, remains within the range 14.0% ≤ THDI < 327.0%. In Figure 17d, it is observed that THDI is less than 30% during the periods when the photovoltaic system produces maximum power.
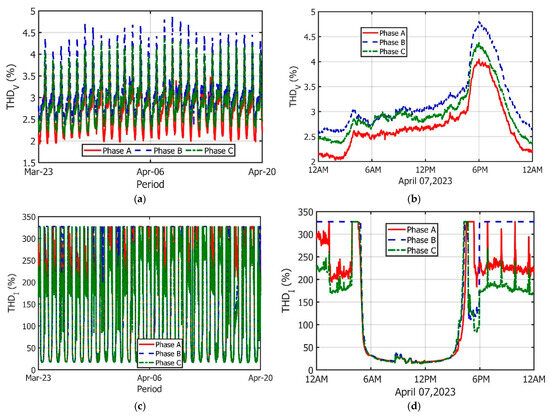
Figure 17.
Harmonics, (a) THDV for the full measurement period, (b) Pst (1 min) measured on 7 April 2023, (c) THDI for the full measurement period, and (d) THDI measured on 7 April 2023.
Figure 18 illustrates the negative sequence voltage unbalance parameter in percentage, UVNeg (%), for 7 April 2023. It is noted that this parameter adheres to the grid code since UVNeg ≤ 3% during periods when the photovoltaic system is operational [66].
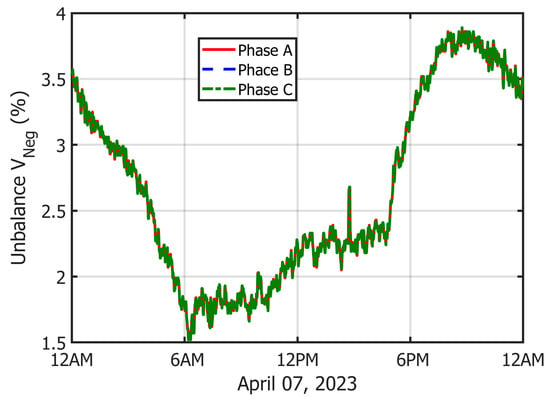
Figure 18.
Negative sequence voltage unbalanced on 7 April 2023.
The high penetration of photovoltaic energy poses significant challenges due to the intermittency of solar power. This intermittency can lead to power fluctuations, frequency deviations, and voltage variations in the grid [79], problems that are exacerbated by the lack of inherent inertia at high PV penetration levels. The integration of photovoltaic (PV) systems with battery energy storage (BES) systems emerges as an indispensable solution, as it offers rapid charging and discharging responses that help smooth power fluctuations and mitigate variations in PV production. In this way, PV + BES systems not only contribute to better utilization of photovoltaic energy but also provide crucial voltage and frequency regulation services to the grid, which are especially vital when connected to a weak grid [79]. Furthermore, the use of efficient configurations, such as a DC (direct current) bus (in conjunction with energy management systems (EMS)), facilitates greater control and efficiency by enabling regulated energy interaction with the grid. On the other hand, the integration of PV + BES systems is essential for the development of sustainable cities and the green transition toward SDG 7 [12].
4. Conclusions
The study was conducted to evaluate the performance of a photovoltaic system located at the Universidad del Istmo in the Isthmus of Tehuantepec region. It was observed that the incident solar radiation values in the region mostly ranged between 5 and 7 kWh/m2/day during the studied year. The highest ambient temperatures were recorded in the spring–summer months, and the average wind speed at the system’s surface fluctuated between 1.8 and 3.4 m/s.
Ten photovoltaic arrays were evaluated, each independently showing similar energy production and loss values each month. This indicates no failures in the operation of any array–inverter and suggests that losses are mainly due to climatological and environmental conditions.
The highest final yield (YF), averaged daily across the entire photovoltaic system, occurred in February at 5.397 kWh/d·kWp, followed by March at 5.1 kWh/d·kWp and April at 5.099 kWh/d·kWp, due to higher incident radiation. The greatest total capture losses (LC) were observed in April, at 1.829 kWh/d·kWp, representing approximately 25.7% of the energy lost that month. Although the reference yield was lowest in September, this month recorded the lowest total capture losses (below 10%) and the highest PR (90%), suggesting the photovoltaic system best utilized the incident radiation for conversion to electrical energy. The best overall performance was observed in February, with a PR of 86.2%.
During the spring–summer seasons (March–August), the system generated more energy, 138,946 MWh AC, compared to 136,500 MWh AC during the autumn–winter months (September–February). The average annual performance ratio for the entire system was approximately 82.3%, indicating overall energy losses of about 17.7% during the year studied. Although energy production was higher in the spring–summer months, the system performed better in the autumn–winter months, with an average seasonal PR of 85%, compared to 79.5% in the spring–summer period.
The performance ratio values of the photovoltaic system correlate with the efficiencies obtained by the array (ηA) in converting solar radiation into direct current, and by the system (ηA-I) in converting solar radiation into alternating current; the months with the highest PR are those in which the greatest efficiencies were observed. The highest system efficiencies and PR were recorded in September (15.8% and 90%), June (15.2% and 87%), and February (15.1% and 86.2%). The lowest efficiencies and PR correspond to April (12.6% and 72%), May (13.3% and 76%), and March (13.7% and 78%).
The results of the statistical analysis of the standard deviation and coefficient of variation in the yield reference (YR) values indicate minimal climate variability at the study site. Furthermore, the statistical analysis of the final yield (YF) and PR shows that the photovoltaic system operates stably and predictably.
Inverter efficiency (ηBOS) remained mostly stable at around 96.5% for nearly all months of the year, except in August, when it dropped to slightly below 96%. A more detailed analysis of the inverter performance in August, along with system losses that month, revealed failures in one of the inverters for most of the period, with particularly low efficiencies on August 2, 5, 25, and 29, recording values of 90.9%, 87.67%, 69.36%, and 72.79%, respectively.
Although the system did not undergo maintenance during the study year, it operated with a PR of 82.3%, which is a good indicator of the system’s performance under the region’s conditions, demonstrating the feasibility of installing photovoltaic systems in southwestern Mexico.
The photovoltaic system operated without interruptions during the period in which the power quality measurements were conducted. This was mainly because the photovoltaic system’s inverters maintained the electrical frequency and rms voltage profile within the operating ranges established by the grid code. Overall, the average electrical frequency remained stable around 60.0013 Hz, the average line-to-neutral rms voltage was approximately 127.5 V, and the average line-to-line RMS voltage was 221.01 V.
The maximum active power of the photovoltaic system during the measurement period was 33.6 kW, representing 15.5% of its rated capacity. Regarding power quality requirements, the photovoltaic system operated satisfactorily with (a) negative sequence voltage unbalance below 3%, (b) total harmonic distortion in voltage under 5%, and (c) average short- and long-term flickers, were Pst at 1 min ≤ 0.9 and Plt at 1 min ≤ 0.7, respectively. However, the power factor of the photovoltaic system showed unsatisfactory performance, with an average value of pf < 0.9; therefore, improvements are needed to achieve pf ≥ 0.9.
The problem of having an fp < 0.9 is caused mainly by the inductive load located at the Isthmus University facilities. The classical and most economical solution to improve the power factor at the university is by adding a capacitor bank near the electrical substation. The use of smart inverters can also be considered a solution to control the power factor in real time by dynamically adding reactive power to meet the grid requirements. However, the limitations of this solution are (a) the design and maintenance are complex than basic inverters; (b) the interaction among multiple power electronics converters can potentially create harmonic resonances, a problem that needs to be addressed in future smart inverter designs; (c) the intermittent power generation of a PV system can affect the capability of smart inverters to improve the power factor; (d) rapid fluctuations caused by cloud-induced transients may affect the performance of smart inverters to adjust in real-time; (e) the real-time optimization of the power factor demands a high computing power capacity and high-speed communication between multiple smart inverters and a central control system; and (f) the high switching of smart inverters components, such as IGBTs and MOSFETs, which may still in-troduce some harmonic distortion problems like super-harmonics to the power grid. Moreover, in general, the solution of smart inverters to control the power factor in real time is complex and costly.
The power quality measurements revealed frequent transient events that temporarily affected power quality parameters; for example, (a) switching of electrical loads caused voltage dips of 10% of the rated voltage and THDv values of 5% in the low-voltage network of UNISTMO; (b) shadows caused by clouds led to voltage and power variations, with Pst at 1 min > 0.9 and Plt at 1 min > 0.7; and (c) switching of power electronic devices caused peak currents exceeding 10 times the line RMS current, i.e., when IL,peak > 10 IL.
Supplementary Materials
The following supporting information can be downloaded at: https://www.mdpi.com/article/10.3390/resources14120179/s1, Figure S1: PR and irradiance behavior for different days: (S1a) in October and (S1b) in November.
Author Contributions
Conceptualization, M.V.V., R.I.C., A.A.B., J.P.E., H.J.C.M., J.R.D.P., L.H.D., Q.H.-E., D.M.-R. and A.-J.P.-M.; methodology, M.V.V., R.I.C., A.A.B., J.P.E., H.J.C.M., J.R.D.P., L.H.D., Q.H.-E., D.M.-R. and A.-J.P.-M.; investigation, M.V.V., R.I.C., A.A.B., J.P.E., H.J.C.M., J.R.D.P., L.H.D., Q.H.-E., D.M.-R. and A.-J.P.-M.; writing—original draft preparation, M.V.V., R.I.C., A.A.B., J.P.E., H.J.C.M., J.R.D.P., L.H.D., Q.H.-E., D.M.-R. and A.-J.P.-M.; writing—review and editing, M.V.V., R.I.C., A.A.B., J.P.E., H.J.C.M., J.R.D.P., L.H.D., Q.H.-E., D.M.-R. and A.-J.P.-M. All authors have read and agreed to the published version of the manuscript.
Funding
This research received no external funding.
Data Availability Statement
The original contributions presented in this study are included in the article/Supplementary Materials. Further inquiries can be directed to the corresponding authors.
Acknowledgments
The authors thank SECIHTI for the graduate scholarship awarded to a student. This research did not receive any specific grant from funding agencies in the public, commercial, or not-for-profit sectors.
Conflicts of Interest
The authors declare no conflicts of interest.
References
- Xu, X.; Hu, J.; Zhang, H.; Feng, Y.; Yang, J.; Tan, Z.; Bai, J. Photovoltaic resource assessment through roof usable area extraction based on image segmentation. Sol. Energy 2025, 297, 113646. [Google Scholar] [CrossRef]
- REN21. Renewables Global Status Report collection, Renewables in Energy Supply. 2024. Available online: https://www.ren21.net/wp-content/uploads/2019/05/GSR2024_Supply.pdf (accessed on 15 November 2025).
- Global Electricity Review 2023, EMBER. Available online: https://ember-climate.org/insights/research/global-electricity-review-2023/ (accessed on 5 July 2025).
- Hamid, A.K.; Mbungu, N.T.; Elnady, A.; Bansal, R.C.; Ismail, A.A.; AlShabi, M.A. A systematic review of grid-connected photovoltaic and photovoltaic/thermal systems: Benefits, challenges and mitigation. Energy Environ. 2022, 34, 2775–2814. [Google Scholar] [CrossRef]
- Schetinger, A.M.; de Lucena, A.F.P. Evaluating Policy Frameworks and Their Role in the Sustainable Growth of Distributed Photovoltaic Generation. Resources 2025, 14, 28. [Google Scholar] [CrossRef]
- De Lima, G.C.; Toledo, A.L.L.; Bourikas, L. The Role of National Energy Policies and Life Cycle Emissions of PV Systems in Reducing Global Net Emissions of Greenhouse Gases. Energies 2021, 14, 961. [Google Scholar] [CrossRef]
- Breyer, C.; Koskinen, O.; Blechinger, P. Profitable climate change mitigation: The case of greenhouse gas emission reduction benefits enabled by solar photovoltaic systems. Renew. Sustain. Energy Rev. 2015, 49, 610–628. [Google Scholar] [CrossRef]
- Basit, M.A.; Dilshad, S.; Badar, R.; Sami ur Rehman, S.M. Limitations, challenges, and solution approaches in grid-connected renewable energy systems. Int. J. Energy Res. 2020, 44, 4132–4162. [Google Scholar] [CrossRef]
- International Energy Agency. World Energy Outlook 2020. October 2020. Available online: https://iea.blob.core.windows.net/assets/a72d8abf-de08-4385-8711-b8a062d6124a/WEO2020.pdf (accessed on 15 November 2025).
- United Nations. Transforming Our World: The 2030 Agenda for Sustainable Development. 2015. Available online: https://docs.un.org/es/A/RES/70/1 (accessed on 15 November 2025).
- Etukudoh, E.A.; Sikhakhane Nwokediegwu, Z.Q.; Akpan Umoh, A.; Ifeanyi Ibekwe, K.; Ikenna Ilojianya, V.; Adefemi, A. Solar power integration in Urban areas: A review of design innovations and efficiency enhancements. World J. Adv. Res. Rev. 2024, 21, 1383–1394. [Google Scholar] [CrossRef]
- Biancardi, A.; Califano, F.; D’Adamo, I.; Gastaldi, M.; Kostakis, I. A distributed and sustainable model for future cities: A profitability analysis of integrated photovoltaic systems with storage under different incentive policies. Energy Policy 2025, 205, 114691. [Google Scholar] [CrossRef]
- Rehman, U.; Faria, P.; Gomes, L.; Vale, Z. Future of energy management systems in smart cities: A systematic literature review. Sustain. Cities Soc. 2023, 96, 104720. [Google Scholar] [CrossRef]
- International Energy Agency. Renewables 2021—Analysis; IEA: Paris, France, 2021. [Google Scholar]
- Woyte, A.; Richter, M.; Moser, D.; Reich, N.; Green, M.; Mau, S.; Beyer, H.G. Analytical Monitoring of Grid-Connected Photovoltaic Systems Good Practices for Monitoring and Performance Analysis; IEA: Paris, France, 2014; Task 13, Subtask 2 Report IEA-PVPS T13-03: 2014. [Google Scholar]
- Lindig, S.; Deckx, J.; Herz, M.; Vásquez, J.A.; Theristis, M.; Herteleer, B.; Anderson, K. Best Practice Guidelines for the Use of Economic and Technical KPIs; Sandia National Lab: Albuquerque, NM, USA, 2024; 2024 IEA-PVPS T13-28:2024. [Google Scholar]
- Ahmad Mohd, K.; Indradip, M.; Werner, W.; Volker, S. Performance ratio—Crucial parameter for grid connected PV plants. Renew. Sustain. Energy Rev. 2016, 65, 1139–1158. [Google Scholar] [CrossRef]
- Decker, B.; Jahn, U. Performance of 170 grid connected PV plants in northern Germany—Analysis of yields and optimization potentials. Sol. Energy 1997, 59, 127–133. [Google Scholar] [CrossRef]
- Jahn, U.; Nasse, W. Operational performance of grid-connected PV systems on buildings in Germany. Prog. Photovolt. Res. Appl. 2004, 12, 441–448. [Google Scholar] [CrossRef]
- Jahn, U.; Nasse, W.; Nordmann, T.; Clavadetscher, L.; Mayer, D. Achievements of task 2 of IEA PV power systems programme: Final results on PV system performance. In Proceedings of the 19th EUPVSEC, Paris, France, 7–11 June 2004; pp. 2813–2816. [Google Scholar]
- Iqbal, S.; Khan, S.N.; Sajid, M.; Khan, J.; Ayaz, Y.; Waqas, A. Impact and performance efficiency analysis of grid-tied solar photovoltaic system based on installation site environmental factors. Energy Environ. 2022, 34, 2343–2363. [Google Scholar] [CrossRef]
- Meflah, A.; Chekired, F.; Drir, N.; Canale, L. Accurate Method for Solar Power Generation Estimation for Different PV (Photovoltaic Panels) Technologies. Resources 2024, 13, 166. [Google Scholar] [CrossRef]
- Gonzalez, D.; Ramos Paja, C.A.; Saavedra Montes, A.J.; Arango Zuluaga, E.I.; Carrejo, C.E. Modeling and control of grid connected photovoltaic systems. Rev. Fac. Ing. Antioquia 2012, 62, 145–156. [Google Scholar]
- Roumpakias, E.; Stamatelos, T. Surface Dust and Aerosol Effects on the Performance of Grid-Connected Photovoltaic Systems. Sustainability 2020, 12, 569. [Google Scholar] [CrossRef]
- Kazem, H.A.; Chaichan, M.T.; Al-Waeli, A.H.; Sopian, K. A novel model and experimental validation of dust impact on grid-connected photovoltaic system performance in Northern Oman. Sol. Energy 2020, 206, 564–578. [Google Scholar] [CrossRef]
- Ramanan, P.; Karthick, A. Performance analysis and energy metrics of grid-connected photovoltaic systems. Energy Sustain. Dev. 2019, 52, 104–115. [Google Scholar] [CrossRef]
- Talaat, M.; Farahat, M.A.; Elkholy, M.H. Renewable power integration: Experimental and simulation study to investigate the ability of integrating wave, solar and wind energies. Energy 2019, 170, 668–682. [Google Scholar] [CrossRef]
- Waterworth, D.; Armstrong, A. Southerly winds increase the electricity generated by solar photovoltaic systems. Sol. Energy 2020, 202, 123–135. [Google Scholar] [CrossRef]
- Dhaundiyal, A.; Atsu, D. The effect of wind on the temperature distribution of photovoltaic modules. Sol. Energy 2020, 201, 259–267. [Google Scholar] [CrossRef]
- Ruan, T.; Wang, F.; Topel, M.; Laumert, B.; Wang, W. A new optimal PV installation angle model in high-latitude cold regions based on historical weather big data. Appl. Energy 2024, 359, 122690. [Google Scholar] [CrossRef]
- Guerin, T.F. Evaluating expected and comparing with observed risks on a large-scale solar photovoltaic construction project: A case for reducing the regulatory burden. Renew. Sustain. Energy Rev. 2017, 74, 333–348. [Google Scholar] [CrossRef]
- Paiano, A.; Lagioia, G.; Ingrao, C. A combined assessment of the energy, economic and environmental performance of a photovoltaic system in the Italian context. Sci. Total Environ. 2023, 866, 161329. [Google Scholar] [CrossRef]
- Hysa, B.; Mularczyk, A. PESTEL Analysis of the Photovoltaic Market in Poland—A Systematic Review of Opportunities and Threats. Resources 2024, 13, 136. [Google Scholar] [CrossRef]
- Mani, M.; Pillai, R. Impact of dust on solar photovoltaic (PV) performance: Research status, challenges and recommendations. Renew. Sustain. Energy Rev. 2010, 14, 3124–3131. [Google Scholar] [CrossRef]
- Khatib, T.; Sopian, K.; Kazem, H.A. Actual performance and characteristic of a grid connected photovoltaic power system in the tropics: A short term evaluation. Energy Convers. Manag. 2013, 71, 115–119. [Google Scholar] [CrossRef]
- Tahri, F.; Tahri, A.; Oozeki, T. Performance evaluation of grid-connected photovoltaic systems based on two photovoltaic module technologies under tropical climate conditions. Energy Convers. Manag. 2018, 165, 244–252. [Google Scholar] [CrossRef]
- Guenounou, A.; Malek, A.; Aillerie, M. Comparative performance of PV panels of different technologies over one year of exposure: Application to a coastal Mediterranean region of Algeria. Energy Convers. Manag. 2016, 114, 356–363. [Google Scholar] [CrossRef]
- Owolabi, A.B.; Yakub, A.O.; Li, H.X.; Suh, D. Performance evaluation of two grid-connected solar photovoltaic systems under temperate climatic conditions in South Korea. Energy Rep. 2022, 8, 12227–12236. [Google Scholar] [CrossRef]
- Adrada Guerra, T.; Amador Guerra, J.; Orfao Tabernero, B.; De la Cruz García, G. Comparative Energy Performance Analysis of Six Primary Photovoltaic Technologies in Madrid (Spain). Energies 2017, 10, 772. [Google Scholar] [CrossRef]
- Muñoz-Rodríguez, F.J.; Snytko, A.; De la Casa-Hernandez, J.; Rus-Casas, C.; Jiménez-Castillo, G. Rooftop photovoltaic systems. New parameters for the performance analysis from monitored data based on IEC 61724. Energy Build. 2023, 295, 113280. [Google Scholar] [CrossRef]
- Charfi, W.; Chaabane, M.; Mhiri, H.; Bournot, P. Performance evaluation of a solar photovoltaic system. Energy Rep. 2018, 4, 400–406. [Google Scholar] [CrossRef]
- Maraj Al Kërtusha, X.; Lushnjari, A. Energy performance evaluation for a floating photovoltaic system located on the reservoir of a hydro power plant under the mediterranean climate conditions during a sunny day and a cloudy-one. Energy Convers. Manag. X 2022, 16, 100275. [Google Scholar] [CrossRef]
- Joshi, A.S.; Dincer Ibrahim Reddy, B.V. Performance analysis of photovoltaic systems: A review. Renew. Sustain. Energy Rev. 2009, 13, 1884–1897. [Google Scholar] [CrossRef]
- Ahmed, M.; Abdelrahem, M.; Kennel, R. Highly efficient and robust grid connected photovoltaic system based model predictive control with kalman filtering capability. Sustainability 2020, 12, 4542. [Google Scholar] [CrossRef]
- Ouai, A.; Mokrani, L.; Machmoum, M.; Houari, A. Control and energy management of a large scale grid-connected PV system for power quality improvement. Sol. Energy 2018, 171, 893–906. [Google Scholar] [CrossRef]
- López-Bravo, C.; Mora-López, L.; Sidrach-deCardona, M.; Márquez-Ballesteros, M.J. A comprehensive analysis based on GIS-AHP to minimise the social and environmental impact of the installation of large-scale photovoltaic plants in south Spain. Renew. Energy 2024, 226, 120387. [Google Scholar] [CrossRef]
- Häberlin, H. Photovoltaics: System Design and Practice; John Wiley & Sons: Hoboken, NJ, USA, 2012. [Google Scholar]
- Haeberlin, H. System monitoring. In Photovoltaics in Cold Climates; Routledge: Oxford, UK, 2019. [Google Scholar]
- García, L.V.; García, J.V.; Rayo, C.A.; Rodriguez, G.N.; Milanés, H.F.M. Rendimiento global de sistemas fotovoltaicos conectados a la red eléctrica. Tecnol. Desarro. 2014, 12, 26. [Google Scholar]
- Livera, A.; Theristis, M.; Makrides, G.; Georghiou, G.E. Recent advances in failure diagnosis techniques based on performance data analysis for grid-connected photovoltaic systems. Renew. Energy 2019, 133, 126–143. [Google Scholar] [CrossRef]
- Weber, B.; Magaña-López, R.; Martínez Cienfuegos, I.G.; Durán-García, M.D.; Stadlbaue, E.A. Current status of photovoltaic plants in Mexico—An analysis based on online monitoring. Energy Sustain. Dev. 2020, 57, 48–56. [Google Scholar] [CrossRef]
- Santana-Rodríguez, G.; Vigil-Galan, O.; Jimenez-Olarte, D.; Contreras-Puente, G.; Monroy, B.M.; Escamilla-Esquivel, A. Evaluation of a grid-connected photovoltaic system and in-situ characterization of photovoltaic modules under the environmental conditions of Mexico City. Rev. Mex. Física 2013, 59, 88–94. [Google Scholar]
- Messina, S.; Hernández Rosales, I.P.; Saldaña Durán, C.E.; Quiñones, J.J.; Nair, P.K. Comparative study of system performance of two 2.4 kW grid-connected PV installations in Tepic-Nayarit and Temixco-Morelos in México. Energy Procedia 2014, 57, 161–167. [Google Scholar] [CrossRef]
- Rivera-Martínez, M.A.; Hernández-Galvez, G.; Sarracino-Martínez, O.; Ixtlilco-Cortés, L.; Juantorena-Ugás, A.; Batalla-Nolasco, U.I.; Becerra-García, D. Análisis de sensibilidad de sistemas fotovoltaicos conectados a la red eléctrica: Caso de estudio en Guerrero, México. Ing. Investig. Tecnol. 2017, 18, 293–305. [Google Scholar]
- Acosta-Banda, A.; Aguilar-Esteva, V.; Hechavarría Difur, L.; Campos-Mercado, E.; Cortés-Martínez, B.; Patiño-Ortiz, M. Grid-Connected Photovoltaic Systems as an Alternative for Sustainable Urbanization in Southeastern Mexico. Urban. Sci. 2025, 9, 329. [Google Scholar] [CrossRef]
- ASOLMEX. Asociación Mexicana de Energía Solar. Available online: https://asolmex.org/ (accessed on 5 July 2025).
- Elliott, D.; Schwartz, M.; Scott, G.; Haymes, S.; Heimiller, D.; George, R. Atlas de Recursos Eólicos del Estado de Oaxaca (The Spanish Version of Wind Energy Resource Atlas of Oaxaca) (No. NREL/TP-500-35575); National Renewable Energy Lab. (NREL): Golden, CO, USA, 2004. [Google Scholar]
- Global Solar Atlas. Available online: https://globalsolaratlas.info/map?c=16.241009,-95.323563,10&s=16.32463,-95.24104&m=site (accessed on 1 April 2025).
- Gobierno de México. Available online: https://www.gob.mx/se/acciones-y-programas/corredor-interoceanico-del-istmo-de-tehuantepec?state=published (accessed on 15 November 2025).
- Asociación Mexicana de Energía Eólica, AMDEE. Available online: https://amdee.org/es_es/07-proyectos/ (accessed on 5 July 2025).
- Li, P.; Lian, J.; Ma, C.; Zhang, J. Complementarity and development potential assessment of offshore wind and solar resources in China seas. Energy Convers. Manag. 2023, 296, 117705. [Google Scholar] [CrossRef]
- Choi, Y.; Suh, J.; Sung-Min, K. GIS-Based Solar Radiation Mapping, Site Evaluation, and Potential Assessment: A Review. Appl. Sci. 2019, 9, 1960. [Google Scholar] [CrossRef]
- Molina Pfennig, P.; González-Baheza, A. Evaluación de los recursos de radiación solar en los municipios de Baja California Sur, México, mediante un modelo de aptitud socioambiental. Región Soc. 2020, 32, 1–37. [Google Scholar] [CrossRef]
- Flores Meza, A. Ajuste de un concentrador solar de canal parabólico a partir de su reconstrucción geométrica. Temas Cienc. Tecnol. 2016, 20, 43–48. Available online: http://repositorio.utm.mx:8080/jspui/handle/123456789/325 (accessed on 12 September 2025).
- Duffie, J.A.; Beckman, W.A. Solar Engineering of Thermal Processes; John Wiley & Sons, Inc.: Hoboken, NJ, USA, 2013. [Google Scholar]
- Mexican Energy Regulatory Commission (CRE). General Administrative Provisions Containing the Criteria of Efficiency, Quality, Reliability, Continuity, Security and Sustainability of the National Electric System: Grid Code, as Provided in Article 12, Section XXXVII of the Electricity Industry Law. Published in the Mexico Official Gazette of the Federation on 31 December 2021. Available online: https://www.dof.gob.mx/nota_detalle.php?codigo=5639920&fecha=31/12/2021#gsc.tab=0 (accessed on 20 July 2025).
- Mexico Secretariat of Energy (SENER). Manual for the Interconnection of Power Generation Plants with a Capacity of Less than 0.5 MW. Published in the Mexico Official Gazette of the Federation on 15 December 2016. Available online: https://www.cofemersimir.gob.mx/portales/resumen/41183 (accessed on 23 October 2025).
- Federal Electricity Commission (CFE). Multifunction Meters for Electrical Systems. CFE Specification G0000-48, May 2010. Available online: https://studylib.es/doc/9331492/cfe-medidores (accessed on 15 November 2025).
- Urbazaev, M.; Thiel, C.; Cremer, F.; Dubayah, R.; Migliavacca, M.; Reichstein, M.; Schmullius, C. Estimation of forest aboveground biomass and uncertainties by integration of field measurements, airborne LiDAR, and SAR and optical satellite data in Mexico. Carbon Balance Manag. 2018, 13, 5. [Google Scholar] [CrossRef]
- Ahmed, F. Towards an equitable transition: Renewable energy effect on educational outcomes in Canadian communities. Renew. Energy 2026, 256, 124250. [Google Scholar] [CrossRef]
- Blečić, I.; Carrus, A.S.; Congiu, E.; Desogus, G.; Muroni, E.; Saiu, V. Renewable energy communities design: A decision support tool for integrated impact assessment. Insights from the first REC in Cagliari, Italy. J. Clean. Prod. 2025, 510, 145600. [Google Scholar] [CrossRef]
- Rumbayan, M.; Kindangen, J.; Sambul, A.; Sompie, S.; Cross, J. Solar energy implementation in rural communities and its contributions to SDGs: A systematic literature review. Unconv. Resour. 2025, 6, 100180. [Google Scholar] [CrossRef]
- Xu, K.; Nabirye, S.; Sandler, S. Community Solar Policy Landscape and Pathways to Meaningful Benefits: A Review of Equitable Access and Household Savings; (Technical Report NREL/TP-6A20-90868); National Renewable Energy Laboratory: Golden, CO, USA, 2024. Available online: https://www.nrel.gov/docs/fy24osti/90868.pdf (accessed on 5 November 2025).
- Iqbal, A.; Haider, R.; Yasar, A.; Nizami, A.-S. A governance model for sustainable municipal solid waste management: Aligning the sector with Pakistan’s economic goals. Waste Manag. Bull. 2025, 3, 107–127. [Google Scholar] [CrossRef]
- Omole, F.O.; Olajiga, O.K.; Olatunde, T.M. Challenges and successes in rural electrification: A review of global policies and case studies. Eng. Sci. Technol. J. 2024, 5, 1031–1046. Available online: https://www.researchgate.net/publication/379256039_CHALLENGES_AND_SUCCESSES_IN_RURAL_ELECTRIFICATION_A_REVIEW_OF_GLOBAL_POLICIES_AND_CASE_STUDIES (accessed on 10 November 2025). [CrossRef]
- Lucchi, E. Integration between photovoltaic systems and cultural heritage: A socio-technical comparison of international policies, design criteria, applications, and innovation developments. Energy Policy 2022, 171, 113303. [Google Scholar] [CrossRef]
- Lucchi, E.; Adami, J.; Stawinoga, A.E. Social acceptance of photovoltaic systems in heritage buildings and landscapes: Exploring barriers, benefits, drivers, and challenges for technical stakeholders in northern Italy. Sustain. Energy Technol. Assess. 2023, 60, 103544. [Google Scholar] [CrossRef]
- Suri, D.; Shekhar, J.; Mukherjee, A.; Bajaj, A.S. Designing Microgrids for Rural Communities: A Practitioner Focused Mini-Review. In Proceedings of the 2020 IEEE International Conference on Environment and Electrical Engineering and 2020 Industrial and Commercial Power Systems Europe (EEEIC/ICPSEurope), Madrid, Spain, 9–12 June 2020. [Google Scholar] [CrossRef]
- Shivashankar, S.; Mekhilef, S.; Mokhlis, H.; Karimi, M. Mitigating methods of power fluctuation of photovoltaic (PV) sources—A review. Renew. Sustain. Energy Rev. 2024, 59, 1170–1184. [Google Scholar] [CrossRef]
Disclaimer/Publisher’s Note: The statements, opinions and data contained in all publications are solely those of the individual author(s) and contributor(s) and not of MDPI and/or the editor(s). MDPI and/or the editor(s) disclaim responsibility for any injury to people or property resulting from any ideas, methods, instructions or products referred to in the content. |
© 2025 by the authors. Licensee MDPI, Basel, Switzerland. This article is an open access article distributed under the terms and conditions of the Creative Commons Attribution (CC BY) license (https://creativecommons.org/licenses/by/4.0/).